Article

The Influence of Viewing Geometry on Hyperspectral-Based Soil Property Retrieval

1
State Key Laboratory of Soil and Sustainable Agriculture, Institute of Soil Science, Chinese Academy of Sciences, Nanjing 210008, China
2
School of Geography, Geomatics & Planning, Jiangsu Normal University, Xuzhou 221116, China
3
University of Chinese Academy of Sciences, Beijing 100049, China
*
Author to whom correspondence should be addressed.
Remote Sens. 2025, 17(14), 2510; https://doi.org/10.3390/rs17142510
Submission received: 24 May 2025 / Revised: 10 July 2025 / Accepted: 17 July 2025 / Published: 18 July 2025
(This article belongs to the Section Remote Sensing in Agriculture and Vegetation)

Abstract

Hyperspectral technology has been widely applied to the retrieval of soil properties, such as soil organic matter (SOM) and particle size distribution (PSD). However, most previous studies have focused on hyperspectral data acquired from the nadir direction, and the influence of viewing geometry on hyperspectral-based soil property retrieval remains unclear. In this study, bidirectional reflectance factors (BRFs) were collected at 48 different viewing angles for 154 soil samples with varying SOM contents and PSDs. SOM and PSD were then retrieved using combinations of ten spectral preprocessing methods (raw reflectance, Savitzky–Golay filter (SG), first derivative (D1), second derivative (D2), standard normal variate (SNV), multiplicative scatter correction (MSC), SG + D1, SG + D2, SG + SNV, and SG + MSC), one sensitive wavelength selection method, and three retrieval algorithms (partial least squares regression (PLSR), support vector machine (SVM), and convolutional neural networks (CNNs)). The influence of viewing geometry on the selection of spectral preprocessing methods, retrieval algorithms, sensitive wavelengths, and retrieval accuracy was systematically analyzed. The results showed that soil BRFs are influenced by both soil properties and viewing angles. The viewing geometry had limited effects on the choice of preprocessing method and retrieval algorithm. Among the preprocessing methods, D1, SG + D1, and SG + D2 outperformed the others, while PLSR achieved a higher accuracy than SVM and CNN when retrieving soil properties. The selected sensitive wavelengths for both SOM and PSD varied slightly with viewing angle and were mainly located in the near-infrared region when using BRFs from multiple viewing angles. Compared with single-angle data, multi-angle BRFs significantly improved retrieval performance, with the R2 increasing by 11% and 15%, and RMSE decreasing by 16% and 30% for SOM and PSD, respectively. The optimal viewing zenith angle ranged from 10° to 20° for SOM and around 40° for PSD. Additionally, backward viewing directions were more favorable than forward directions, with the optimal viewing azimuth angles being 0° for SOM and 90° for PSD. These findings provide useful insights for improving the accuracy of soil property retrieval using multi-angle hyperspectral observations.

1. Introduction

Soil organic matter (SOM) and particle size distribution (PSD) are fundamental indicators of soil’s chemical and physical properties, respectively, and play essential roles in cultivated land assessment and management [1,2]. SOM content reflects soil carbon storage and fertility [3]. PSD describes the cumulative distribution of soil mineral particles with diameters less than 2 mm and is closely linked to soil texture, reflecting the proportions of clay, silt, and sand [4]. PSD significantly influences soil structure [5], soil water retention [6], and the availability of water and nutrients for plant growth [7]. Therefore, the accurate quantification and spatial mapping of SOM content and PSD are critical for agricultural applications and soil management.
Traditionally, SOM and PSD are measured through field sampling and laboratory analysis. SOM content is commonly determined using methods such as mass loss on ignition [8], colorimetric procedure [9], and Walkley–Black [8]. PSD is measured using techniques like the sieve–pipette method [10], X-ray transmission [11] electron microscopy [12], and the laser diffraction method [13]. Among these, laser diffraction has emerged as a fast, reliable, and automated approach that provides highly resolved PSD data [14]. Although measured PSD consists of discrete particle size classes, various mathematical models have been developed to fit the PSD curves, such as the one-parameter Jaky model [15], the two-parameter Rosin–Rammler model [16], and the three-parameter Fredlund unimodal model [17]. Despite the high accuracy of laboratory-based methods, they are time-consuming and labor-intensive, limiting their large-scale applicability.
To overcome these limitations, hyperspectral remote sensing has been increasingly applied to the retrieval of soil properties. The retrieval of soil properties using hyperspectral data is typically achieved through statistical methodologies [18,19]. The workflow generally includes spectral preprocessing for noise reduction and enhancement using techniques such as the Savitzky–Golay (SG) smoothing filter [20] and first-order derivative (D1) transformation [21]. Subsequently, sensitive wavelengths are selected using algorithms like competitive adaptive reweighted sampling (CARS) [22]. Finally, regression models such as partial least squares regression (PLSR) [23], support vector regression (SVR) [24], and deep learning models [20] are used for soil property retrieval. However, most studies rely on hyperspectral data acquired at a nadir viewing geometry.
In reality, the spectral signal of non-Lambertian surfaces such as soil and vegetation is significantly influenced by viewing geometry. The bidirectional reflectance distribution function (BRDF) is commonly used to describe the anisotropic nature of surface reflectance [25,26]. Consequently, multi-view hyperspectral remote sensing has been developed across various platforms, including laboratory/field setups, airborne sensors, and orbital instruments [27]. For instance, laboratory and field measurements typically use viewing angles ranging from −60° to 60° [24,28,29]. Some airborne hyperspectral systems can acquire data at larger viewing angles, up to ±70° [27]. At the orbital level, instruments such as the Multi-Angle Imaging Spectro Radiometer (MISR) can also capture reflectance data across viewing angles from −70° to 70° [30,31,32]. Multi-view hyperspectral observations are widely applied in vegetation remote sensing [29,33]. In recent years, several studies have also demonstrated the utility of multi-view hyperspectral data for retrieving soil structural parameters, including surface roughness and sediment filling factor [28,34]. Notably, recent research by Sun [35] has shown that incorporating multi-angle reflectance information can enhance the accuracy of SOM retrieval. Despite these advancements, the influence of viewing geometry on the retrieval of various soil properties remains inadequately understood and warrants further investigation.
The main objective of this study is to investigate the effects of viewing geometry on the hyperspectral retrieval of SOM and PSD. Specifically, we use reflectance data from 48 different viewing angles and test ten commonly used spectral preprocessing methods and three retrieval algorithms to retrieve SOM and PSD. We analyze how viewing geometry influences the selection of preprocessing methods and retrieval algorithms. Additionally, we examine the variation in sensitive wavelength selection across different viewing angles for SOM and PSD. Finally, we evaluate the retrieval accuracy under different viewing geometries. This study provides important insights for improving soil property retrieval using multi-angle hyperspectral observations.

2. Materials and Methods

2.1. Soil Sampling Sites

To ensure a wide range of SOM contents and PSDs, soil samples were collected from cultivated lands in Lishu County, located in northeastern China (43°15′–43°43′N, 123°45′–124°53′E) (Figure 1). The region encompasses a variety of soil types according to the World Reference Base (WRB) [36], including Humic Cambisols, Haplic Luvisols, Anthrosols, Gleysols, Albicc Luvisols, Mollic Gleysols, Haplic Arenosols, Phaeozems, and Chernozems. The topography is generally higher in the south and lower in the north, with cultivated land primarily distributed across rolling hills. The dominant crops in this region are maize and soybean, typically grown from April to September.
Given the influence of soil type and terrain on soil properties [37], a total of 154 sampling sites were established across different soil types and slope positions, including hilltops, upper slopes, middle slopes, lower slopes, and footslopes (Table 1). At each site, soil was sampled using the five-point sampling method within a 20 m × 20 m plot. Approximately 1 kg of topsoil (0–10 cm depth) was collected from each point and subsequently mixed to form a composite sample. Non-soil materials such as plant litter and stones were manually removed prior to transportation to the laboratory for further analysis.

2.2. Datasets

2.2.1. Soil Properties

All soil samples were air-dried prior to analysis. The dried samples were gently crushed using a soil tamper and sieved through a 2 mm mesh. Approximately 100 g of each sample was obtained using the quartering method for PSD measurement. PSD was determined using a laser diffraction particle size analyzer (Mastersizer 3000, Spectris, London, UK) [14]. To reduce the effects of sample heterogeneity and instrument variability, three subsamples were randomly selected from each composite sample, and each subsample was measured twice. A total of six PSD measurements were thus obtained for each sample. The average of these six measurements was calculated and used as the final PSD result for the corresponding sampling site. For SOM content analysis, approximately 50 g of soil samples was collected using the quartering method and grinded to a particle size lower than 0.25 mm. SOM content was then determined using the sulfuric acid–potassium dichromate oxidation method [38].

2.2.2. Soil BRF Measurements

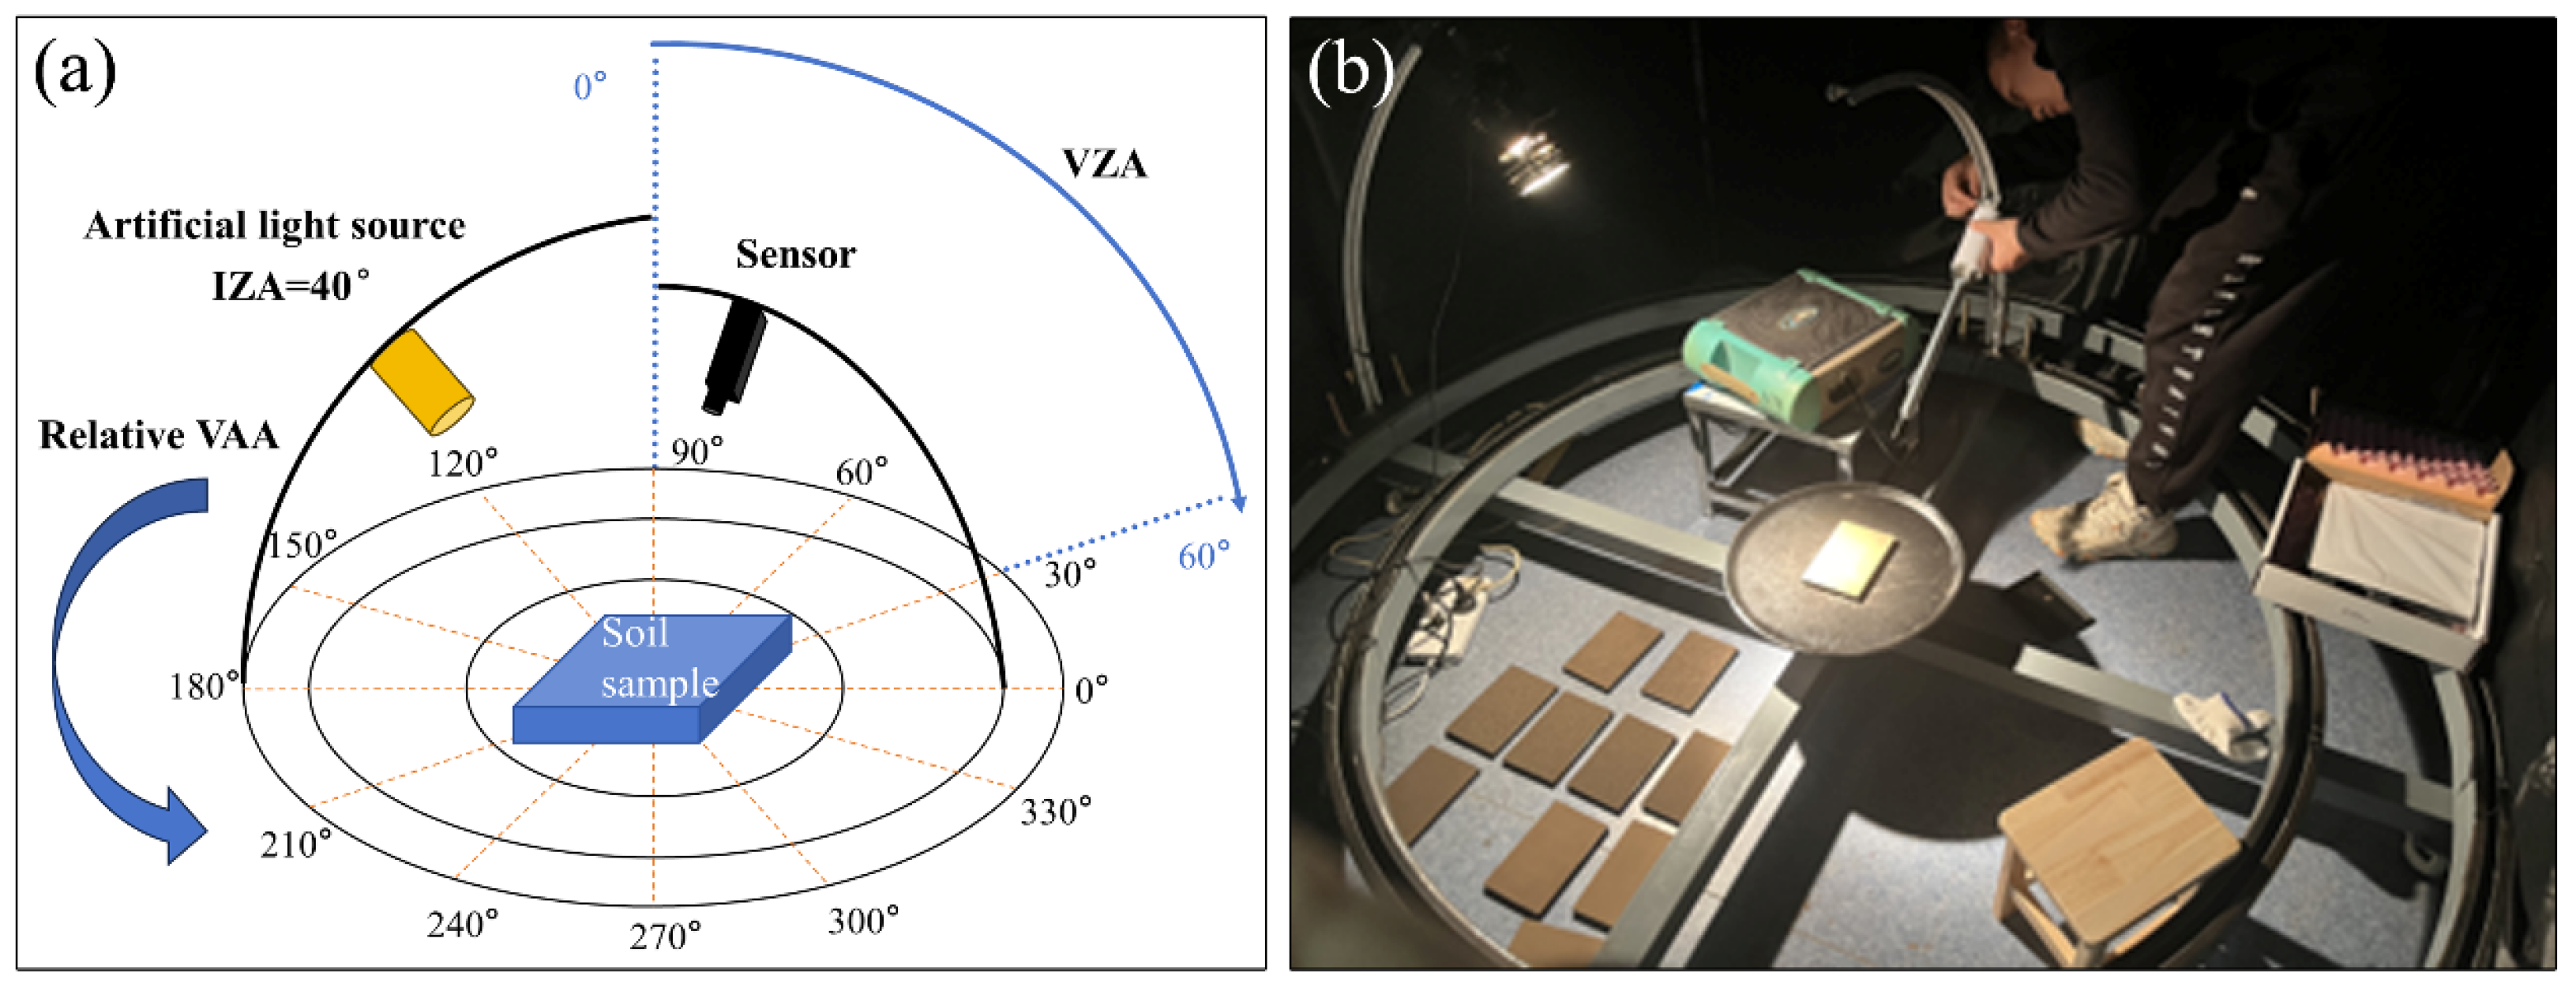
The remaining 2 mm sieved samples were used to measure soil bidirectional reflectance factors (BRFs) using a custom-built multi-angle observation system (MAOS) (Figure 2). The MAOS comprised three main components: an artificial light source (50 W, USHIO Halogen Lamp, USHIO Inc., Tokyo, Japan), a spectral sensor (FieldSpec 3, ASD Inc., Boulder, CO, USA), and a frame allowing the adjustment of view zenith and azimuth angles. The frame includes two concentric tracks (70 cm and 100 cm in diameter) and two semicircular arcs (Figure 2a). Each soil sample was placed in a black rectangular container (15 cm × 10 cm × 1.5 cm) at the center of the frame and gently flattened to maintain its natural structure without compaction.
During measurements, the light source and fiber optic sensor were positioned 50 cm and 30 cm away from the soil surface, respectively. The sensor field of view was set to 8°. The illumination zenith angle (IZA) was fixed at 40°, representing a typical solar elevation during the bare soil season in Northeast China. When the IZA is fixed, soil BRFs are primarily influenced by the view zenith angle (VZA) and the relative view azimuth angle (VAA) [39]. The relative VAA is defined as the azimuthal difference between the viewing and illumination directions and ranges from 0° to 180°. In this study, the VZA was varied from 0° to 60° at 10° intervals. However, due to the structural limitations of the measurement setup, a 5° VZA was used instead of 0°. The relative VAA was initially designed to range from 0° to 180° at 30° intervals. To reduce the need for the frequent repositioning of the optical fiber, the VAA was fixed at 0°, and the illumination azimuth angle (IAA) was adjusted instead. Specifically, the IAA was set to 0°, 330°, 300°, 90°, 120°, 150°, and 180° to simulate different relative azimuth conditions. When the IAA is 0°, the light source is positioned on the same orbit as the fiber to avoid light occlusion. A total of 48 BRFs were collected per sample (Table 2).
The ASD spectroradiometer covers a spectral range of 350–2500 nm, with a sampling interval of 1.4 nm (350–1000 nm) and 2 nm (1000–2500 nm). Because direct measurement of the BRDF is complex [40], digital number (DN) values were recorded for both the soil sample and a white reference panel (Spectralon diffuse reflectance standard) under the same illumination/viewing geometry. Specifically, at each illumination/viewing geometry, a white reference panel was first placed at the center of the measurement frame and used to calibrate the spectroradiometer. The digital number (DN) value of the white reference panel at each wavelength was then recorded as dreference(λ, θi, θv, φi, φv). Subsequently, each soil sample, placed in a black rectangular container, was positioned at the center of the frame, and its DN value at each wavelength was recorded as dsoil(λ, θi, θv, φi, φv). The soil BRF under the corresponding illumination/viewing geometry was then calculated as follows [35]:
B R F ( λ , θ i ,   θ v ,   φ i ,   φ v ) = d s o i l ( λ , θ i ,   θ v ,   φ i ,   φ v ) d r e f e r e n c e ( λ , θ i ,   θ v ,   φ i ,   φ v ) × ρ λ
where θi, θv, φi, φv, and λ represent IZA, VZA, IAA, VAA, and wavelength, respectively. ρλ is the wavelength-dependent reflectance calibration coefficient provided by the manufacturer of the Spectralon reference panel.
To minimize observational uncertainties, the mean of five consecutive spectral measurements was used to represent the reflectance for each detection angle. Edge spectral regions (350–399 nm and 2401–2500 nm), which were significantly influenced by noise, were excluded. The remaining spectral range (400–2400 nm) was retained as the original reflectance data for further analysis.

2.3. Method

2.3.1. Particle Size Distribution Modeling

The measured PSD data consisted of mass percentages for 100 discrete particle size classes (<2 mm). To quantify the PSD characteristics for each soil sample, the cumulative PSD curve for each soil sample was modeled using the one-parameter Jaky model [15], a log-exponential function described as follows:
P ( d ) = exp [ 1 a 2 ( ln ( d d max ) ) 2 ]
where d is the particle diameter, dmax is the maximum dimeter, and parameter a is a fitting parameter that characterizes the PSD shape. The parameter a was optimized by minimizing the root mean square error (RMSE) between modeled and measured cumulative PSD values for each soil sample. The goodness-of-fit was evaluated using RMSE and the coefficient of determination (R2).

2.3.2. Hyperspectral Retrieval of Soil Properties

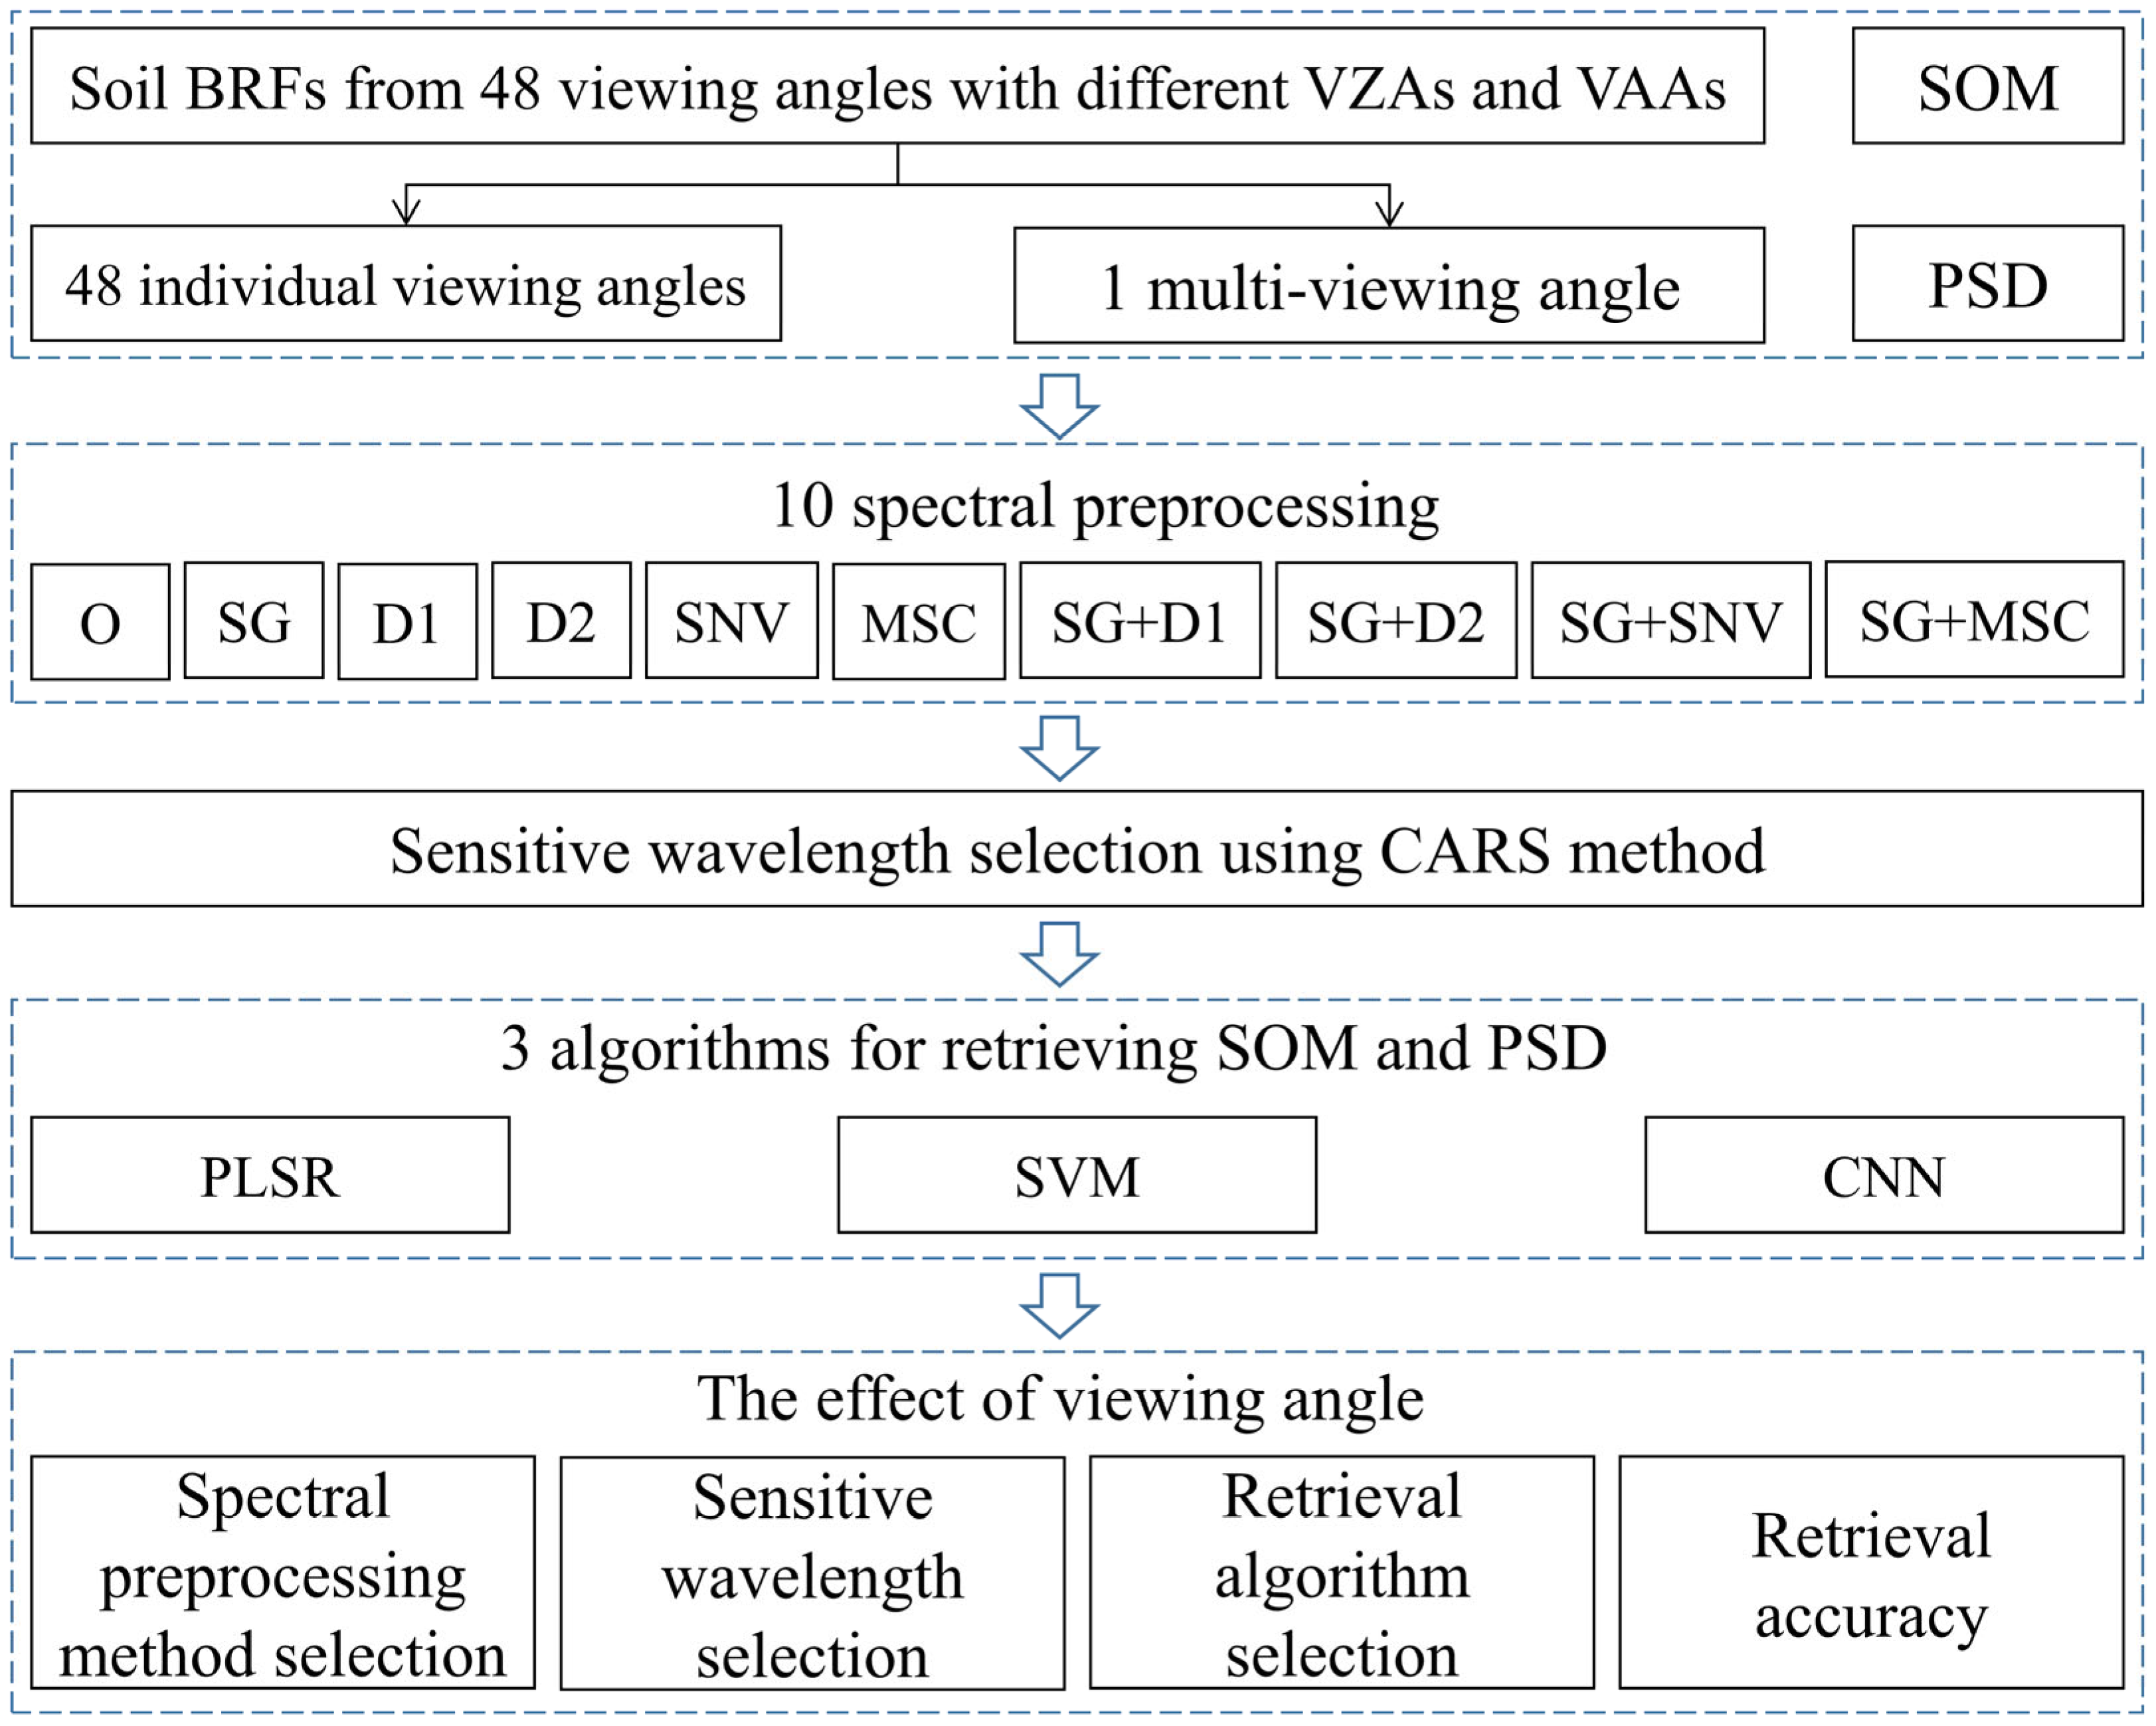
The hyperspectral retrieval of SOM and PSD involved three main steps: spectral preprocessing, sensitive wavelength selection, and retrieval model establishment (Figure 3).
Ten spectral preprocessing methods were evaluated: ① raw spectral without preprocessing (R); ② Savitzky–Golay (SG) smoothing [41]; ③ first derivation (D1) [21]; ④ second derivative (D2) [42]; ⑤ standard normal variable (SNV) [43]; ⑥ multiplicative scatter correction (MSC) [44]; ⑦ SG + D1; ⑧ SG + D2; ⑨ SG + SNV; ⑩ SG + MSC.
Sensitive wavelength bands were selected using the CARS algorithm [22]. During the process of sensitive band selection, sample sampling and PLSR modeling are used to iteratively retain bands with stronger adaptability and eliminate those with weaker adaptability. Specifically, CARS first employs Monte Carlo sampling and selects bands with larger absolute regression coefficients while discarding bands with smaller coefficients. For each generated subset of variables, the root mean square error of cross-validation (RMSECV) is calculated. The subset with the minimum RMSECV is selected as the optimal set of sensitive bands.
Three modeling algorithms were employed to establish models for retrieving SOM and PSD, including PLSR, SVM, and convolutional neural networks (CNNs). PLSR is one of the most widely used methods for quantitative soil analysis, owing to its ease of derivation, fast computational speed, and insensitivity to multicollinearity. SVM map data from a low-dimensional space to a high-dimensional space and perform a linear regression in this high-dimensional space, thereby achieving nonlinear regression in the original space. CNNs composed of an input layer, convolutional layers, activation layers, pooling layers, and fully connected layers possess powerful feature extraction capabilities and strong generalization performance. For each of the three modeling algorithms, key hyperparameters were selected for tuning to optimize model performance. Specifically, the number of latent variables was tuned for partial least squares regression (PLSR), the penalty coefficient and kernel function parameter for support vector machines (SVMs), and the learning rate and kernel size for convolutional neural networks (CNNs). The predefined ranges of these hyperparameters are listed in Table 3. A grid search strategy was employed to systematically explore all possible combinations within the defined parameter spaces [45]. Model performance was evaluated using the coefficient of determination (R2) on the validation set, which served as the criterion for selecting the optimal hyperparameter combination.
Ten spectral preprocessing methods and three retrieval algorithms were combined to evaluate the best route to retrieve the SOM and PSD distributions by using an accuracy indicator. All models were evaluated using a ten-fold cross-validation. The training dataset was partitioned into ten subsets, with a single subset retained as validation data while the remaining nine subsets were used for training. The cross-validation process was repeated ten times, with each subset used once as the validation set. Model performance was comprehensively evaluated using the R2, RMSE, the ratio of performance to deviation (RPD), and relative prediction information quality (RPIQ) as the assessment metrics. The indicators were then averaged to obtain a final estimation.

2.3.3. Viewing Angle Effect Analysis

To investigate the influence of viewing geometry on spectral preprocessing method selection, sensitive wavelength selection, retrieval algorithm selection, and retrieval accuracy, retrieval models were established for each of the 48 individual viewing angles and for a combined multi-angle scenario. For each viewing angle, all 30 combinations of spectral preprocessing methods and retrieval algorithms were tested. The effect of viewing angle on spectral preprocessing method selection and retrieval algorithm selection was assessed based on variations in retrieval accuracy. Sensitive wavelengths were identified from the soil BRFs generated by the optimal preprocessing method, and the influence of viewing angle on wavelength selection was analyzed by comparing the selected bands across different angles. Finally, retrieval accuracy was recalculated using the best spectral preprocessing method and retrieval algorithm under different viewing angles. The effect of viewing angle on retrieval accuracy for SOM and PSD distribution was evaluated by analyzing the variation in accuracy with different VZAs and VAAs.

3. Results

3.1. Soil Properties and BRFs

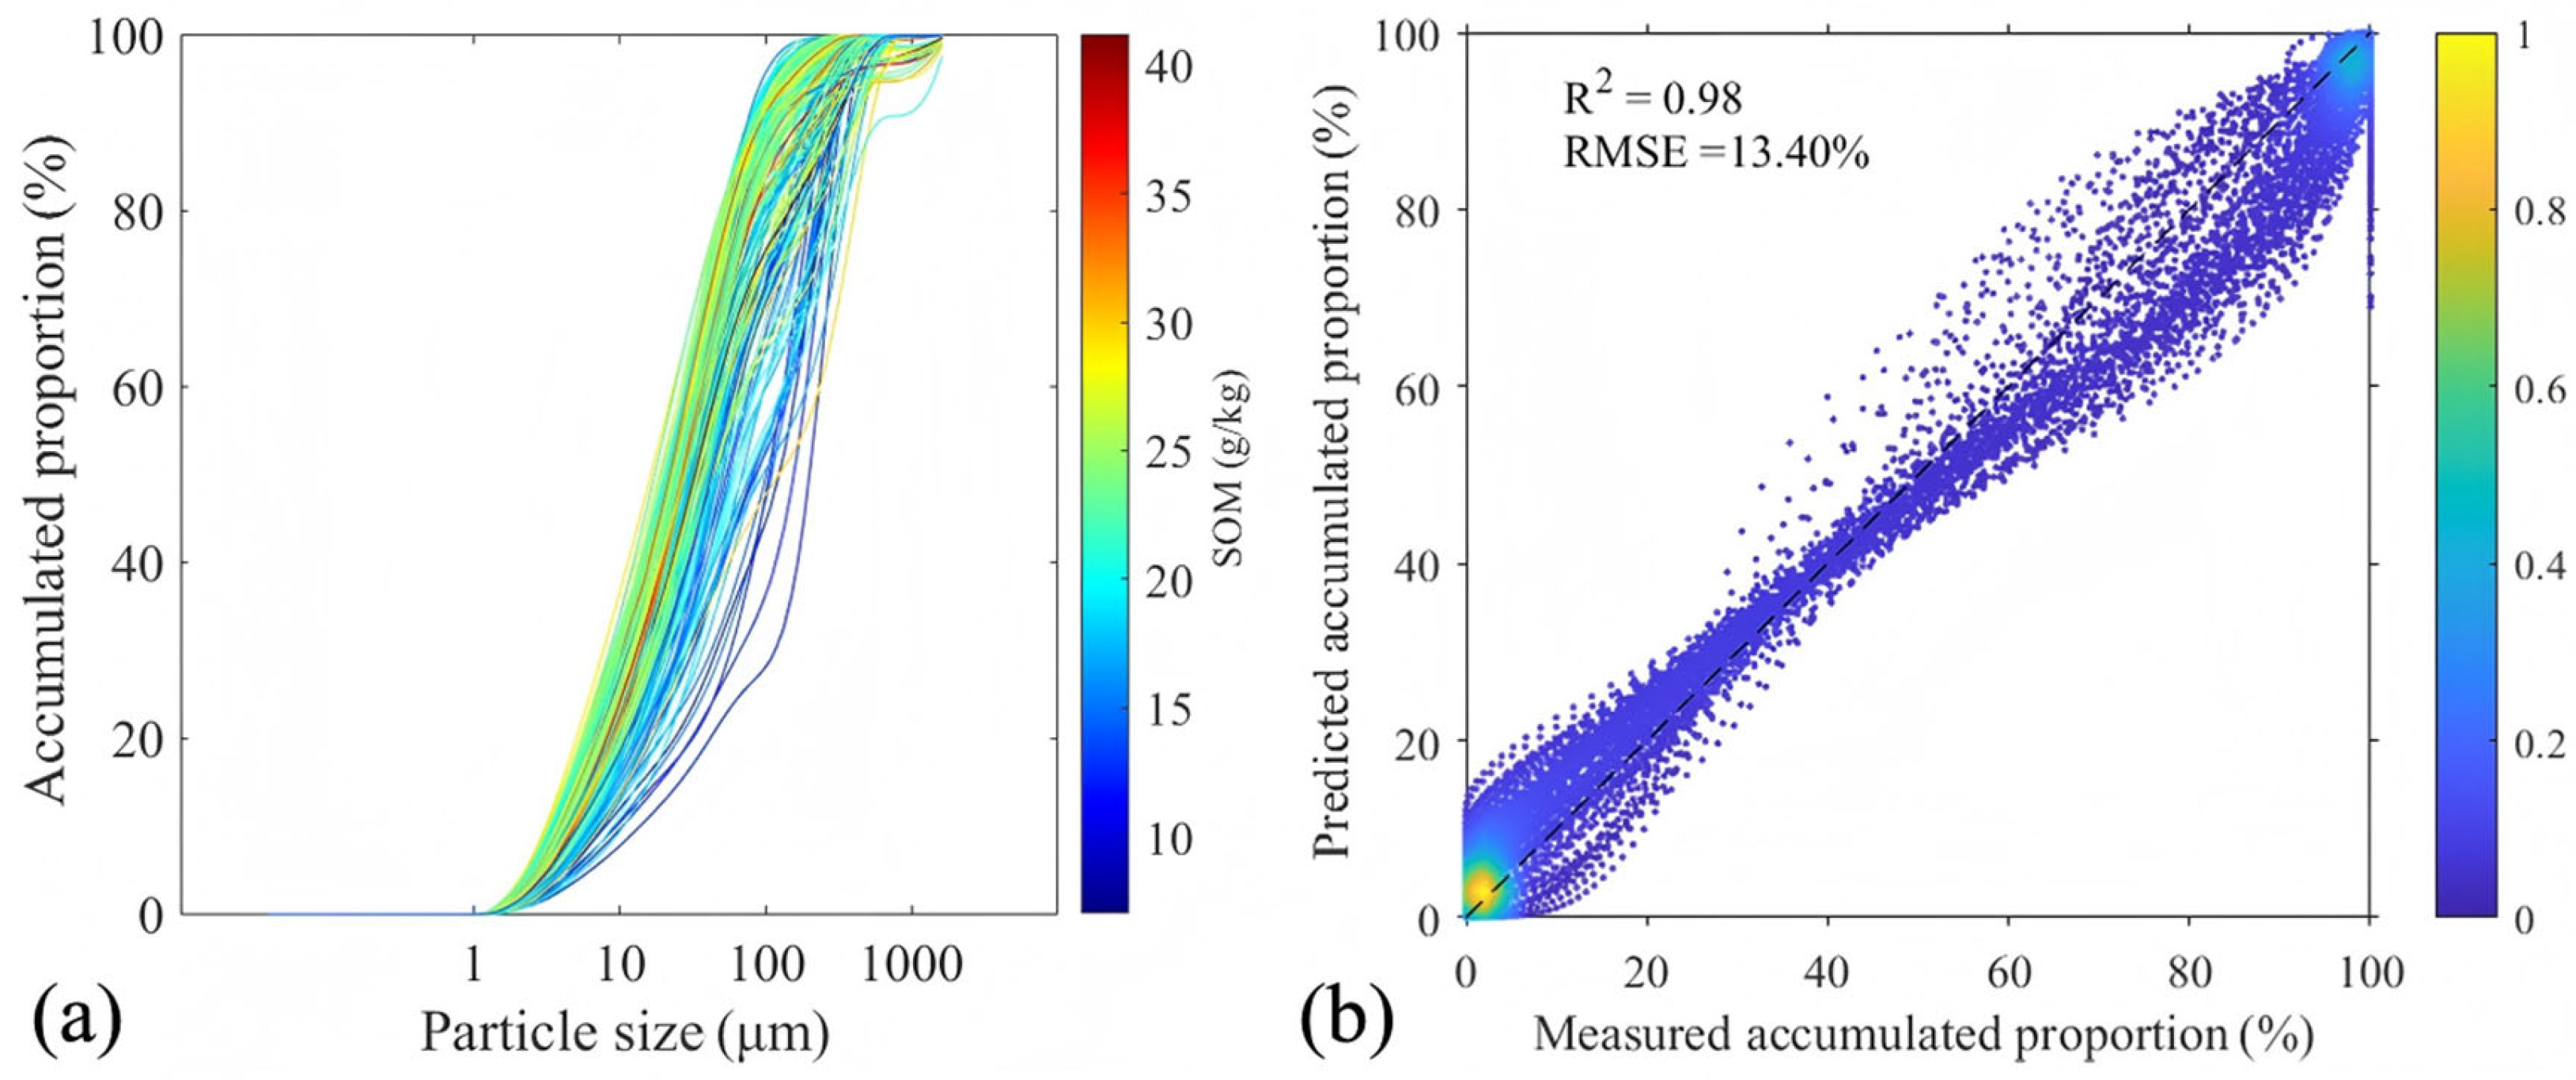
Soil properties vary across the 154 sampling sites. SOM content ranged from 7.01 g/kg to 41.19 g/kg, with an average value of 21.90 g/kg and a standard deviation (SD) of 5.71 g/kg. The cumulative PSDs differed among the samples, with particle sizes typically ranging from 1 to 1000 μm (Figure 4a). No significant correlation was observed between SOM and PSD. However, for some sampling sites with a low SOM content (e.g., site 7), a higher proportion of coarse particles (>100 μm) was present compared with finer particles. The Jaky model performed well in simulating the soil PSD (R2 = 0.98, RMSE = 13.4%, N = 15,400) (Figure 4b). The fitting parameter a, which characterizes the PSD shape, ranged from 1.78 to 5.15, with a mean value of 3.53 and SD of 0.62.
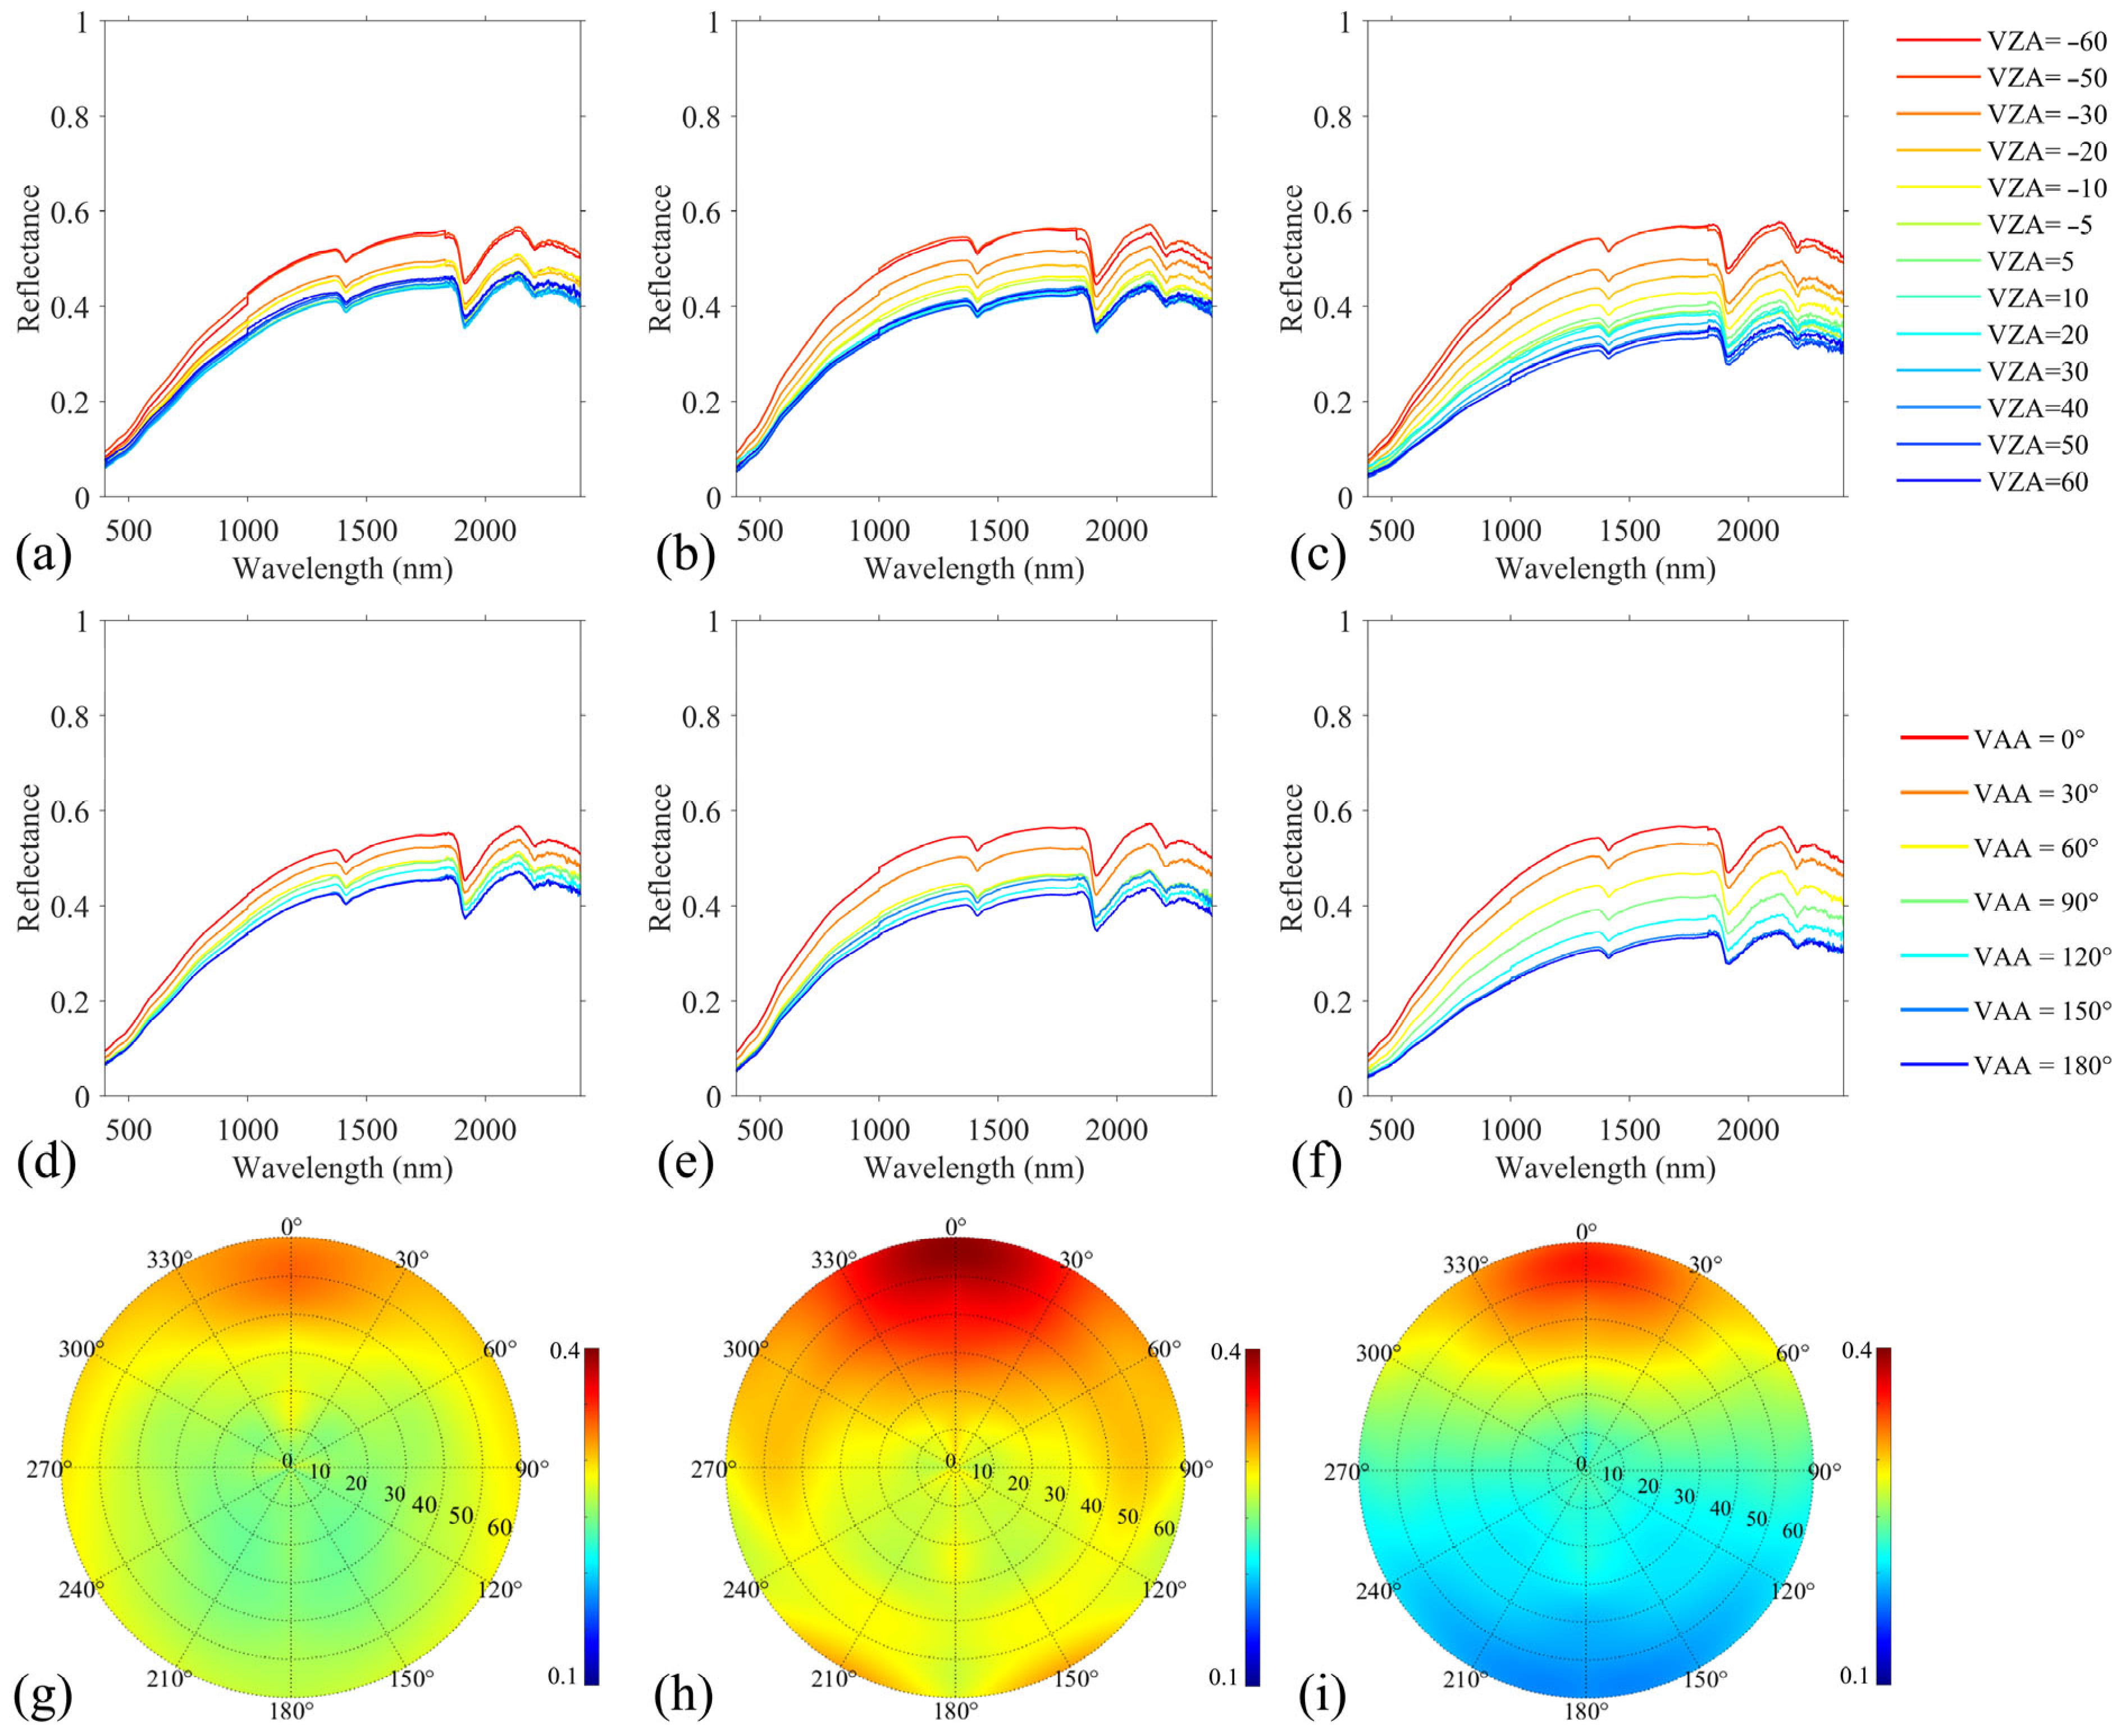
Soil BRFs were influenced by both soil properties and viewing geometry (Figure 5). The impact of viewing angle was consistent across different soil samples. Thus, three representative soil samples from sites 35, 63, and 120, which differed in SOM (7.91, 14.97, and 21.23 g/kg) and PSD parameter a (1.78, 3.77, and 4.16), were selected to illustrate these effects. Generally, BRFs decreased with increasing VZA in the principal plane (Figure 5a–c). Meanwhile, soil BRFs tended to decline as the relative VAA increased due to moving away from the hotspot direction (Figure 5d–f). The magnitude of BRF variation with viewing angle was greater for samples with a higher SOM and a larger PSD parameter a. Although the extent of BRF variation differed across wavelengths, the variation patterns were consistent. Thus, 800 nm was selected to illustrate the angular distribution of BRFs with soil properties (Figure 5g–i). Among the three sampling sites, the soil BRFs varied the most at site 120 and the least at site 35, indicating that BRFs are affected by the interaction between SOM and PSD.

3.2. Variation in Method Selection with Viewing Angle

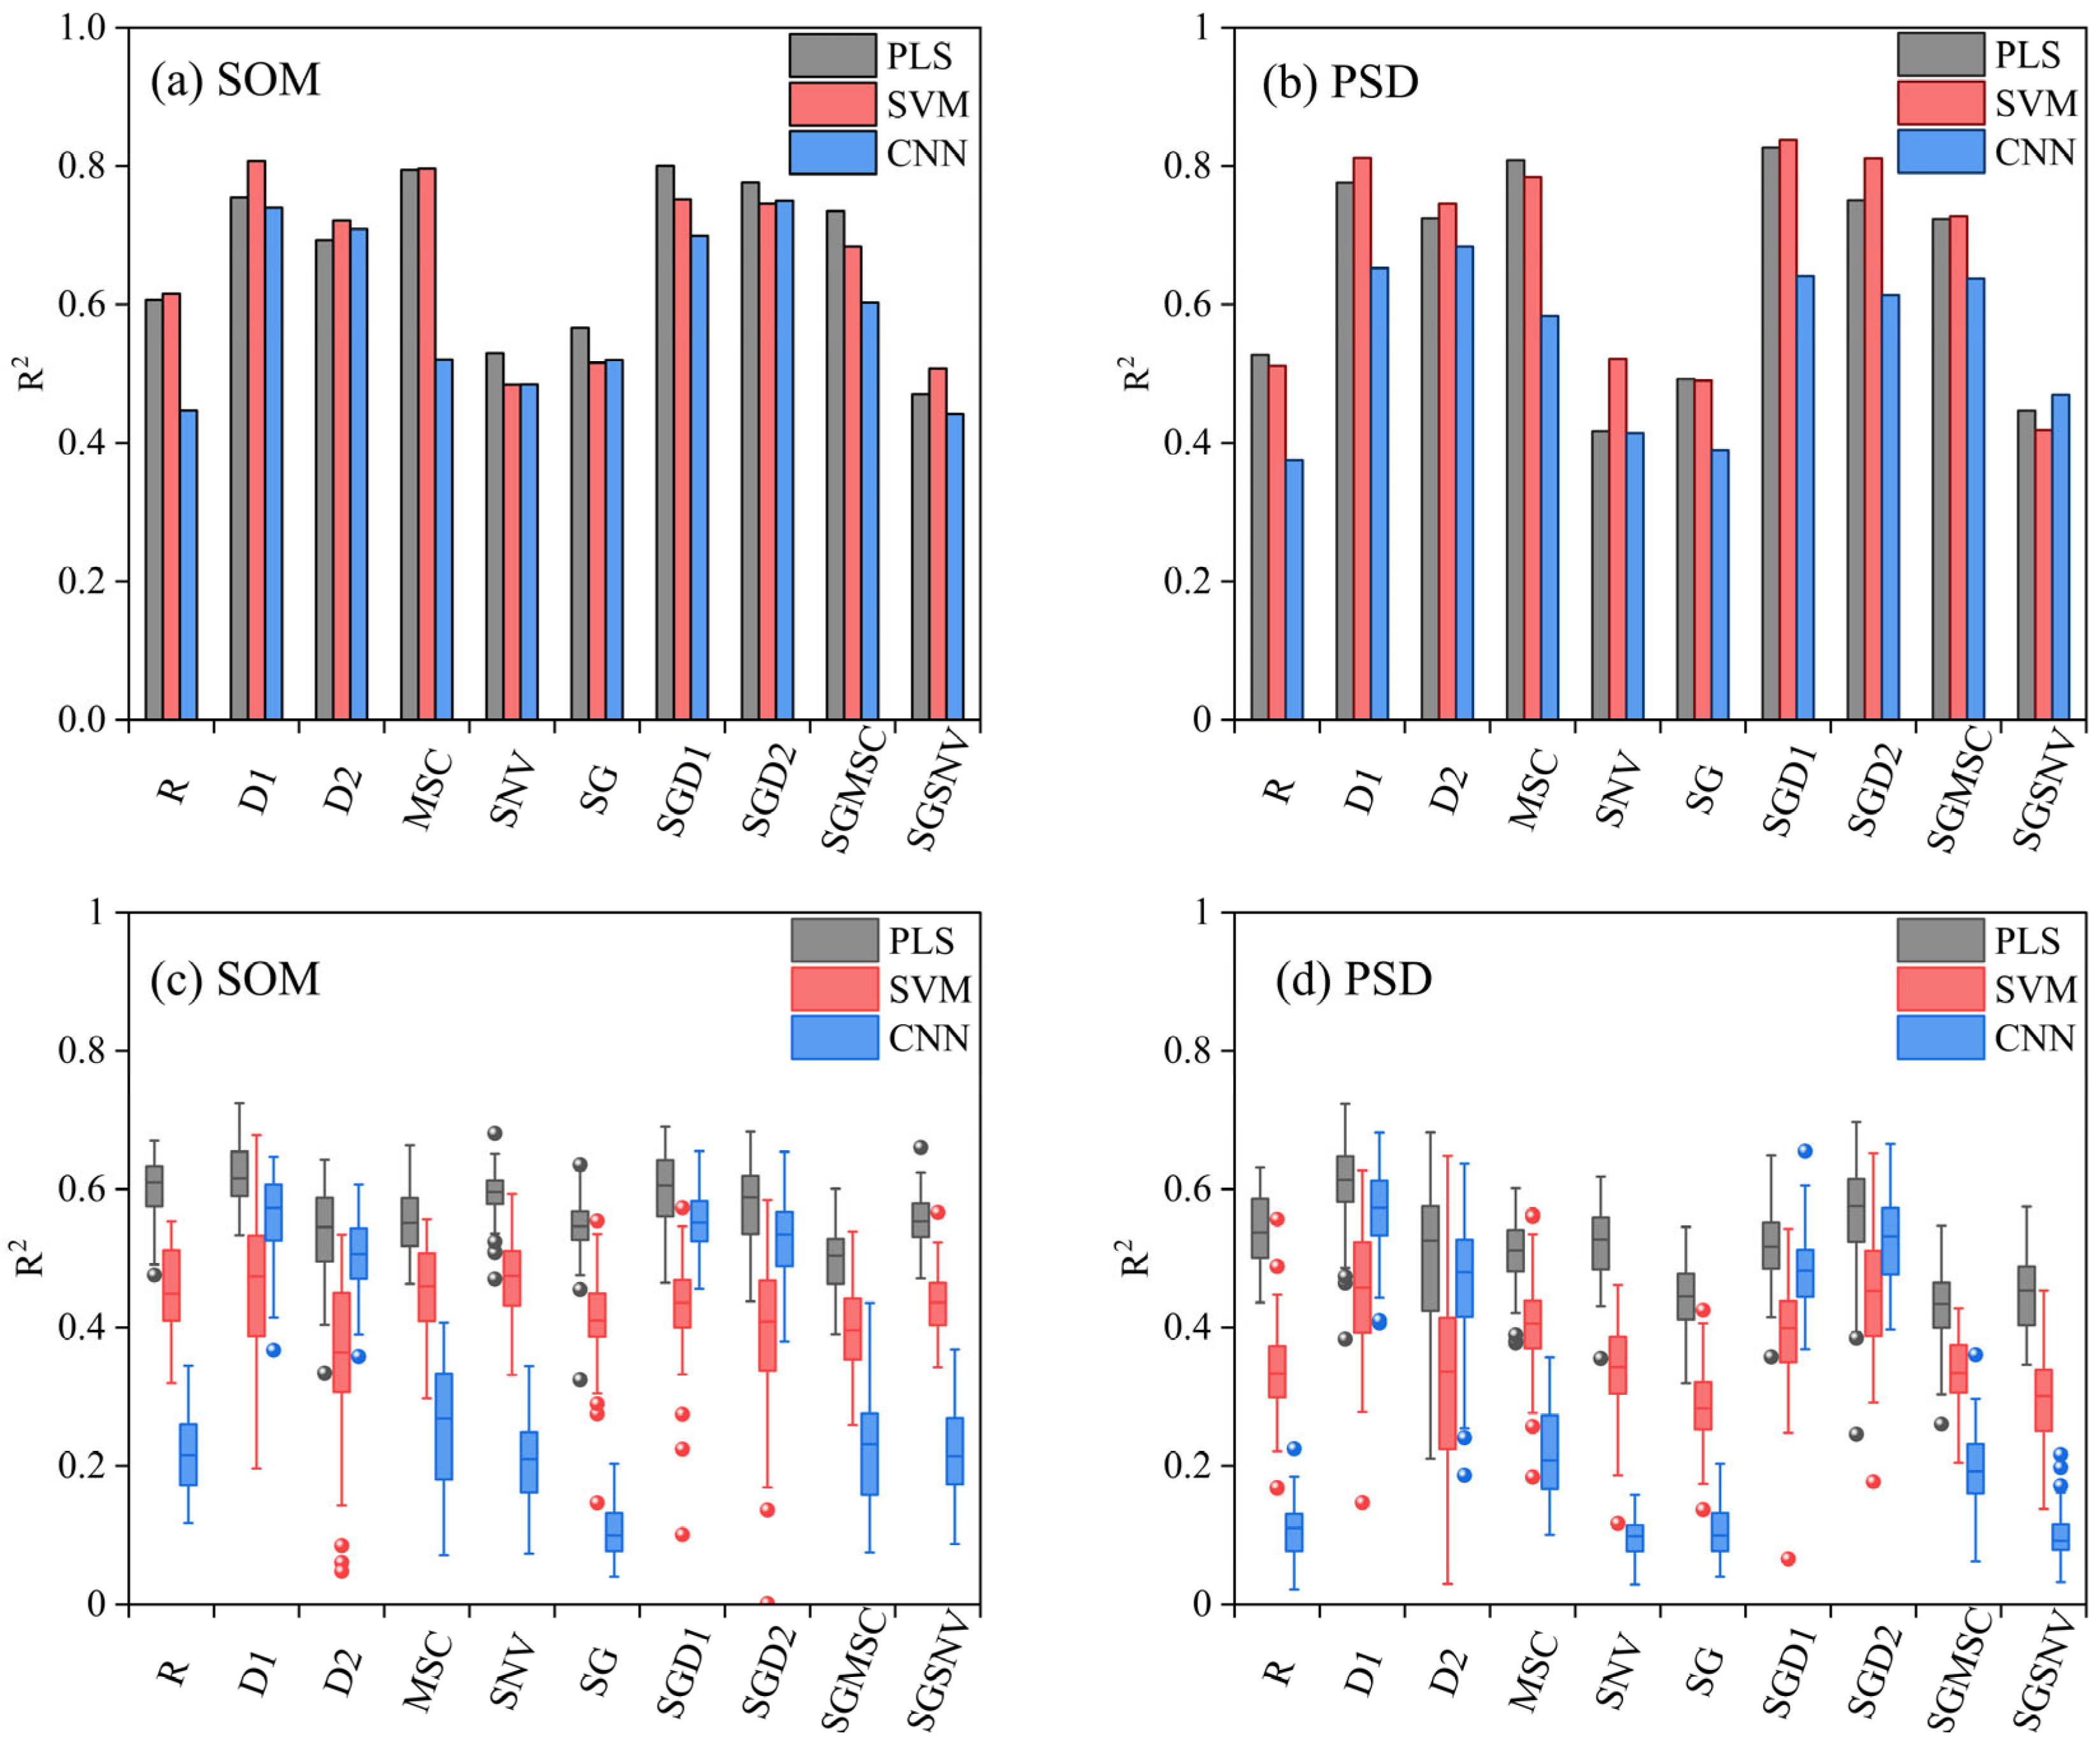
Based on the soil BRFs from the multi-angle scenario, the retrieval accuracy of SOM and PSD varied when using different spectral preprocessing methods and retrieval algorithms (Figure 6a,b). Among the different spectral preprocessing methods, D1, D2, MSC, SG + D1, SG + D2, and SD + MSC generally performed better than the other four methods. Under different spectral preprocessing methods, the PLSR algorithm consistently outperformed SVM and CNN for both SOM and PSD retrieval.
The analysis of BRFs from 48 individual viewing angles further confirmed the superior performance of D1, SG + D1, and SG + D2. PLSR remained the most suitable algorithm for SOM and PSD retrieval (Figure 6c,d). Although the retrieval accuracy varied with viewing angle for given spectral preprocessing methods and retrieval algorithms, the overall trends were consistent, indicating that viewing angle had a limited impact on the selection of the spectral preprocessing method and retrieval algorithm. Therefore, D1 preprocessing and the PLSR algorithm were selected for subsequent analyses.

3.3. Variation in Sensitive Wavelength with Viewing Angle

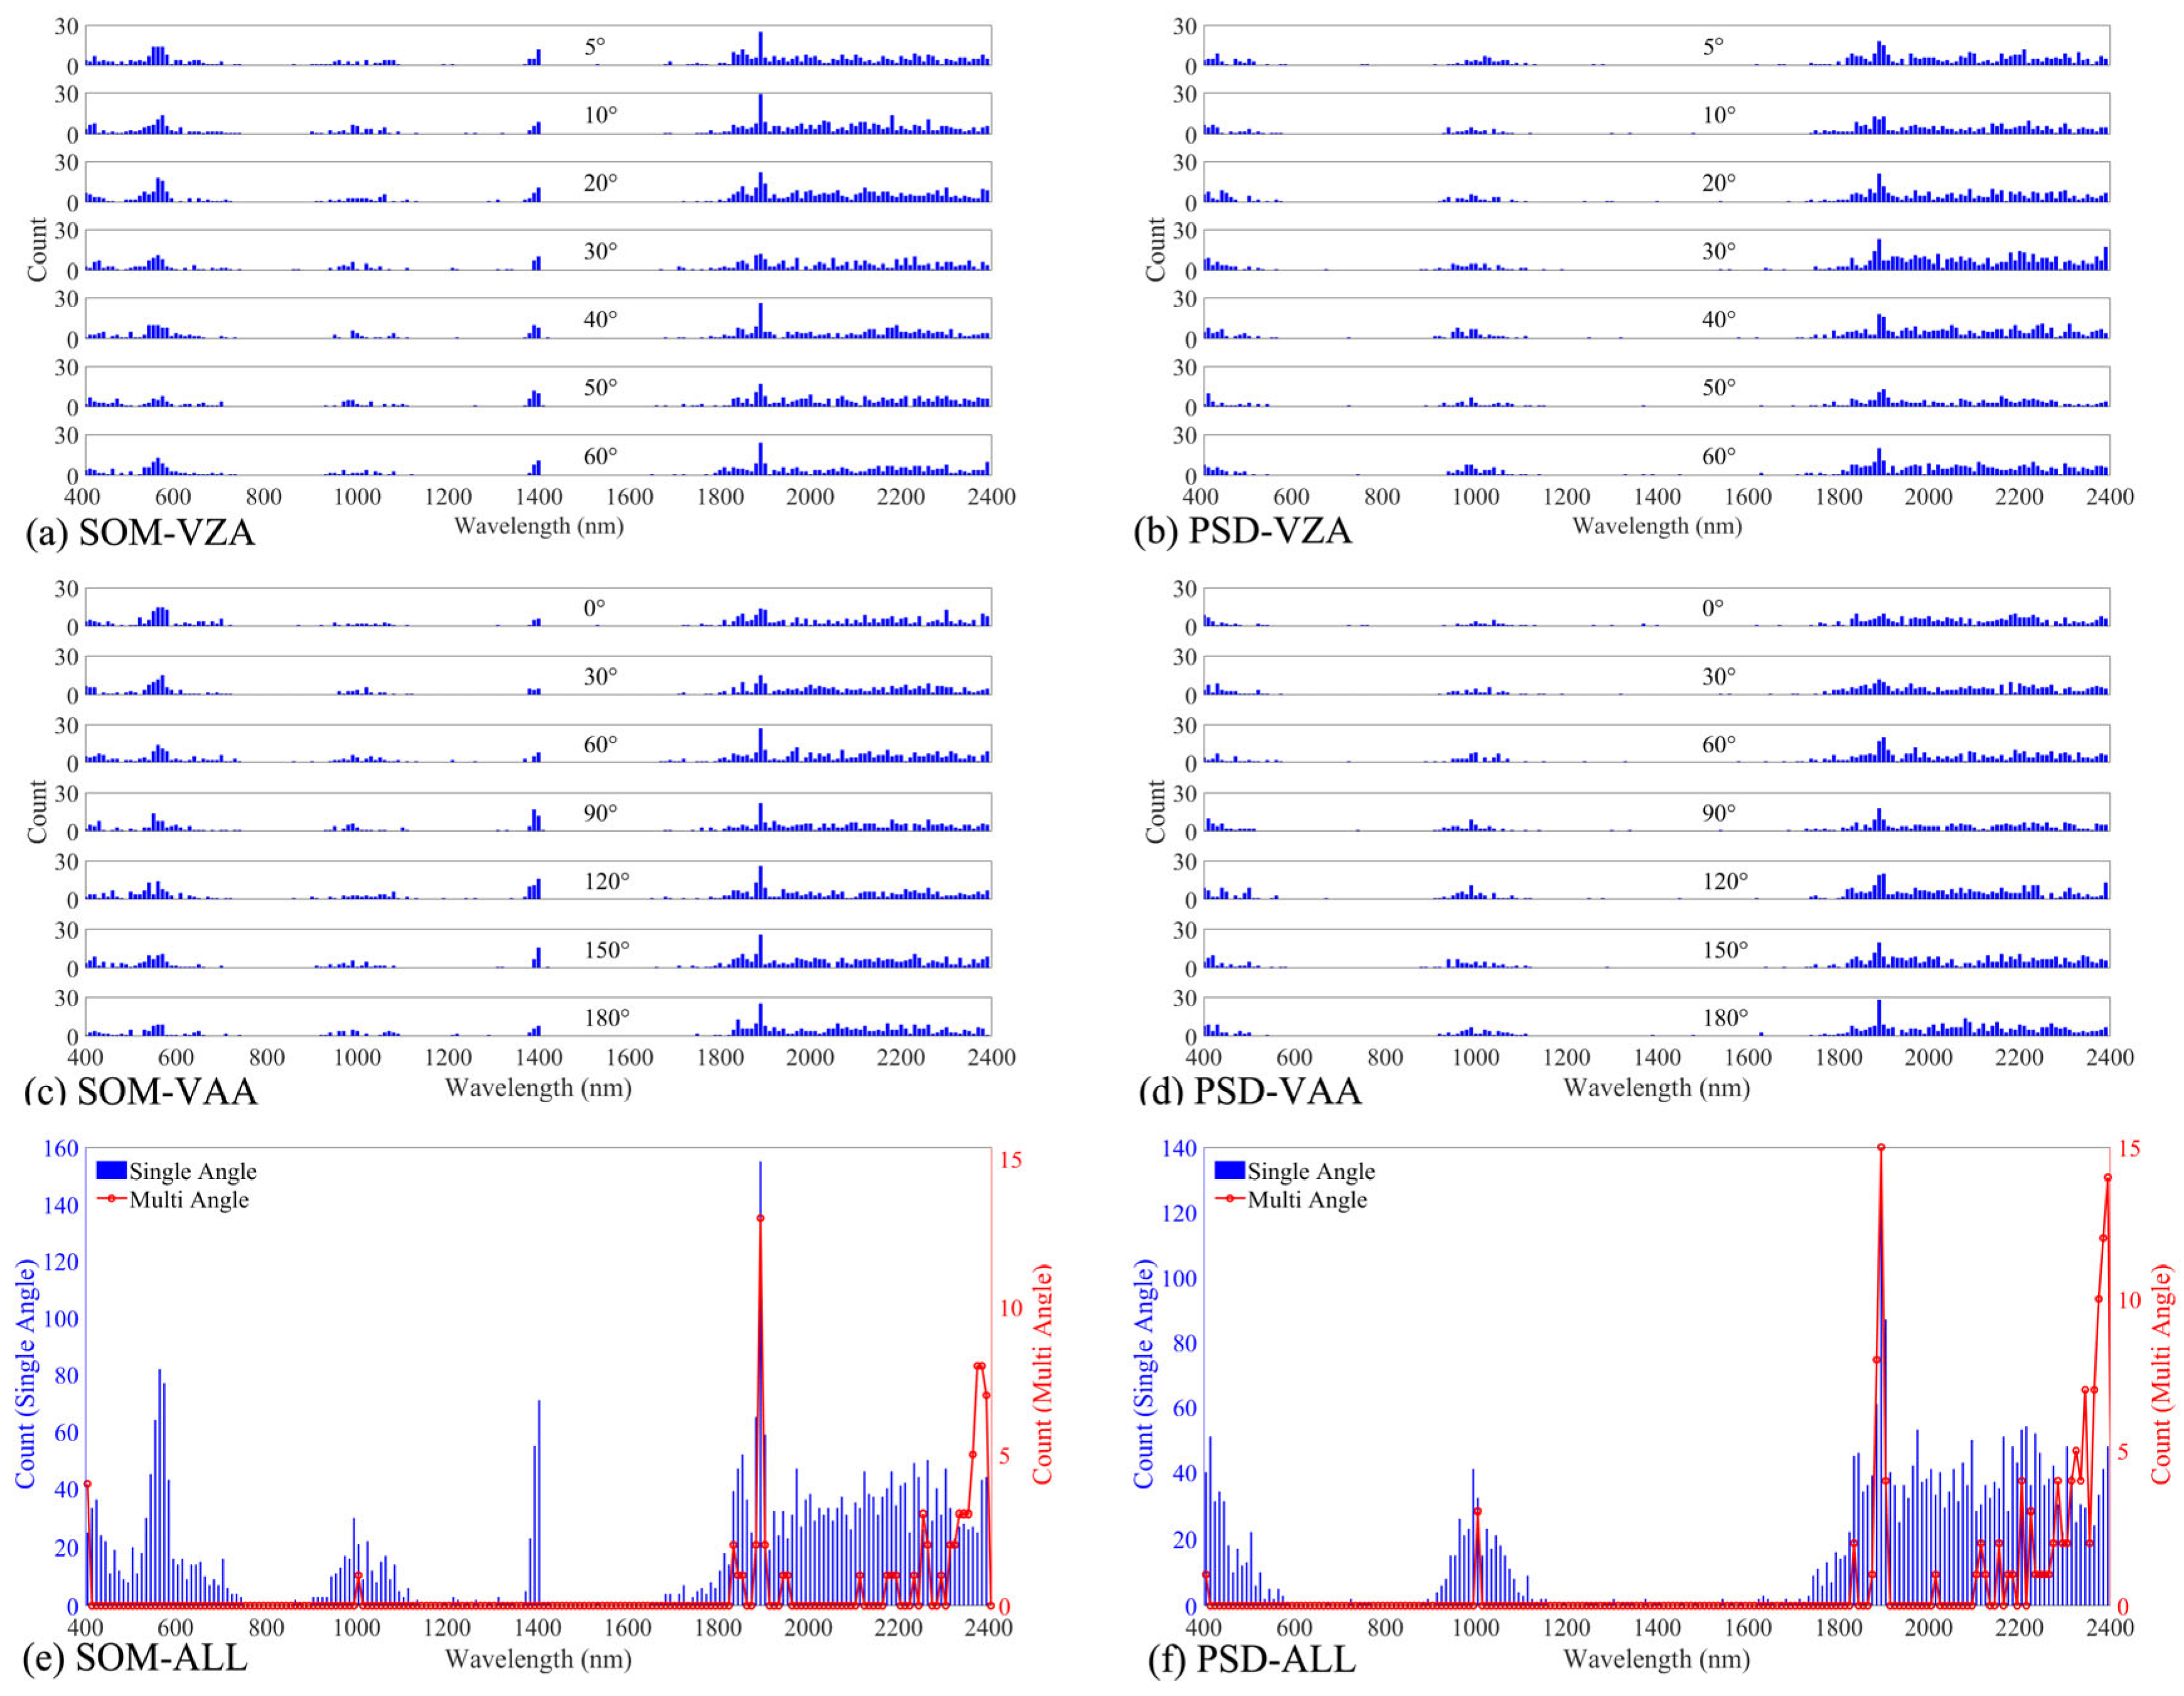
Based on the BRFs from 48 individual viewing angles, sensitive wavelengths for SOM were generally located in the regions of 400–440 nm, 540–580 nm, 1380–1410 nm, 1830–1980 nm, and 2000–2400 nm (Figure 7a,c,e). For PSD, sensitive wavelengths were typically found near 400–450 nm, 990–1010 nm, 1830–1850 nm, 1890–1920 nm, 1970–1980 nm, and 2200–2400 nm (Figure 7b,d,f). Although selected sensitive bands varied slightly with VZA and VAA, the main regions remained relatively stable.
When using the BRFs from all viewing angles combined, the selected sensitive wavelengths were narrower and more focused (Figure 7e,f). For SOM, the main bands were 400–410 nm, 1880–1900 nm, 2250–2270 nm, and 2330–2390 nm. For PSD, the key regions were 1000–1010 nm, 1880–1900 nm, 2200–2290 nm, and 2340–2400 nm. Both SOM and PSD showed greater sensitivity to the near-infrared region than to the visible region. Therefore, while viewing angle caused some variation in selected wavelengths, the main spectral regions remained stable.

3.4. Variation in Soil Property Retrieval Accuracy with Viewing Angles

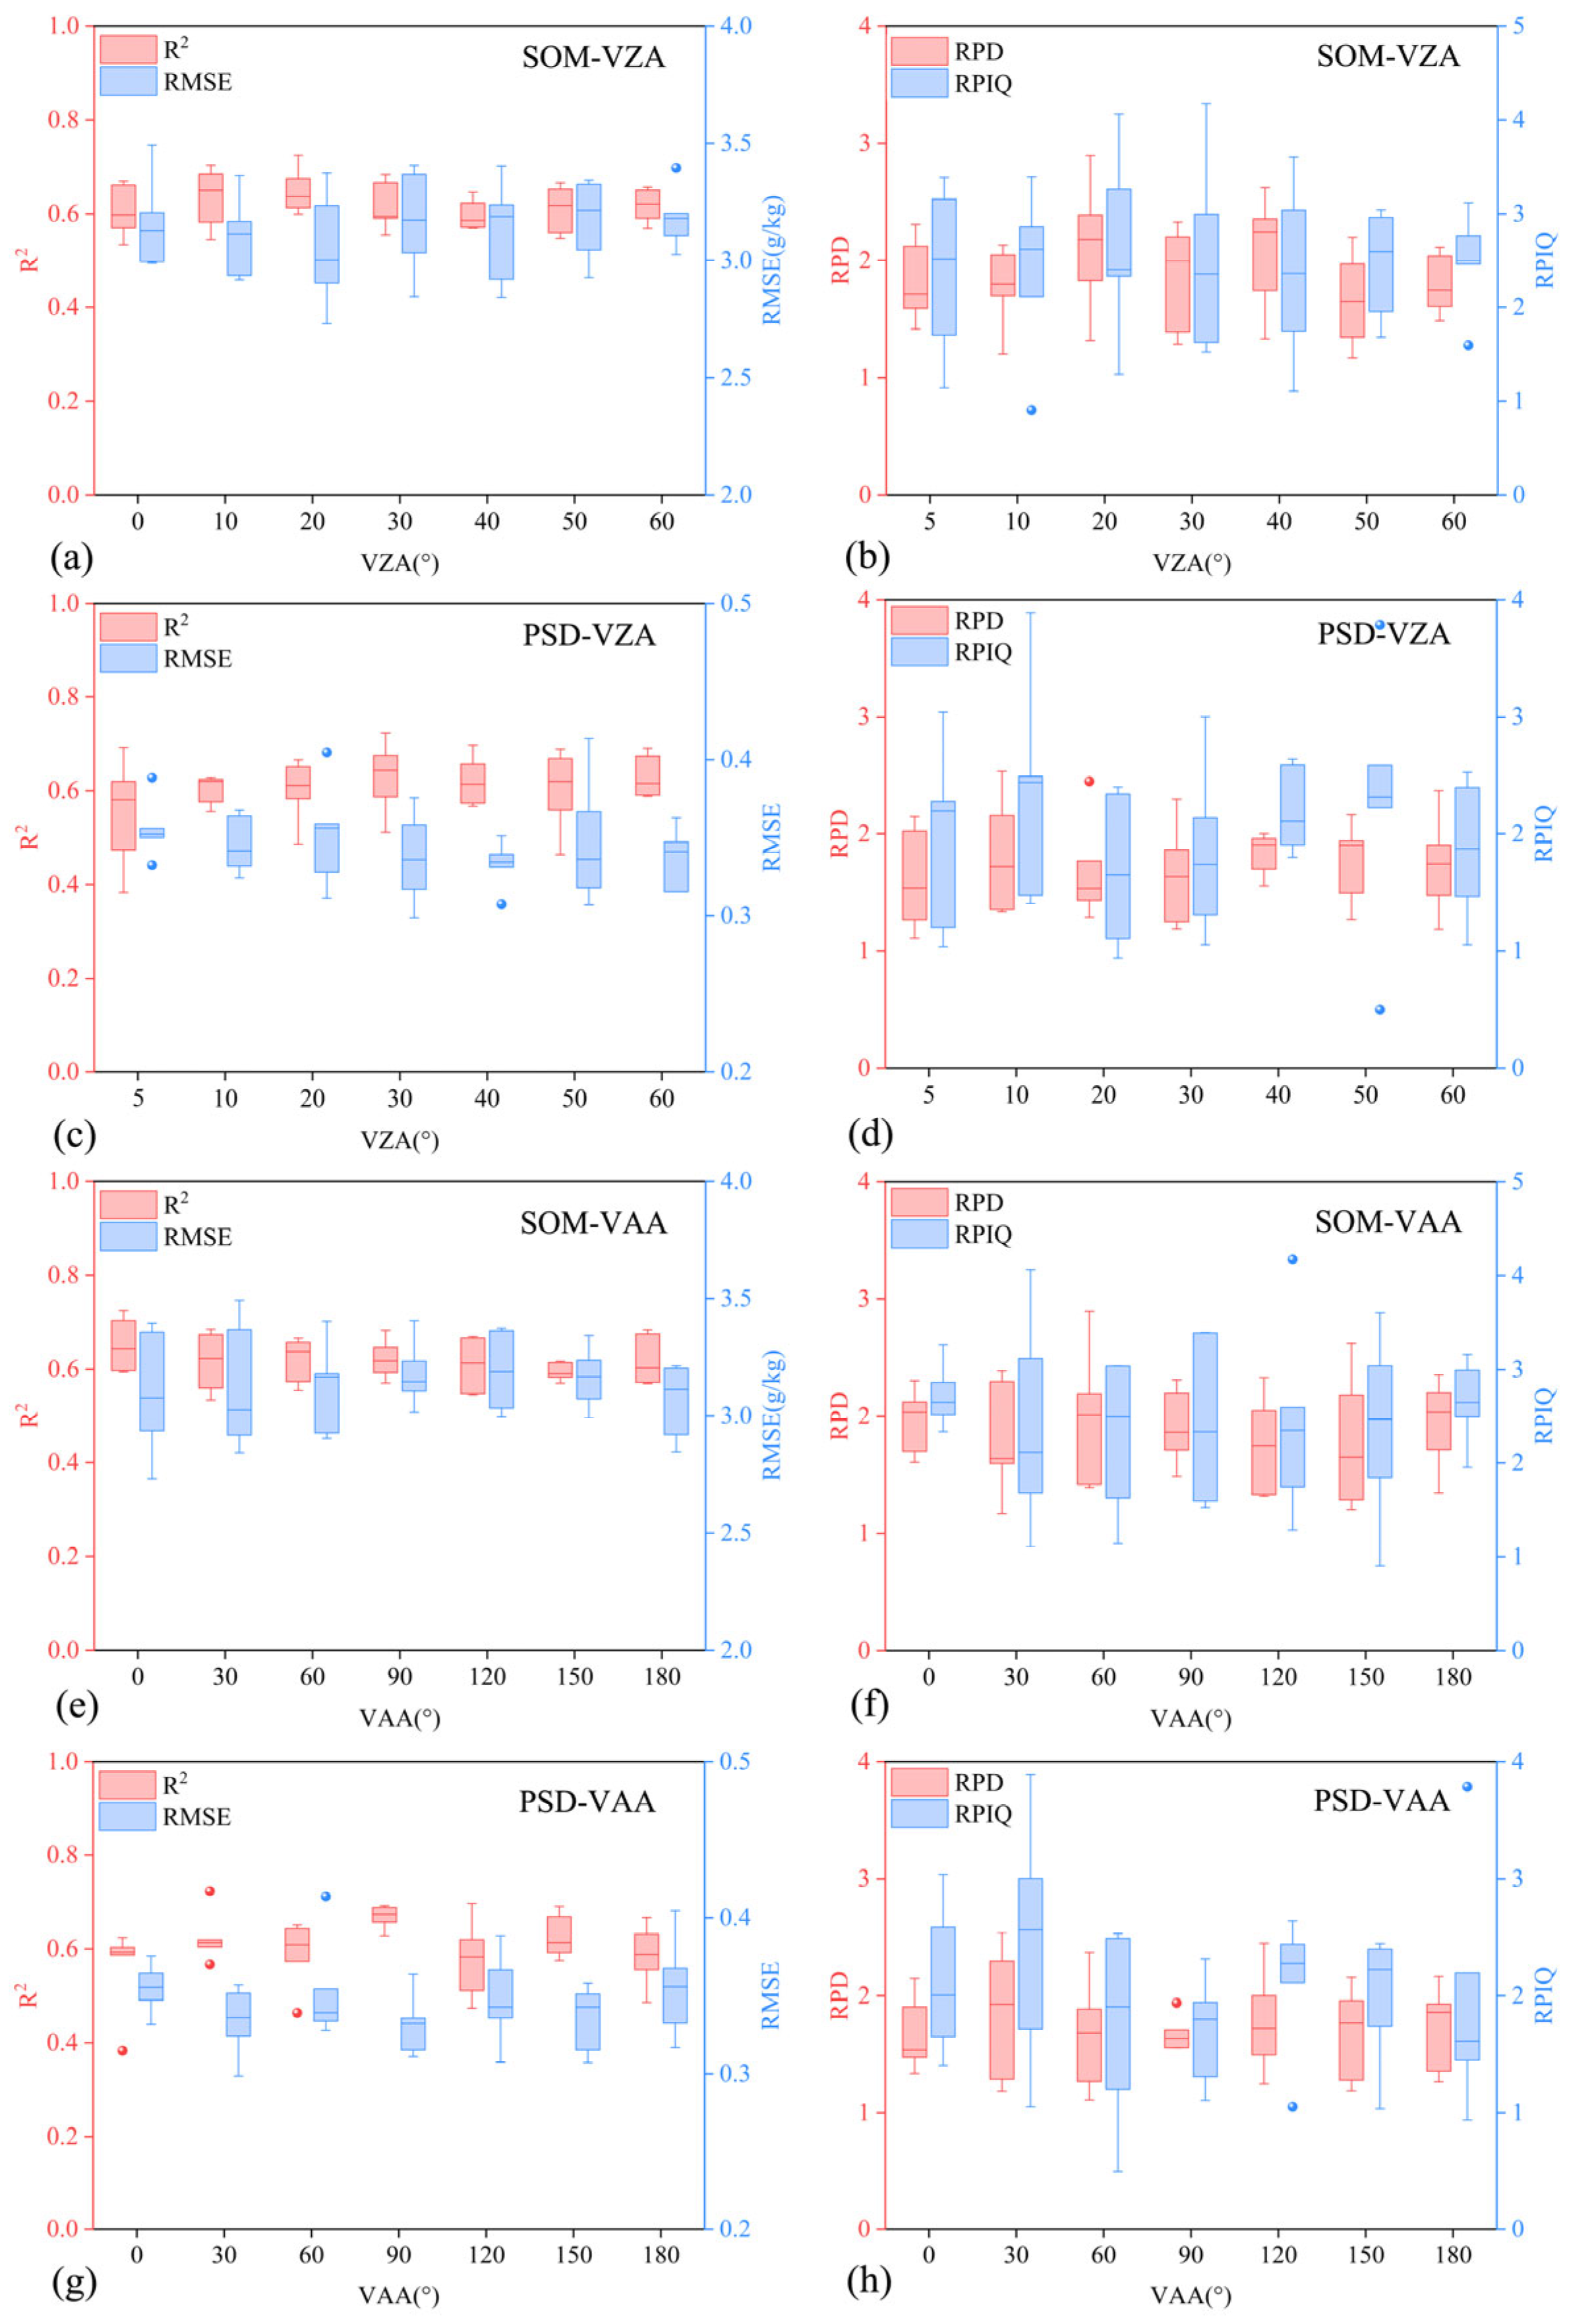
The retrieval accuracy based on the BRFs from the multi-angle was higher than that from any single viewing angle for both SOM and PSD. The best multi-angle models achieved R2 values of 0.80 for SOM (RMSE = 2.29 g/kg, RPD = 2.49, RPIQ = 3.13) and 0.83 for PSD (RMSE = 0.21, RPD = 2.85, RPIQ = 2.87). For individual viewing angles, the best SOM retrieval performance was observed at a VAA of 0° and VZA of 20°, with R2 of 0.72 and RMSE of 2.73 g/kg (RPD = 2.30, RPIQ =3.26). For PSD, the highest accuracy was achieved at VAA = 30° and VZA = 30°, with R2 of 0.72 and RMSE of 0.30 (RPD = 2.30, RPIQ = 3.00).
The VZA affected the retrieval accuracy for both SOM and PSD (Figure 8a–d). For SOM, the average RMSE decreased from 3.15 to 3.05 and the average RPD increased from 1.80 to 2.11 as VZA increased from 5° to 20°. Beyond 20°, the average RMSE (RPD) first increased (decreased) to 3.18 (1.85), then stabilized. Thus, VZAs between 10° and 20° were more favorable for SOM retrieval. For PSD, the retrieval accuracy increased as VZA increased from 5° to 30°, with the average R2 increasing from 0.56 to 0.63 and RMSE decreasing from 0.36 to 0.34. Then, the accuracy remained stable at larger VZAs. A VZA ranging around the hotspot direction is helpful for PSD retrieval. The decrease in accuracy at a VZA of 40° for both SOM and PSD was likely due to missing BRF measurements in the hotspot direction.
The VAA also affected the retrieval accuracy for both SOM and PSD (Figure 8e–h). For SOM, the retrieval accuracy decreased with the increased relative VAA, and the average R2 decreased from 0.65 to 0.59, average RMSE increased from 3.09 to 3.21, and average RPD (RPIQ) decreased from 1.60 (2.76) to 1.44 (1.60). This suggests that the forward directions are more suitable for SOM retrieval. For PSD, the retrieval accuracy increased as the relative VAA increased from 0° to 90° (average R2 from 0.56 to 0.67, average RMSE from 0.35 to 0.33, average RPD from 1.66 to 1.85, and average RPIQ from 2.12 to 2.43), then declined beyond 90° (R2 down to 0.59, RMSE up to 0.35, RPD down to 1.71, and RPIQ down to 2.06). Therefore, a relative VAA of around 90° was optimal for PSD retrieval.

4. Discussions

Although previous studies have confirmed that viewing geometry influences soil reflectance [25,26] the effects of viewing angle on the retrieval of soil properties using hyperspectral data remain poorly understood. Some recent studies have attempted to retrieve soil physical and chemical properties from multi-view hyperspectral observations [28,34,35], yet few have systematically examined how viewing geometry impacts the entire retrieval process. This study addresses this gap by using measured multi-angle soil BRFs to investigate the influence of viewing geometry on key aspects of hyperspectral-based retrieval, including the selection of spectral preprocessing methods, retrieval algorithms, sensitive wavelengths, and the accuracy of estimating SOM and PSD. These findings contribute new insights into the anisotropic behavior of soil reflectance and offer a more comprehensive understanding of hyperspectral-based soil property retrieval.

4.1. Effect of Viewing Angle on Method Selection

The effect of viewing angle on the selection of spectral preprocessing methods and retrieval algorithms appeared to be limited, which may be attributed to the relatively stable shape of the soil reflectance curves across different viewing geometries (Figure 5a–f). Key spectral features—such as absorption positions, depths, and relative intensities—remain largely unchanged with varying viewing angles [46]. Preprocessing methods like first and second derivatives (D1, D2, SG + D1, SG + D2) are designed to enhance shape-related characteristics (e.g., slopes, shoulders, and minima) [47], and their effectiveness depends more on spectral shape than on absolute reflectance values. Likewise, the PLSR algorithm captures covariance patterns across wavelengths, which are affected more by the shape than the absolute values of reflectance. Similarly, the PLSR algorithm models covariance structures across wavelengths, which are primarily governed by spectral shape rather than absolute reflectance magnitude [48]. Therefore, although BRF intensity varies with viewing angle, the underlying spectral information used by preprocessing and modeling approaches remains consistent, resulting in minimal impact on their relative performance.
Although both the multi-angular and single angle results consistently demonstrated that D1, SGD1, and SGD2 were among the most effective preprocessing techniques, and that PLSR outperformed than SVM and CNN in retrieving SOM and PSD, the optimal combinations of preprocessing method and retrieval algorithm exhibited slight variation depending on the viewing angle and specific soil properties.
The results based on the multi-angular soil BRFs indicated that D1, D2, and MSC performed better compared with raw reflectance and SNV, while the effectiveness of the SG filter was not obvious. Although no universal consensus has been reached on the most appropriate spectral preprocessing method [49,50], numerous studies have emphasized the advantages of derivative-based approaches in enhancing spectral feature resolution and improving soil property estimation [51,52,53]. In particular, D1 and D2 are effective in resolving the overlapping signals and preserving the key spectral peaks associated with soil characteristics. D1 has been frequently reported as being more robust and reliable than other methods [51,53] MSC and SNV are commonly used to mitigate the scattering effects caused by surface irregularities and particle size variability [51]. Between the two, MSC demonstrated a superior performance under multi-angular BRF conditions, while SNV was more effective using single-angle data, possibly due to its ability to address constant scattering offset [54]. Although SG filtering is widely used for spectral smoothing, several studies have indicated that it may not improve, and could even reduce, soil property retrieval accuracy [55,56]. This is likely because the filtering process, while reducing noise, may also suppress important nonlinear spectral features critical for machine learning-based models [57].
PLSR is a classic and widely applied algorithm for hyperspectral regression [58]. In recent years, machine learning methods such as SVM and RF, as well as deep learning algorithms like CNN, have shown potential for modeling complex relationships between hyperspectral data and soil properties [51]. However, due to variability in soil types, sample characteristics, and sample sizes, there remains no definitive consensus on the best-performing algorithm. For example, Guo et al. (2021) [55] reported that SVM outperforms PLSR in SOM prediction, whereas PLSR achieves better results for soil phosphorous and potassium. Although machine learning and deep learning approaches are often considered superior to traditional statistical models due to their ability to capture nonlinear patterns [53,59], PLSR has still been competitive in several cases [49]. Importantly, the performance of retrieval algorithms is closely related to the chosen spectral preprocessing method [49]. For instance, SVM outperformed PLSR when D1 and D2 were applied, whereas PLSR achieved better results than SVM when SGD1 and SGD2 were used. In addition, a linear model may be more suitable for the specific soil samples used in this study, further supporting the use of PLSR.

4.2. Effect of Viewing Angle on Sensitive Wavelength Selection

The CARS algorithm has been widely employed for feature wavelength selection when retrieving soil properties. Numerous studies have demonstrated that CARS outperforms other feature selection methods [55,59], such as the successive projection algorithm (SPA), making it a reasonable choice for this study. The selected feature wavelengths exhibited slight variations across different viewing angles, which can be attributed to the variation in soil BRFs with observation geometry. Nevertheless, the wavelengths identified as sensitive to SOM and PSD were largely consistent with findings reported in previous studies [49,55].
SOM is known to be sensitive to both the visible (600–750 nm) and near-infrared (1730–2430 nm) spectral regions, with greater sensitivity typically observed in the near-infrared range [60,61]. For instance, Ou et al. [18] identified 2197 nm as the most responsive wavelength to SOM variability. In contrast, soil particle size primarily influences reflectance in the near-infrared region, rather than in the visible spectrum [62]. Consequently, the majority of the selected sensitive wavelengths for SOM and PSD retrieval using multi-angle soil BRFs were concentrated in the near-infrared region.
The broad sensitivity of SOM across both visible and shortwave infrared (SWIR) regions can be attributed to its complex chemical composition, which contains functional groups such as O–H, C–H, and N–H [63]. Notably, three absorption features commonly occur near 1400 nm, 1900 nm, and 2200 nm, corresponding to O–H stretching and C–H combination bands associated with aromatic compounds derived from lignin [64]. Although the soil samples used in this study were air-dried, the influence of atmospheric moisture cannot be entirely eliminated, and residual water absorption may still affect the reflectance spectra.

4.3. Effect of Viewing Angle on Soil Property Retrieval Accuracy

Although the VZA affected the retrieval accuracy of both SOM and PSD, the pattern of variation differed between the two properties. This discrepancy may be attributed to the distinct mechanisms through which SOM and PSD influence soil reflectance: SOM primarily alters absorption features, whereas PSD influences scattering characteristics. Increased SOM content generally enhances the absorption coefficient of reflectance [65,66], while a higher proportion of coarse particles in PSD tends to reduce soil reflectance by increasing surface shadowing and reducing scattering [62,67]. The higher retrieval accuracy of PSD at VZAs near the hotspot direction may result from increased scattering, which is beneficial for characterizing particle size. In contrast, enhanced scattering may not contribute positively to SOM retrieval [68]. Furthermore, nadir-like views (e.g., VZA = 5°) yielded a lower retrieval accuracy for both SOM and PSD.
The analysis of retrieval accuracy variations across different relative VAA further revealed that backward viewing directions generally provide more accurate retrievals than forward directions, which is consistent with findings from [68]. Interestingly, the VAA of 0° appeared more suitable for SOM retrieval, while 90° was more favorable for PSD retrieval. These findings emphasize the importance of selecting an appropriate viewing geometry when optimizing soil property estimation using hyperspectral data.
Multi-angle hyperspectral data have been widely applied in the retrieval of vegetation parameters, such as leaf nitrogen content and leaf area index [69,70,71]. However, limited research has focused on the application of multi-angle data in soil property retrieval. Our results demonstrate that incorporating soil BRFs from multiple viewing angles can significantly enhance the accuracy of soil property estimation, further supporting the conclusions of Sun [68]. Future research should focus on identifying optimal observation configurations for different soil attributes and regions to further enhance retrieval performance.

4.4. Limitations and Prospects

In this study, the influence of viewing geometry on the retrieval of soil properties using hyperspectral data was evaluated. However, there are two main limitations that should be acknowledged.
First, the IZA was fixed at 40° throughout the experiment. This value was chosen to represent a typical solar zenith angle (SZA) during the bare soil season in Northeast China. While the SZA may vary with time and location under field conditions, the findings from this study can still offer useful insights for field-based applications. It is worth noting that the phase angle, which describes the relative position between the Sun and the sensor, is considered more critical than either the SZA or the VZA alone [39]. Therefore, in field experiments, viewing angles can be adjusted accordingly based on solar geometry. Furthermore, previous studies have demonstrated the feasibility of acquiring multi-angle hyperspectral data from UAV, airborne, and satellite platforms [27,28,34]. The optimal viewing angles identified in this study for retrieving SOM and PSD can thus serve as a reference when designing multi-angle hyperspectral observations in field conditions.
Second, all BRF measurements were conducted under controlled laboratory conditions. Specifically, the soil samples were pre-treated to eliminate the influence of moisture and surface roughness, and the measurements were collected indoors without atmospheric interference. As a result, the conclusions drawn may have limited applicability under real-world conditions. Nonetheless, several studies have proposed approaches to mitigate the effects of atmospheric conditions and soil moisture on reflectance measurements [72,73], which could help extend the applicability of the present findings. Future work will focus on evaluating the impact of viewing geometry on hyperspectral-based soil property retrieval under field conditions.

5. Conclusions

By comparing the retrieval accuracies of SOM and PSD under various spectral preprocessing methods and retrieval algorithms using soil BRFs from different viewing angles, this study determined the effect of viewing geometry on hyperspectral-based soil property estimation. The selection of spectral preprocessing method and retrieval algorithm was slightly affected by viewing angle. D1, SG + D1, and SG + D2 outperformed other spectral preprocessing methods, while PLSR was superior to SVM and CNN in retrieving soil properties. The sensitive wavelength exhibited slight variation across viewing angles. However, when integrating BRFs from multiple viewing angles, the selected sensitive wavelengths were narrower and predominantly located in the near-infrared region. The use of multi-angular hyperspectral data significantly enhanced retrieval performance, with R2 increasing by 11% for SOM and 15% for PSD, and RMSE decreasing by 16% and 30%, respectively. Moreover, the optimal viewing geometry differed between SOM and PSD. For SOM retrieval, the best results were achieved at a VZA between 10° and 20°, and a relative VAA of 0°. Meanwhile, PSD retrieval performed best at a VZA of approximately 40° and a VAA of 90°. This study is helpful in understanding soil property retrieval using multi-view hyperspectral data.

Author Contributions

Conceptualization, L.M., D.Y. and X.P.; methodology, Y.G., L.M. and Z.Z.; software, Y.G.; validation, Y.G. and L.M.; formal analysis, Y.G., L.M. and D.Y.; investigation, Y.G. and L.M.; resources, L.M., Z.Y., X.P. and C.W.; data curation, L.M., Z.Y., X.P. and C.W.; writing—original draft preparation, L.M., Y.G. and D.Y.; writing—review and editing, L.M., Y.G., Z.Z. and D.Y.; visualization, L.M., Y.G. and D.Y.; supervision, L.M.; project administration, L.M.; funding acquisition, L.M. All authors have read and agreed to the published version of the manuscript.

Funding

This research was funded by National Key R&D Program of China (No. 2022YFB3903302, No. 2022YFB3903305) and Strategic Priority Research Program of the Chinese Academy of Sciences (XDA28010100).

Data Availability Statement

The datasets generated and analyzed during the current study are available from the corresponding author on reasonable request.

Acknowledgments

We want to thank Zhang Gao, Qixun Ding, Tong Wang, Mengmeng Luo, Yinhua Yu, Zhiguo Tai, Xiaokun Su, Wenjuan Shen, Shiyi Zhang for their help in data collections. Anonymous reviewers are appreciated for their valuable suggestions and comments to greatly improve this manuscript.

Conflicts of Interest

The authors declare no conflict of interest.

References

  1. Ruehlmann, J. Soil particle density as affected by soil texture and soil organic matter: 1. Partitioning of SOM in conceptional fractions and derivation of a variable SOC to SOM conversion factor. Geoderma 2020, 375, 114542. [Google Scholar] [CrossRef]
  2. Luo, H.; Chen, J.; Yang, B.; Li, Y.; Wang, P.; Yu, J.; Yuan, B.; Zhang, Y.; Ren, J.; Du, P.; et al. Cadmium distribution and availability in different particle-size aggregates of post-harvest paddy soil amended with bio-based materials. Sci. Total Environ. 2024, 957, 177739. [Google Scholar] [CrossRef]
  3. Xia, Y.; Cheng, X.; Hu, X. Soil organic matter content prediction in tobacco fields based on hyperspectral remote sensing and generative adversarial network data augmentation. Comput. Electron. Agric. 2025, 233, 110164. [Google Scholar] [CrossRef]
  4. Hermansen, C.; Knadel, M.; Moldrup, P.; Greve, M.H.; Karup, D.; de Jonge, L.W. Complete Soil Texture is Accurately Predicted by Visible Near-Infrared Spectroscopy. Soil Sci. Soc. Am. J. 2017, 81, 758–769. [Google Scholar] [CrossRef]
  5. Kassai, P.; Kocsis, M.; Szatmári, G.; Makó, A.; Mészáros, J.; Laborczi, A.; Magyar, Z.; Takács, K.; Pásztor, L.; Szabó, B. Large-scale mapping of soil particle size distribution using legacy data and machine learning-based pedotransfer functions. Geoderma 2025, 454, 117178. [Google Scholar] [CrossRef]
  6. Gao, Y.; Yang, P. Temporal and spatial distribution of soil water repellency in grassland soils and its relation to soil moisture, hydrophobic matter, and particle size. Sci. Total Environ. 2023, 904, 166700. [Google Scholar] [CrossRef]
  7. Peng, G.; Xiang, N.; Lv, S.; Zhang, G. Fractal characterization of soil particle-size distribution under different land-use patterns in the Yellow River Delta Wetland in China. J. Soils Sediments 2014, 14, 1116–1122. [Google Scholar] [CrossRef]
  8. Wang, X.; Wang, J.; Zhang, J. Comparisons of Three Methods for Organic and Inorganic Carbon in Calcareous Soils of Northwestern China. PLoS ONE 2012, 7, e44334. [Google Scholar] [CrossRef]
  9. Bowman, R.A. A reevaluation of the chromic acid colorimetric procedure for soil organic carbon. Commun. Soil Sci. Plant Anal. 1998, 29, 501–508. [Google Scholar] [CrossRef]
  10. Gee, G.W.; Bauder, J.W. Particle-size Analysis. In Methods of Soil Analysis; John Wiley & Sons, Ltd.: Hoboken, NJ, USA, 1986; pp. 383–411. [Google Scholar] [CrossRef]
  11. Flogeac, K.; Guillon, E.; Aplincourt, M.; Marceau, E.; Stievano, L.; Beaunier, P.; Frapart, Y.-M. Characterization of soil particles by X-ray diffraction (XRD), X-ray photoelectron spectroscopy (XPS), electron paramagnetic resonance (EPR) and transmission electron microscopy (TEM). Agron. Sustain. Dev. 2005, 25, 345–353. [Google Scholar] [CrossRef]
  12. Pieri, L.; Bittelli, M.; Pisa, P.R. Laser diffraction, transmission electron microscopy and image analysis to evaluate a bimodal Gaussian model for particle size distribution in soils. Geoderma 2006, 135, 118–132. [Google Scholar] [CrossRef]
  13. Eshel, G.; Levy, G.J.; Mingelgrin, U.; Singer, M.J. Critical Evaluation of the Use of Laser Diffraction for Particle-Size Distribution Analysis. Soil Sci. Soc. Am. J. 2004, 68, 736–743. [Google Scholar] [CrossRef]
  14. Bittelli, M.; Pellegrini, S.; Olmi, R.; Andrenelli, M.C.; Simonetti, G.; Borrelli, E.; Morari, F. Experimental evidence of laser diffraction accuracy for particle size analysis. Geoderma 2022, 409, 115627. [Google Scholar] [CrossRef]
  15. Bayat, H.; Rastgo, M.; Mansouri Zadeh, M.; Vereecken, H. Particle size distribution models, their characteristics and fitting capability. J. Hydrol. 2015, 529, 872–889. [Google Scholar] [CrossRef]
  16. Vesilind, P.A. The Rosin-Rammler particle size distribution. Resour. Recovery Conserv. 1980, 5, 275–277. [Google Scholar] [CrossRef]
  17. Fredlund, M.D.; Fredlund, D.G.; Wilson, G.W. An equation to represent grain-size distribution. Can. Geotech. J. 2000, 37, 817–827. [Google Scholar] [CrossRef]
  18. Ou, D.; Tan, K.; Wang, X.; Wu, Z.; Li, J.; Ding, J. Modified soil scattering coefficients for organic matter inversion based on Kubelka-Munk theory. Geoderma 2022, 418, 115845. [Google Scholar] [CrossRef]
  19. Silva, F.H.C.A.; Wijewardane, N.K.; Cox, M.S.; Zhang, X. Assessment of different VisNIR and MIR spectroscopic techniques and the potential of calibration transfer between MIR laboratory and portable instruments to estimate soil properties. Soil Tillage Res. 2025, 251, 106555. [Google Scholar] [CrossRef]
  20. Chen, Y.; Li, L.; Whiting, M.; Chen, F.; Sun, Z.; Song, K.; Wang, Q. Convolutional neural network model for soil moisture prediction and its transferability analysis based on laboratory Vis-NIR spectral data. Int. J. Appl. Earth Obs. Geoinf. 2021, 104, 102550. [Google Scholar] [CrossRef]
  21. Hosseinpour-Zarnaq, M.; Omid, M.; Sarmadian, F.; Ghasemi-Mobtaker, H. A CNN model for predicting soil properties using VIS–NIR spectral data. Environ. Earth Sci. 2023, 82, 382. [Google Scholar] [CrossRef]
  22. Li, H.; Liang, Y.; Xu, Q.; Cao, D. Key wavelengths screening using competitive adaptive reweighted sampling method for multivariate calibration. Anal. Chim. Acta 2009, 648, 77–84. [Google Scholar] [CrossRef]
  23. Zhang, X.; Huang, B. Prediction of soil salinity with soil-reflected spectra: A comparison of two regression methods. Sci. Rep. 2019, 9, 5067. [Google Scholar] [CrossRef] [PubMed]
  24. Wang, C.; Gao, B.; Yang, K.; Wang, Y.; Sukhbaatar, C.; Yin, Y.; Feng, Q.; Yao, X.; Zhang, Z.; Yang, J. Inversion of soil organic carbon content based on the two-point machine learning method. Sci. Total Environ. 2024, 943, 173608. [Google Scholar] [CrossRef] [PubMed]
  25. Liang, S.; Townshend, J.R.G. A modified hapke model for soil bidirectional reflectance. Remote Sens. Environ. 1996, 55, 1–10. [Google Scholar] [CrossRef]
  26. Liang, S.; Townshend, J.R.G. A parametric soil BRDF model: A four stream approximation for multiple scattering. Int. J. Remote Sens. 1996, 17, 1303–1315. [Google Scholar] [CrossRef]
  27. Si, Y.; Lu, Q.; Zhang, X.; Hu, X.; Wang, F.; Li, L.; Gu, S. A review of advances in the retrieval of aerosol properties by remote sensing multi-angle technology. Atmos. Environ. 2021, 244, 117928. [Google Scholar] [CrossRef]
  28. Eon, R.S.; Bachmann, C.M.; Lapszynski, C.S.; Tyler, A.C.; Goldsmith, S. Retrieval of Sediment Filling Factor in a Salt Panne from Multi-View Hyperspectral Imagery. Remote Sens. 2020, 12, 422. [Google Scholar] [CrossRef]
  29. Guo, A.; Huang, W.; Qian, B.; Ye, H.; Jiao, Q.; Cheng, X.; Ruan, C. A hybrid model coupling PROSAIL and continuous wavelet transform based on multi-angle hyperspectral data improves maize chlorophyll retrieval. Int. J. Appl. Earth Obs. Geoinf. 2024, 132, 104076. [Google Scholar] [CrossRef]
  30. Chappell, A.; Webb, N.P.; Guerschman, J.P.; Thomas, D.T.; Mata, G.; Handcock, R.N.; Leys, J.F.; Butler, H.J. Improving ground cover monitoring for wind erosion assessment using MODIS BRDF parameters. Remote Sens. Environ. 2018, 204, 756–768. [Google Scholar] [CrossRef]
  31. Wang, Q.; Pang, Y.; Jia, W.; Zhang, H.; Wang, C. Effective and Universal Pre-Processing for Multi-Angle CHRIS/PROBA Images. J. Indian Soc. Remote Sens. 2021, 49, 1581–1591. [Google Scholar] [CrossRef]
  32. Zhang, X.; Gao, M.; He, S.; Barbedo, L. Deriving anisotropic correction for upwelling radiance from PACE’s multi-angle polarimetry. Remote Sens. Environ. 2025, 320, 114647. [Google Scholar] [CrossRef]
  33. Kong, W.; Huang, W.; Liu, J.; Chen, P.; Qin, Q.; Ye, H.; Peng, D.; Dong, Y.; Mortimer, A.H. Estimation of canopy carotenoid content of winter wheat using multi-angle hyperspectral data. Adv. Space Res. 2017, 60, 1988–2000. [Google Scholar] [CrossRef]
  34. Nguyen, D.T.; Jacquemoud, S.; Lucas, A.; Douté, S.; Ferrari, C.; Coustance, S.; Marcq, S.; Meygret, A. Mapping the surface properties of the Asal-Ghoubbet rift by massive inversion of the Hapke model on Pleiades multiangular images. Remote Sens. Environ. 2025, 322, 114691. [Google Scholar] [CrossRef]
  35. Sun, Z.; Lu, S.; Omasa, K. MART-soil: A modified analytical radiative transfer mode for simulating multi-angular reflection of soils with different particle size. Geoderma 2023, 431, 116366. [Google Scholar] [CrossRef]
  36. IUSS Working Group WRB. World Reference Base for Soil Resources: International Soil Classification System for Naming Soils and Creating Legends for Soil Maps, 4th ed.; International Union of Soil Sciences (IUSS): Rome, Italy, 2022; Available online: https://www.fao.org/soils-portal/data-hub/soil-classification/world-reference-base/en/ (accessed on 2 July 2025).
  37. Yang, S.; Zhao, W.; Pereira, P. Determinations of environmental factors on interactive soil properties across different land-use types on the Loess Plateau, China. Sci. Total Environ. 2020, 738, 140270. [Google Scholar] [CrossRef]
  38. Carter, M.R.; Gregorich, E.G. Soil Sampling and Methods of Analysis, 2nd ed.; CRC Press: Boca Raton, FL, USA, 2007. [Google Scholar] [CrossRef]
  39. Hapke, B. Theory of Reflectance and Emittance Spectroscopy; Cambridge University Press: Cambridge, UK, 2012. [Google Scholar] [CrossRef]
  40. Jurado, J.M.; Jiménez-Pérez, J.R.; Pádua, L.; Feito, F.R.; Sousa, J.J. An efficient method for acquisition of spectral BRDFs in real-world scenarios. Comput. Graph. 2022, 102, 154–163. [Google Scholar] [CrossRef]
  41. Chen, H.; Pan, T.; Chen, J.; Lu, Q. Waveband selection for NIR spectroscopy analysis of soil organic matter based on SG smoothing and MWPLS methods. Chemom. Intell. Lab. Syst. 2011, 107, 139–146. [Google Scholar] [CrossRef]
  42. Sempere, A.; Oliver, J.; Ramos, C. Simple determination of nitrate in soils by second-derivative spectroscopy. J. Soil Sci. 1993, 44, 633–639. [Google Scholar] [CrossRef]
  43. Chi, K.; Lin, J.; Chen, M.; Chen, J.; Chen, Y.; Pan, T. Changeable moving window-standard normal variable transformation for visible-NIR spectroscopic analyses. Spectrochim. Acta Part A Mol. Biomol. Spectrosc. 2024, 308, 123726. [Google Scholar] [CrossRef]
  44. Maleki, M.R.; Mouazen, A.M.; Ramon, H.; Baerdemaeker, J.D. Multiplicative Scatter Correction during On-line Measurement with Near Infrared Spectroscopy. Biosyst. Eng. 2007, 96, 427–433. [Google Scholar] [CrossRef]
  45. Gowriswari, S.; Brindha, S. Hyperparameters Optimization using Gridsearch Cross Validation Method for machine learning models in Predicting Diabetes Mellitus Risk. In Proceedings of the 2022 International Conference on Communication 2022, Computing and Internet of Things (IC3IoT), Chennai, India, 10–11 March 2022; pp. 1–4. [Google Scholar] [CrossRef]
  46. Van der Meer, F. Analysis of spectral absorption features in hyperspectral imagery. Int. J. Appl. Earth Obs. Geoinf. 2004, 5, 55–68. [Google Scholar] [CrossRef]
  47. Yan, C. A review on spectral data preprocessing techniques for machine learning and quantitative analysis. iScience 2025, 28, 112759. [Google Scholar] [CrossRef] [PubMed]
  48. Pamukçu, E. Efficient Wavelength Selection for Limited Near-Infrared Spectral Data via Genetic Algorithm and Hybrid Regression. J. Chemom. 2025, 39, e70015. [Google Scholar] [CrossRef]
  49. Canero, F.M.; Rodriguez-Galiano, V.; Aragones, D. Machine Learning and Feature Selection for soil spectroscopy. An evaluation of Random Forest wrappers to predict soil organic matter, clay, and carbonates. Heliyon 2024, 10, e30228. [Google Scholar] [CrossRef]
  50. Tiecher, T.; Moura-Bueno, J.M.; Caner, L.; Minella, J.P.G.; Evrard, O.; Ramon, R.; Naibo, G.; Barros, C.A.P.; Silva, Y.J.A.B.; Amorim, F.F.; et al. Improving the quantification of sediment source contributions using different mathematical models and spectral preprocessing techniques for individual or combined spectra of ultraviolet–visible, near- and middle-infrared spectroscopy. Geoderma 2021, 384, 114815. [Google Scholar] [CrossRef]
  51. Deng, Y.; Xiao, L.; Shi, Y. Enhanced Hyperspectral Forest Soil Organic Matter Prediction Using a Black-Winged Kite Algorithm-Optimized Convolutional Neural Network and Support Vector Machine. Appl. Sci. 2025, 15, 503. [Google Scholar] [CrossRef]
  52. Guo, H.; Han, Z.; Liu, X. Characteristics of spatial variability and hyperspectral estimation of soil organic matter in tensile fissure zone of mine area. J. Appl. Remote Sens. 2024, 18, 042607. [Google Scholar] [CrossRef]
  53. Zhou, N.; Hong, J.; Song, B.; Wu, S.; Wei, Y.; Wang, T. Feature Variable Selection Based on VIS-NIR Spectra and Soil Moisture Content Prediction Model Construction. J. Spectrosc. 2024, 2024, 8180765. [Google Scholar] [CrossRef]
  54. Yang, X.; Bao, N.; Li, W.; Liu, S.; Fu, Y.; Mao, Y. Soil Nutrient Estimation and Mapping in Farmland Based on UAV Imaging Spectrometry. Sensors 2021, 21, 3919. [Google Scholar] [CrossRef]
  55. Guo, P.; Li, T.; Gao, H.; Chen, X.; Cui, Y.; Huang, Y. Evaluating Calibration and Spectral Variable Selection Methods for Predicting Three Soil Nutrients Using Vis-NIR Spectroscopy. Remote Sens. 2021, 13, 4000. [Google Scholar] [CrossRef]
  56. Vasques, G.M.; Grunwald, S.; Sickman, J.O. Comparison of multivariate methods for inferential modeling of soil carbon using visible/near-infrared spectra. Geoderma 2008, 146, 14–25. [Google Scholar] [CrossRef]
  57. Helland, I.S.; Næs, T.; Isaksson, T. Related versions of the multiplicative scatter correction method for preprocessing spectroscopic data. Chemom. Intell. Lab. Syst. 1995, 29, 233–241. [Google Scholar] [CrossRef]
  58. Barra, I.; Haefele, S.M.; Sakrabani, R.; Kebede, F. Soil spectroscopy with the use of chemometrics, machine learning and pre-processing techniques in soil diagnosis: Recent advances–A review. TrAC Trends Anal. Chem. 2021, 135, 116166. [Google Scholar] [CrossRef]
  59. Wu, S.; Wang, C.; Liu, Y.; Li, Y.; Liu, J.; Xu, A.; Pan, K.; Li, Y.; Pan, X. Mapping the Salt Content in Soil Profiles using Vis-NIR Hyperspectral Imaging. Soil Sci. Soc. Am. J. 2018, 82, 1259–1269. [Google Scholar] [CrossRef]
  60. Angelopoulou, T.; Tziolas, N.; Balafoutis, A.; Zalidis, G.; Bochtis, D. Remote Sensing Techniques for Soil Organic Carbon Estimation: A Review. Remote Sens. 2019, 11, 676. [Google Scholar] [CrossRef]
  61. Ben-Dor, E. Quantitative remote sensing of soil properties. In Advances in Agronomy, (Advances in Agronomy); Academic Press: Cambridge, MA, USA, 2002; Volume 75, pp. 173–243. [Google Scholar] [CrossRef]
  62. Sadeghi, M.; Babaeian, E.; Tuller, M.; Jones, S.B. Particle size effects on soil reflectance explained by an analytical radiative transfer model. Remote Sens. Environ. 2018, 210, 375–386. [Google Scholar] [CrossRef]
  63. Galvdo, L.S.; Vitorello, Í.; Formaggio, A.R. Relationships of spectral reflectance and color among surface and subsurface horizons of tropical soil profiles. Remote Sens. Environ. 1997, 61, 24–33. [Google Scholar] [CrossRef]
  64. Liu, J.; Xie, J.; Meng, T.; Dong, H. Organic matter estimation of surface soil using successive projection algorithm. Agron. J. 2022, 114, 1944–1951. [Google Scholar] [CrossRef]
  65. Al-Abbas, A.H.; Swain, P.H.; Baumgardner, M.F. Relating Organic Matter and Clay Content to the Multispectral Radiance of Soils. Soil Sci. 1972, 114, 477–485. [Google Scholar] [CrossRef]
  66. Kooistra, L.; Wehrens, R.; Leuven, R.S.E.W.; Buydens, L.M.C. Possibilities of visible–near-infrared spectroscopy for the assessment of soil contamination in river floodplains. Anal. Chim. Acta 2001, 446, 97–105. [Google Scholar] [CrossRef]
  67. Baumgardner, M.F.; Silva, L.F.; Biehl, L.L.; Stoner, E.R. Reflectance Properties of Soils. In Advances in Agronomy; Brady, N.C., Ed.; Academic Press: Cambridge, MA, USA, 1986; Volume 38, pp. 1–44. [Google Scholar] [CrossRef]
  68. Sun, X. Estimation of Soil Organic Carbon Content Based on Multi-Angle Spectral Reflectance Information. Master’s Thesis, Northeast Normal University, Changchun, China, 2023. Available online: https://link.cnki.net/doi/10.27011/d.cnki.gdbsu.2023.000299 (accessed on 10 May 2025). (In Chinese).
  69. He, L.; Coburn, C.A.; Wang, Z.-J.; Feng, W.; Guo, T.-C. Reduced Prediction Saturation and View Effects for Estimating the Leaf Area Index of Winter Wheat. IEEE Trans. Geosci. Remote Sens. 2019, 57, 1637–1652. [Google Scholar] [CrossRef]
  70. He, L.; Liu, M.-R.; Guo, Y.-L.; Wei, Y.-K.; Zhang, H.-Y.; Song, X.; Feng, W.; Guo, T.-C. Angular effect of algorithms for monitoring leaf nitrogen concentration of wheat using multi-angle remote sensing data. Comput. Electron. Agric. 2022, 195, 106815. [Google Scholar] [CrossRef]
  71. Li, T.; Zhu, Z.; Cui, J.; Chen, J.; Shi, X.; Zhao, X.; Jiang, M.; Zhang, Y.; Wang, W.; Wang, H. Monitoring of leaf nitrogen content of winter wheat using multi-angle hyperspectral data. Int. J. Remote Sens. 2021, 42, 4672–4692. [Google Scholar] [CrossRef]
  72. Mruthyunjaya, P.; Shetty, A.; Umesh, P.; Gomez, C. Impact of Atmospheric Correction Methods Parametrization on Soil Organic Carbon Estimation Based on Hyperion Hyperspectral Data. Remote Sens. 2022, 14, 5117. [Google Scholar] [CrossRef]
  73. Yaron, O.G.E.N.; Faigenbaum-Golovin, S.; Granot, A.; Shkolnisky, Y.; Goldshleger, N.; Eyal, B.D. Removing Moisture Effect on Soil Reflectance Properties: A Case Study of Clay Content Prediction. Pedosphere 2019, 29, 421–431. [Google Scholar] [CrossRef]
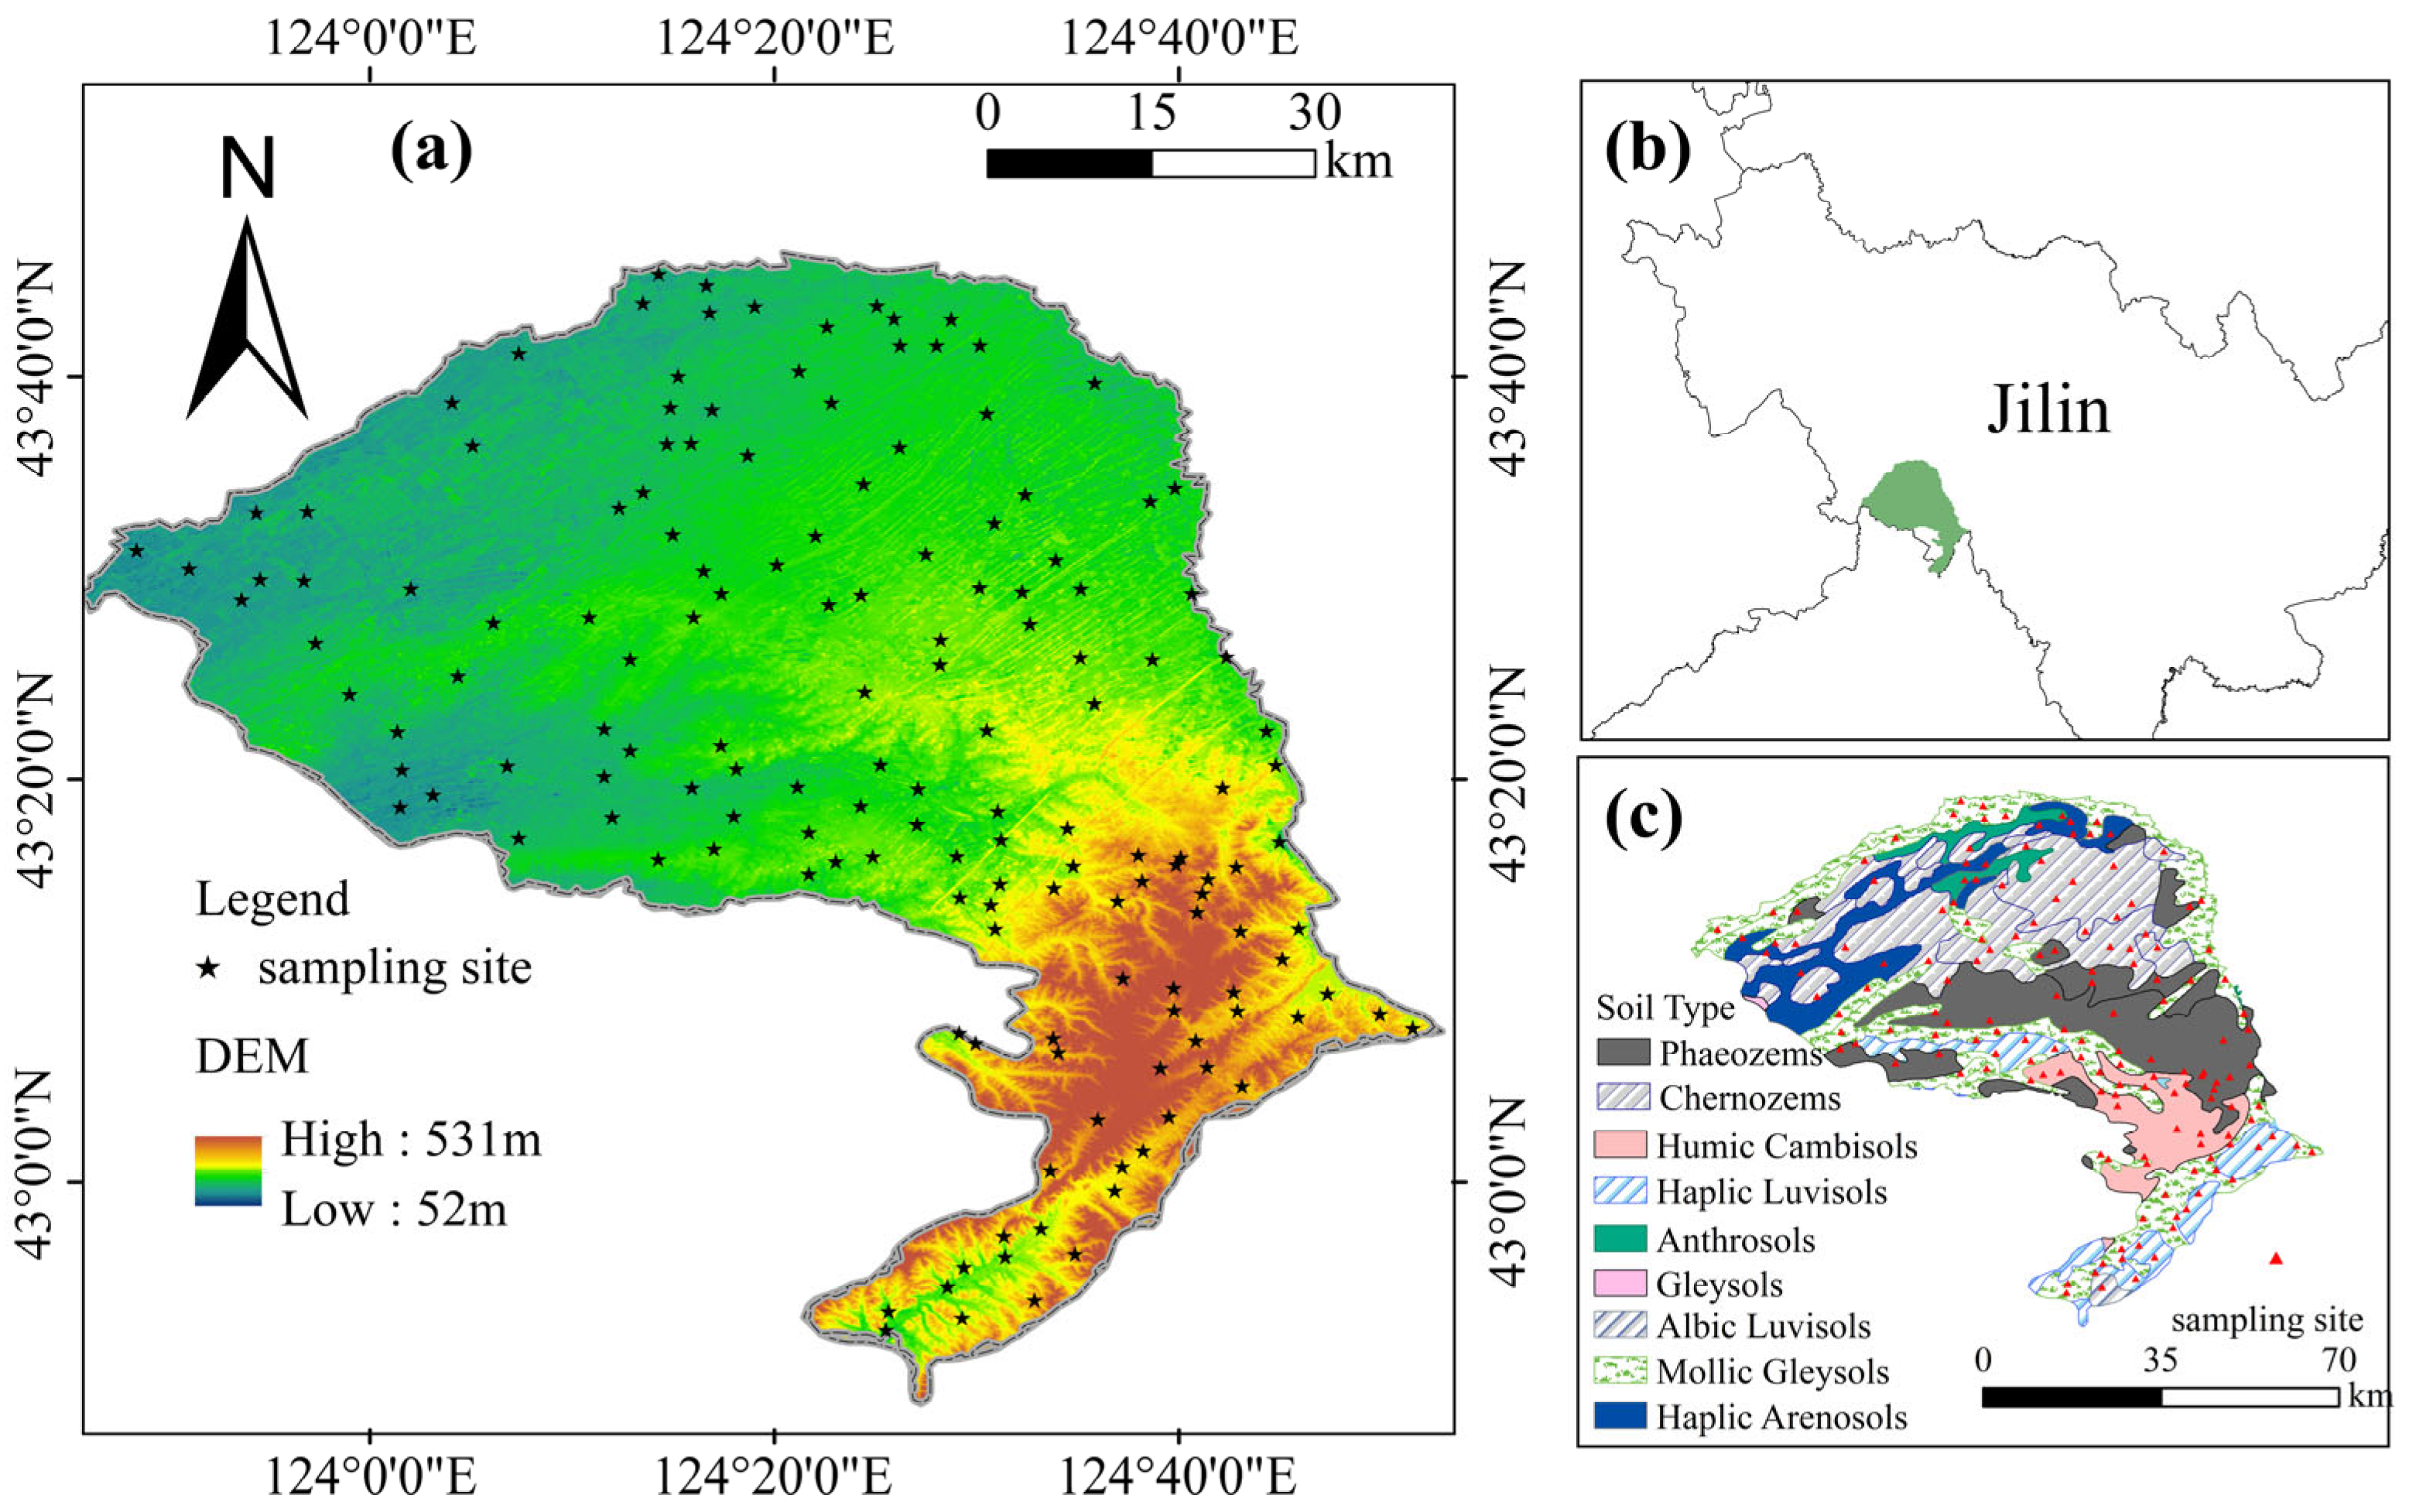
Figure 1. Sampling sites. (a) Geographic locations of sampling sites in Lishu County and the digital elevation model. (b) Geographic locations of Lishu County in Jilin Province. (c) Soil type map in Lishu County.
Remotesensing 17 02510 g001
Figure 2. Schematic (a) and picture (b) showing the custom-built multi-angle observation system (MAOS).
Remotesensing 17 02510 g002
Figure 3. Method flowchart.
Remotesensing 17 02510 g003
Figure 4. Particle size distribution (PSD) for 154 soil samples.p (a) Measured cumulative PSDs. (b) Comparison between measured and predicted accumulated proportion for PSD.
Remotesensing 17 02510 g004
Figure 5. Variation in soil BRFs with viewing angle. (ac) show the variation in soil reflectance with view zenith angles (VZAs) for sites LS35, LS63, and LS120, respectively. Positive and negative VZAs indicate the forward and backward directions. (df) show the variation in soil reflectance with relative view azimuthal angles (VAAs) for sites LS35, LS63, and LS120, respectively. (gi) show polar plots of BRFs for three sampling sites (LS35, LS63, and LS120) with different soil properties at a wavelength of 800 nm.
Remotesensing 17 02510 g005
Figure 6. Effect of viewing angle on selection of spectral preprocessing method and soil property retrieval algorithm. (a,b) show the variation in R2 with different combinations of ten spectral preprocessing methods and three retrieval algorithms based on multi-angle soil BRFs for SOM and PSD, respectively. (c,d) show the variation in R2 with different combinations of ten spectral preprocessing methods and three retrieval algorithms based on 48 individual viewing angle BRFs for SOM and PSD, respectively.
Remotesensing 17 02510 g006
Figure 7. Effect of viewing angle on the selection of sensitive wavelengths. (a,b) show the distribution of sensitive wavelengths with different VZAs for SOM and PSD, respectively, based on 48 individual viewing angle BRFs. (c,d) show the distribution of sensitive wavelengths with different VAAs for SOM and PSD, respectively, based on 48 individual viewing angle BRFs. (e,f) show the distribution of sensitive wavelengths for SOM and PSD, respectively, based on multi-angle BRFs and 48 individual viewing angle BRFs.
Remotesensing 17 02510 g007
Figure 8. Effect of viewing angle on retrieval accuracy for SOM and PSD. (ad) show the variations in R2, RMSE, RPD, and RPIQ with VZAs based on soil BRFs from 48 individual viewing angles for SOM and PSD, respectively. (eh) show the variations in R2, RMSE, RPD, and RPIQ with relative VAAs based on soil BRFs from 48 individual viewing angles for SOM and PSD, respectively.
Remotesensing 17 02510 g008
Table 1. Properties of soil sampling sites.
VariationNumber
Soil typePhaeozems29
Chernozems27
Albicc Luvisols1
Mollic Gleysols54
Humic Cambisols14
Haplic Arenosols13
Haplic Arenosols12
Anthrosols4
Slope positionHilltop17
Upper slope38
Middle slope31
Downslope41
Footslope27
Land useDryland144
Paddy10
Table 2. Angular measurement statistics.
Relative View Azimuthal AngleView Zenith Angle
5°; 10°; 20°; 30°; 50°; 60°
30°5°; 10°; 20°; 30°; 40°; 50°; 60°
60°5°; 10°; 20°; 30°; 40°; 50°; 60°
90°5°; 10°; 20°; 30°; 40°; 50°; 60°
120°5°; 10°; 20°; 30°; 40°; 50°; 60°
150°5°; 10°; 20°; 30°; 40°; 50°; 60°
180°5°; 10°; 20°; 30°; 40°; 50°; 60°
Table 3. Predefined ranges of hyperparameters for three modeling algorithms.
ModelKey ParameterRange
PLSLatent Variables (LVs)[2, 15]
SVMPenalty Factor[1, 5]
Radial Basis Function[1, 5]
Epsilon[0.001, 0.1]
CNNFilters[3, 8, 16, 32]
Kernel Size[1, 5]
Learning Rate[0.01, 0.1]
Disclaimer/Publisher’s Note: The statements, opinions and data contained in all publications are solely those of the individual author(s) and contributor(s) and not of MDPI and/or the editor(s). MDPI and/or the editor(s) disclaim responsibility for any injury to people or property resulting from any ideas, methods, instructions or products referred to in the content.