1. Introduction
Accurate monitoring of vegetation dynamics is essential for agricultural productivity, resource management, and food security. Optical remote sensing data have generally been used for this purpose due to their ability to represent vegetation greenness and growth status [
1,
2]. However, optical sensors are limited by cloud cover, atmospheric effects, and inconsistent illumination, which often hinder timely observations during critical crop growth stages. In addition, they suffer from saturation issues and exhibit similar spectral characteristics across different crop types [
3]. As a complementary data source, Synthetic Aperture Radar (SAR) has become increasingly important and is now widely integrated with optical data for agricultural monitoring, with all-weather, day-and-night imaging capabilities. In particular, SAR is highly sensitive to both soil properties and vegetation structures, demonstrating correlations with various biophysical parameters of plants depending on the operating frequency [
4,
5,
6]. Regarding soil properties, SAR data are responsive to soil roughness and soil moisture, making them valuable for soil moisture estimation alongside passive microwave sensors [
7,
8]. In terms of vegetation properties, SAR has been widely applied for biomass estimation, with longer-wavelengths being more suitable for forested regions, while shorter-wavelengths are better suited for low-vegetation and agricultural regions [
5,
9]. Given these strengths, SAR has become an essential tool in agricultural remote sensing, and its integration with optical data is increasingly pursued to overcome the limitations of each sensor type and enhance the accuracy and robustness of vegetation monitoring.
Advances in SAR sensor systems and processing techniques, such as multi-look processing, speckle noise filtering, and terrain correction, have significantly mitigated noise and fluctuations, which often make SAR data difficult to interpret directly and limit the applicability of SAR-derived variables [
10,
11,
12,
13]. Additionally, multi-polarization techniques have improved the extraction of biophysical information on land compared to single-polarization techniques [
14,
15,
16]. Despite these improvements, SAR data still face persistent challenges in agricultural applications due to backscatter anomalies, particularly those caused by precipitation events. These anomalies, including sudden signal spikes, can distort retrievals of biophysical parameters and are often linked to changes in the dielectric properties of soil and vegetation surfaces during and after rainfall [
17,
18]. The dielectric constants of soil surfaces dramatically increase due to rain, as do the reflection coefficients of vegetated surfaces, even after the event, resulting in a gain difference of up to 7 dB between wet and dry conditions [
4,
19,
20]. While several studies have highlighted the effects of rain on SAR data, approaches to mitigate precipitation-induced noise remain limited compared to the widespread adoption of cloud-removal techniques in optical remote sensing [
18]. A straightforward approach involves flagging rainy conditions during satellite passes and excluding such data; however, this simple Quality Assessment (QA) flagging method addresses only the immediate impact of precipitation, without consideration for any time lag due to the infiltration of water into the surface and water retention on leaves and branches. The broader relationship between historical rainfall patterns and SAR data has not been comprehensively studied, leaving room for further investigation.
When utilizing SAR data for agricultural crop monitoring, cross-polarization backscattering coefficients (HV or VH) have been widely employed due to their high sensitivity to vegetation characteristics, particularly during the growing season when canopy structure and water content vary dynamically. These cross-polarized signals are influenced by direct scattering from vegetation structure components, volume scattering from randomly oriented leaves and branches, and multiple scattering within the canopy [
21]. Co-polarized backscattering coefficients (VV or HH) have also been employed for biomass mapping alongside cross-polarization; however, they generally exhibit weaker correlations with biophysical parameters compared to cross-polarization. VV polarization, in particular, is highly sensitive to the vertical structure of vegetation, especially when the width or diameter of the plants is much smaller than the wavelength, resulting in significant variation during the agricultural growing season as crops grow vertically. All polarization channels are directly affected by rainfall and also by changes in soil moisture caused by rainfall, making it important to account for these effects when analyzing SAR signals in agricultural applications. C-band and L-band SAR data, with their moderate wavelength, are particularly effective for agricultural research as it balance the sensitivity to crop canopy structures and soil conditions [
22,
23]. Although several L-band SAR systems, such as PALSAR-3 are available, their limited data accessibility and lack of consistent free coverage constrain their applicability for large-scale studies [
24]. Currently, Sentinel-1 C-band SAR data is the only operationally consistent dataset that offers suitable spatial and temporal resolution for large-scale agricultural monitoring. Its wide availability and reliability make it an essential resource. In addition, for first-layer vegetated regions typical of most crops, C-band SAR demonstrates greater sensitivity to the leaf canopy than L-band, making it more suitable for crop monitoring applications [
25].
Over the past two decades, various polarimetric coherence parameters and radar-based vegetation indices have been developed to improve vegetation mapping [
26,
27]. Numerous studies have compared the performance of these indices, such as the Radar Vegetation Index (RVI) and Polarimetric Radar Vegetation Index (PRVI), PRVI and Dual Polarimetric Radar Vegetation Index (dpRVI) [
28,
29,
30]. Most radar vegetation indices (RVIs), including Entropy and Degree of polarization (DOP), which are influenced by depolarization effects caused by volume scattering, exhibit characteristics similar to simple cross ratios (CRs, cross-pol/co-pol), and they tend to show high levels of noise at biomasses under 0.7 kg/m
2 [
28]. Among them, PRVI is distinct in that it enhances the cross-polarization (VH) component, enabling better performance in low-biomass areas compared to other RVIs. However, a notable limitation of PRVI is that its values are not bounded within a fixed range, such as 0 to 1, which complicates its integration with optical vegetation indices. Recently, the Normalized Polarimetric Radar Vegetation Index (NPRVI) was introduced, incorporating scaling normalization based on a statistical analysis of vegetation across the Contiguous United States (CONUS) [
31]. NPRVI not only improves the efficiency of latent variable utilization in machine learning through normalization but also helps maintain model accuracy in PRVI-based models by constraining minimum values, especially in sparsely vegetated areas where VH values are extremely low and errors are more likely to occur. Additionally, its normalized range and trend characteristics enhance its potential comparability with optical vegetation indices, supporting integrated analyses and making NPRVI particularly suitable for vegetation monitoring applications.
Despite ongoing efforts to improve the usability of SAR data, the impact of precipitation on radar signals remains insufficiently studied. While the overall impact of rainfall on SAR observations is well recognized, most existing correction methods rely solely on satellite overpass timing and overlook short-term precipitation events. Furthermore, studies on the temporal dynamics between precipitation and SAR signal variation are limited, leaving a critical gap in understanding and correction strategies. To address these gaps, this study investigates the temporal sensitivity of a radar-based vegetation index to precipitation using both in situ measurements and Global Precipitation Measurement (GPM) datasets [
32]. Specifically, we quantify the magnitude and duration of rainfall-induced impacts on radar signals and evaluate the effectiveness of in situ and GPM data for identifying and correcting precipitation-affected observations. This research contributes to enhancing the utility of SAR data by (1) quantifying precipitation effects, (2) developing a scalable quality assessment framework, and (3) proposing an adjustment method for generating analysis-ready SAR datasets with enhanced interoperability with optical data.
2. Materials and Methods
2.1. Study Area and Precipitation Data
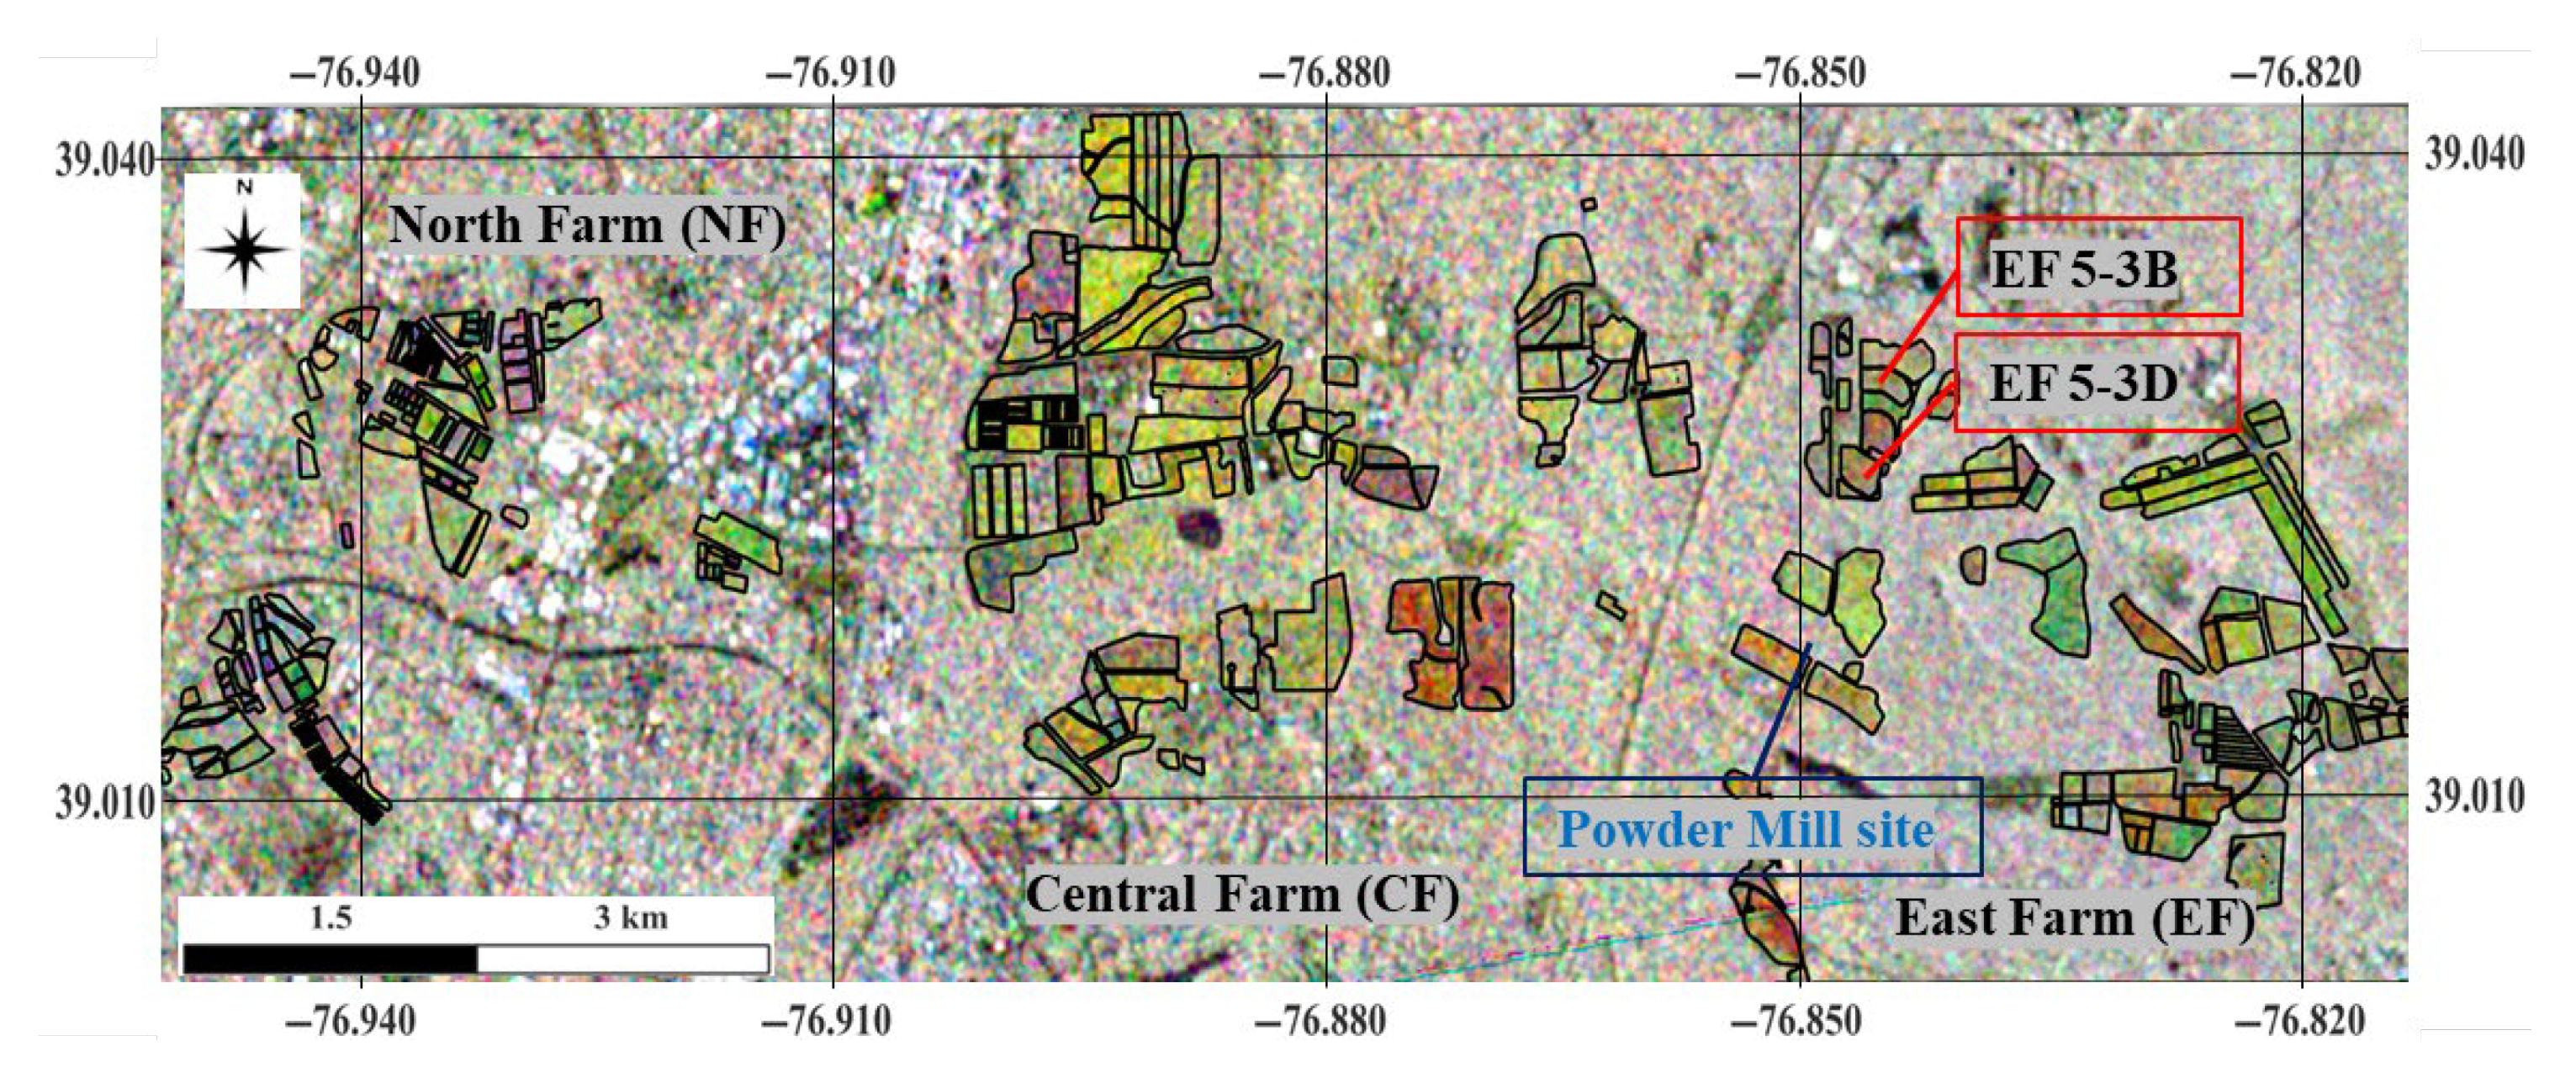
The Beltsville Agricultural Research Center (BARC), a leading USDA research facility, is located in Beltsville, Maryland.
Figure 1 shows the RGB composite of NPRVI values derived from multi-temporal Sentinel-1 data (R: July 2023, G: September 2023, B: May 2023) for study sites with the shapefile. Spanning over 6500 acres, BARC is renowned for its extensive research in crop production, animal health, and environmental sustainability. Field measurements showed that the volumetric soil moisture contents of vegetation areas varied between approximately 0.07 and 0.35 cm
3/cm
3 [
33,
34,
35].
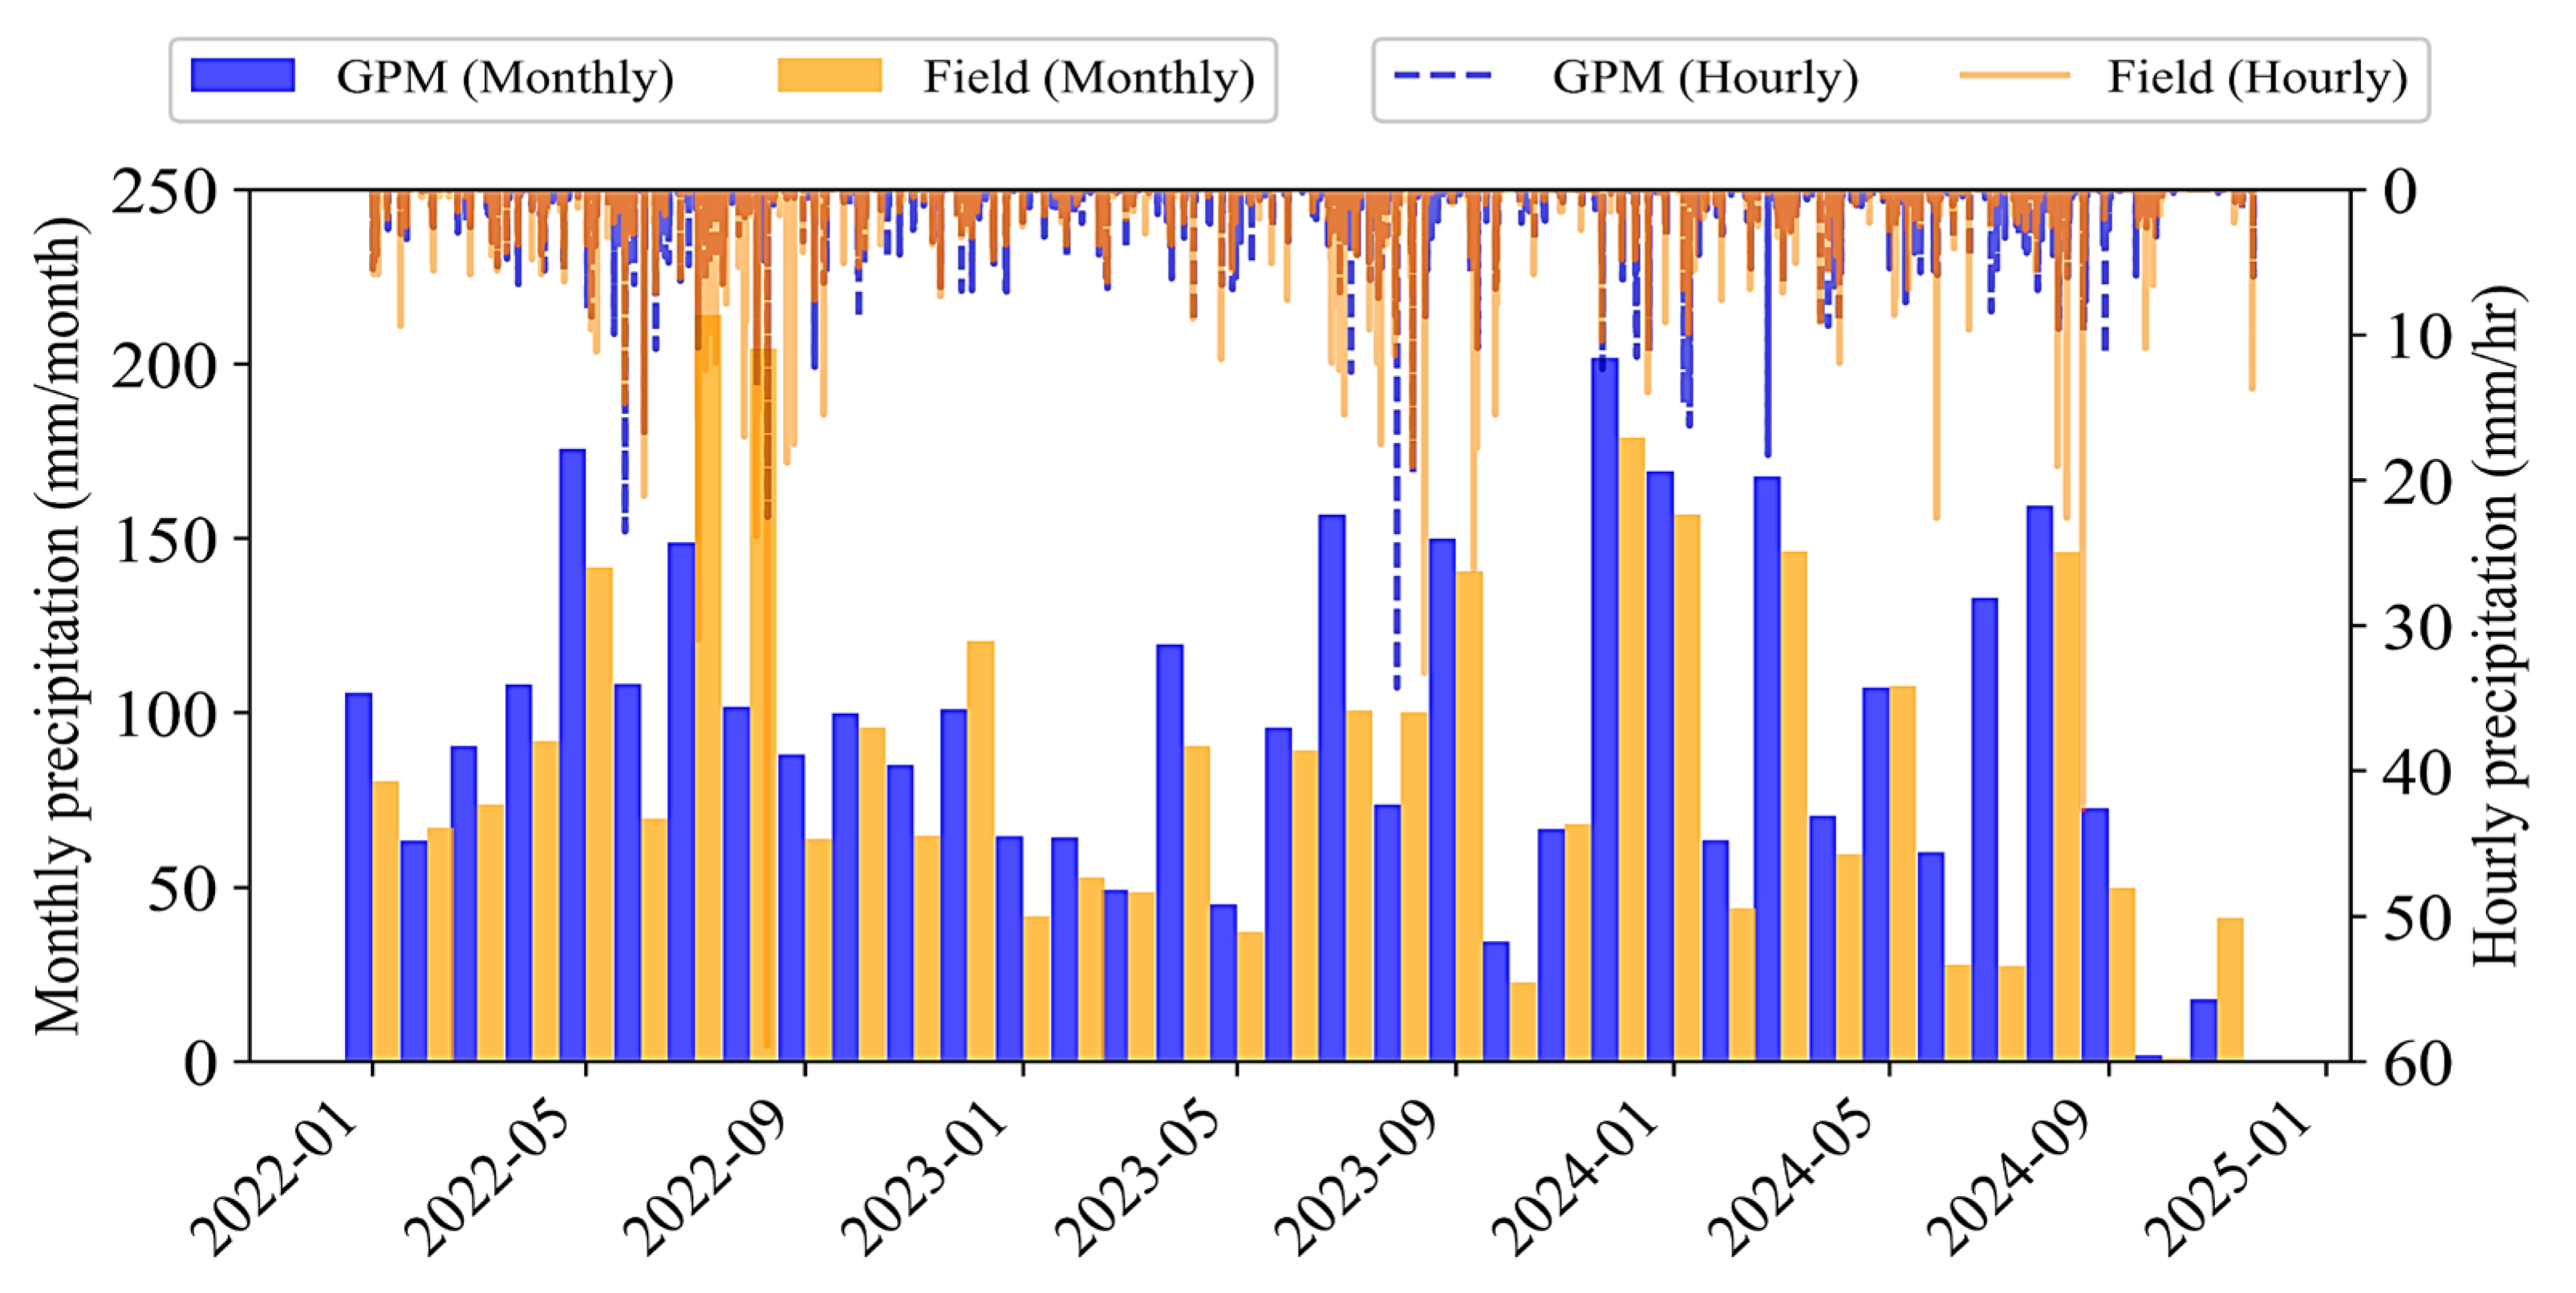
On-site precipitation data were recorded at the Powder Mill site by the Natural Resources Conservation Service (NRCS) within the BARC field, capturing hourly rainfall intensity (mm/h). These field-based observations supported a detailed analysis of precipitation timing and its effects on SAR-based agricultural monitoring. To complement the field measurements, Global Precipitation Measurement (GPM) data were used, spanning from January 2022 to November 2024. GPM, an international mission led by NASA and JAXA, provides global precipitation estimates every three hours. These estimates are derived using the Integrated Multi-satellite Retrievals for GPM (IMERG) algorithm Version 07, which combines data from passive microwave sensors, microwave-calibrated infrared (IR) satellite observations and precipitation gauge analyses [
24]. To align with the field-based temporal resolution, GPM half-hourly data were aggregated into hourly rainfall rates (mm/h), and monthly precipitation accumulations (mm/month) were computed to assess broader seasonal patterns. While the spatial resolution is relatively coarse at approximately 11,132 m, research-level accuracy is achieved through monthly gauge adjustments, which correct satellite-derived estimates using ground-based rain gauge data to reduce bias and improve reliability over land.
Figure 2 illustrates both the timing of precipitation events and the monthly accumulated precipitation from GPM and in situ sources. The error metrics reveal that the monthly root mean square error (RMSE) is 34.10 mm, with a mean bias error (MBE) of 10.13 mm. At the daily scale, the RMSE and MBE are 6.86 mm and 0.34 mm, respectively. Overall, the GPM data show good agreement with the field measurements, except for discrepancies observed in August and September 2022 and August 2024.
2.2. Normalized Polarimetric Radar Vegetation Index (NPRVI)
This study utilizes Sentinel-1 (S1) C-band dual-polarization data (VV and VH), derived from the Ground Range Detected (GRD) product with a spatial resolution of 10 m by 10 m, accessed and processed through the Google Earth Engine (GEE) platform. The analysis focuses on the East Coast of the United States, where Sentinel-1 observations are generally available from ascending orbits on a 12-day repeat cycle. Notably, the study site contains a satellite overpass overlap region over the East Farm fields, allowing for more frequent acquisitions on a 6-day repeat cycle.
The S1 satellite passed over the study area around 11:00 PM Coordinated Universal Time (UTC), corresponding to 5:00 PM to 6:00 PM Eastern Standard Time (EST). Due to the limited coverage of Sentinel-1 over the Central Farm (CF), the East Farm (EF) area was primarily selected as the study site. A total of 167 images, acquired in ascending mode with a 6-day revisit interval, were collected between January 2022 and November 2024.
The NPRVI is derived from the PRVI, which enhances cross-polarization characteristics by combining cross-polarization with the complement of the Degree of Polarization (DOP), as expressed in the following equation:
where ‘
’ denotes the ensemble average, and
indicates the cross-polarization backscattering coefficients, the DOP represents the degree of polarization of VV&VH, which can be estimated under the assumption of homogeneity [
15,
28]:
The NPRVI for C-band, NPRVI_C, is then calculated using the following equation, which enhances the PRVI by normalizing the values within the constrained range of 0 to 1 [
31]:
where ‘
’ denotes the range factor and ‘
’ is the calibration factor for the C-band; the RF and CF are 1.948 and 3.202, respectively.
2.3. Analysis of Precipitation Effects on Radar Parameters by Radiative Transfer Model (RTM)
As a preliminary analysis of the effects of precipitation on radar parameters, a theoretical model was evaluated. Representing these effects using the full wave equation is infeasible due to the complexity of internal variables. The first-order Radiative Transfer Model (RTM), a well-known theoretical model, was utilized as it provides a limited but valuable representation of the interaction mechanisms, offering initial insights into the impacts of precipitation on vegetation and soil surfaces [
4]. The first-order RTM equation is expressed as:
where
represents the total backscatter coefficient. Each term corresponds to a distinct scattering contribution, including vegetation-only backscatter (
), soil–vegetation interaction (
), vegetation–soil interaction (
), multiple interactions (
), and soil-only backscatter (
).
Equation (4) can be explicitly expressed in the following form:
where
or
denotes v- or h- polarization,
is the incidence angle, and
represents the element of the transformation matrix, corresponding to the pq polarization. The 4 × 4 transformation matrix can be computed with the canopy scattering matrix, the eigen matrix, the diagonal extinction matrix, the reflectivity matrix, the phase matrix, and the Stokes scattering operator matrix [
4,
36,
37].
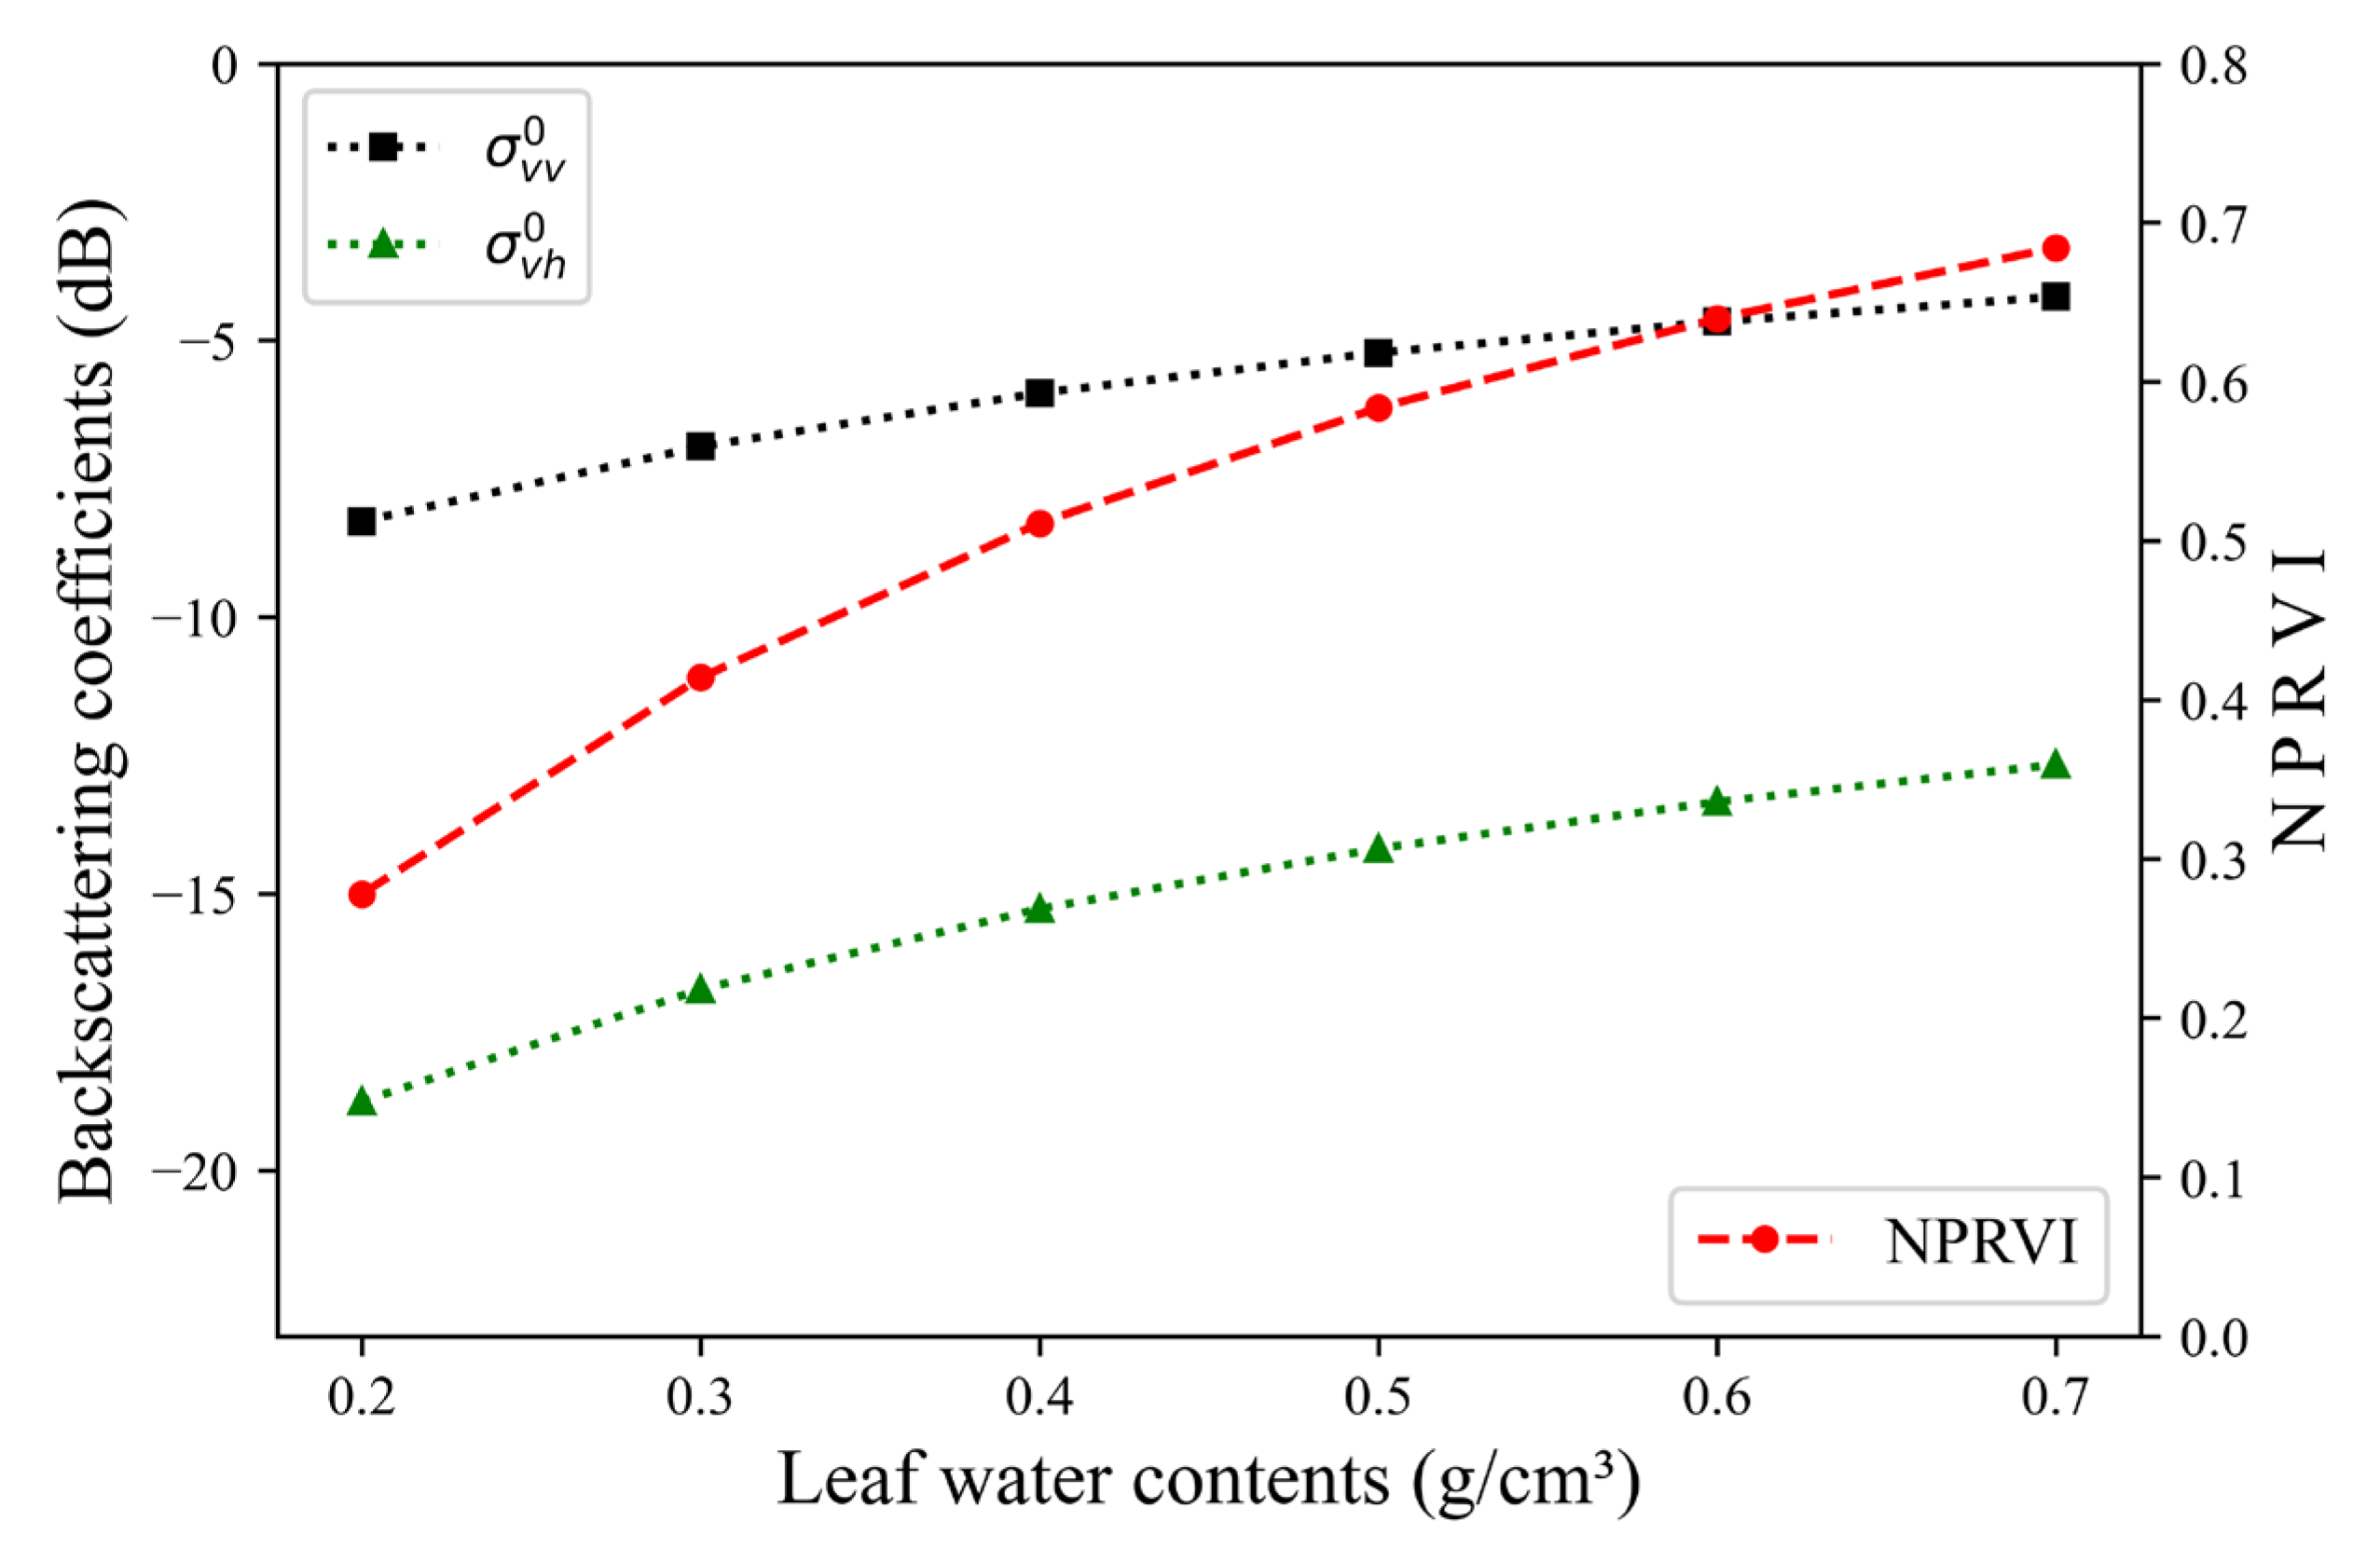
When it rains or just right after the rain, a water film forms on leaves and branches, their water content increases, and the dielectric properties of soil surfaces are altered due to the precipitation. The water film on leaves and branches increases rapidly but saturates quickly because its thickness that can be accumulated is limited, with excess water flowing down to the surface. In contrast, the water content of leaves and branches increases more gradually and continues to rise even after the rainfall has ceased. Similarly, the dielectric constant of soil surfaces, which increases almost linearly with soil moisture content, responds more slowly to precipitation compared to the water film effect on vegetation. Within the RTM, precipitation influences several variables, including the reflectivity matrix, eigen matrix, diagonal extinction matrix, and scattering matrix. However, accounting for all these changes within the model is highly complex. As a result, the simulation focused on varying key parameters, such as leaf water content and soil moisture, which have the most significant impact on the backscattering coefficient and are reflected across multiple matrices.
For the input variables of vegetation and soil parameters in the RTM, a C-band frequency of 5.4 GHz and a 30° incidence angle were used, along with previously measured in situ corn field parameters [
37]. These include an average leaf thickness of 0.0002 m, a canopy height of 2.5 m, a leaf density of 96 leaves/m
2, an average leaf width of 0.104 m, a leaf length of 0.834 m, a stem density of 8 stems/m
2, an average stem diameter of 0.0233 m, a soil surface roughness height of 0.030 m, and a correlation length of 0.0523 m. It was assumed that vegetation structure, vegetation density, and soil roughness remain unchanged, even during rainfall. The parameter ranges for leaf water content (0.2 to 0.7) and soil moisture (0.10 to 0.35 cm
3/cm
3) were defined based on observed values at the study site and supplemented by literature on similar crop types such as corn, reflecting typical variability under precipitation conditions [
37,
38].
Figure 3 shows the variations in radar parameters simulated by the RTM in response to changes in leaf water content/layer and soil moisture content based on these field-derived ranges. The VV-polarized backscatter rose by approximately 4 dB, while the VH-polarized backscatter increased by 6 dB. The NPRVI values, derived from (1)–(3), increased by 0.4. These findings emphasize the vulnerability of radar parameters to precipitation, resulting in significant variability that is independent of vegetation growth. This vulnerability highlights the critical need to consider or adjust for precipitation-induced noise in radar-based monitoring systems, ensuring more reliable data interpretation and application.
While the RTM offers valuable theoretical insights, its limitations highlight the need for additional field-based analysis and practical applications to reinforce its findings. To assess the impact of precipitation on radar parameters, both GPM and field-measured precipitation data were temporally aligned with Sentinel-1 acquisition times. This co-registration was achieved by rounding the acquisition times to the nearest 30 min interval for GPM data and to the nearest hour for field data, ensuring synchronization with the respective temporal resolutions.
2.4. Quality Assessment of NPRVI and Adjustment
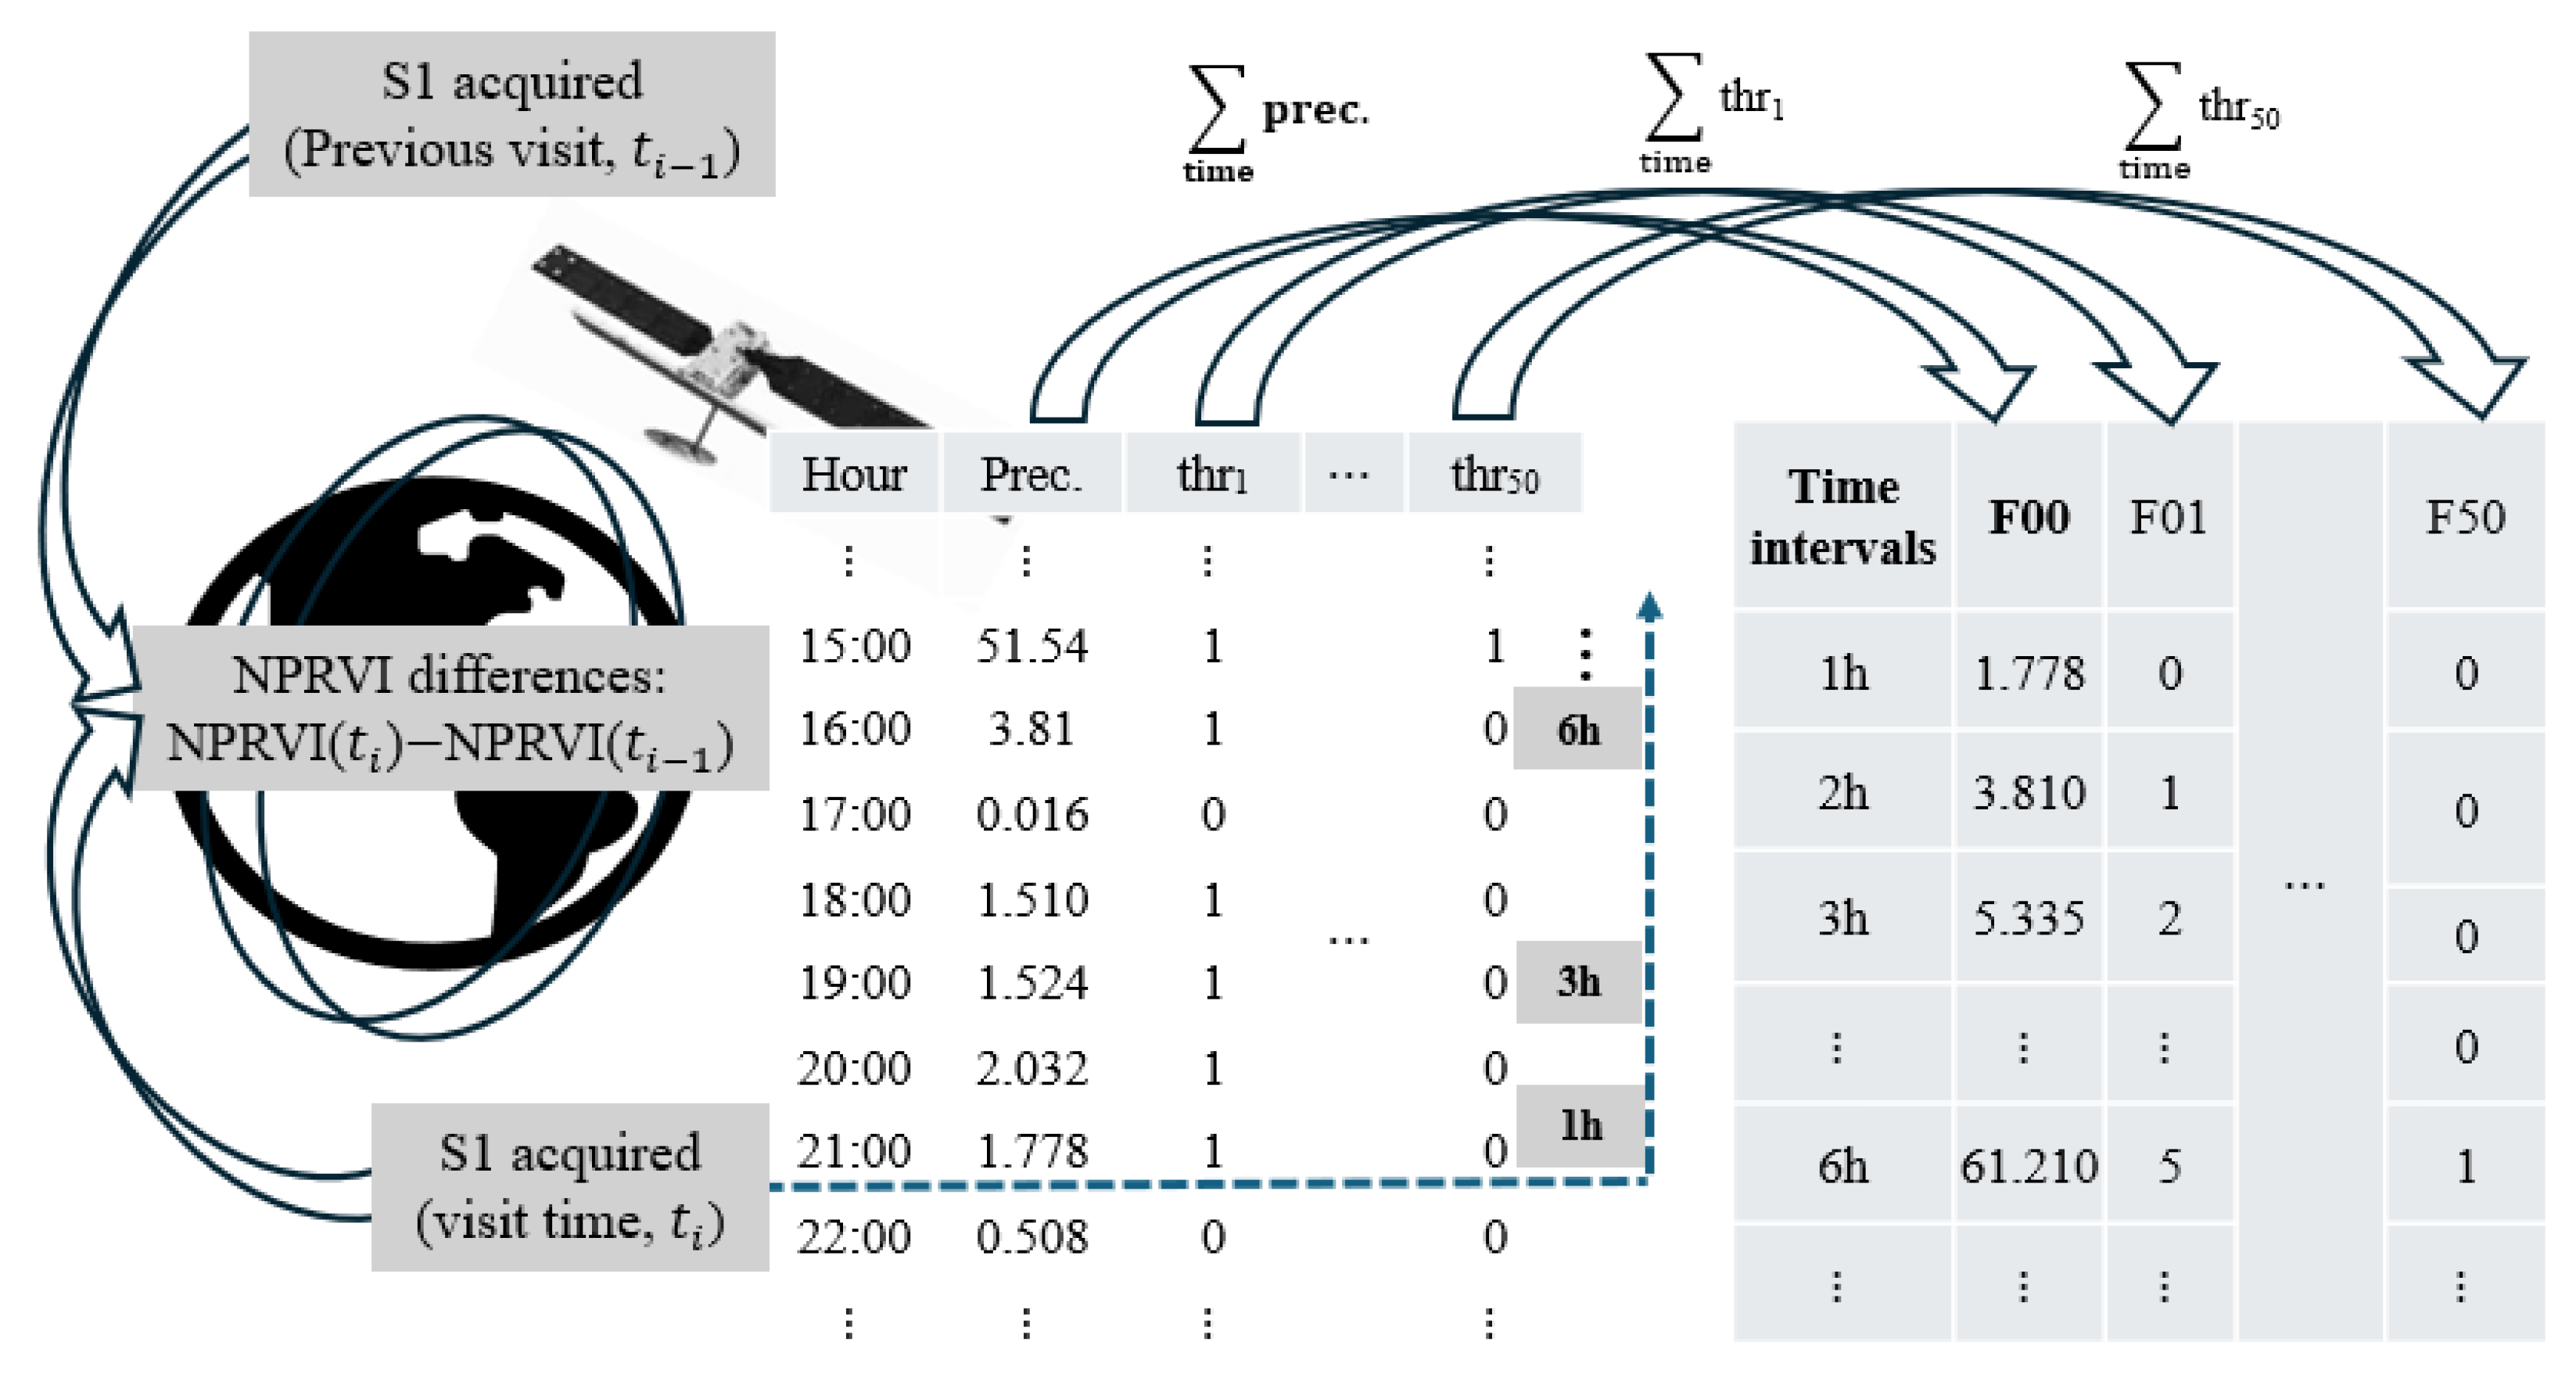
To investigate the sensitivity of radar parameters to precipitation amounts, the raw precipitation amount (mm/h) observed at the SAR overpass time, along with accumulated rainfall prior to the overpass, was defined as “-00” in
Figure 4. This dataset captures both instantaneous rainfall and its accumulation effect on radar signals, enabling an evaluation of the correlation between NPRVI differences (i.e., between the last SAR acquisition and the current SAR overpass) and rainfall intensity. To address the temporal mismatch between radar acquisition and precipitation events, hourly precipitation data were aligned to the hours preceding each SAR overpass. For instance, if the SAR passed at 6:10 PM, hourly precipitation values at 6:00 PM, 5:00 PM, 4:00 PM, etc., were examined. This approach captures the residual effects of rainfall and supports an analysis of how recent precipitation influences radar backscatter and vegetation index responses. Furthermore, binary threshold exceedance datasets (e.g., thrX, with X being a precipitation threshold in mm) were generated. These datasets enabled controlled analyses of precipitation impacts by applying specific thresholds at 1, 3, 5, 10, 30, and 50 mm, allowing the assessment of NPRVI sensitivity under varying rainfall intensities. Iterative correlation analyses were computed using these binary threshold exceedance datasets. “F—” refers to field-based precipitation measurements, while GPM-based precipitation datasets were similarly labelled as “GPM—”.
This methodology enabled a comprehensive assessment of the temporal sensitivity of radar parameters to precipitation events and the impact of varying rainfall intensities on radar parameters.
Building upon the prior analyses, a quality assessment (QA) framework was developed to detect and mitigate the impact of precipitation on the NPRVI. First, data points affected by precipitation were detected and flagged based on a sensitivity analysis using the Pearson correlation coefficient (r) and its associated
p-value to assess statistical significance. The Pearson correlation coefficient is defined as:
where
and
represents the paired values of precipitation and NPRVI difference,
and
are their respective means, and N is the number of observations.
Then, the NPRVI values on flagged dates were adjusted through interpolation. Specifically, simple linear interpolation and spline interpolation were applied to the flagged dates to fill gaps and smooth fluctuations caused by precipitation. Linear interpolation estimates missing values by connecting adjacent valid points with straight lines, ensuring continuity. Spline interpolation, on the other hand, fits a smooth curve through neighboring points, preserving temporal trends more effectively. Both methods help reconstruct NPRVI signals during periods influenced by rainfall. This approach assumes that NPRVI values generally change gradually over time in vegetated areas, except during precipitation events, allowing for reasonable estimation through interpolation.
Furthermore, to evaluate the performance and utility of GPM in comparison with field-measured precipitation data for flagging and adjusting the Sentinel-1 time series, the proposed approach was applied to both datasets. To further assess model performance and improvement, the root mean squared error (RMSE) and relative RMSE (rRMSE) were calculated. The formulas for these metrics are as follows:
where N is the total number of observations, and
is the observed value for the kth observation,
is the predicted value for the kth observation, and
is the mean of the actual observed values.
3. Results
3.1. Analysis of NPRVI
The NPRVI was calculated from 167 Sentinel-1images using Equations (1)–(3).
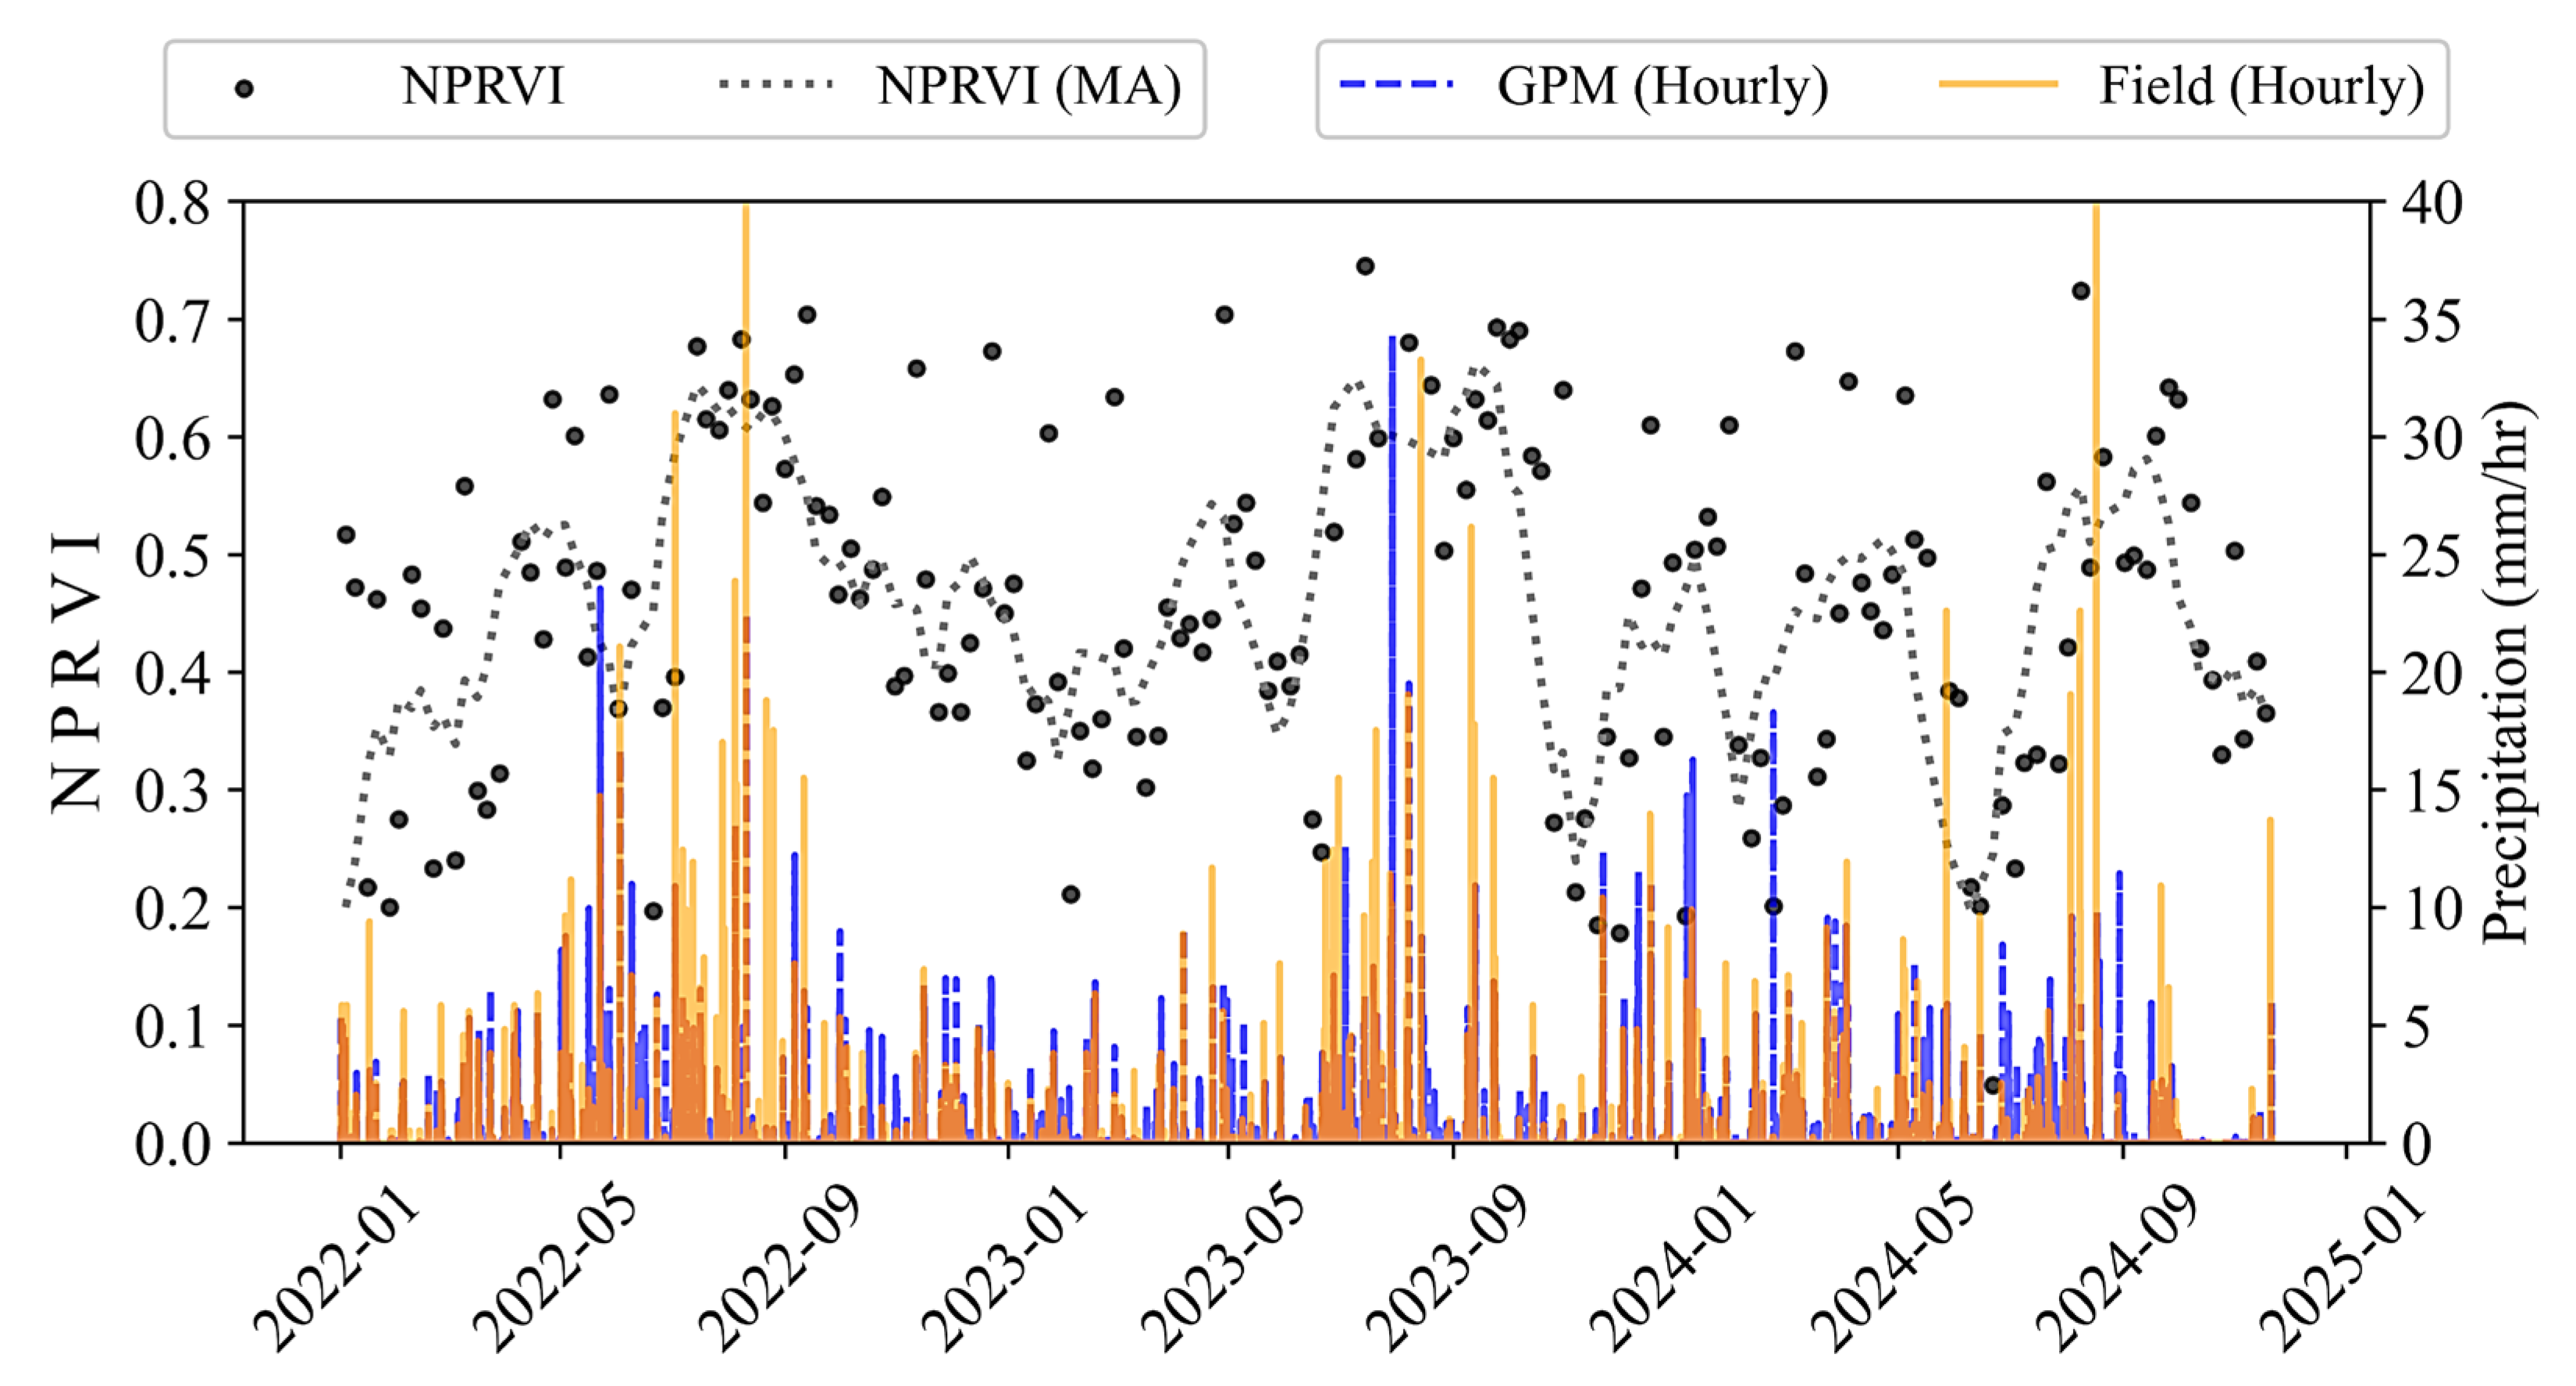
Figure 5 presents the NPRVI values and their moving average (MA) across five nearby dates at the EF 5-3B site, illustrating the trend alongside local precipitation data obtained from field measurements and GPM data. The MA of NPRVI effectively captures the phenological trends throughout the growing season; however, it also exhibits considerable noise across the entire season. This pattern remains consistent across all fields at BARC, suggesting that the main noise is not caused by artificial factors, such as agricultural machinery. Nevertheless, the figure does not establish a clear relationship between radar parameters and precipitation, emphasizing the necessity for further investigation.
3.2. Precipitation Effect on NPRVI and Sensitivity Analysis
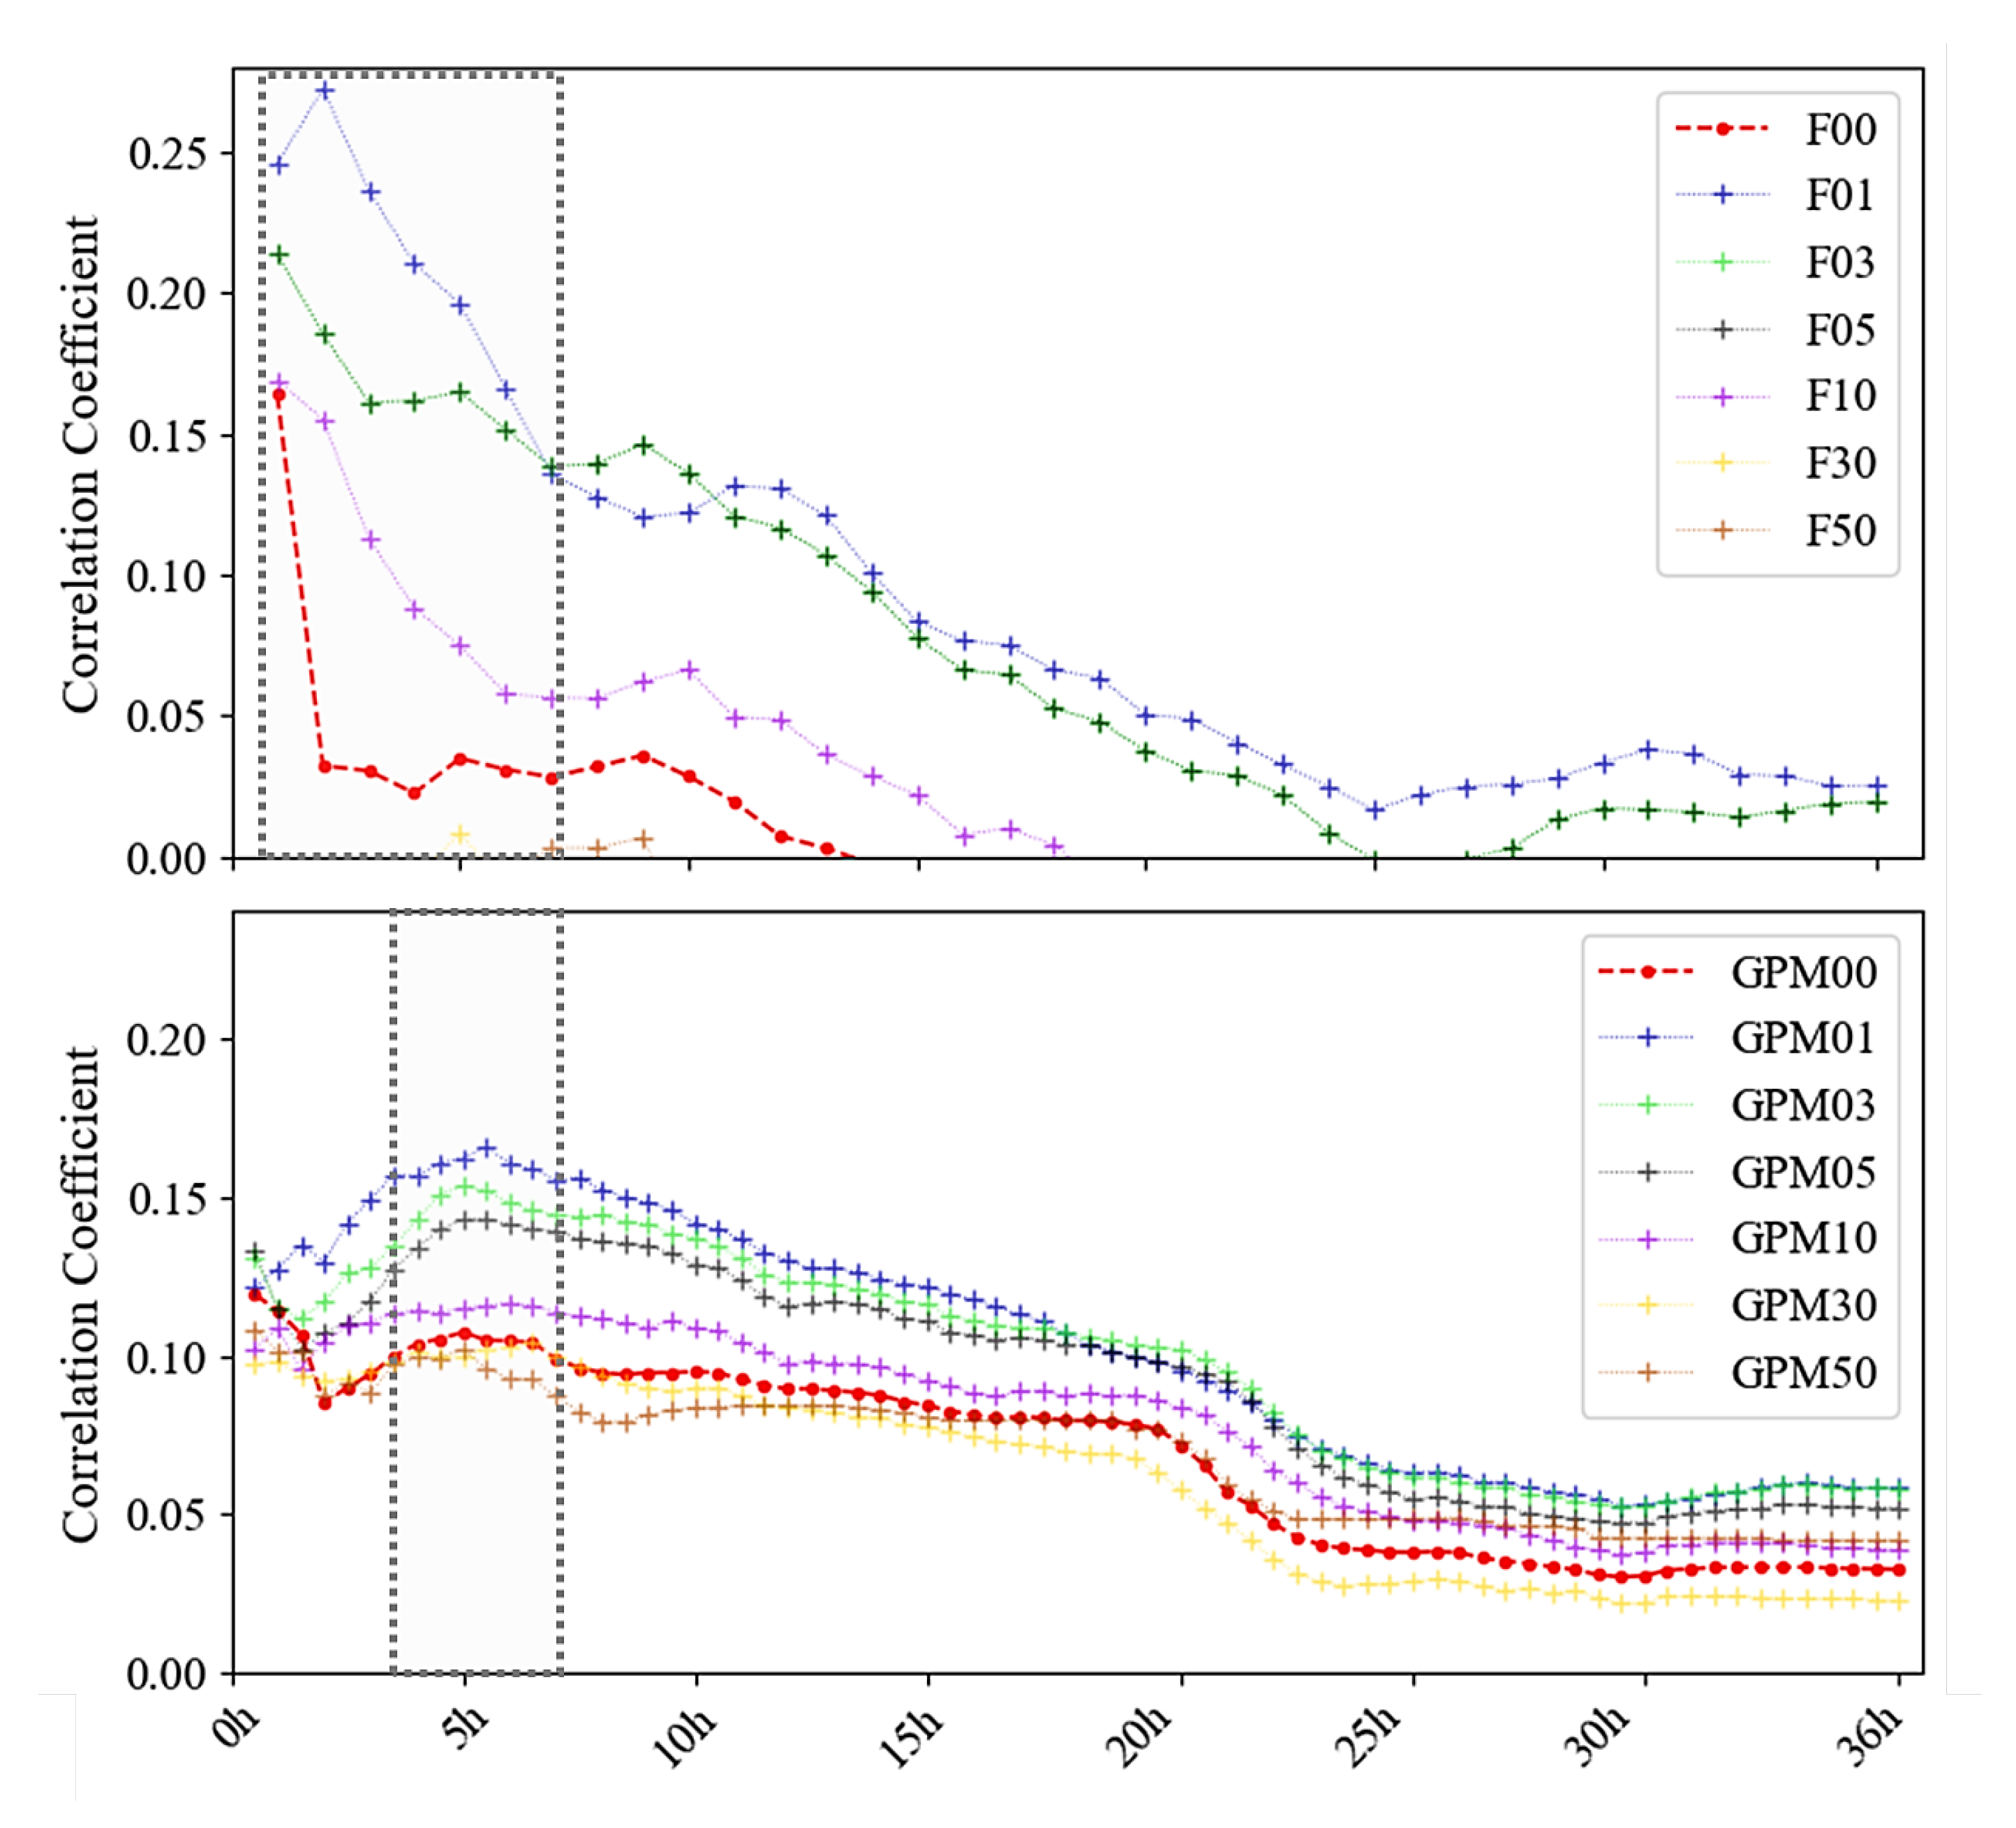
Figure 6 shows the relationship between NPRVI differences (NPRVI
−NPRVI
) and accumulated precipitation over varying time intervals, comparing field measurements (top) with GPM data (bottom). In the figure, the red label ‘-00’ represents raw accumulated precipitation, while labels ‘-01’ through ‘-50’ correspond to generated binary threshold exceedance datasets used to analyze sensitivity to different precipitation amounts, as shown in
Figure 4. Each point represents the correlation coefficient between NPRVI differences and the precipitation values from each dataset (‘F00’, ‘F01’, etc.), calculated over different time intervals. In general, the correlation coefficient was not high because NPRVI differences were influenced not only by precipitation but also by vegetation growth (biomass changes). However, this analysis highlights the relative sensitivity of NPRVI to precipitation.
For in situ field precipitation data, the results clearly show that the highest sensitivity to NPRVI occurs within the first hour (‘F00’). Notably, even minimal precipitation amounts, such as ‘>1 mm/h’ (‘F01’), show a high correlation with NPRVI, with similar correlations observed for ‘>3 mm/h’ (‘F03’). Greater precipitation (i.e., 30 mm) exhibits lower correlations with NPRVI, likely due to their infrequent occurrence at the sites (four times over the three years), resulting in insufficient observations to establish a robust relationship. Given the correlation coefficient of 0.16 (p ≈ 0.034) for raw precipitation (‘F00’) within 1 h, coupled with the consistent correlation coefficient of 0.15 (p ≈ 0.075) observed for ‘>1 mm/h’ (‘F01’) and ‘>3 mm/h’ (‘F03’) over 7 h, it can be inferred that precipitation within the 1–7 h timeframe prior to the satellite overpass exerts a substantial influence on NPRVI.
In contrast, GPM data demonstrate relatively weaker correlations within 3-hour intervals, primarily due to their coarser spatial resolution (approximately 11 km), which may fail to accurately represent localized precipitation. Although GPM shows weaker correlations over very short time intervals (e.g., <3 h), it still exhibits significant correlation with NPRVI within the 3–7 h window, which is consistent in trend with findings from in situ data. This indicates that GPM still holds application potential at this timescale, albeit possibly with lower accuracy than in situ data. Beyond 7 h, persistent correlations are likely attributable to the coarse spatial resolution of GPM data, suggesting that interpretations within this timeframe should be limited, as they may not accurately reflect field-scale precipitation dynamics.
These findings indicate that NPRVI values are highly sensitive to precipitation. Even minimal precipitation events (i.e., ‘> 1 mm/h’) occurring within the 7 h timeframe prior to a satellite overpass can significantly affect NPRVI. While GPM data have limitations due to their coarse spatial resolution, they prove effective for assessing precipitation impacts within the critical 3 to 7 h window, aligning with in situ measurements. This makes GPM data particularly valuable for remote sensing applications in regions without local precipitation measurement systems, such as in developing countries, where they can provide an essential resource for understanding precipitation-driven variations in radar observations.
3.3. Quality Assessment Flag by Precipitation Data
Table 1 presents the results of precipitation detection flags across varying time intervals (1 to 7 h) and the matching percentages between GPM and field precipitation data. Generally, GPM data tend to overestimate precipitation compared to field data due to their coarse spatial resolution, representing an average over wider geographic regions. The analysis reveals that during the 3 h to 7 h intervals (accumulating precipitation up to 7 h before the satellite pass), 28 to 41 out of 167 Sentinel-1 acquisitions (16.77% to 24.55%) were flagged as affected by precipitation, indicating their potential impact on radar signal quality. In other words, these flagged data points can introduce errors when monitoring agricultural regions using radar parameters and should therefore be carefully considered or appropriately adjusted. The 3 to 6 h interval demonstrated effective detection and alignment between the two datasets, achieving over 71% matching. The 6 h accumulated data showed the highest match rate at over 73% and was therefore utilized for QA flagging in both datasets.
3.4. Adjustment of NPRVI Based on QA Flag
Based on the quality assessment flag within the 6 h time interval shown in
Table 1, NPRVI values affected by precipitation were identified and adjusted.
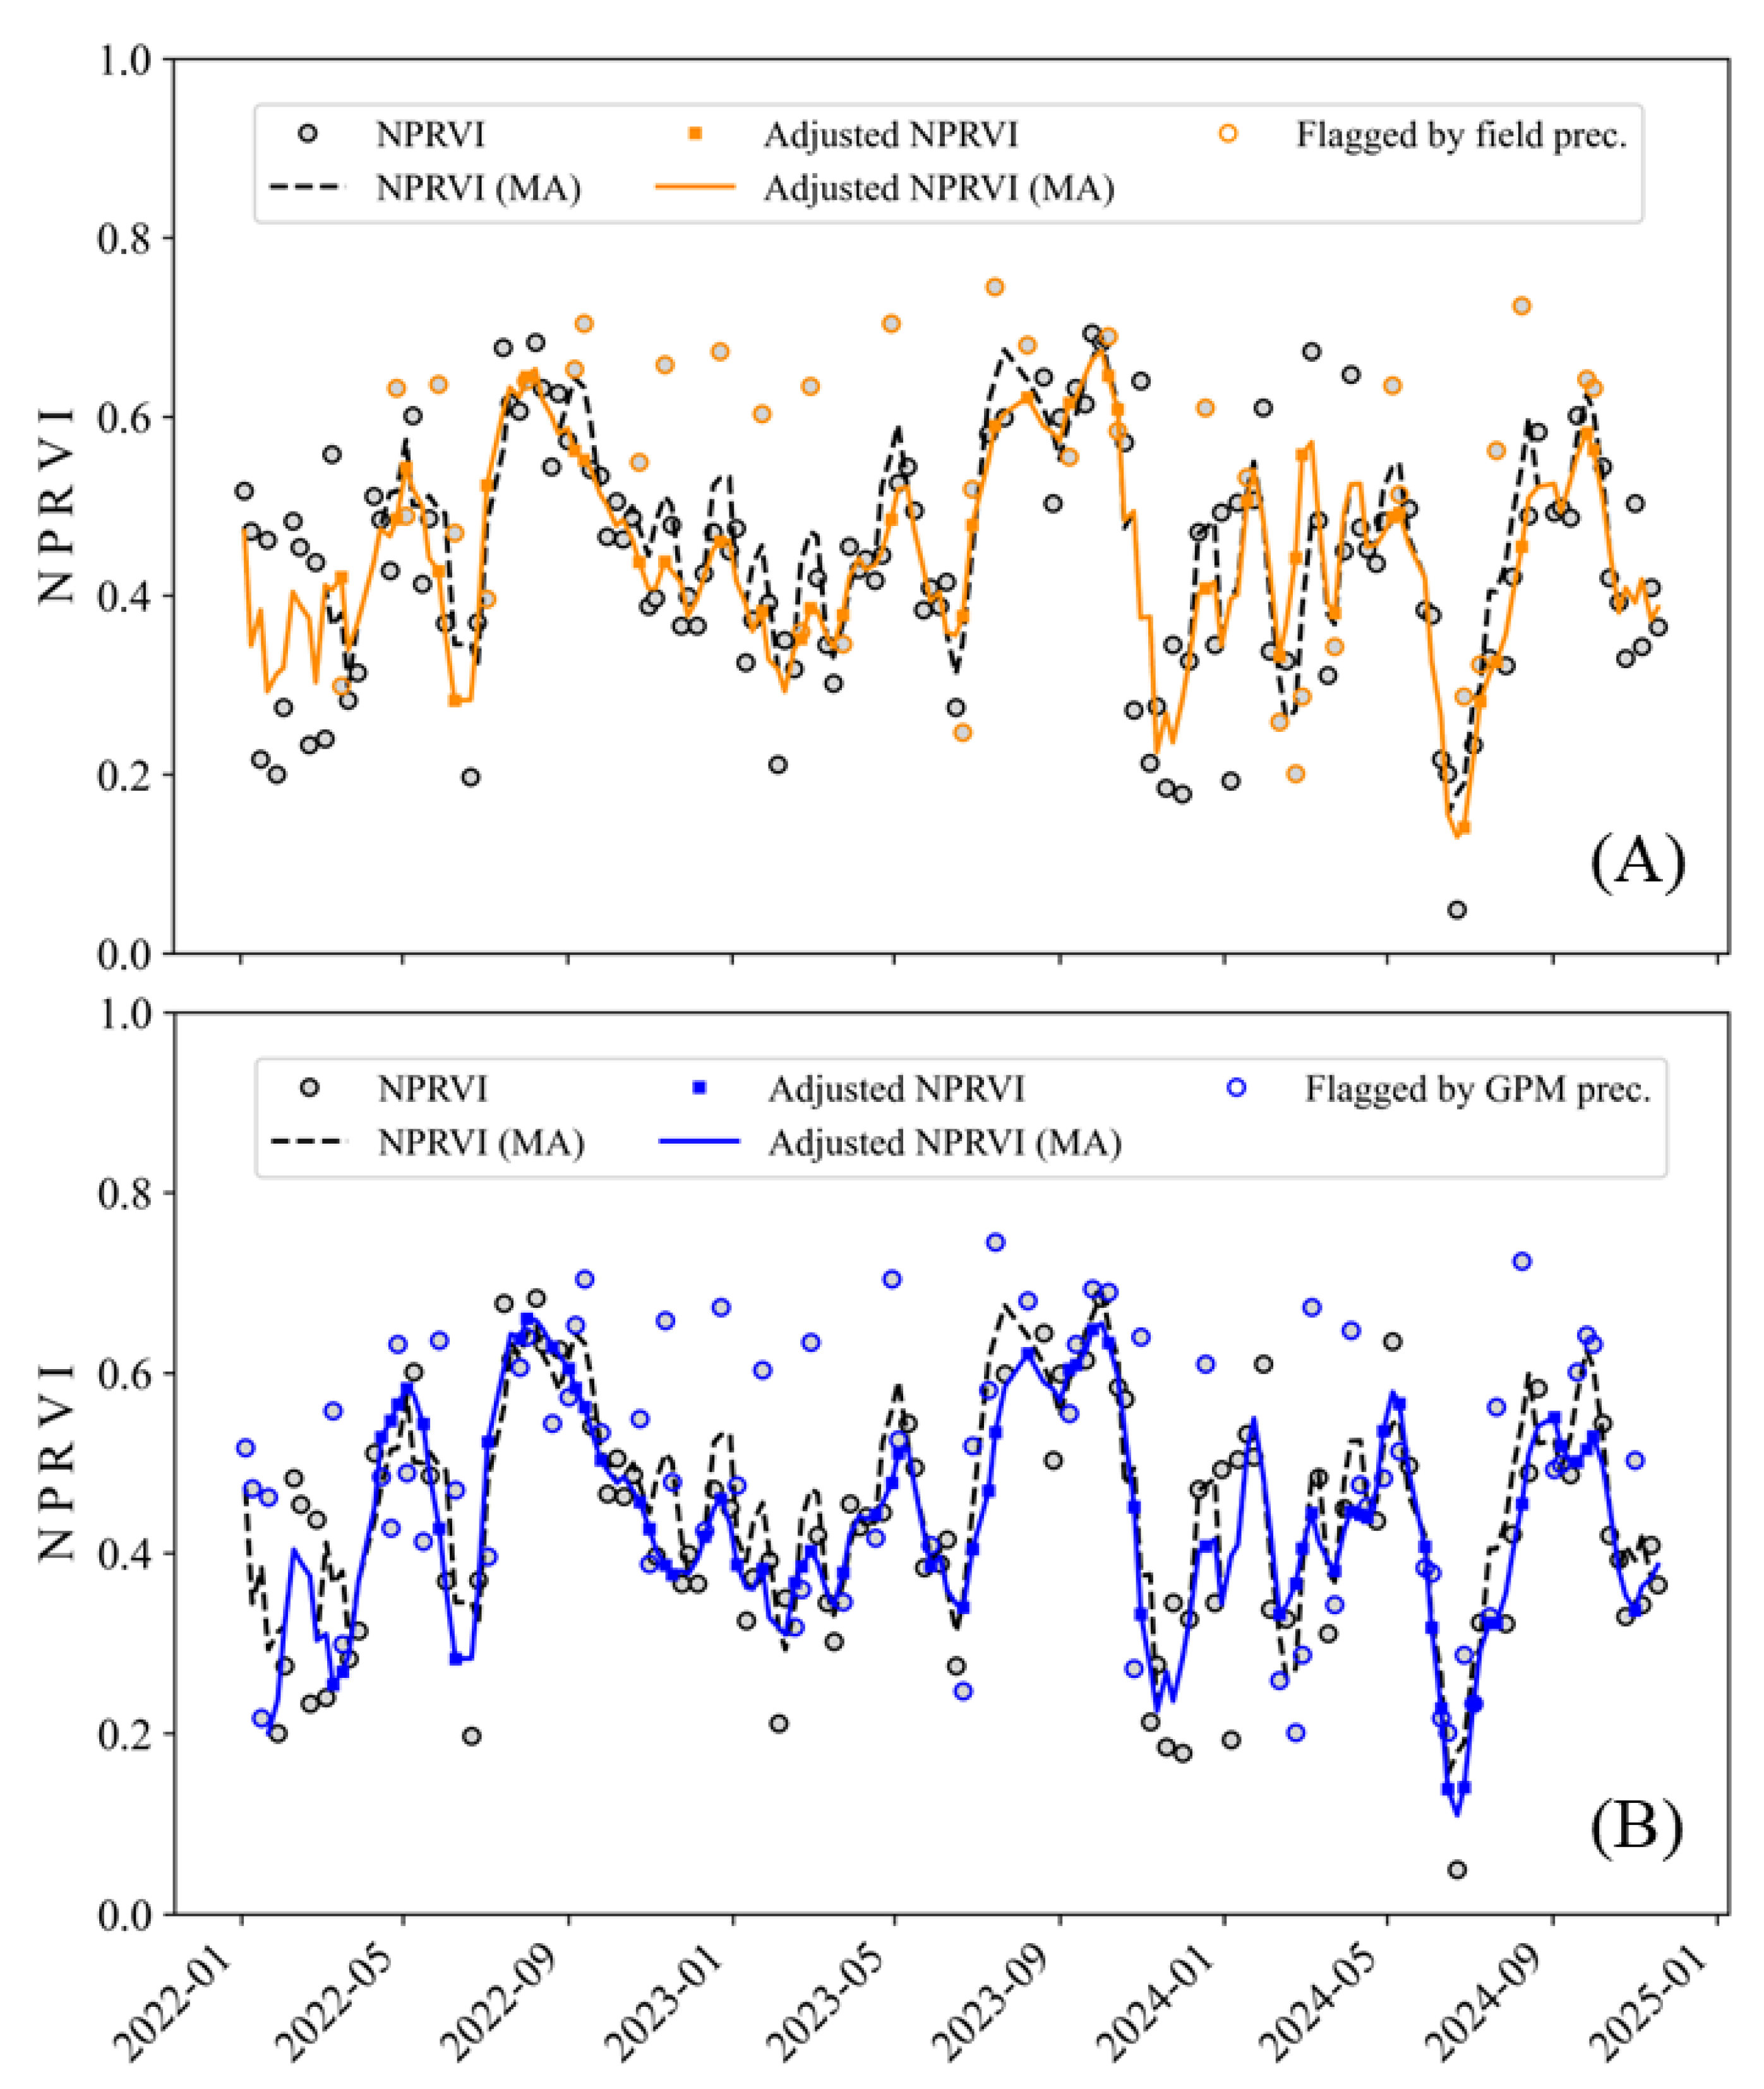
Figure 7 illustrates the original NPRVI and the adjusted NPRVI using linear interpolation, as well as moving average (MA) lines calculated from the three neighboring sequential dates (
n = 3). For adjusting NPRVI, spline interpolation was also tested; however, this showed no notable improvement over linear interpolation. Consequently, the simpler linear interpolation method was adopted. Both GPM and field data efficiently identified anomalous spikes in NPRVI values corresponding to precipitation events, with notable alignment except during February and March 2023, where the GPM dataset flagged multiple points having relatively low NPRVI values, in contrast to field data only flagging two lower points in 3 years. Overall, GPM data tend to overestimate the number of QA flags in comparison to field-measured precipitation due to their lower spatial resolution; however, they demonstrate potential as an effective substitute for field data.
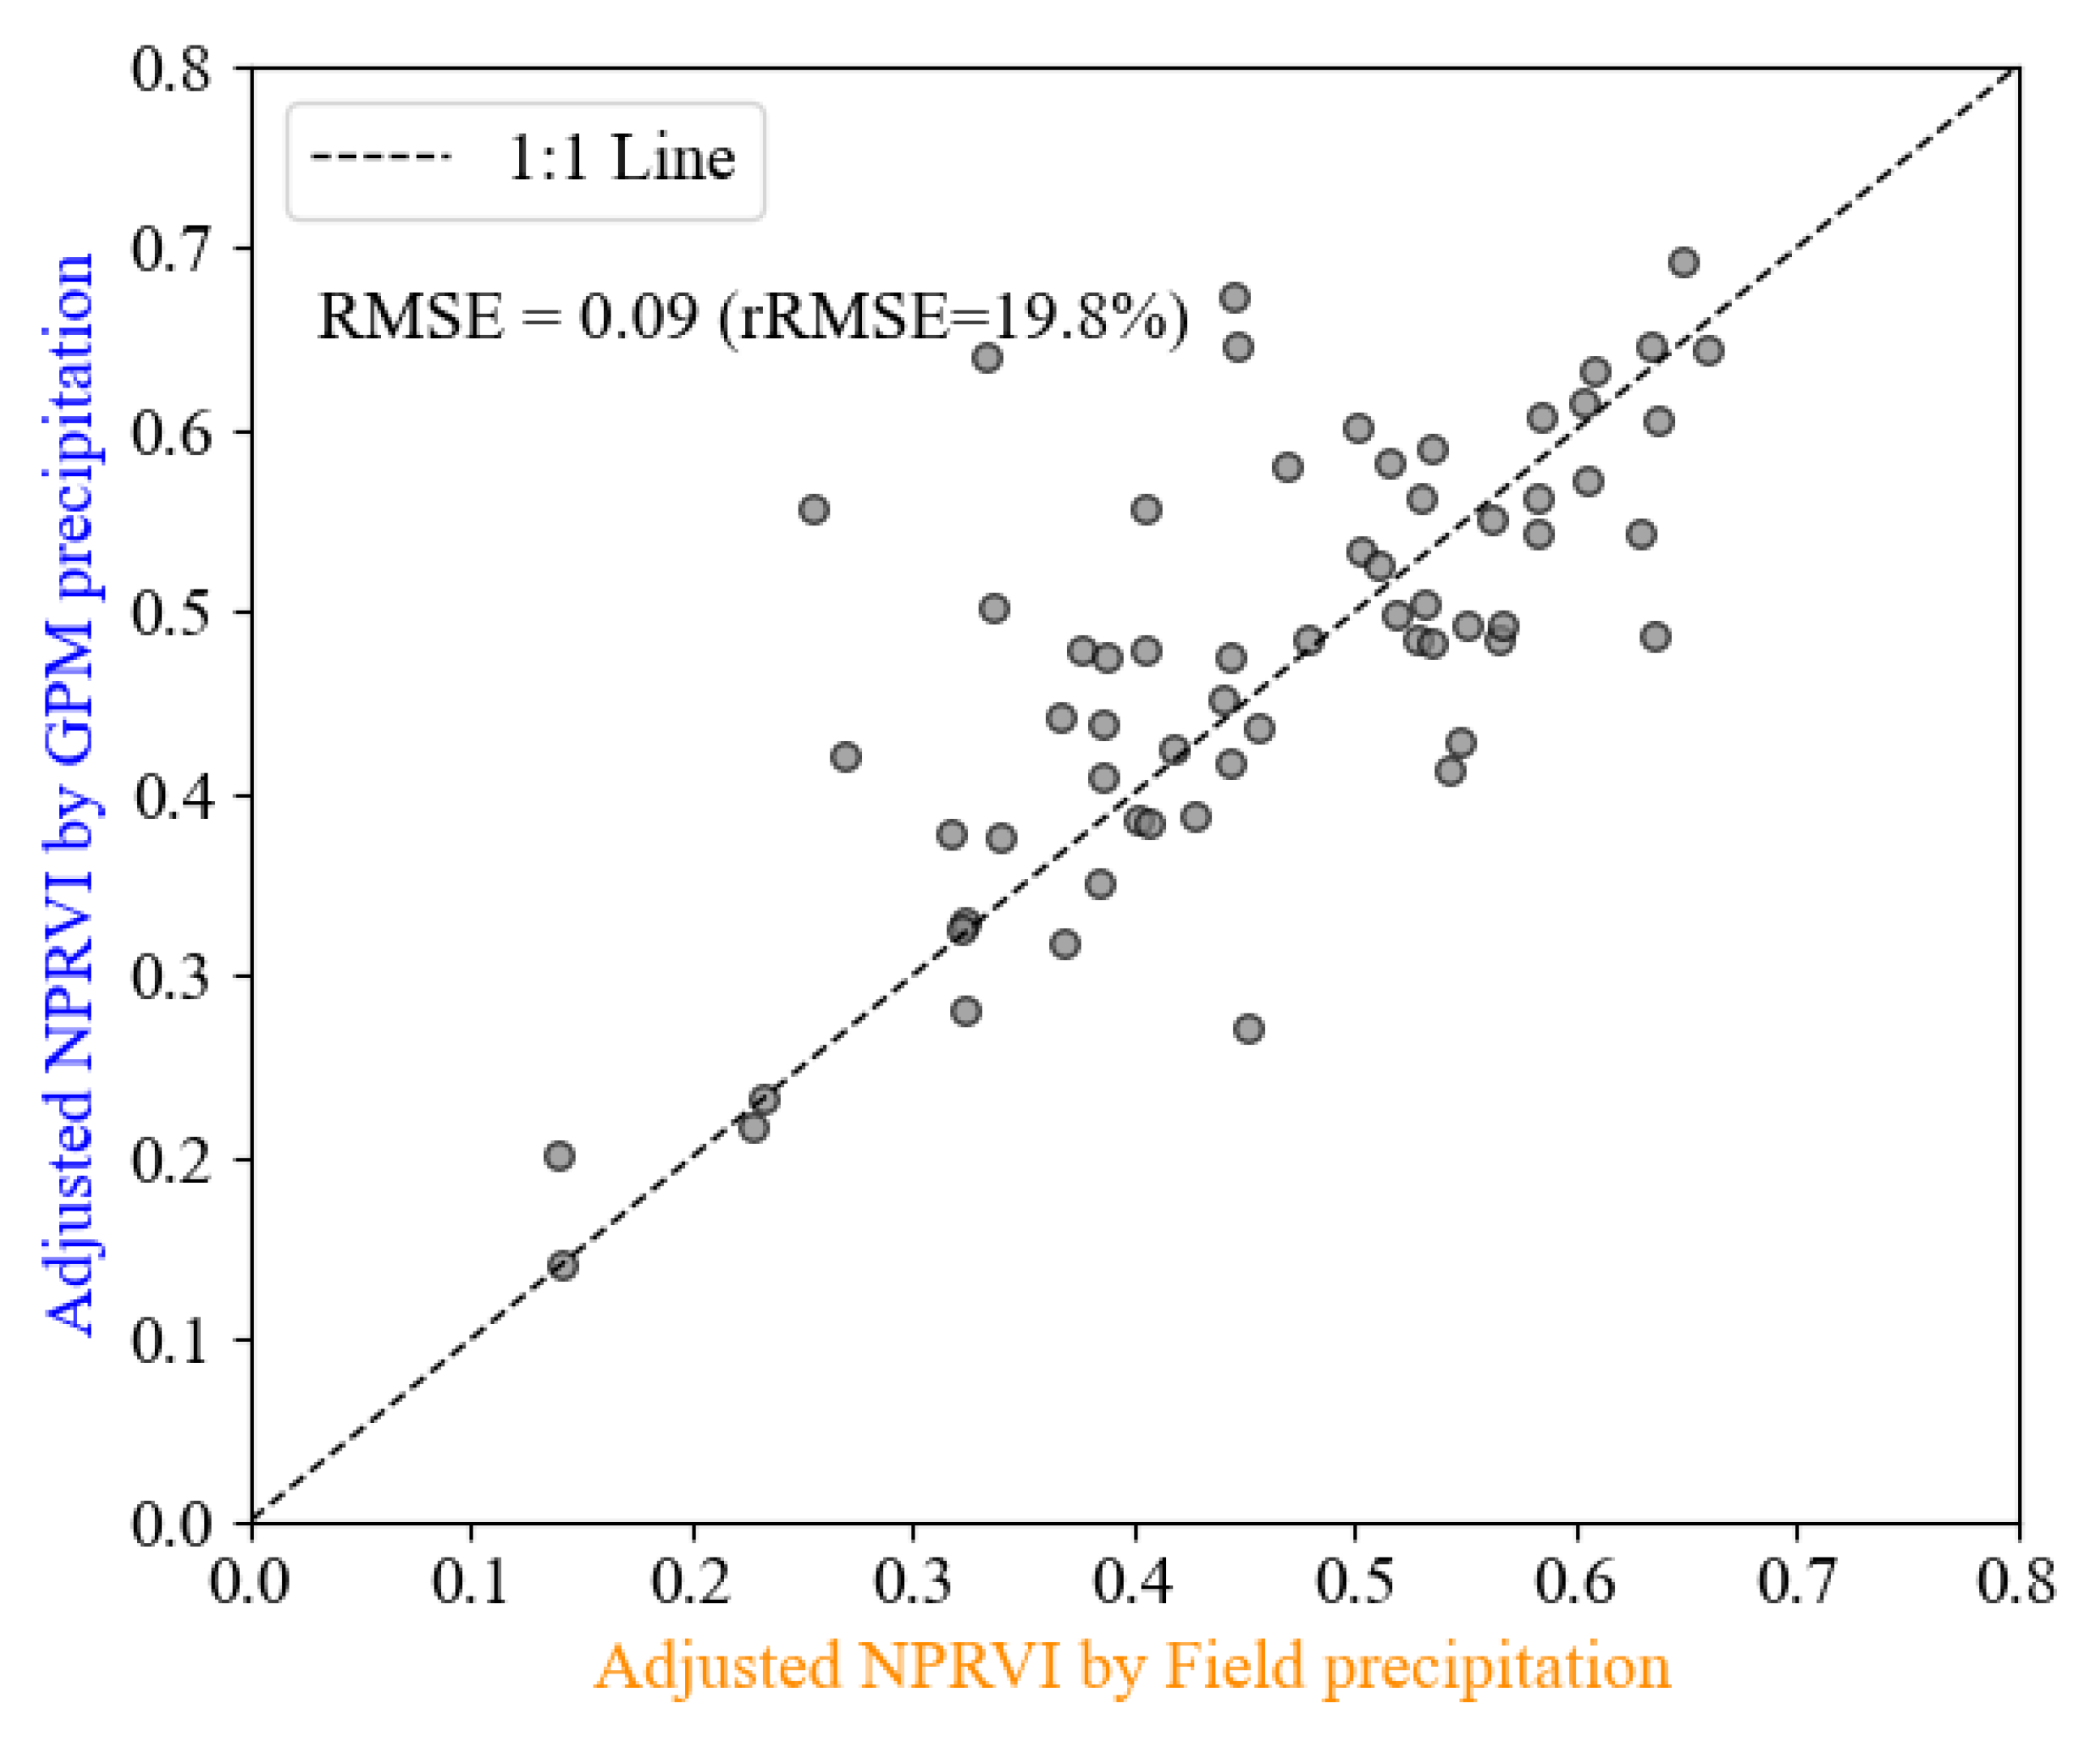
Figure 8 compares the adjusted NPRVI values derived from the GPM and field data, showing an RMSE of 0.09 and a relative RMSE (rRMSE) of 19.8%. Values that were identical (requiring no adjustment) were excluded from the calculation to ensure a more accurate assessment of differences between the datasets. These results indicate that GPM data remains a viable option for QA flagging and NPRVI adjustment, despite its limitations.
5. Conclusions
This study highlights the impact of precipitation on the Normalized Polarimetric Radar Vegetation Index (NPRVI) using multi-temporal Sentinel-1 C-band SAR data. The NPRVI exhibited a strong sensitivity to precipitation, particularly within 1 to 7 h prior to the satellite overpass, with even small rainfall events significantly affecting its values.
A quality assessment (QA) framework was developed to flag and correct precipitation-affected radar observations through interpolation. This framework was applied to both field-measured and GPM-derived precipitation data within a 6 h window, and the adjusted NPRVI values from both sources showed strong agreement (RMSE = 0.09; relative RMSE = 19.8%), indicating that GPM can serve as a viable alternative for quality adjustment in areas where field measurements are not available.
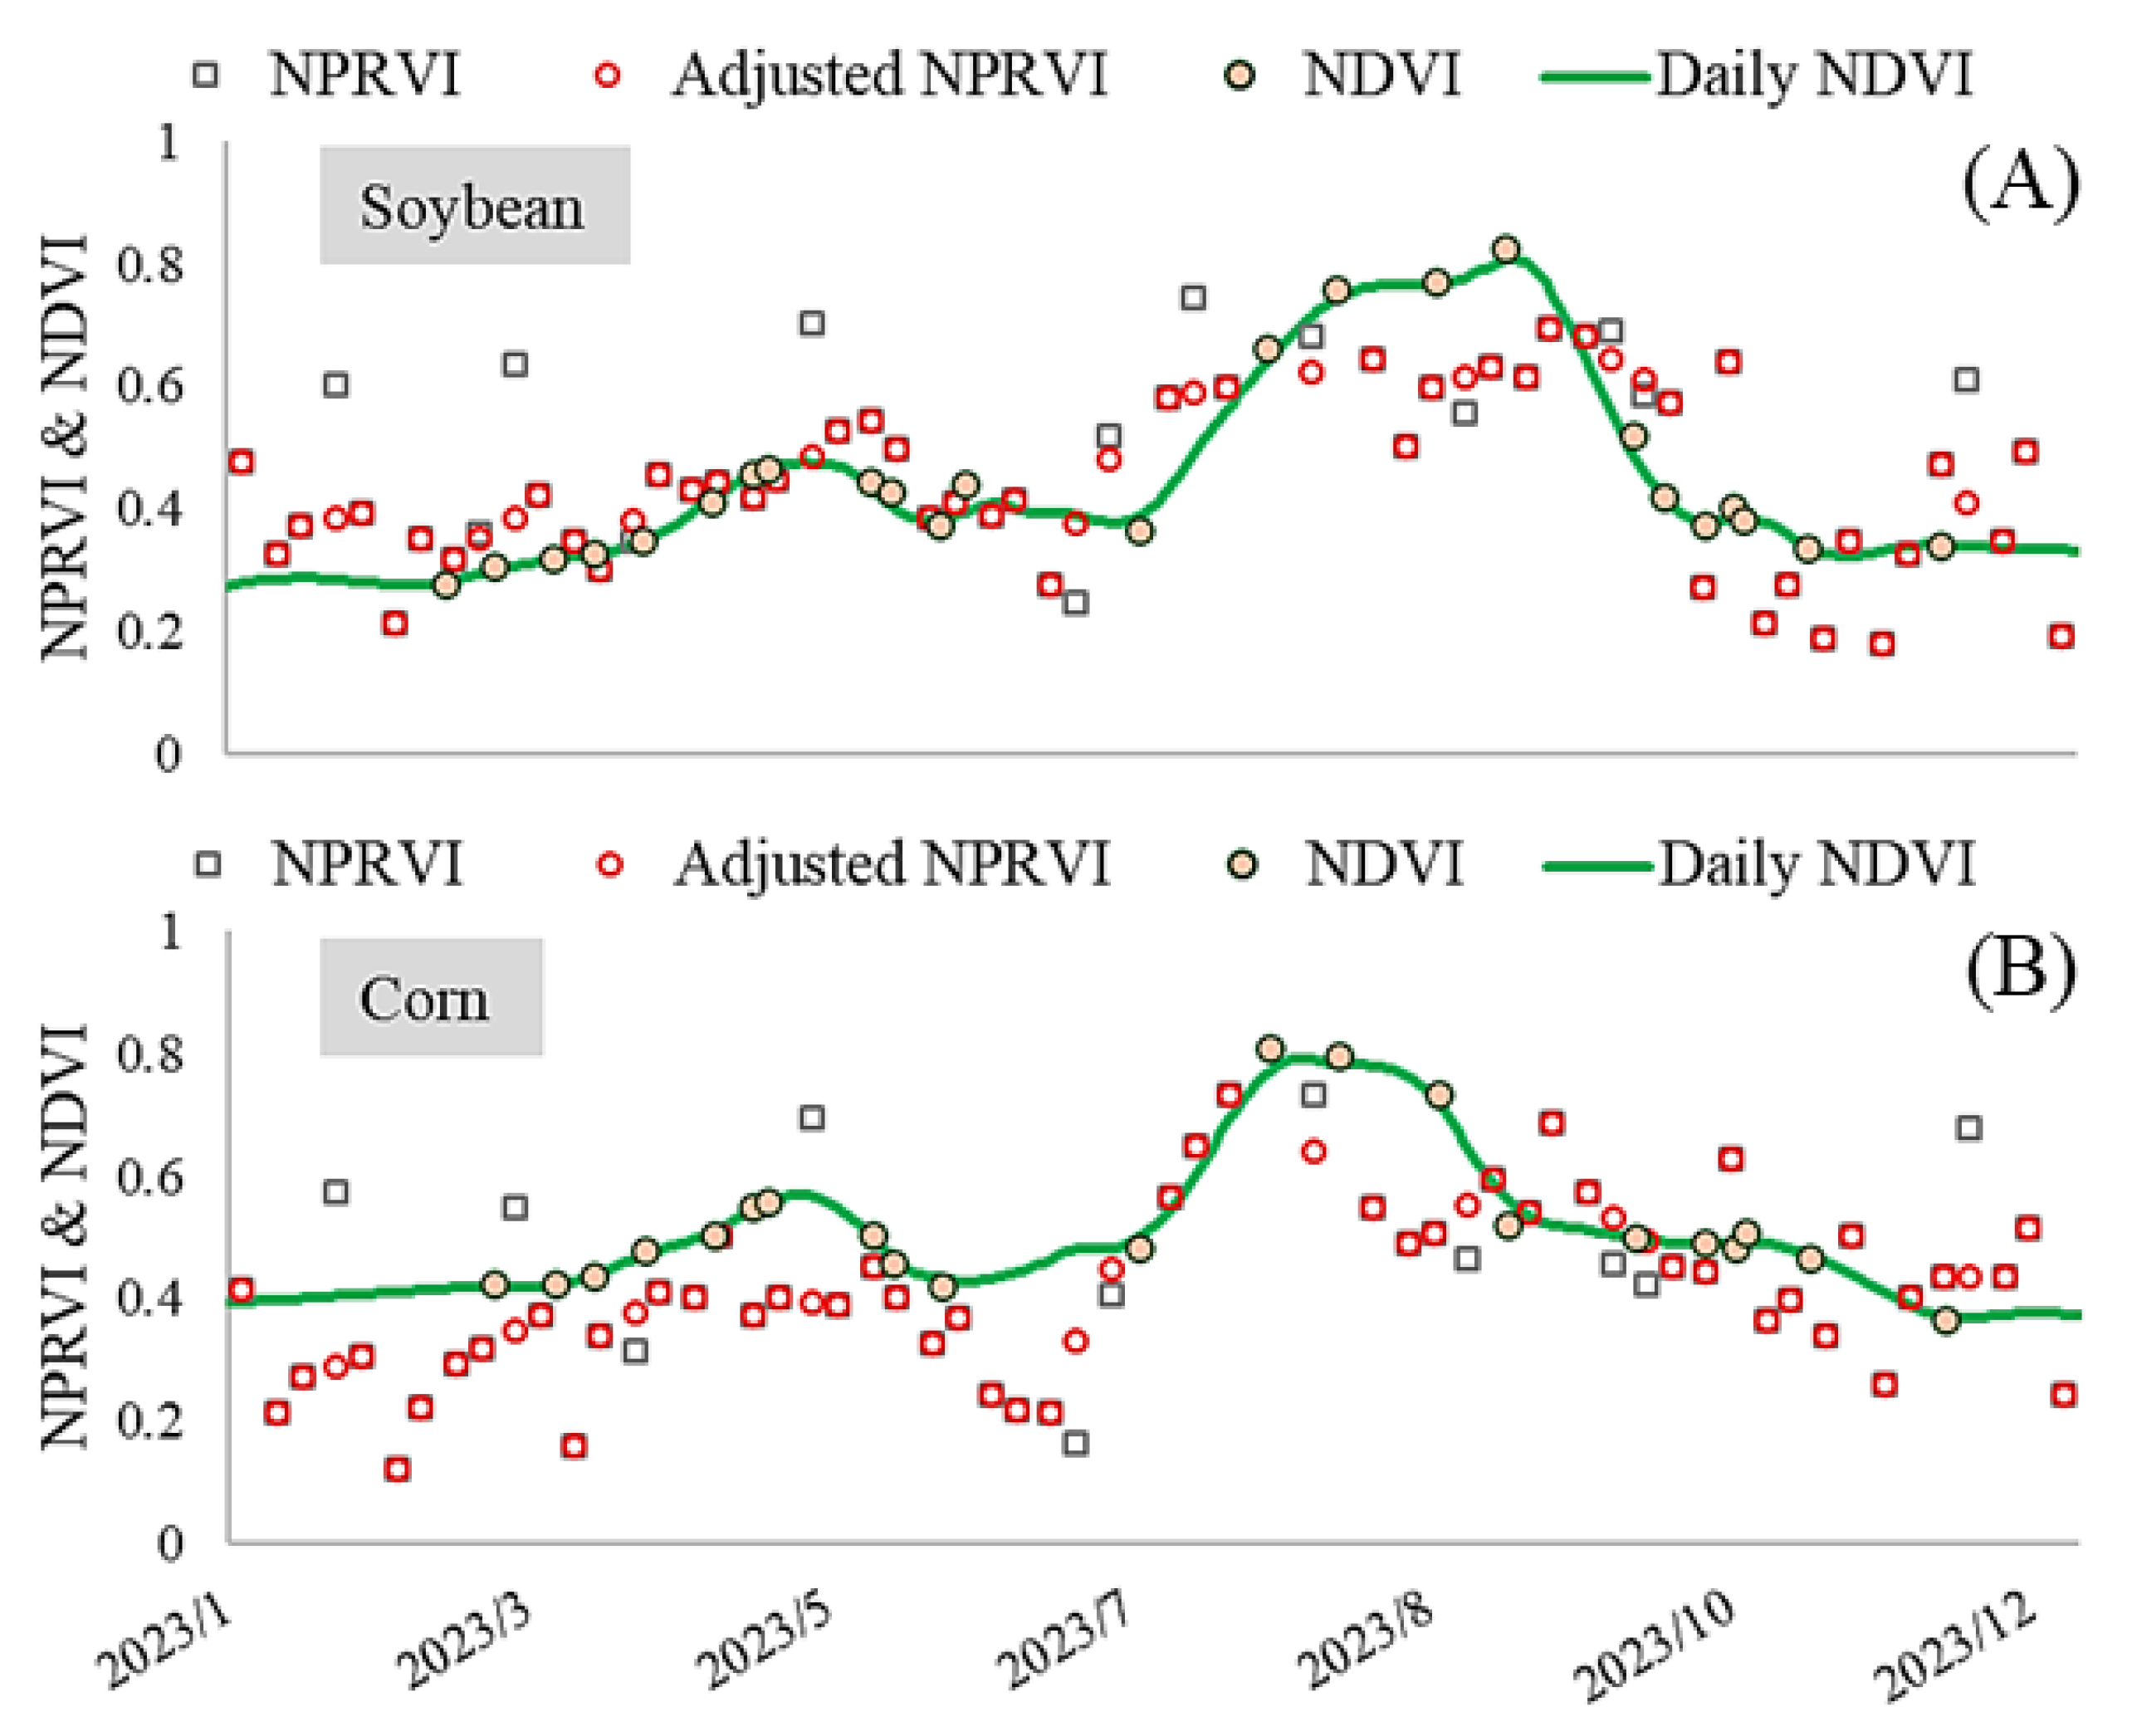
The QA framework, applied across soybean and corn fields, significantly improved the temporal consistency of the NPRVI time series. The adjusted NPRVI closely followed NDVI trends and also captured crop-specific seasonal dynamics, particularly during periods when NDVI exhibited saturation or limited variability. These findings underscore the value of the proposed radar-based QA framework in enhancing the reliability of vegetation monitoring. The approach can be extended to other radar parameters and applied across broader and more diverse regions. Future work should expand validation efforts to further strengthen both its applicability and scalability in agricultural and environmental monitoring.


