Article

Impact of Cloud Microphysics Initialization Using Satellite and Radar Data on CMA-MESO Forecasts

1
CMA Earth System Modeling and Prediction Centre (CEMC), Beijing 100081, China
2
State Key Laboratory of Severe Weather Meteorological Science and Technology (LaSW), Beijing 100081, China
3
Key Laboratory of Earth System Modeling and Prediction, Beijing 100081, China
*
Author to whom correspondence should be addressed.
Remote Sens. 2025, 17(14), 2507; https://doi.org/10.3390/rs17142507
Submission received: 14 May 2025 / Revised: 9 July 2025 / Accepted: 15 July 2025 / Published: 18 July 2025

Abstract

High-resolution numerical weather prediction requires accurate cloud microphysical initial conditions to enhance forecasting capabilities for high-impact severe weather events such as convective storms. This study integrated Fengyun-2 (FY-2) geostationary satellite data (equivalent blackbody temperature and total cloud cover) and next-generation 3D weather radar reflectivity from the China Meteorological Administration (CMA) to construct cloud microphysical initial fields and evaluate their impact on the CMA-MESO 3 km regional model. An analysis of the catastrophic rainfall event in Henan on 20 July 2021, and a 92-day continuous experiment (May–July 2024) revealed that assimilating cloud microphysical variables significantly improved precipitation forecasting: the equitable threat scores (ETSs) for 1 h forecasts of light, moderate, and heavy rain increased from 0.083, 0.043, and 0.007 to 0.41, 0.36, and 0.217, respectively, with average hourly ETS improvements of 21–71% for 2–6 h forecasts and increases in ETSs for light, moderate, and heavy rain of 7.5%, 9.8%, and 24.9% at 7–12 h, with limited improvement beyond 12 h. Furthermore, the root mean square error (RMSE) of the 2 m temperature forecasts decreased across all 1–72 h lead times, with a 4.2% reduction during the 1–9 h period, while the geopotential height RMSE reductions reached 5.8%, 3.3%, and 2.0% at 24, 48, and 72 h, respectively. Additionally, synchronized enhancements were observed in 10 m wind prediction accuracy. These findings underscore the critical role of cloud microphysical initialization in advancing mesoscale numerical weather prediction systems.

1. Introduction

With the rapid advancement of high-resolution numerical weather prediction (NWP) models, explicit cloud microphysics schemes have been widely implemented in numerical forecasting systems [1]. Given the intrinsic initial-value sensitivity of numerical models [2], there is an urgent demand for the accurate initialization of cloud microphysical variables [3]. In particular, in mesoscale convective system prediction, the fidelity of three-dimensional cloud microphysical structure representations in initial conditions critically determines the forecast accuracy for high-impact weather events including torrential rainfall and severe thunderstorms [4,5,6,7]. Conventional meteorological observations remain constrained by their limited spatiotemporal resolution and sampling methodologies, preventing them from resolving the complete fine-scale microphysical structures within meso–microscale systems. In contrast, remote sensing datasets from meteorological satellites and weather radars, with their high spatiotemporal resolution, have emerged as novel data sources for constructing cloud microphysical initial fields for NWP models using data assimilation.
Meteorological satellites conduct remote-sensing observations of Earth’s atmosphere through both Low Earth Orbit (LEO, altitude of hundreds of kilometers) and geostationary orbit (GEO, altitude of approximately 36,000 km). By employing multiple spectral bands, it is possible to monitor the evolution of cloud systems and various meteorological elements. These satellites are not constrained by geographical limitations, and can effectively compensate for the scarcity of conventional meteorological observations in data-sparse regions, including oceans, plateaus, and deserts. Geostationary satellites, distinguished by their short-interval measurement capabilities, deliver continuous real-time cloud monitoring data. This operational advantage is particularly critical for tracking the development and evolution of cloud systems associated with rapidly evolving weather phenomena [8].
Weather radar reflectivity quantitatively characterizes the backscattering cross-sections of precipitation particles, providing critical information on precipitation particle size distributions and concentrations within a unit of volume, thereby effectively indicating the intensity of meteorological targets [9]. Numerous nations have established nationwide weather radar networks, including the U.S. NEXRAD system [10,11], Europe’s OPERA network [12], and China’s Next-Generation Weather Radar (CINRAD) network [13]. These high-resolution radar network systems, by leveraging their minute-scale temporal resolution (5–10 min) and kilometer-level spatial resolution (1–4 km), have become cornerstone technologies for monitoring hazardous weather phenomena, particularly meso- and microscale severe weather events. They enable detailed three-dimensional precipitation and storm structural analyses, facilitating real-time monitoring of three-dimensional characteristics within rapidly evolving weather systems.
The European High-Resolution Limited Area Model (HIRLAM) implemented a cloud initialization scheme utilizing Meteosat Second-Generation (MSG) satellite products and background fields, which adjusts the initial cloud humidity and temperature profiles. This approach resulted in improved 6 h cloud cover forecasts, upper-air temperature predictions, and 0–3 h heavy precipitation nowcasting [14]. Within NOAA’s operational High-Resolution Rapid Refresh (HRRR) and Rapid Refresh (RAP) systems, a stratiform cloud hydrometeor assimilation strategy has been implemented utilizing GOES-East and GOES-West satellite cloud data, and Ground-Based Ceilometer and surface visibility observations. This methodology directly updates prognostic cloud microphysical variables, including cloud water and cloud ice mixing ratios, through the dynamic integration of satellite-derived cloud property measurements with numerical model background fields. The experimental results indicated that this method improves short-term nowcasting (1–9 h) [15,16]. Renshaw et al. developed a variational cloud fraction assimilation scheme in the UK Met Office Unified Model. This methodology transforms multi-platform observations—including satellite retrievals and surface-based cloud detection—into humidity pseudo-observations through the diagnostic relationships between cloud fraction and relative humidity. The implementation of 4D-Var for the direct assimilation of cloud fraction observations demonstrated enhanced predictive accuracy, yielding measurable improvements in 6 h cloud coverage forecasts and 2 m temperature predictions [16].
The NOAA/ESRL Local Analysis and Prediction System (LAPS) developed by Albers et al. [17] first accomplished an integrated analysis of macroscopic cloud fields and microphysical hydrometeors by assimilating satellite and radar observations. Subsequent modifications by Zhang et al. [18] established a thermodynamic–microphysical coupled cloud analysis scheme [19] suitable for the ARPS model. Building upon this framework, Hu et al. [20] substantially improved radar data assimilation for severe convective processes through reconstructing physical relationships between reflectivity and precipitation particles, optimizing temperature adjustment schemes within clouds, and designing novel entrainment rate curves. Their numerical experiments captured the important characteristics of the main tornadic thunderstorm more accurately.
Regarding the analysis of cloud microphysical initial value assimilation impacts, studies using satellite data have primarily focused on optimizing cloud droplet-related microphysical initial values and moisture fields or investigating the influence of radar data assimilation on precipitation forecasting. Few studies have systematically investigated the combined improvement of cloud microphysical initial values through synergistic approaches. The existing approaches predominantly concentrate on enhancing 0–12 h forecasts while extending the forecast lead time to 72 h for short-term numerical weather prediction scenarios, producing unclear impacts of cloud microphysical initial fields on model forecasting. Furthermore, systematic analyses specifically addressing the impacts of satellite- and radar-derived cloud initial values on the CMA-MESO model remain notably deficient.
Building on previous research, this study further developed the cloud microphysical initialization method by utilizing Fengyun-2 geostationary satellite products and new-generation weather radar observations while incorporating the characteristics of physical processes in China’s numerical modeling system.
An initial scheme for cloud microphysical variables, which includes cloud droplets, precipitation particles, water vapor, and thermodynamic information, was established for operational application in China’s CMA-MESO model. Through a combined diagnostic analysis of extreme precipitation events and three-month batch experiments, this study systematically evaluated the impacts of cloud initialization on heavy rainfall prediction and extended-range forecasting capabilities. The findings establish technical foundations for advancing cloud microphysical variable initialization and assimilation in high-resolution regional models. The rest of this paper is organized as follows: Section 2 introduces the CMA-MESO 3 km numerical weather prediction system, the cloud microphysical initial value analysis method, the initial assimilation application scheme, and the experimental design. Section 3 presents the results of the case study. Section 4 shows the results of the continuous experiments. Section 5 contains the discussion, and Section 6 summarizes the research conclusions.

2. Materials and Methods

2.1. CMA-MESO 3 km Numerical Weather Prediction System

The CMA-MESO 3 km system is a regional NWP model that is in operation at the China Meteorological Administration (CMA) [21]. It integrates atmospheric modeling and data assimilation components. Its atmospheric component employs a non-hydrostatic fully compressible dynamic framework with five prognostic variables: potential temperature (θ), specific humidity (q), three-dimensional wind velocity components (u, v, w), and the Exner pressure function (π). Spatial discretization is implemented on a latitude–longitude grid using an Arakawa C staggered grid arrangement, while temporal integration adopts a two-time-level, semi-implicit, semi-Lagrangian scheme with off-centered weighting. The vertical coordinate system follows a height-based terrain-following configuration incorporating Charney–Phillips variable staggering for enhanced numerical stability. The model configuration details are presented in Table 1.

2.2. Initial Analysis and Assimilation of Cloud Microphysical Variables

The cloud microphysical initialization scheme in the CMA-MESO 3 km model was developed based on the cloud analysis scheme of the ARPS model from the Center for Analysis and Prediction of Storms (CAPS) at the University of Oklahoma, USA [18,27]. The CMA-MESO integrates three core observational datasets within its cloud microphysical initialization scheme: mosaic reflectivity data from China’s new-generation weather radars, and the FY-2 geostationary satellite-derived brightness temperature (TBB) and total cloud amount products (CTA). A three-dimensional cloud fraction parameterization scheme and hydrometeor analysis scheme were adopted, both matching the model’s resolution and physical processes. An algorithm for the partial elimination of false cloud information was established.
Furthermore, the latent heating rate information for thermal adjustment was obtained by converting 3D radar reflectivity to latent heating rates using empirical relationships, following the approach of Weygandt (2002) [28]. Within cloud regions, minimum relative humidity (RH) thresholds were enforced, with corresponding adjustments made to the water vapor mixing ratio (qv) field. The relative humidity values were determined from the analyzed cloud cover field through an empirically derived linear function [18].
Additionally, an Incremental Analysis Update (IAU) scheme for initializing cloud microphysical variables was implemented in CMA-MESO. This approach successfully enabled the initial assimilation of critical cloud parameters, including cloud water, cloud ice, rainwater, snow, graupel, water vapor, and the associated thermodynamic variables.

2.2.1. Background Field Cloud Fraction Scheme

The background field refers to the gridded analysis data obtained after variational assimilation. In the relative humidity–cloud cover parameterization scheme, the threshold requires adjustment as the model resolution increases. Above the lifting condensation level (LCL), the relationship between relative humidity and cloud fraction adopted in this study follows Equation (1) [27].
C C F = H R H R 0 1 H R 0 b
In Equation (1), C C F represents the grid cloud cover, H R denotes the relative humidity provided by the background field, and H R 0 serves as an altitude-dependent threshold value. In the CMA-MESO 3 km system, the equation parameters are configured as follows:
  • H R 0 is assigned as 0.95 at altitudes below 600 m; 0.9 between 600 and 1500 m; 0.85 between 1500 and 2500 m; and 0.8 above 2500 m.
  • Parameter b is set to 2.
When H R is below the threshold of H R 0 , a grid cell is considered cloud-free.

2.2.2. Satellite Data and Cloud Microphysical Variable Initialization Analysis

The satellite data utilized in this study were obtained from the FY-2 geostationary satellite, including black body brightness temperature (TBB) and cloud total amount (CTA) products.
The FY-2 TBB product [29] derives its values by comparing the satellite thermal infrared channel (10.3–11.3 μm) observational data (grayscale values) with a predefined temperature lookup table. During product generation, the retrieved infrared nominal image data underwent data validity checks and outlier removal. The data used here is hourly averaged TBB products with a horizontal resolution of 0.1° × 0.1° and brightness temperature accuracy of 1 K.
The model-simulated brightness temperature (Tbe) field was calculated using the background temperature and cloud fraction data. Clouds were adjusted based on differences between the simulated Tbe and satellite-observed brightness temperatures (Tbo).
If Tbo exceeds Tbe, the cloud layers were reduced by lowering the solid cloud tops (gridded cloud fraction = 1) and thinning partial clouds (gridded cloud fraction <1). This infrared adjustment excludes low warm clouds to avoid false clearance of very low cloud decks.
If Tbo is colder than Tbe, a solid cloud layer is inserted, with the tops set by Tbo. This IR-derived cloud layer (typically 1.5 km thick) cannot descend below cloud bases. Two schemes were used to determine cloud top height:
  • For Tbo < −20 °C: Match satellite brightness temperature to grid temperature profile.
  • For Tbo ≥ −20 °C: Use MacPherson’s moist adiabatic ascent method [30].
The FY-2 CTA product [29] is a quantitative output based on atmospheric radiative transfer theory, integrating multi-channel visible and infrared observations. The satellite-received radiance I is expressed as
I = ( 1 A c ) I c l r + A c I c l d
where I denotes the satellite-observed radiance, A c denotes the cloud fraction, I c l d is the radiance of cloudy pixels, and I c l r represents the radiance of clear-sky pixels. Radiance is converted to reflectance for visible channels and brightness temperature for infrared channels. This formulation yields
A c = ( I c l r I )   /   ( I c l r I c l d )
Thus, total cloud fraction can be calculated once the observed radiance, cloudy-pixel radiance, and clear-sky radiance are obtained. This satellite product features a spatial resolution of 5 km.
The model cloud total amount is computed through the vertical integration of three-dimensional vertical grid cloud amounts and compared with the FY-2 CTA product. Where the analyzed cloud total amount significantly exceeds the satellite product, the grid-level volumetric cloud fraction is iteratively reduced until the total cloud cover aligns with the satellite-derived cloud coverage.

2.2.3. Radar Data and Cloud Microphysical Variable Initialization Analysis

The radar data utilized in this study comprises three-dimensional mosaicked reflectivity composites from China’s New Generation Weather radars (CINRAD), which were processed by the CMA Earth System Modeling and Prediction Centre (CEMC). These datasets were derived from CINRAD base data and underwent quality control procedures, including radar data pairing, isolated echo filtering, ground clutter identification, electromagnetic interference detection, malfunction data recognition, and annular echo identification. Single-radar observations were first gridded and then integrated into mosaicked composites. For regions with overlapping radar coverage, multi-station integration was implemented through an exponential weighting interpolation method based on the contribution of each radar dataset. This dataset underwent nationwide real-time quality control and radar network integration for SA/SB (S-band) and CB/CC/CD(C-band) radar models at the CEMC.
The role of radar reflectivity in forming the initial cloud microphysical field can be divided into three parts: the analysis of macroscopic three-dimensional gridded cloud amount, the quantitative analysis of microscopic precipitation particles, and the analysis of thermodynamic initial information.
Building upon the background field and other observations, radar data were further integrated to enhance the analysis. Based on the precipitation–cloud correlation principle (i.e., the presence of radar echoes implies the existence of clouds), when the radar echo intensity exceeded a predefined threshold and was located above the previously analyzed cloud base, the cloud cover fraction at these grid points was adjusted to 1.0. For radar reflectivity positioned below the cloud base but above the lifting condensation level (LCL), the cloud base was reset to the LCL with the corresponding cloud cover modifications [18].
Precipitation types within radar-observed reflectivity were categorized based on the radar reflectivity characteristics and background environmental parameters. A quantitative analysis of the precipitation particle content across distinct types was conducted using the SMO scheme [31,32,33]. In addition, latent heat release derived from radar reflectivity was applied to the temperature adjustment for cloud microphysical initialization [28].

2.2.4. False Cloud Elimination

A false cloud removal scheme was developed to eliminate cloud hydrometeors in regions where cloud existence was indicated in the background field but absent after cloud analysis. Specifically, the cloud fraction analysis integrated satellite and radar data with the assimilated background field to determine the cloud coverage and fraction. In regions where the final analysis yielded cloud-free conditions despite pre-existing clouds in the background field, humidity was reduced to statistically non-cloud-forming thresholds, while the mixing ratios of the microphysical variables were set to zero.

2.3. Cloud Microphysics Initialization Scheme

The cloud microphysical analysis increments were assimilated using the Increment Analysis Update (IAU) technique [34,35,36]. These increments comprised mixing ratios of cloud water (qc), cloud ice (qi), rainwater (qr), snow water (qs), graupel (qg), water vapor (qv), and in-cloud thermodynamic fields. As specified in Equation (4), X denotes the model forecast variable, t represents time, x t encompasses both dynamic and physical tendencies, F i denotes the cumulative contributions from all physical processes in the model, X is the analysis increment, and α corresponds to the IAU forcing coefficient.
x t = F i + α X
α = 1 I A U   s t e p s
During the forecast run, the initialization of cloud microphysics and related variables was accomplished over 10 time steps. Each time step spanned 30 s, with a total duration of 5 min for IAU of the cloud microphysical variables, which is broadly consistent with the temporal cadence of radar volume scan observations. The analysis increment was partitioned into smaller forcing terms and incrementally incorporated into the model integration process, rather than introducing a single abrupt adjustment at the analysis time. This gradual assimilation approach, governed by the dynamic constraints of the model framework, facilitates the balanced absorption of increments through iterative small-scale additions. Consequently, it mitigates initial imbalances between hydrometeor fields and dynamical variables, thereby progressively suppressing spurious high-frequency noise induced by data.

2.4. Numerical Experiment Design

To systematically evaluate the impact of cloud microphysical initial value assimilation on CMA-MESO forecast performance, this study employed two case studies: an extreme precipitation case study and batch continuous experiments. The case study investigated the influence of cloud microphysical initial values through targeted analysis of a representative event, whereas the batch experiments statistically assessed whether such initial values yield significant positive impacts on model forecasts via large-sample testing. Both case studies incorporated control and sensitivity experiments. The control experiment (CNTL) excluded cloud microphysical initial value assimilation, while the sensitivity experiment (SENS) implemented the proposed satellite-radar collaborative cloud microphysical initial value assimilation scheme.
To investigate the sensitivity of numerical weather prediction for high-impact weather to cloud microphysical initial values, this study analyzed the extreme rainfall event in Henan Province, China, during July 2021. From 17 to 22 July, torrential to exceptionally heavy rainfall affected central and northern Henan, with localized accumulated precipitation exceeding 900 mm in Zhengzhou, Hebi, and Xinxiang. The precipitation core was centered in Zhengzhou, where the most intense rainfall occurred on 20 July, setting a historical daily rainfall record. This event caused 398 disaster-related fatalities or disappearances and direct economic losses of CNY 120.06 billion. Therefore, this study selected this catastrophic yet typical precipitation case for investigation [37].
To verify the universality of the proposed scheme, continuous forecasting experiments spanning 1 May–31 July 2024 (92 days) were designed and conducted based on the climatological characteristics of the frequent high-impact weather systems in China during May–July, including the South China pre-summer rainy season, Yangtze River Valley Meiyu front, and northern thunderstorms [38,39,40]. The experiments adopted a daily 00 UTC cold-start initialization strategy to generate 72 h numerical forecasts. The evaluations involved quantitative analysis of precipitation forecast performance using hourly equitable threat scores (ETSs) based on observational data from China’s surface automatic weather stations, combined with verification of 2 m temperature and 10 m wind fields, while circulation pattern forecasts were assessed through comparison with the NCEP Global Forecast System (GFS) analysis fields.

3. Analysis of Case Experiment Results

3.1. Analysis of Cloud Microphysical Initialization Fields

To facilitate analysis, column-integrated hydrometeor contents were calculated using three-dimensional cloud initialization variables derived from the SENS 00UTC on 21 July 2021, which incorporated satellite and radar data through cloud microphysical initialization analysis. The hydrometeor integrated paths over the intense rainfall area at 00 UTC 21 July 2021 are illustrated in Figure 1a,f, including the Rainwater Path (RWP), Snow Water Path (SWP), Graupel Water Path (GWP), Cloud Water Path (CWP), Ice Water Path (IWP), and Precipitable Water (PW). Figure 1g displays the simultaneous 10.8 μm infrared channel brightness temperature (TBB) observed by the FY-4A satellite. In the figures, it can be observed that the initial microphysical variables of the intense precipitation cloud cluster were effectively captured. The vertical column contents of rain (RWP) and snow (SWP) showed good consistency with the radar data Figure 2a. The spatial distributions of the CWP and IWP closely matched the satellite-observed cloud systems. The high-value regions of the PW integrated path exceed 60 mm, indicating an ample supply of water vapor to sustain the subsequent heavy rainfall.

3.2. Effects of Cloud Microphysics Initial Conditions on Forecasting

  • Impact Analysis of Rainwater Mixing Ratio Forecast
To evaluate the impact of the cloud microphysical initialization on rainwater particle prediction, rainwater mixing ratio (Qr) forecasts at the completion time of the IAU were analyzed. Figure 2a shows the composite reflectivity observations from the radar networks. Figure 2b,c present the 5 min rainwater mixing ratio forecasts initialized at 0000 UTC 20 July 2021, corresponding to the IAU completion time. Specifically, Figure 2b displays the CNTL result, while Figure 2c shows the SENS result. The comparisons demonstrate that the CNTL remained in the spin-up phase, predicting only trace rainwater due to uninitialized cloud microphysical variables. In contrast, the SENS generated rainwater distributions that were spatially consistent with radar reflectivity observations within 5 min of initialization. This confirms that constructing cloud microphysical initial fields using satellite products and radar reflectivity data reduces the spin-up time from hours to minutes, thereby improving precipitation forecast performance in temporal response efficiency, spatial accuracy, and intensity realism. The method could be particularly valuable for enhancing the nowcasting of time-sensitive mesoscale convective systems (MCSs).
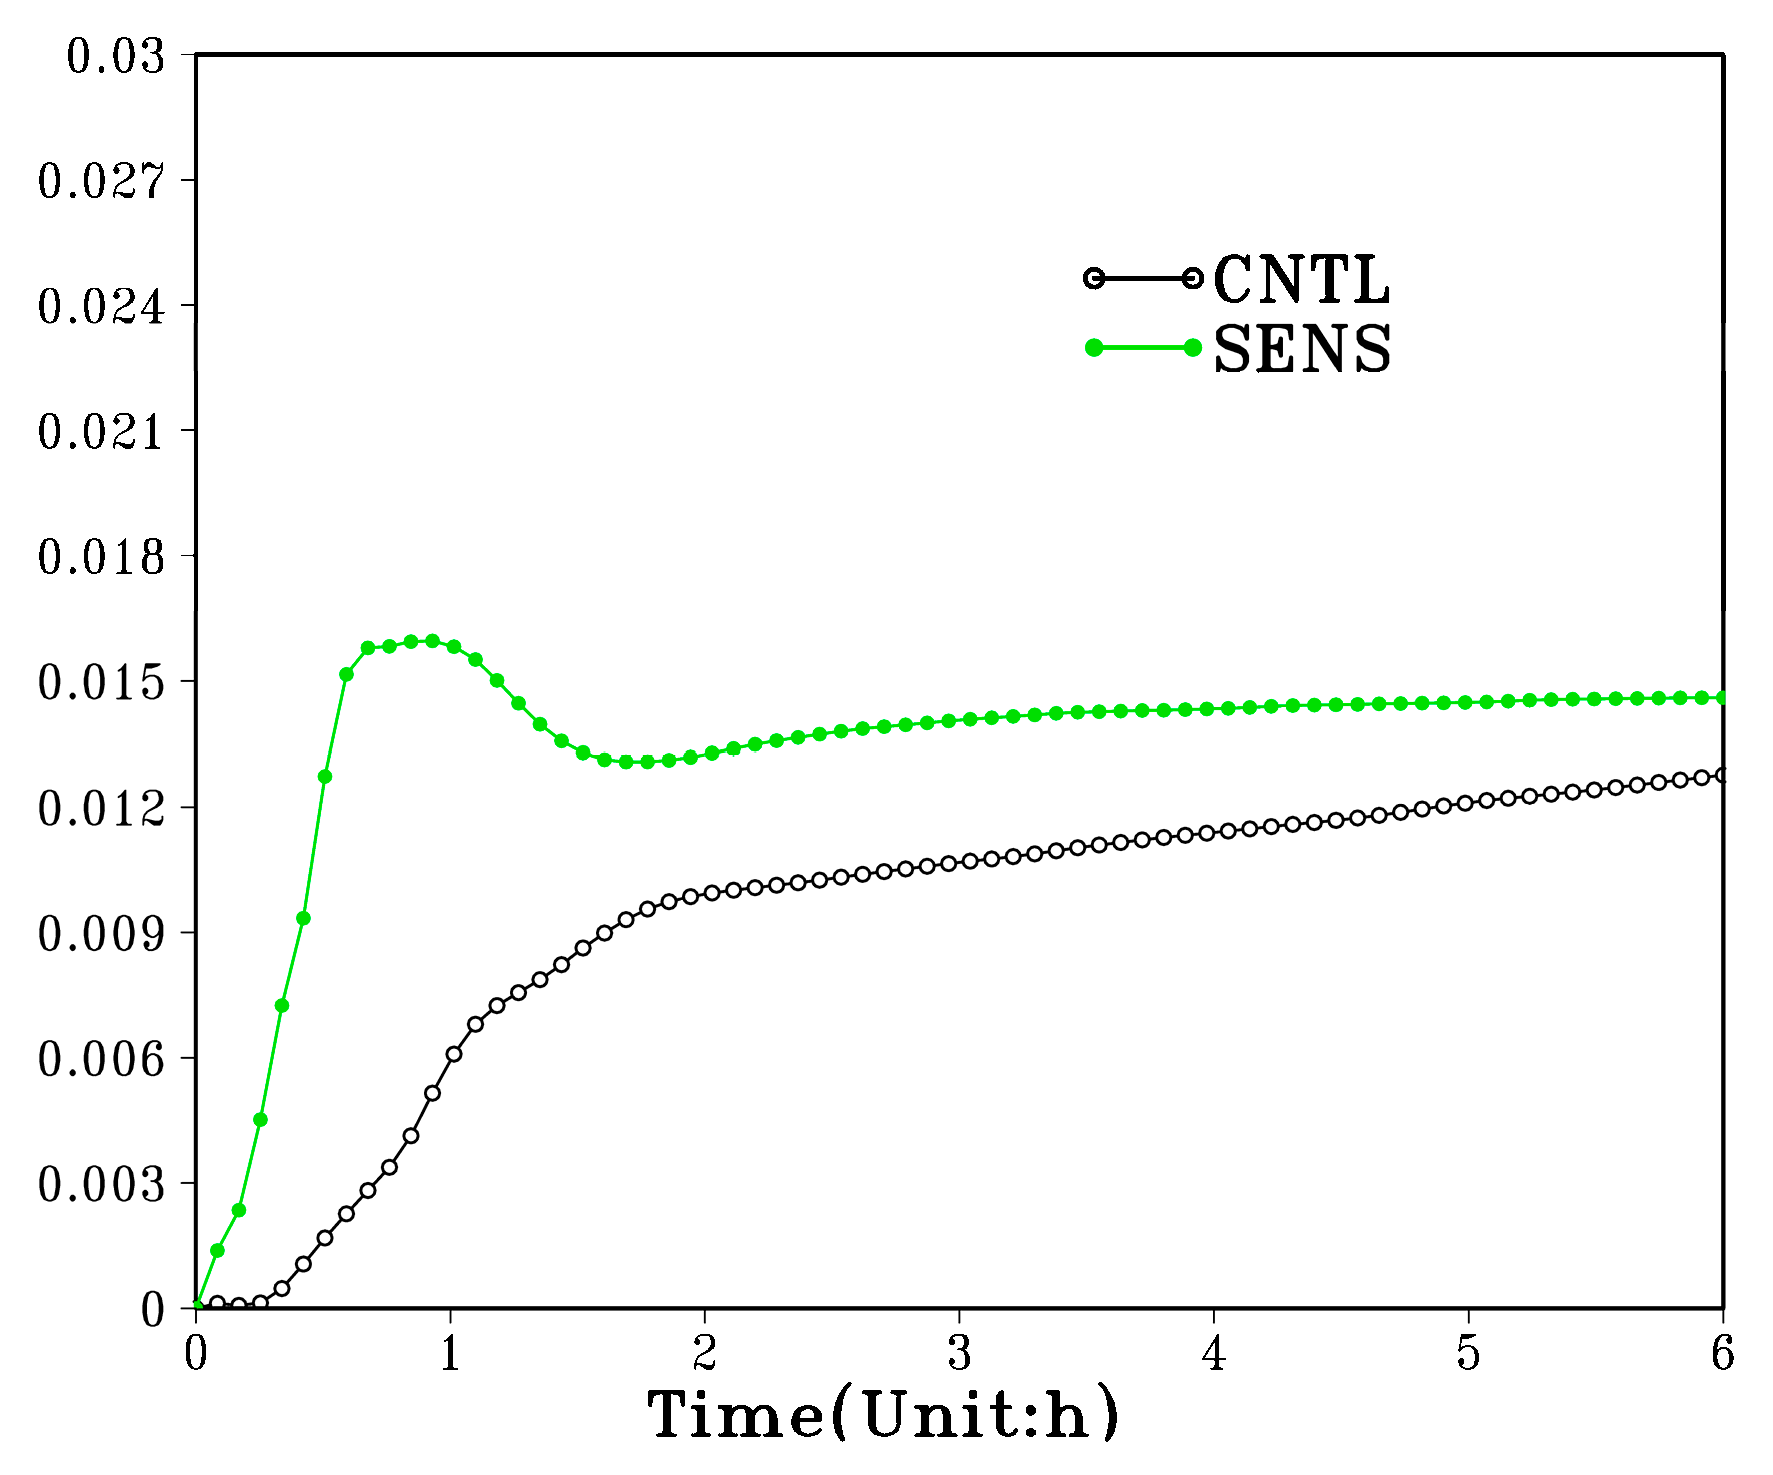
Figure 3 presents the evolution of the 850 hPa mean rainwater mixing ratio during the 0–6 h forecast period. Model outputs were generated at 5 min intervals throughout the integration process; thus, the plotted data resolution corresponds to 5 min intervals.
Under sustained heavy precipitation conditions, the CNTL (black line) without cloud microphysics initialization exhibited pronounced spin-up hysteresis, requiring over 1.5 h to establish stable precipitation. In contrast, the SENS (green line) achieved stabilized rainfall within 30 min through effective assimilation of in-cloud microphysical characteristics, achieving accelerated model spin-up while sustaining stable precipitation intensity.
  • Impact Analysis of Cloud Forecast
Figure 4 compares the FY-4A 10.8 μm infrared brightness temperature at 01:00 UTC on 20 July 2021 with the 1 h forecasts from the CNTL and SENS.
The comparison between the CNTL and SENS demonstrated that the CNTL underestimated the intensity of the cold cloud top and failed to accurately capture the fine-scale structure of the system. In contrast, the SENS showed better agreement with the FY-4A observations in terms of cloud-top temperature, system morphology, and temperature gradient, and exhibited significant improvements in simulating the heavy precipitation core region. These findings demonstrate that the proper initialization of cloud microphysical fields enhances numerical forecasts of cloud systems during extreme rainfall events.
  • Impact Analysis of Precipitable Water Vapor (PWV) Forecast
Figure 5 presents a comparison between GNSS (Global Navigation Satellite System)-derived precipitable water vapor (PWV) observations and the model forecasts at 0200 UTC 20 July 2021. The GNSS observations identified a pronounced PWV maximum, which spatially coincided with the heavy rainfall core. The CNTL failed to reproduce this moisture-enriched region in its 2 h PWV forecast, whereas the SENS successfully captured the PWV maximum over the precipitation epicenter.
  • Impact Analysis of Precipitation Forecast
The comparative analysis of the numerical simulations and observations of the 6 h precipitation forecast initialized at 00 UTC on 20 July 2021 Figure 6 revealed that the CNTL could reproduce the basic characteristics of the precipitation event. However, there were significant discrepancies in the precipitation intensity and spatial distribution, which manifested as a displacement of the heavy precipitation centers and underestimation of the rainfall intensity.
In contrast, the SENS demonstrated substantial improvements in forecast performance. It not only captured the location and intensity features of the heavy precipitation centers more accurately, but also produced more realistic spatial distributions of the precipitation bands.
These improvements primarily stemmed from the introduction of cloud microphysical initial conditions, which enabled more realistic distributions of the cloud microphysical variables (including cloud water, rainwater, ice crystals, etc.) in the model’s initial field. Consequently, the simulations better represented the developmental evolution of cloud microphysical processes.
This study demonstrated that the refined initialization of cloud microphysical variables constitutes a crucial factor for improving short-term heavy precipitation forecasts. The enhanced forecast accuracy for heavy precipitation events holds significant implications for severe convective weather warnings.
  • Thermodynamic Response Analysis
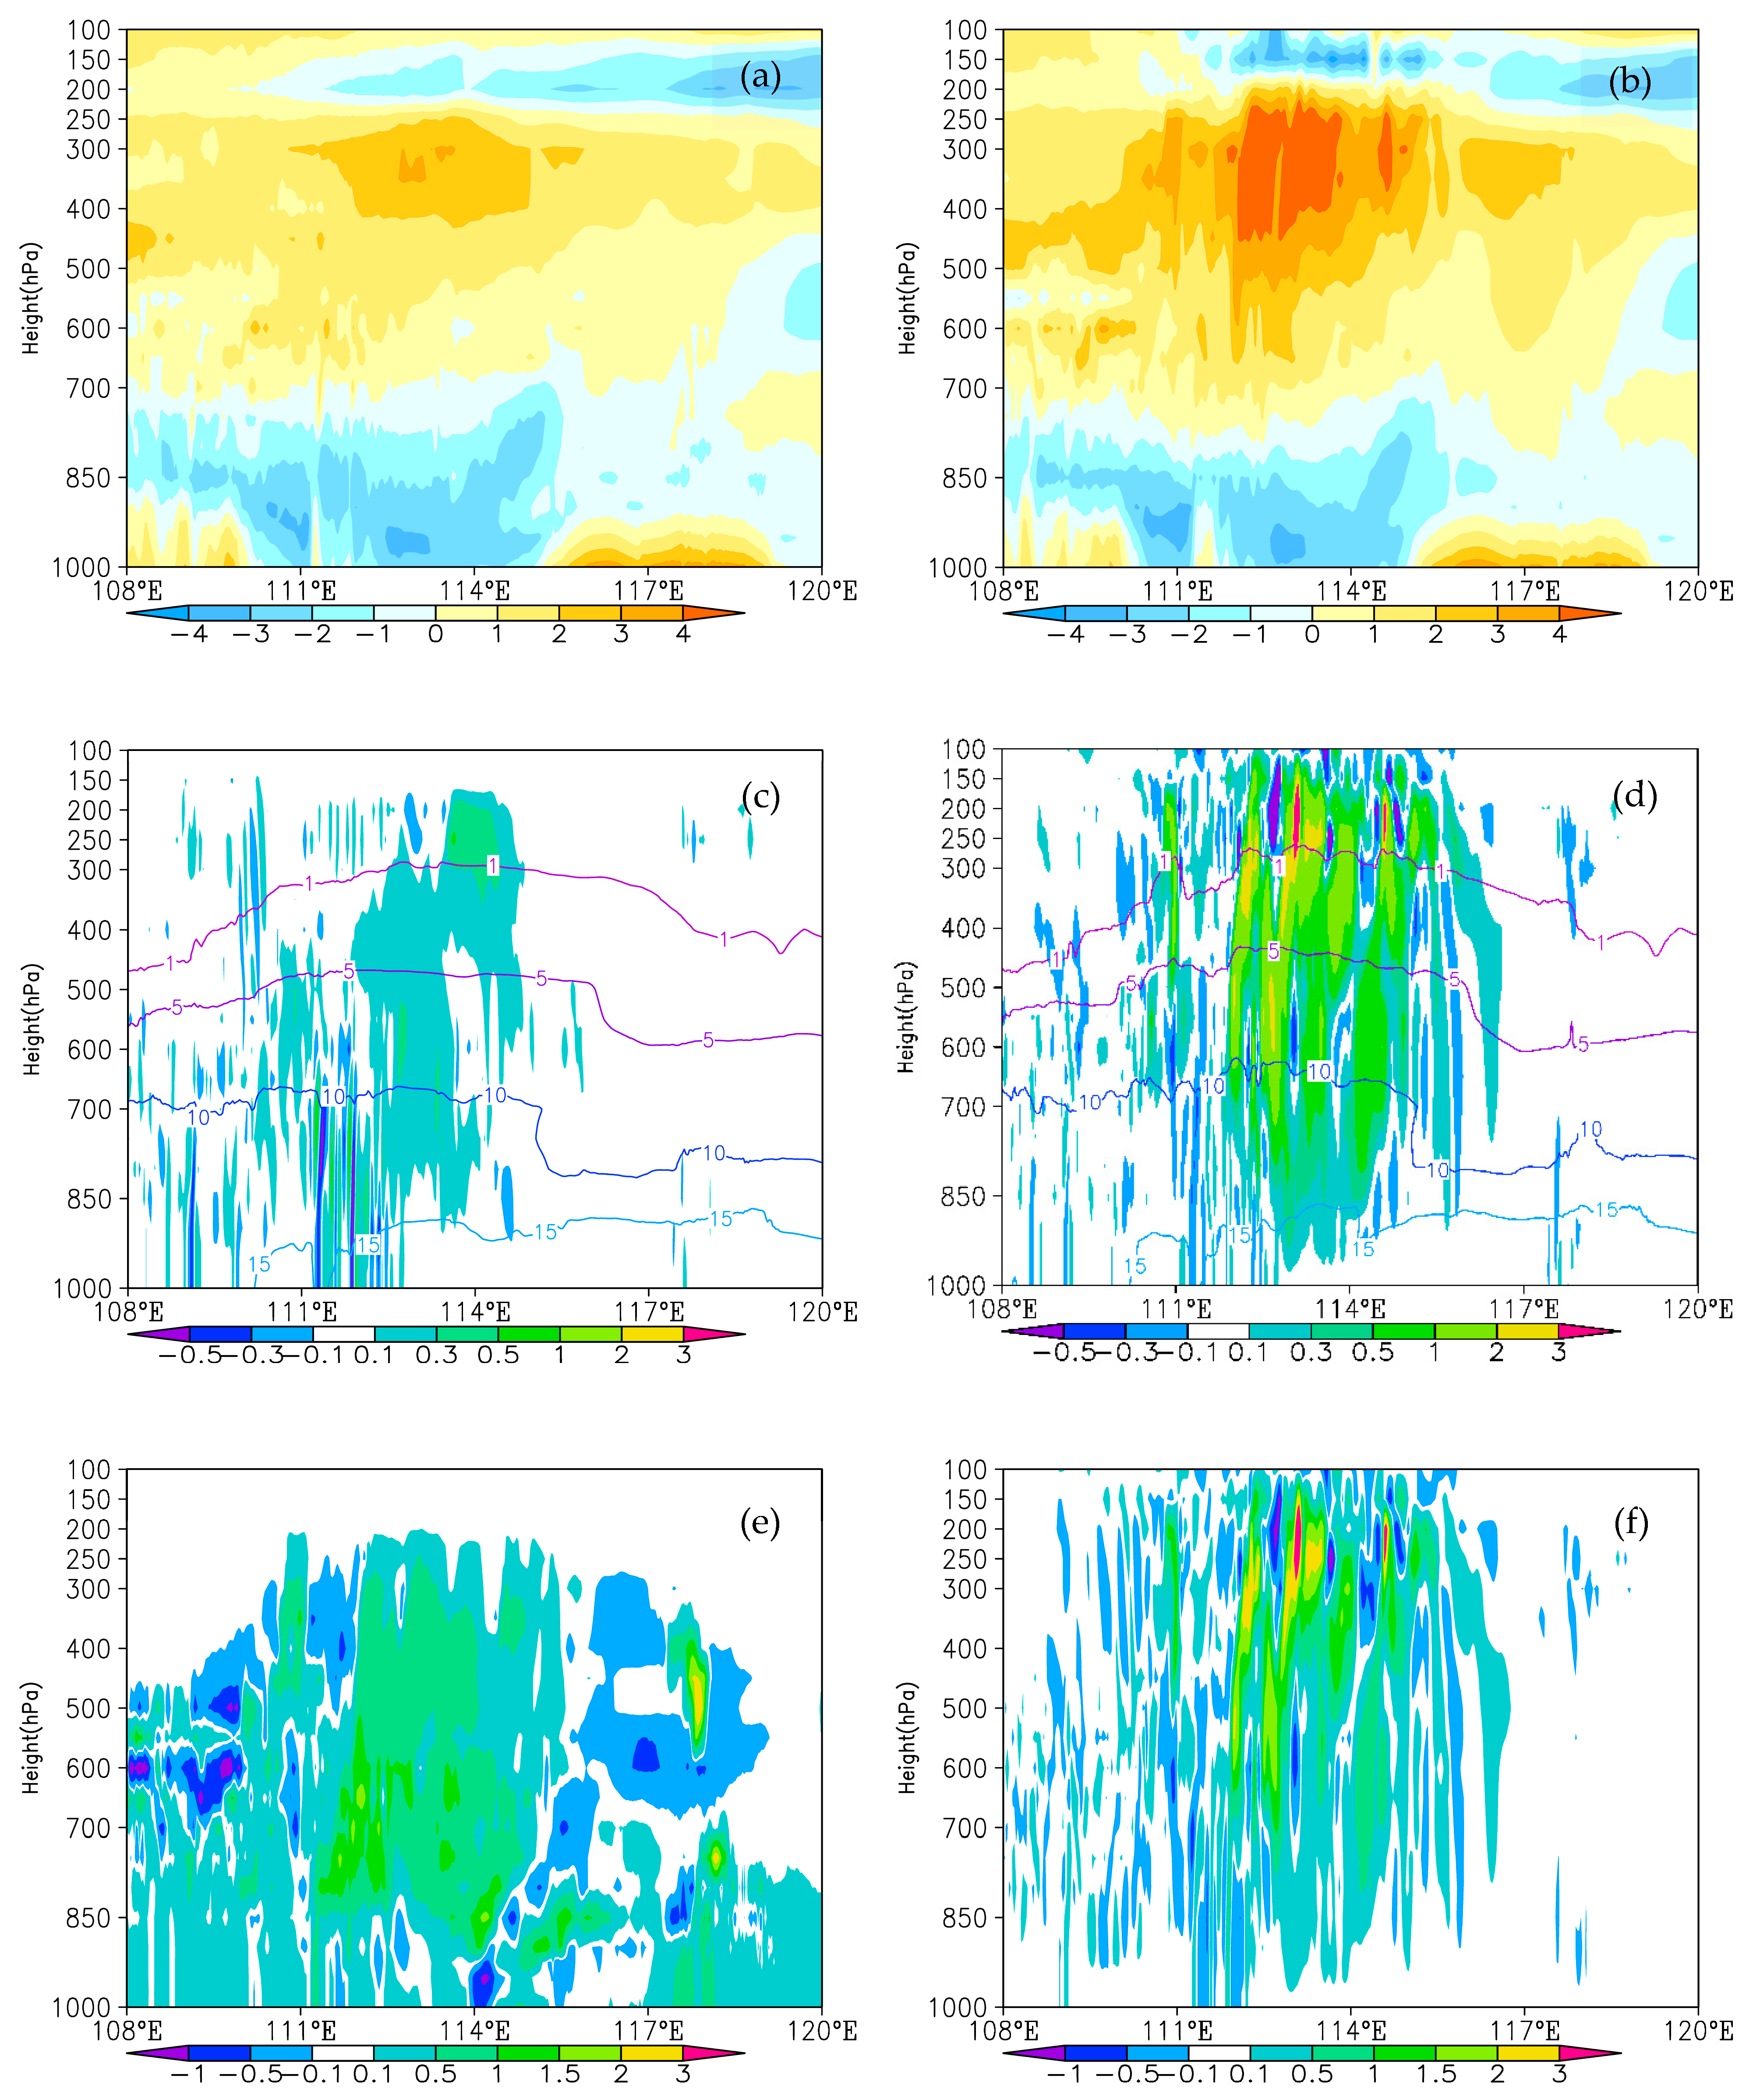
Figure 7 shows vertical cross-sections along 35°N at 0200 UTC 20 July 2021 (2 h forecast). These are the temperature perturbations for CNTL and SENS (Figure 7a,b), specific humidity superimposed with vertical velocity (Figure 7c,d), and the specific humidity difference (Figure 7e) and vertical velocity difference (Figure 7f) between SENS and CNTL. The temperature perturbation was computed as the deviation from the spatial mean state of the baseline field. The SENS exhibited pronounced temperature perturbations compared to the CNTL, particularly in the 500–700 hPa layer (Figure 7a,b). This enhancement was partly driven by latent heat release from warm-rain processes involving low-level cloud water and water vapor. A notable positive temperature anomaly center was observed in the mid-to-upper atmosphere (500–250 hPa) over the 111–115° region. This warming is likely attributable to the latent heat release from the phase changes in ice-phase particles (e.g., ice crystals and snow) during deposition and freezing processes.
The initialization of cloud microphysical and thermodynamic variables in the SENS enhanced the specific humidity predictions Figure 7c, especially in the heavy precipitation center (111–115°). The strengthened vertical motion facilitates upward moisture transport, promoting ice-phase particle growth and further latent heat release.
The enhanced vertical velocity in the SENS, particularly near the precipitation core, indicates intensified updrafts Figure 7a,b,d. This dynamic response not only redistributes moisture but also amplifies condensational heating, contributing to upper-level atmospheric warming.
The instability induced by modified temperature and moisture profiles likely increases buoyancy, fostering convective development.

4. Analysis of Continuous Experiment Results

4.1. Influence on Precipitation

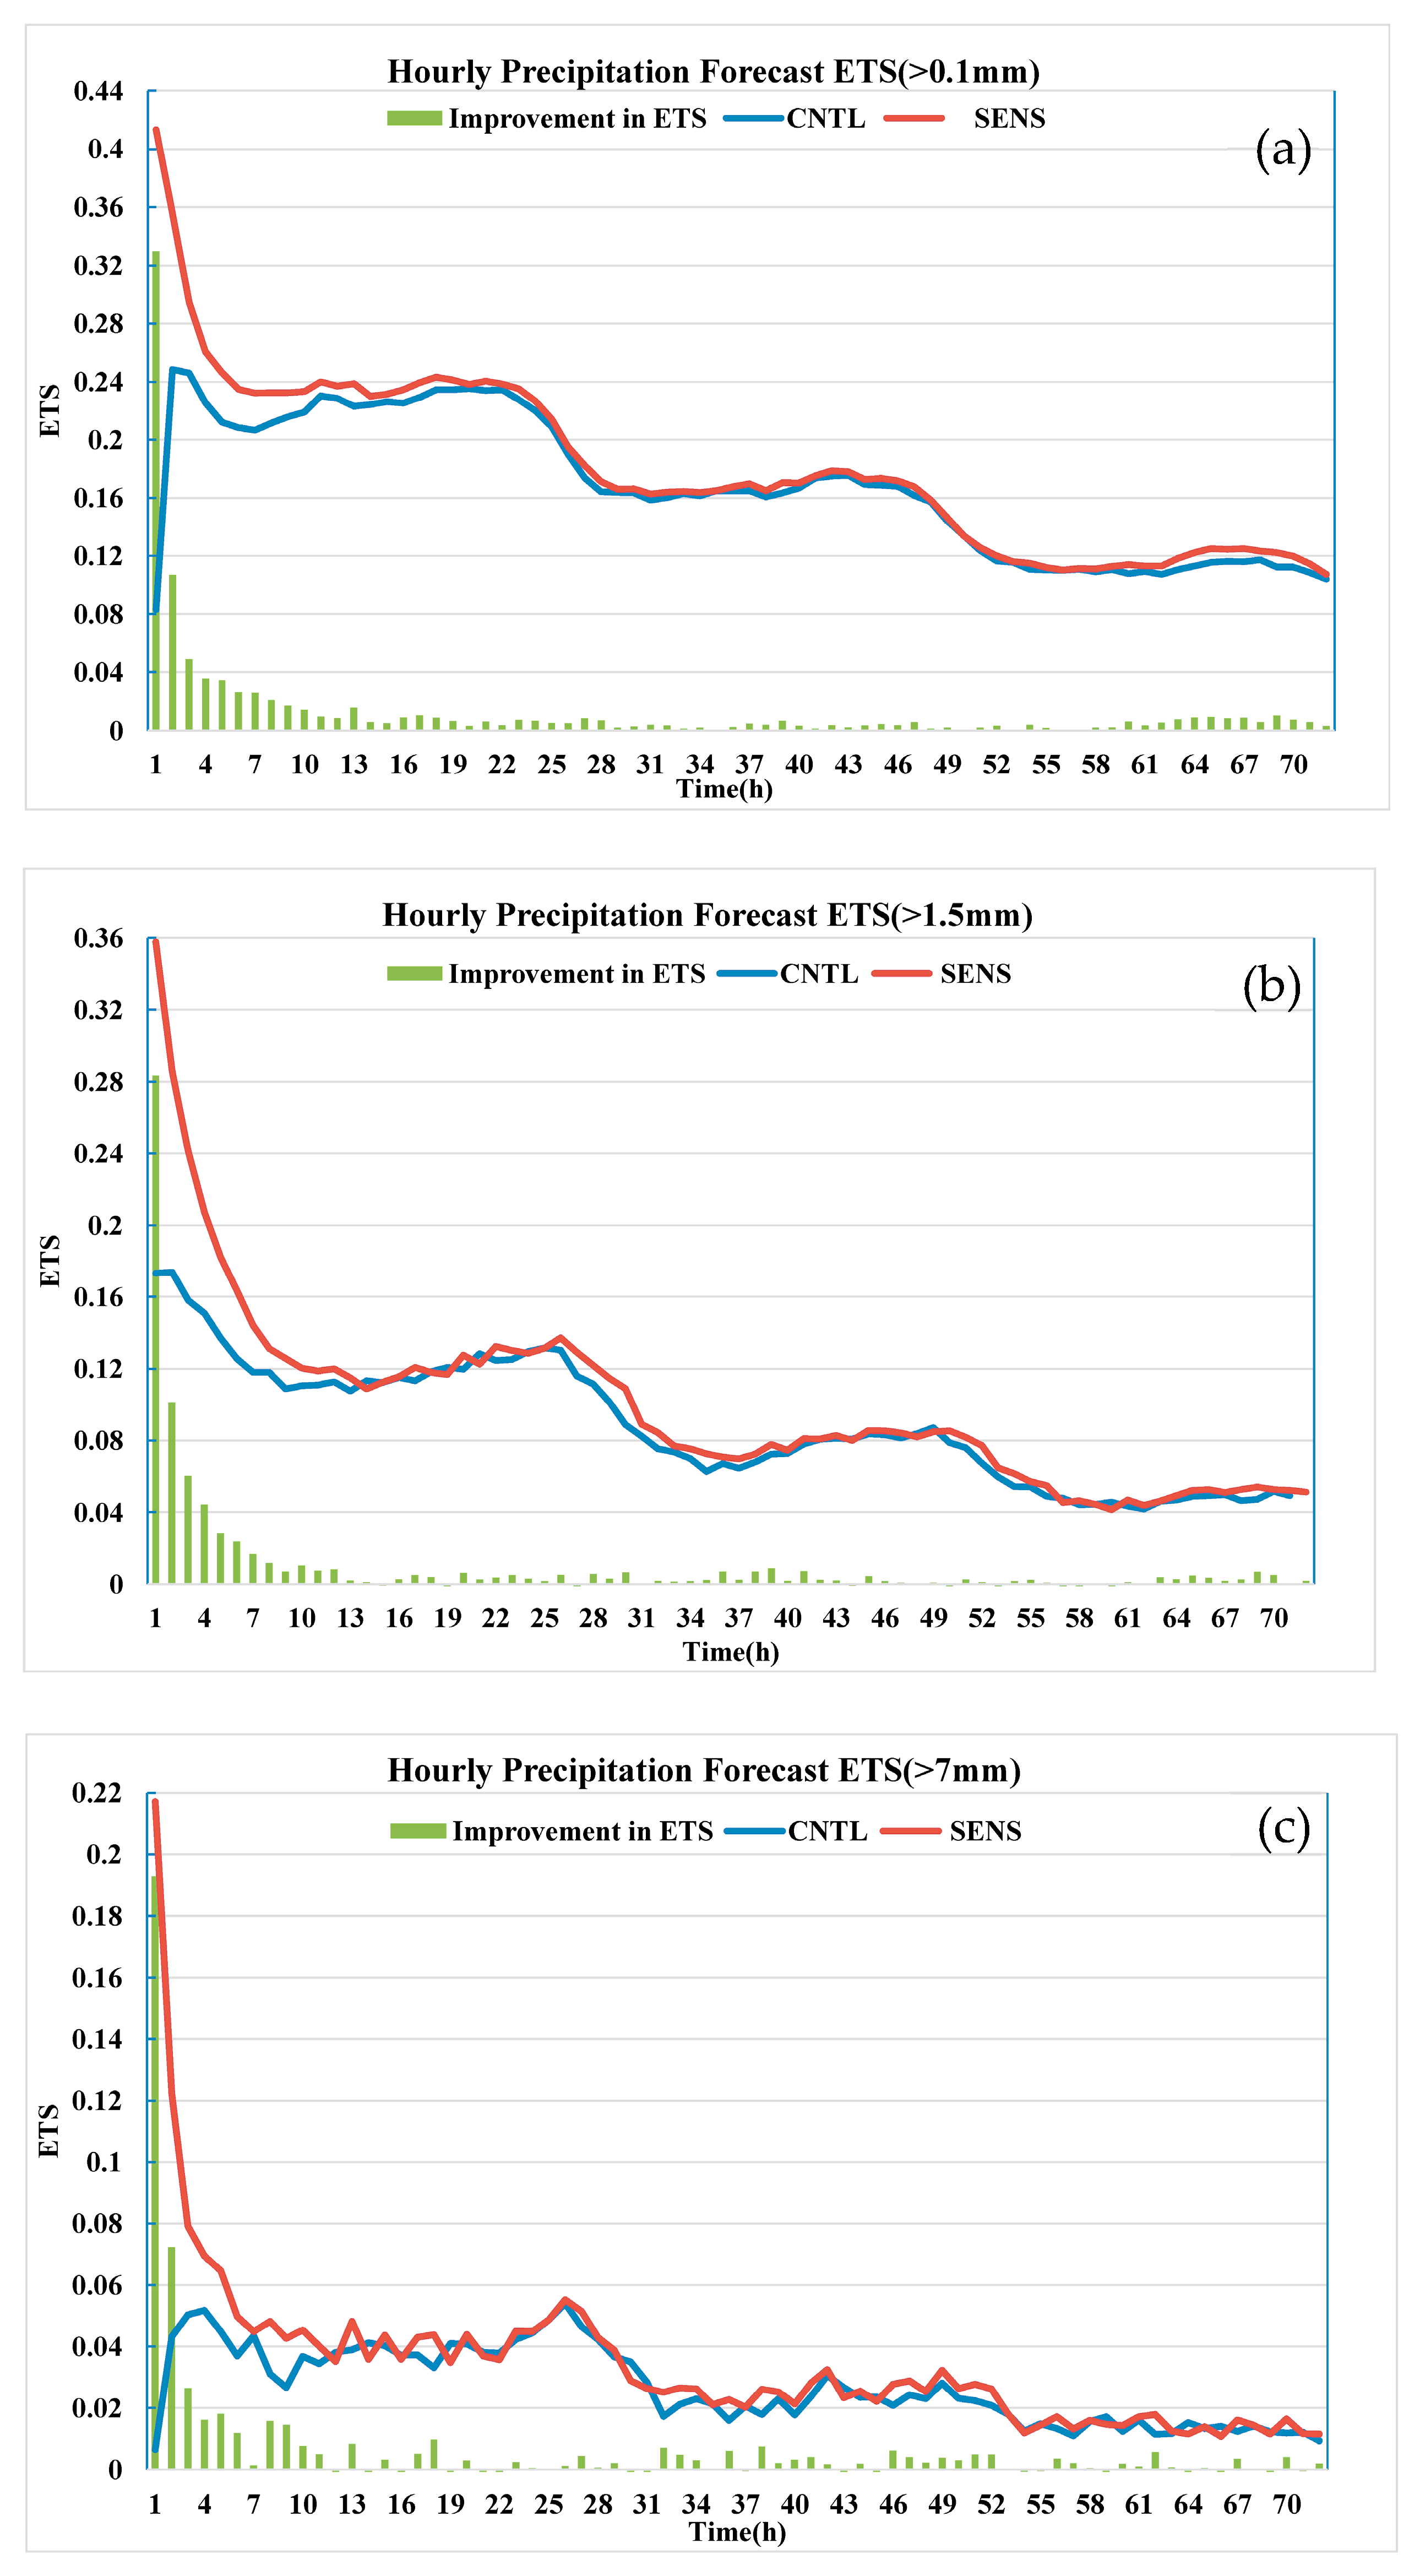
Figure 8 shows the 72 h forecast hourly precipitation ETSs from the three-month continuous experiment (1 May to 31 July 2024). The x-axis represents the forecast lead time while the y-axis indicates the ETS values. The red and blue curves correspond to the SENS and CNTL, respectively, with the green bars indicating the improvements in the ETSs of the SENS relative to the CNTL. The key findings on precipitation forecast accuracy enhancements are as follows. The initial forecast lead time (1 h) exhibited substantial improvements. The ETSs for light, moderate, and heavy rainfall increased from 0.083, 0.043, and 0.007 to 0.41 (396% relative improvement), 0.36 (736%), and 0.217 (3174%), respectively, indicating a rapid response to intense precipitation systems and effective shortening of the model spin-up process. In contrast, the non-assimilated experiment demonstrated limited precipitation forecasting capabilities during this lead time.
The short-term (2–12 h) precipitation prediction accuracy of the SENS demonstrated significant enhancement compared to the CNTL. During the 2–6 h forecast period, the ETS exhibited average improvements of 21%, 35%, and 71% for light, moderate, and heavy rain events, respectively. Meanwhile, during the 7–12 h forecast period, the ETSs showed average increases of 7.5%, 9.8%, and 24.9% for these three precipitation intensity categories. These results highlight the model’s enhanced efficiency in capturing short-term precipitation patterns. These results demonstrate that cloud microphysical initial conditions can significantly enhance the accuracy of short-term precipitation forecasting. While significant improvements were achieved within 12 h, the extended forecast window (12–72 h) demonstrated a limited enhancement in accuracy.

4.2. Analysis of the Influence on 2 m Temperature Forecasts

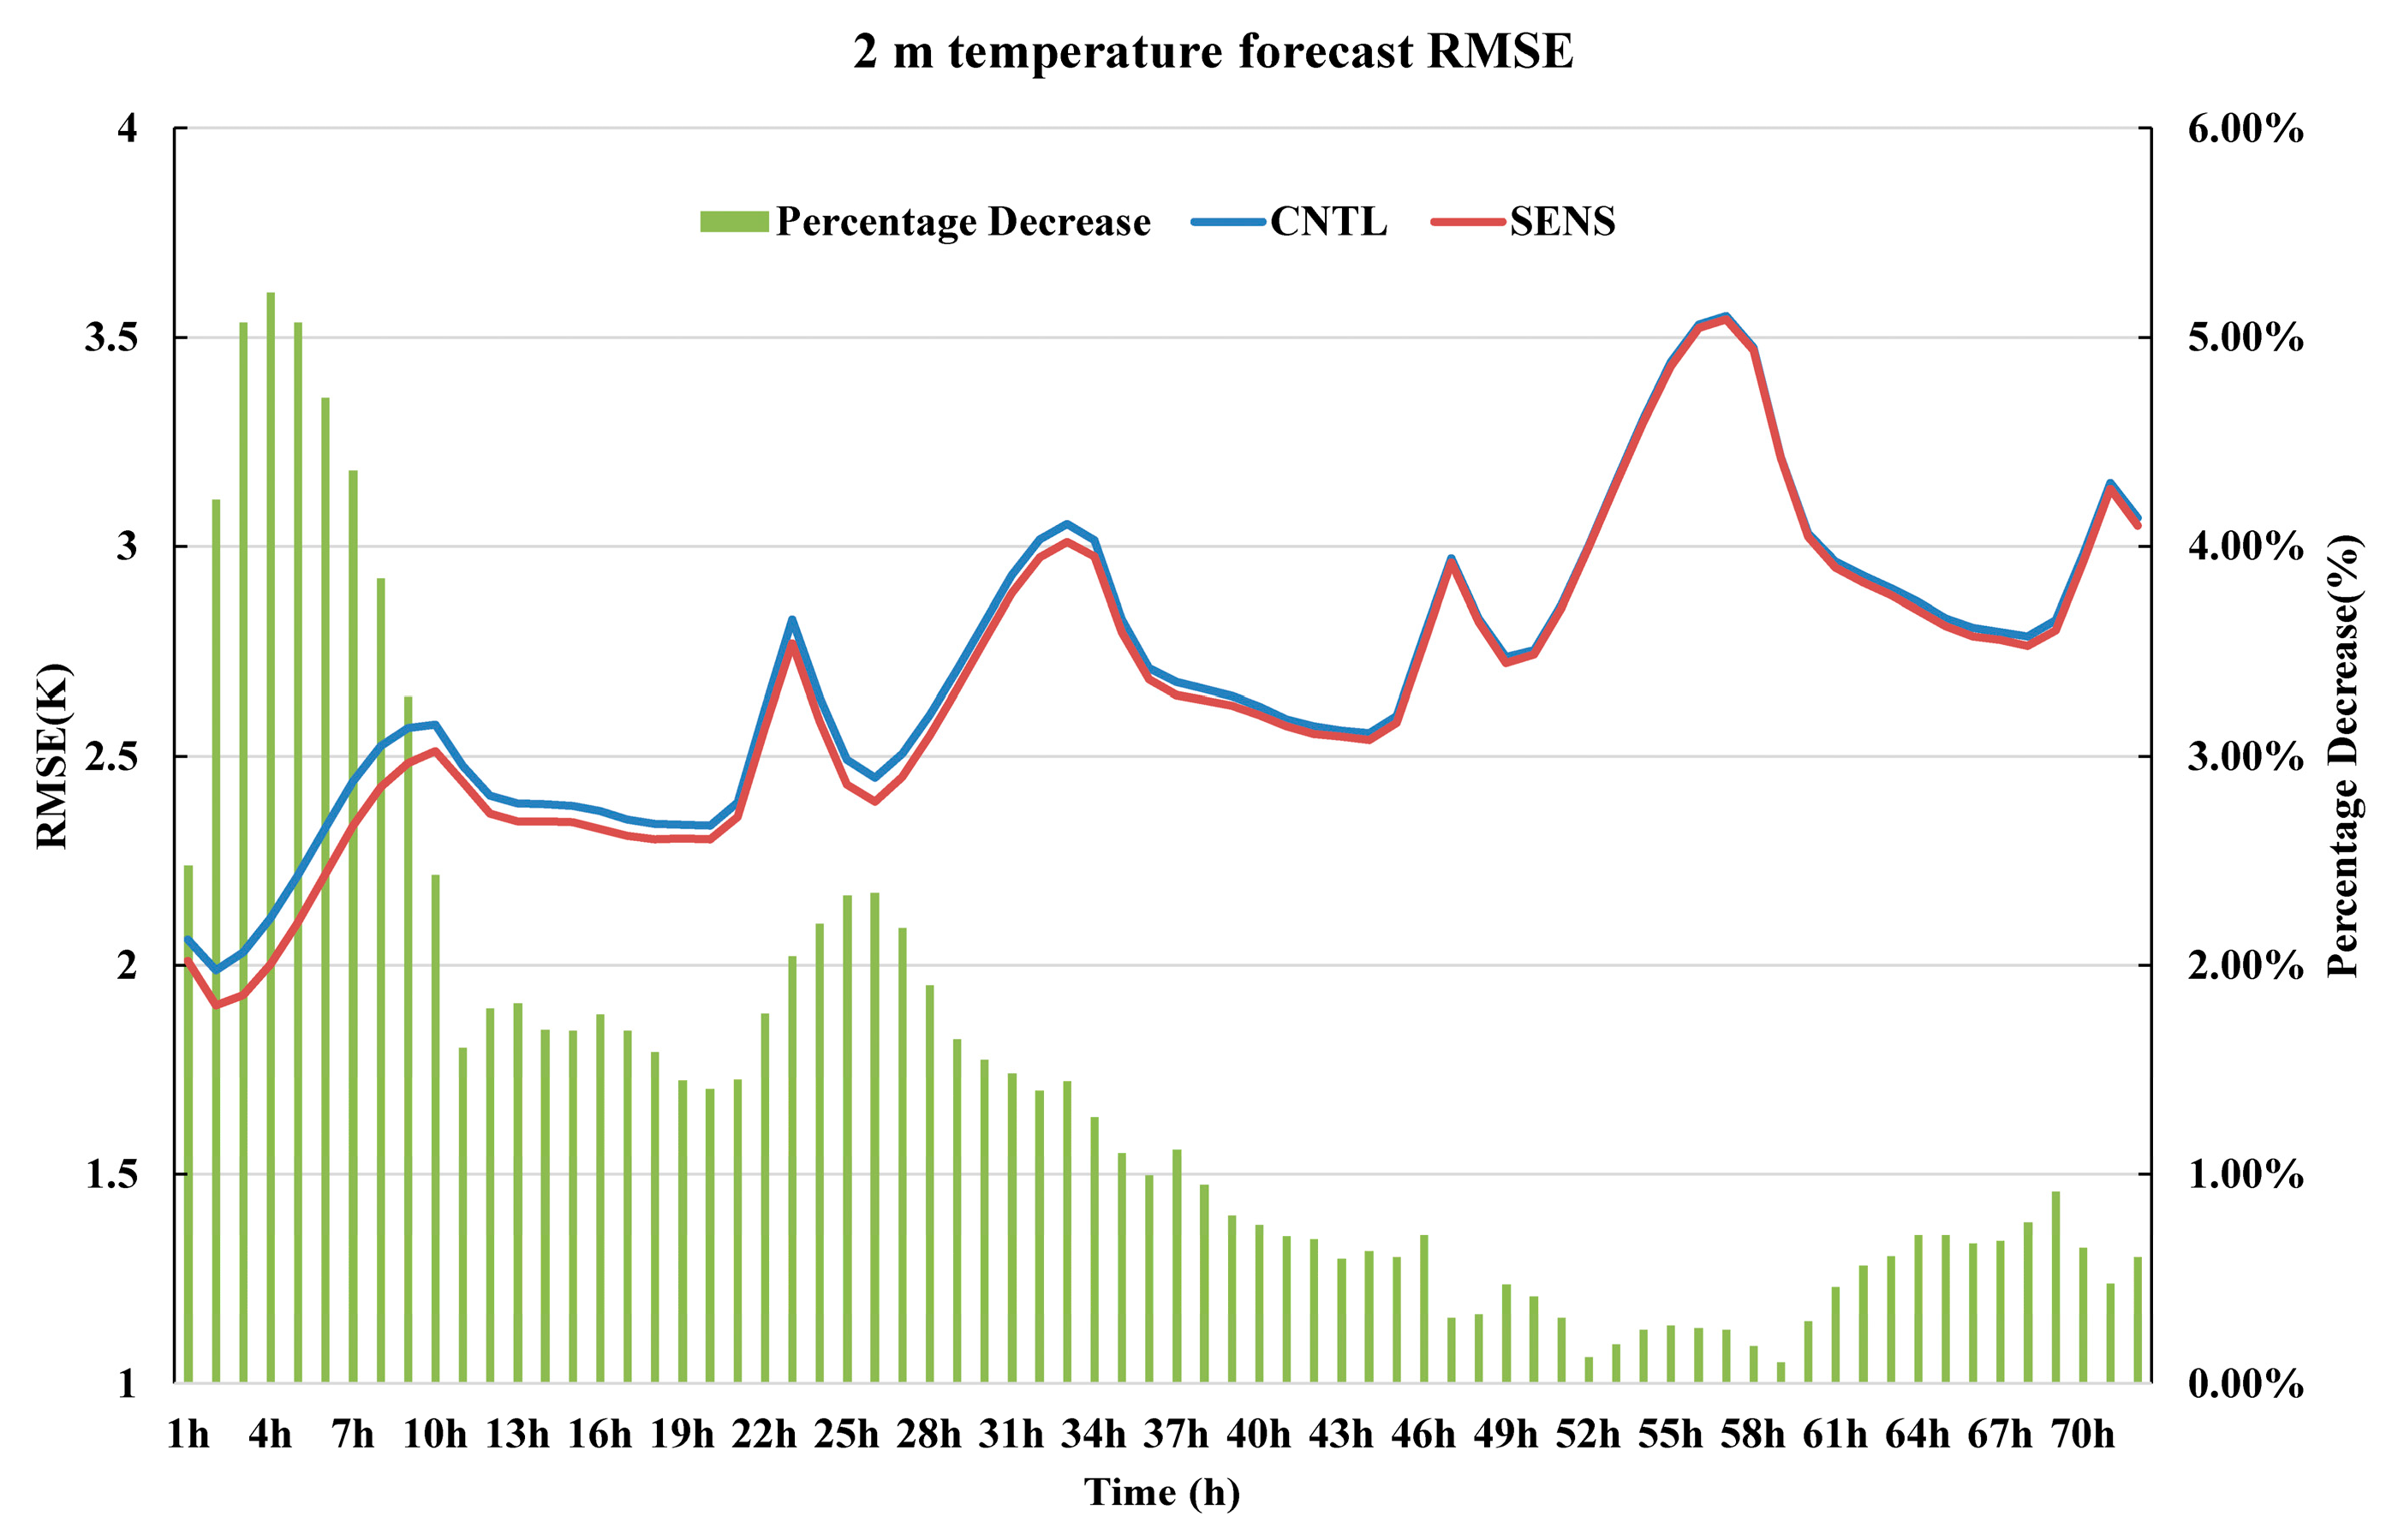
Figure 9 presents the root mean square error (RMSE) of the hourly 2 m temperature forecasts in the three-month continuous experiments conducted from 1 May to 31 July, 2024. The SENS showed superior performance across all forecast lead times (1–72 h), with an average RMSE reduction of 1.4% compared to the CNTL. The largest error reduction occurred during the 1–9 h forecast period, showing an average RMSE decrease of 4.2% and a peak reduction of 5.2%. The improvement magnitude exhibited a decreasing trend as the forecast lead time increased. For lead times of 24–48 h, the average RMSE reduction was 1.2%. The 49–72 h period exhibited an average RMSE reduction of 0.4%. Although the degree of improvement exhibited an overall decreasing trend with forecast lead time, the sustained positive effects of cloud microphysics initialization persisted throughout the entire 72 h forecast cycle.

4.3. Impacts on Geopotential Height Forecasts

Figure 10 shows the root mean square errors (RMSEs) of the 24 h, 48 h, and 72 h geopotential height forecasts compared to the NCEP analysis fields during the three-month continuous experiment (1 May to 31 July 2024). The red and black lines on the left side of the figure represent the RMSE values from the SENS and CNTL, respectively, while the red line on the right side indicates the RMSE difference between these two experiments. The results demonstrate that the SENS produced lower mean RMSEs compared to the CNTL: the 24 h forecast RMSE decreased from 9.65 gpm to 9.09 gpm (5.8% reduction); the 48 h forecast RMSE decreased from 15.34 gpm to 14.83 gpm (3.3% reduction); and the 72 h forecast RMSE decreased from 21.08 gpm to 20.65 gpm (2.0% reduction).
The SENS exhibited systematic RMSE reductions across all forecast lead times, and all the improvements were statistically significant. These findings indicate that microphysical data assimilation improves height field predictions through optimized initial conditions.

4.4. Impacts on 10 m Wind Forecasts

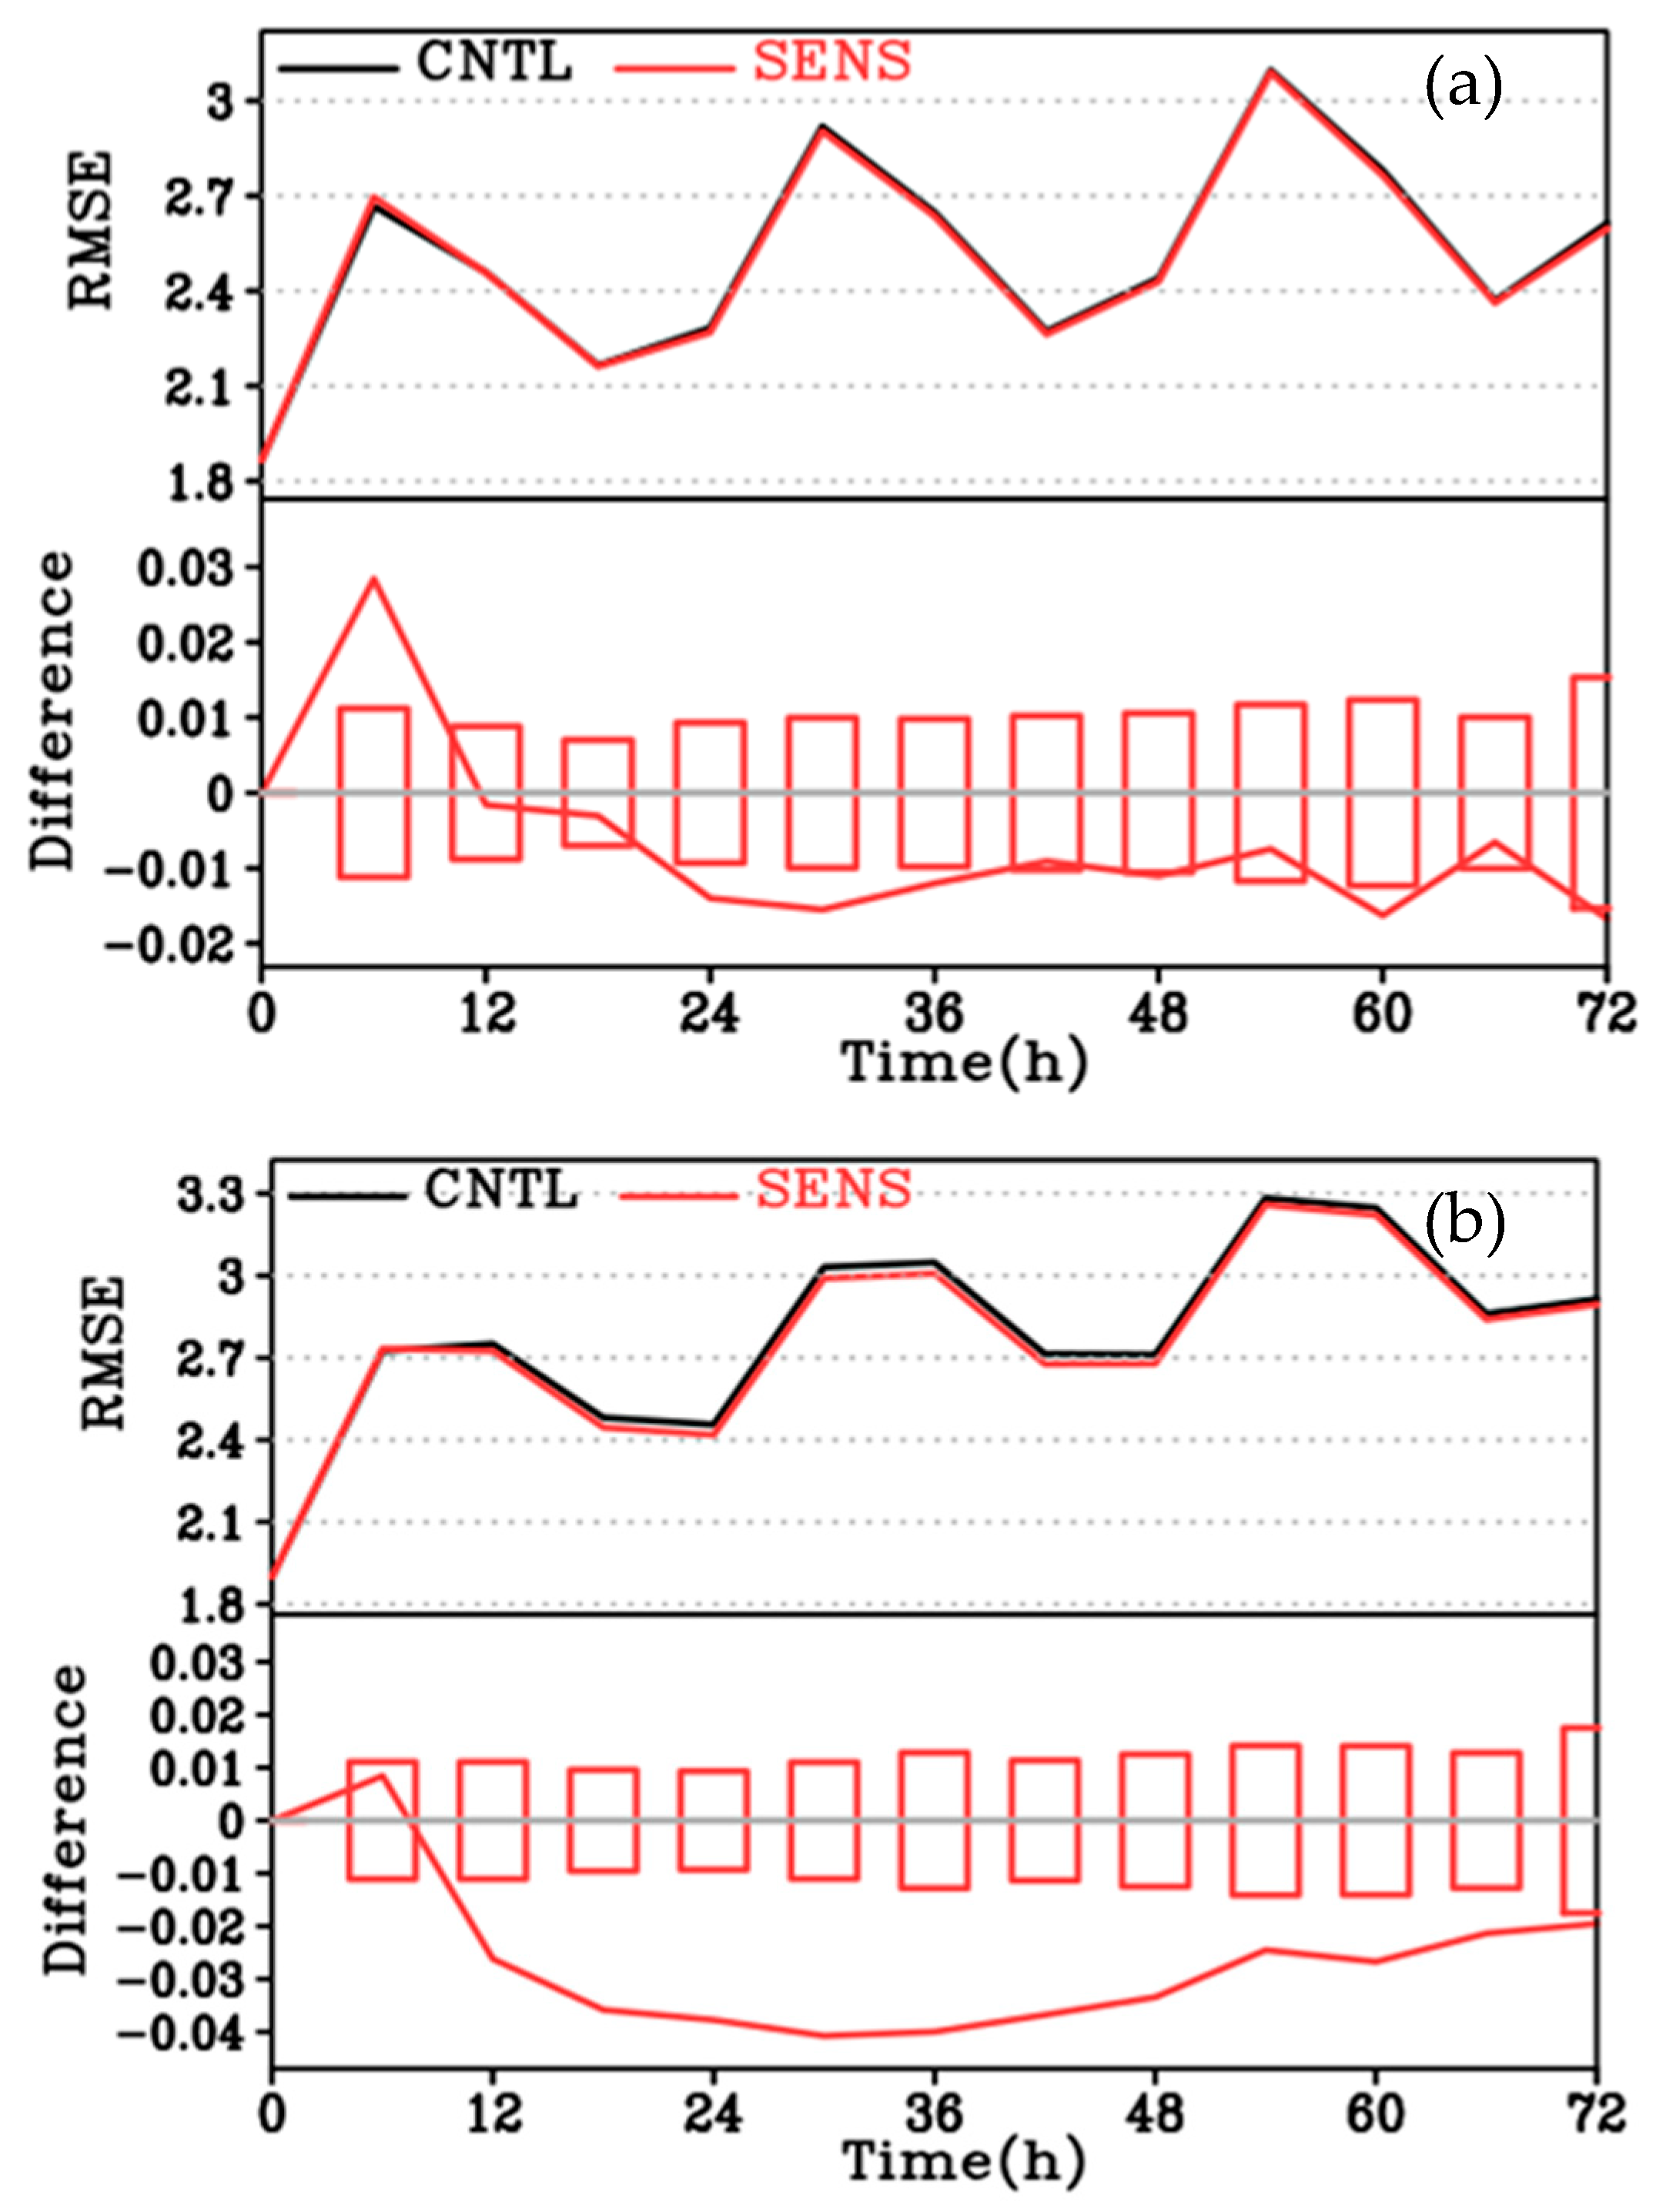
Next, we compared the RMSE of the 10 m wind forecasts from the SENS (red lines) and CNTL (black lines) against surface observations with 6 h verification intervals from the continuous experiment from 1 May to 31 July 2024. Figure 11 presents the zonal wind (U-component) and meridional wind (V-component) results. The lower panel illustrates the RMSE differences between the two experiments (red lines), accompanied by the confidence testing results.
The SENS exhibit RMSE reductions at 11 verification intervals compared to CNTL, except for a slight increase at the 6 h time point. The U-component verification showed a marginal improvement, with the root mean square error (RMSE) decreasing from 2.506 to 2.499 m s−1. Similarly, the V-component exhibited a measurable improvement, as the average RMSE decreased from 2.778 to 2.753 m s−1. Both components demonstrated long-lasting effectiveness in error reduction throughout the forecasting period.

5. Discussion

This study investigated the impacts of assimilating cloud microphysical initial variables on the forecast performance of the CMA-MESO 3 km regional NWP system. The observational data employed for the cloud microphysical initial value analysis encompassed three key datasets: the (1) TBB and (2) CTA products from the CMA-FY2 geostationary satellite, and (3) 3D mosaic reflectivity from next-generation weather radars.
The results demonstrated that the implementation of cloud initialization fields significantly reduced the spin-up time of the forecasting system, thereby enabling the timely and effective prediction of heavy rainfall events. Enhanced forecasting performance was demonstrated for precipitation, surface meteorological elements, and geopotential height fields.
Notably, in comparison with existing studies, our findings revealed that the application of radar-satellite-derived cloud initialization fields not only significantly improves nowcasting and short-term (0–12 h) precipitation forecasting, but also enhances prediction accuracy for 12–72 h lead times across multiple parameters, as evidenced by the continuous experiments. Systematic reductions in the root mean square error (RMSE) were observed for 2 m temperature forecasts across all lead times (1–72 h), with an average hourly reduction of 1.4%. Similarly, the geopotential height field forecasts demonstrated mean RMSE decreases of 5.8%, 3.3%, and 2.0% with 24 h, 48 h, and 72 h lead times, respectively. Furthermore, wind field predictions exhibited consistent improvements throughout the 12–72 h forecast window.
The underlying mechanisms can be explained as follows: numerical weather prediction characterizes atmospheric states through primitive equations and enables forecasting by solving this dynamical system. As highlighted by Kalnay [2], the NWP solution exhibits continuous dependence on the initial and boundary conditions. The effective cloud microphysical initial values derived from remote sensing data exert positive feedback on multiple physical processes that govern atmospheric dynamics. Cloud microphysical initial values, serving as the initial conditions for microphysical processes, directly improve cloud and precipitation forecasts. Improved cloud predictions can subsequently regulate temperature fields via radiative feedback mechanisms, thereby refining the forecasts of temperature and geopotential height fields. Furthermore, cloud microphysical processes influence large-scale circulation through thermodynamic interactions (e.g., latent heat release), which modifies the vertical thermal structure of the atmosphere. Concurrently, the cloud microphysical initial conditions modulate the pressure gradient force through latent heat distribution, leading to adjustments in wind field predictions. These findings demonstrate the critical role of initial cloud conditions in model initialization. High-precision cloud initial fields can significantly improve the accuracy of numerical weather prediction.
The cloud microphysical variable initialization scheme presented in this study was implemented in the CMA-MESO 3 km systems of the China Meteorological Administration. This methodology was demonstrated to be effective in enabling the timely and accurate forecasting of high-impact weather events, particularly severe convective systems.
A limitation of this study concerns the inherent uncertainties in the initial cloud microphysical variables, which arise from current observational systems’ inability to resolve true cloud morphologies. Additionally, hydrometeors such as cloud water, cloud ice, and rainwater are not measurable through direct observations, requiring assumption-dependent physical parameterizations and empirically derived observational correlations. Therefore, given the rapid advancement of meteorological detection technologies, future research should focus on the following directions: First, it is necessary to assimilate more remote sensing data, such as multi-band radar data (including spaceborne radar, dual-polarimetric radar, and ground-based cloud radar) and multi-source satellite data. Second, it is essential to develop cloud-related variable assimilation algorithms that more accurately reflect cloud-scale characteristics. Enhancing the accuracy of cloud initialization could contribute to optimizing forecast results.

6. Conclusions

This study evaluated the impact of cloud microphysical initialization assimilation—incorporating the TBB and CTA products from the CMA FY-2 satellite, along with next-generation radar 3D mosaic reflectivity—on the performance of the CMA-MESO 3 km regional NWP system. Through a diagnostic analysis of extreme precipitation events and three-month batch experiments, we demonstrated that improved cloud initialization effectively enhanced the forecast accuracy of the 3 km resolution model. The key findings are as follows:
  • The effective analysis and assimilation of cloud microphysical initial values significantly reduced the model spin-up time, accelerating rainwater prediction. The 1 h forecast successfully captured heavy precipitation cloud clusters with a spatial pattern consistent with those of observations, accompanied by a notable improvement in precipitation scores. These results demonstrate a substantial enhancement in the nowcasting capability for heavy precipitation events.
  • The 0–12 h precipitation forecast accuracy was comprehensively enhanced, with the improvements persisting throughout the entire 72 h forecast window. Following the application of initial cloud microphysical-related variable values, the 1 h precipitation ETS demonstrated substantial improvements: from 0.083 to 0.41 (+396%) for light rain, 0.043 to 0.36 (+736%) for moderate rain, and 0.007 to 0.217 (+2971%) for heavy rain. Within the 2–6 h forecast range, the hourly ETSs for light to heavy precipitation exhibited mean enhancements of 21–71%. The ETSs for light, moderate, and heavy rain increased by 7.5%, 9.8%, and 24.9% at 7–12 h, with limited improvement beyond 12 h.
  • The forecast accuracies for temperature, geopotential height, and wind fields simultaneously improved. Following the application of initial cloud microphysical-related variable values, the RMSE of the 2 m temperature forecasts decreased throughout the 1–72 h range, with an average reduction of 4.2% during 1–9 h. For geopotential height fields, the RMSE decreased by 5.8%, 3.3%, and 2.0% with 24 h, 48 h, and 72 h lead times, respectively. Improvements were also observed in the 10 m wind field forecasts. These results demonstrate that cloud microphysical initial values can systematically enhance model prediction through radiation–thermodynamic feedback mechanisms.

Author Contributions

Conceptualization, J.G. and L.Z.; methodology, L.Z.; software, L.Z. and Y.J.; validation, L.Z. and D.W.; formal analysis, L.Z.; investigation, L.Z.; resources, L.Z. and Y.J.; data curation, L.Z., Y.J. and D.W.; writing—original draft preparation, L.Z.; writing—review and editing, L.Z. and Y.J.; visualization, L.Z. and D.W.; supervision, J.G.; project administration, J.G. and Y.J.; funding acquisition, J.G. and Y.J. All authors have read and agreed to the published version of the manuscript.

Funding

This research was funded by National Key R&D Program of China (2022YFC3004002), Joint Funds of the National Natural Science Foundation of China (U2442601), Opening Foundation of the State Key Laboratory of Severe Weather (Grant 2023LASW-B12), and Open Research Topics of the Key Laboratory for Critical Technologies in Disaster Precipitation Numerical Modeling and AI-Integrated Forecasting (MAIN-K2024003).

Data Availability Statement

The data presented in this study are available upon request from the corresponding author.

Acknowledgments

The authors would like to acknowledge the National Satellite Meteorological. Centre of the CMA for providing the satellite data. Special thanks go to the anonymous reviewers for their constructive suggestions that significantly improved this manuscript, and to the editorial team for their professional guidance.

Conflicts of Interest

The authors declare no conflicts of interest.

References

  1. Hong, S.-Y.; Sunny Lim, K.-S.; Kim, J.-H.; Jade Lim, J.-O.; Dudhia, J. Sensitivity Study of Cloud-Resolving Convective Simulations with WRF Using Two Bulk Microphysical Parameterizations: Ice-Phase Microphysics versus Sedimentation Effects. J. Appl. Meteorol. Climatol. 2009, 48, 61–76. [Google Scholar] [CrossRef]
  2. Kalnay, E. Atmospheric Modeling, Data Assimilation and Predictability; Cambridge University Press: Cambridge, UK, 2002. [Google Scholar] [CrossRef]
  3. Stensrud, D.J. Parameterization Schemes Keys to Understanding Numerical Weather Prediction Models; Cambridge University Press: Cambridge, UK, 2009. [Google Scholar]
  4. Sun, J.Z.; Trier, S.B.; Xiao, Q.N.; Weisman, M.L.; Wang, H.L.; Ying, Z.M.; Xu, M.; Zhang, Y. Sensitivity of 0-12-h warm-season precipitation forecasts over the central United States to model initialization. Weather Forecast. 2012, 27, 832–855. [Google Scholar] [CrossRef]
  5. Shen, F.; Xu, D.; Min, J. Effect of momentum control variables on assimilating radar observations for the analysis and forecast for Typhoon Chanthu (2010). Atmos. Res. 2019, 230, 104622. [Google Scholar] [CrossRef]
  6. Song, L.; Shen, F.; Shao, C.; Shu, A.; Zhu, L. Impacts of 3DEnVar-Based FY-3D MWHS-2 Radiance Assimilation on Numerical Simulations of Landfalling Typhoon Ampil (2018). Remote Sens. 2022, 14, 6037. [Google Scholar] [CrossRef]
  7. Xu, D.; Liu, Z.; Fan, S.; Chen, M.; Shen, F. Assimilating All-sky Infrared Radiances from Himawari-8 Using the 3DVar Method for the Prediction of a Severe Storm over North China. Adv. Atmos. Sci. 2021, 38, 661–676. [Google Scholar] [CrossRef]
  8. Chen, W.M. Satellite Meteorology; China Meteorlgical Press: Beijing, China, 2017. (In Chinese) [Google Scholar]
  9. Doviak, R.J.; Zrnić, D.S. Doppler Radar and Weather Observations; Academic Press: Cambridge, MA, USA, 1993. [Google Scholar] [CrossRef]
  10. Bieringer, P.; Ray, P.S. A Comparison of Tornado Warning Lead Times with and without NEXRAD Doppler Radar. Weather Forecast. 1996, 11, 47–52. [Google Scholar] [CrossRef]
  11. Polger, P.D.; Goldsmith, B.S.; Przywarty, R.C.; Bocchieri, J.R. National Weather Service Warning Performance Based on the WSR-88D. Bull. Am. Meteorol. Soc. 1994, 75, 203–214. [Google Scholar] [CrossRef]
  12. Huuskonen, A.; Saltikoff, E.; Holleman, I. The Operational Weather Radar Network in Europe. Bull. Am. Meteorol. Soc. 2014, 95, 897–907. [Google Scholar] [CrossRef]
  13. Min, C.; Chen, S.; Gourley, J.J.; Chen, H.; Zhang, A.; Huang, Y.; Huang, C. Coverage of China New Generation Weather Radar Network. Adv. Meteorol. 2019, 2019, 5789358. [Google Scholar] [CrossRef]
  14. De Haan, S.; van der Veen, S.H. Cloud Initialization in the Rapid Update Cycle of HIRLAM. Weather Forecast. 2014, 29, 1120–1133. [Google Scholar] [CrossRef]
  15. Benjamin, S.G.; James, E.P.; Hu, M.; Alexander, C.R.; Ladwig, T.T.; Brown, J.M.; Weygandt, S.S.; Turner, D.D.; Minnis, P.; Smith, W.L.; et al. Stratiform Cloud-Hydrometeor Assimilation for HRRR and RAP Model Short-Range Weather Prediction. Mon. Weather Rev. 2021, 149, 2673–2694. [Google Scholar] [CrossRef]
  16. Renshaw, R.; Francis, P.N. Variational assimilation of cloud fraction in the operationalMet Office Unified Model. Q. J. R. Meteorol. Soc. 2011, 137, 1963–1974. [Google Scholar] [CrossRef]
  17. Albers, S.C.; McGinley, J.A.; Birkenheuer, D.L.; Smart, J.R. The Local Analysis and Prediction System (LAPS): Analyses of Clouds, Precipitation, and Temperature. Weather Forecast. 1996, 11, 273–287. [Google Scholar] [CrossRef]
  18. Zhang, J. Moisture and Diabatic Initialization Based on Radar and Satellite Observations. Ph.D. Thesis, University of Oklahoma, Norman, OK, USA, 1999. [Google Scholar]
  19. Xue, M.; Wang, D.; Gao, J.; Brewster, K.; Droegemeier, K. The Advanced Regional Prediction System (ARPS), storm-scale numerical weather prediction and data assimilation. Meteorol. Atmos. Phys. 2003, 82, 139–170. [Google Scholar] [CrossRef]
  20. Hu, M.; Xue, M.; Brewster, K. 3DVAR and Cloud Analysis with WSR-88D Level-II Data for the Prediction of the Fort Worth, Texas, Tornadic Thunderstorms. Part I: Cloud Analysis and Its Impact. Mon. Weather Rev. 2006, 134, 675–698. [Google Scholar] [CrossRef]
  21. Chen, D.; Xue, J.; Yang, X.; Zhang, H.; Shen, X.; Hu, J.; Wang, Y.; Ji, L.; Chen, J. New generation of multi-scale NWP system (GRAPES): General scientific design. Chin. Sci. Bull. 2008, 53, 3433–3445. [Google Scholar] [CrossRef]
  22. Mlawer, E.J.; Taubman, S.J.; Brown, P.D.; Iacono, M.J.; Clough, S.A. Radiative transfer for inhomogeneous atmospheres: RRTM, a validated correlated-k model for the longwave. J. Geophys. Res. Atmos. 1997, 102, 16663–16682. [Google Scholar] [CrossRef]
  23. Dudhia, J. A nonhydrostatic version of the Penn State-NCAR mesoscale model: Validation tests and simulation of an Atlantic cyclone and cold front. Mon. Weather Rev. 1993, 121, 1493–1513. [Google Scholar] [CrossRef]
  24. Chen, F.; Dudhia, J. Coupling an advanced land surface–hydrology model with the penn state–NCAR MM5 modeling system. Part I: Model implementation and sensitivity. Mon. Weather Rev. 2001, 129, 569–585. [Google Scholar] [CrossRef]
  25. Hong, S.-Y.; Pan, H.-L. Nonlocal Boundary Layer Vertical Diffusion in a Medium-Range Forecast Model. Mon. Weather Rev. 1996, 124, 2322–2339. [Google Scholar] [CrossRef]
  26. Hong, S.-Y.; Dudhia, J.; Chen, S.-H. A revised approach to ice Microphysical Processes for the Bulk Parameterization of Clouds and Precipitation. Mon. Weather Rev. 2004, 132, 103–120. [Google Scholar] [CrossRef]
  27. Koch, S.E.; Aksakal, A.; McQueen, J.T. The Influence of Mesoscale Humidity and Evapotranspiration Fields on a Model Forecast of a Cold-Frontal Squall Line. Mon. Weather Rev. 1997, 125, 384–409. [Google Scholar] [CrossRef]
  28. Weygandt, S.S.; Benjamin, S.G.; Hu, M.; Alexander, C.R.; Smirnova, T.G.; James, E.P. Radar Reflectivity–Based Model Initialization Using Specified Latent Heating (Radar-LHI) within a Diabatic Digital Filter or Pre-Forecast Integration. Weather Forecast. 2022, 37, 1419–1434. [Google Scholar] [CrossRef]
  29. Xu, J.; Zhang, W.J.; Yang, J.; Cheng, Z.L. Fengyun-2 Satellite Operational Products and Data Format Practical Handbook; China Meteorological Press: Beijing, China, 2008. (In Chinese) [Google Scholar]
  30. Macpherson, B.; Wright, B.J.; Hand, W.H.; Maycock, A.J. The Impact of MOPS Moisture Data in the U.K. Meteorological Office Mesoscale Data Assimilation Scheme. Mon. Weather Rev. 1996, 124, 1746–1766. [Google Scholar] [CrossRef]
  31. Hu, M. 3DVAR and Cloud Analysis with WSR-88D Level-II Data for the Prediction of Tornadic Thunderstorms. Ph.D. Thesis, University of Oklahoma, Norman, OK, USA, 2005. [Google Scholar]
  32. Smith, P.L.; Myers, C.G.; Orville, H.D. Radar Reflectivity Factor Calculations in Numerical Cloud Models Using Bulk Parameterization of Precipitation. J. Appl. Meteorol. Climatol. 1975, 14, 1156–1165. [Google Scholar] [CrossRef]
  33. Tong, M.; Xue, M. Ensemble Kalman Filter Assimilation of Doppler Radar Data with a Compressible Nonhydrostatic Model: OSS Experiments. Mon. Weather Rev. 2005, 133, 1789–1807. [Google Scholar] [CrossRef]
  34. Bloom, S.C.; Takacs, L.L.; da Silva, A.M.; Ledvina, D. Data Assimilation Using Incremental Analysis Updates. Mon. Weather Rev. 1996, 124, 1256–1271. [Google Scholar] [CrossRef]
  35. Lee, M.-S.; Kuo, Y.-H.; Barker, D.M.; Lim, E. Incremental Analysis Updates Initialization Technique Applied to 10-km MM5 and MM5 3DVAR. Mon. Weather Rev. 2006, 134, 1389–1404. [Google Scholar] [CrossRef]
  36. Takacs, L.L.; Suárez, M.J.; Todling, R. The Stability of Incremental Analysis Update. Mon. Weather Rev. 2018, 146, 3259–3275. [Google Scholar] [CrossRef] [PubMed]
  37. Lingkun, R.; Shuwen, L.; Yushu, Z.; Shuai, Y.; Shuping, M.; Kuo, Z.; Dongdong, S.; Baofeng, J.; Na, L. Observational Analysis of the Dynamic, Thermal, and Water Vapor Characteristics of the “7.20” Extreme Rainstorm Event in Henan Province. Chin. J. Atmos. Sci. 2021, 45, 1366–1383. [Google Scholar] [CrossRef]
  38. Chen, G.; Sha, W.; Iwasaki, T. Diurnal variation of precipitation over southeastern China: Spatial distribution and its seasonality. J. Geophys. Res. 2009, 114, D13103. [Google Scholar] [CrossRef]
  39. Tang, J.; Chen, S.; Li, Z.; Gao, L. Mapping the Distribution of Summer Precipitation Types over China Based on Radar Observations. Remote Sens. 2022, 14, 3437. [Google Scholar] [CrossRef]
  40. Zhao, Y.-C.; Wang, Y.-H. A Review of Studies on Torrential Rain During Pre-Summer Flood Season in South China Since the 1980’s. Torrential Rain Disasters 2009, 28, 194–228. [Google Scholar]
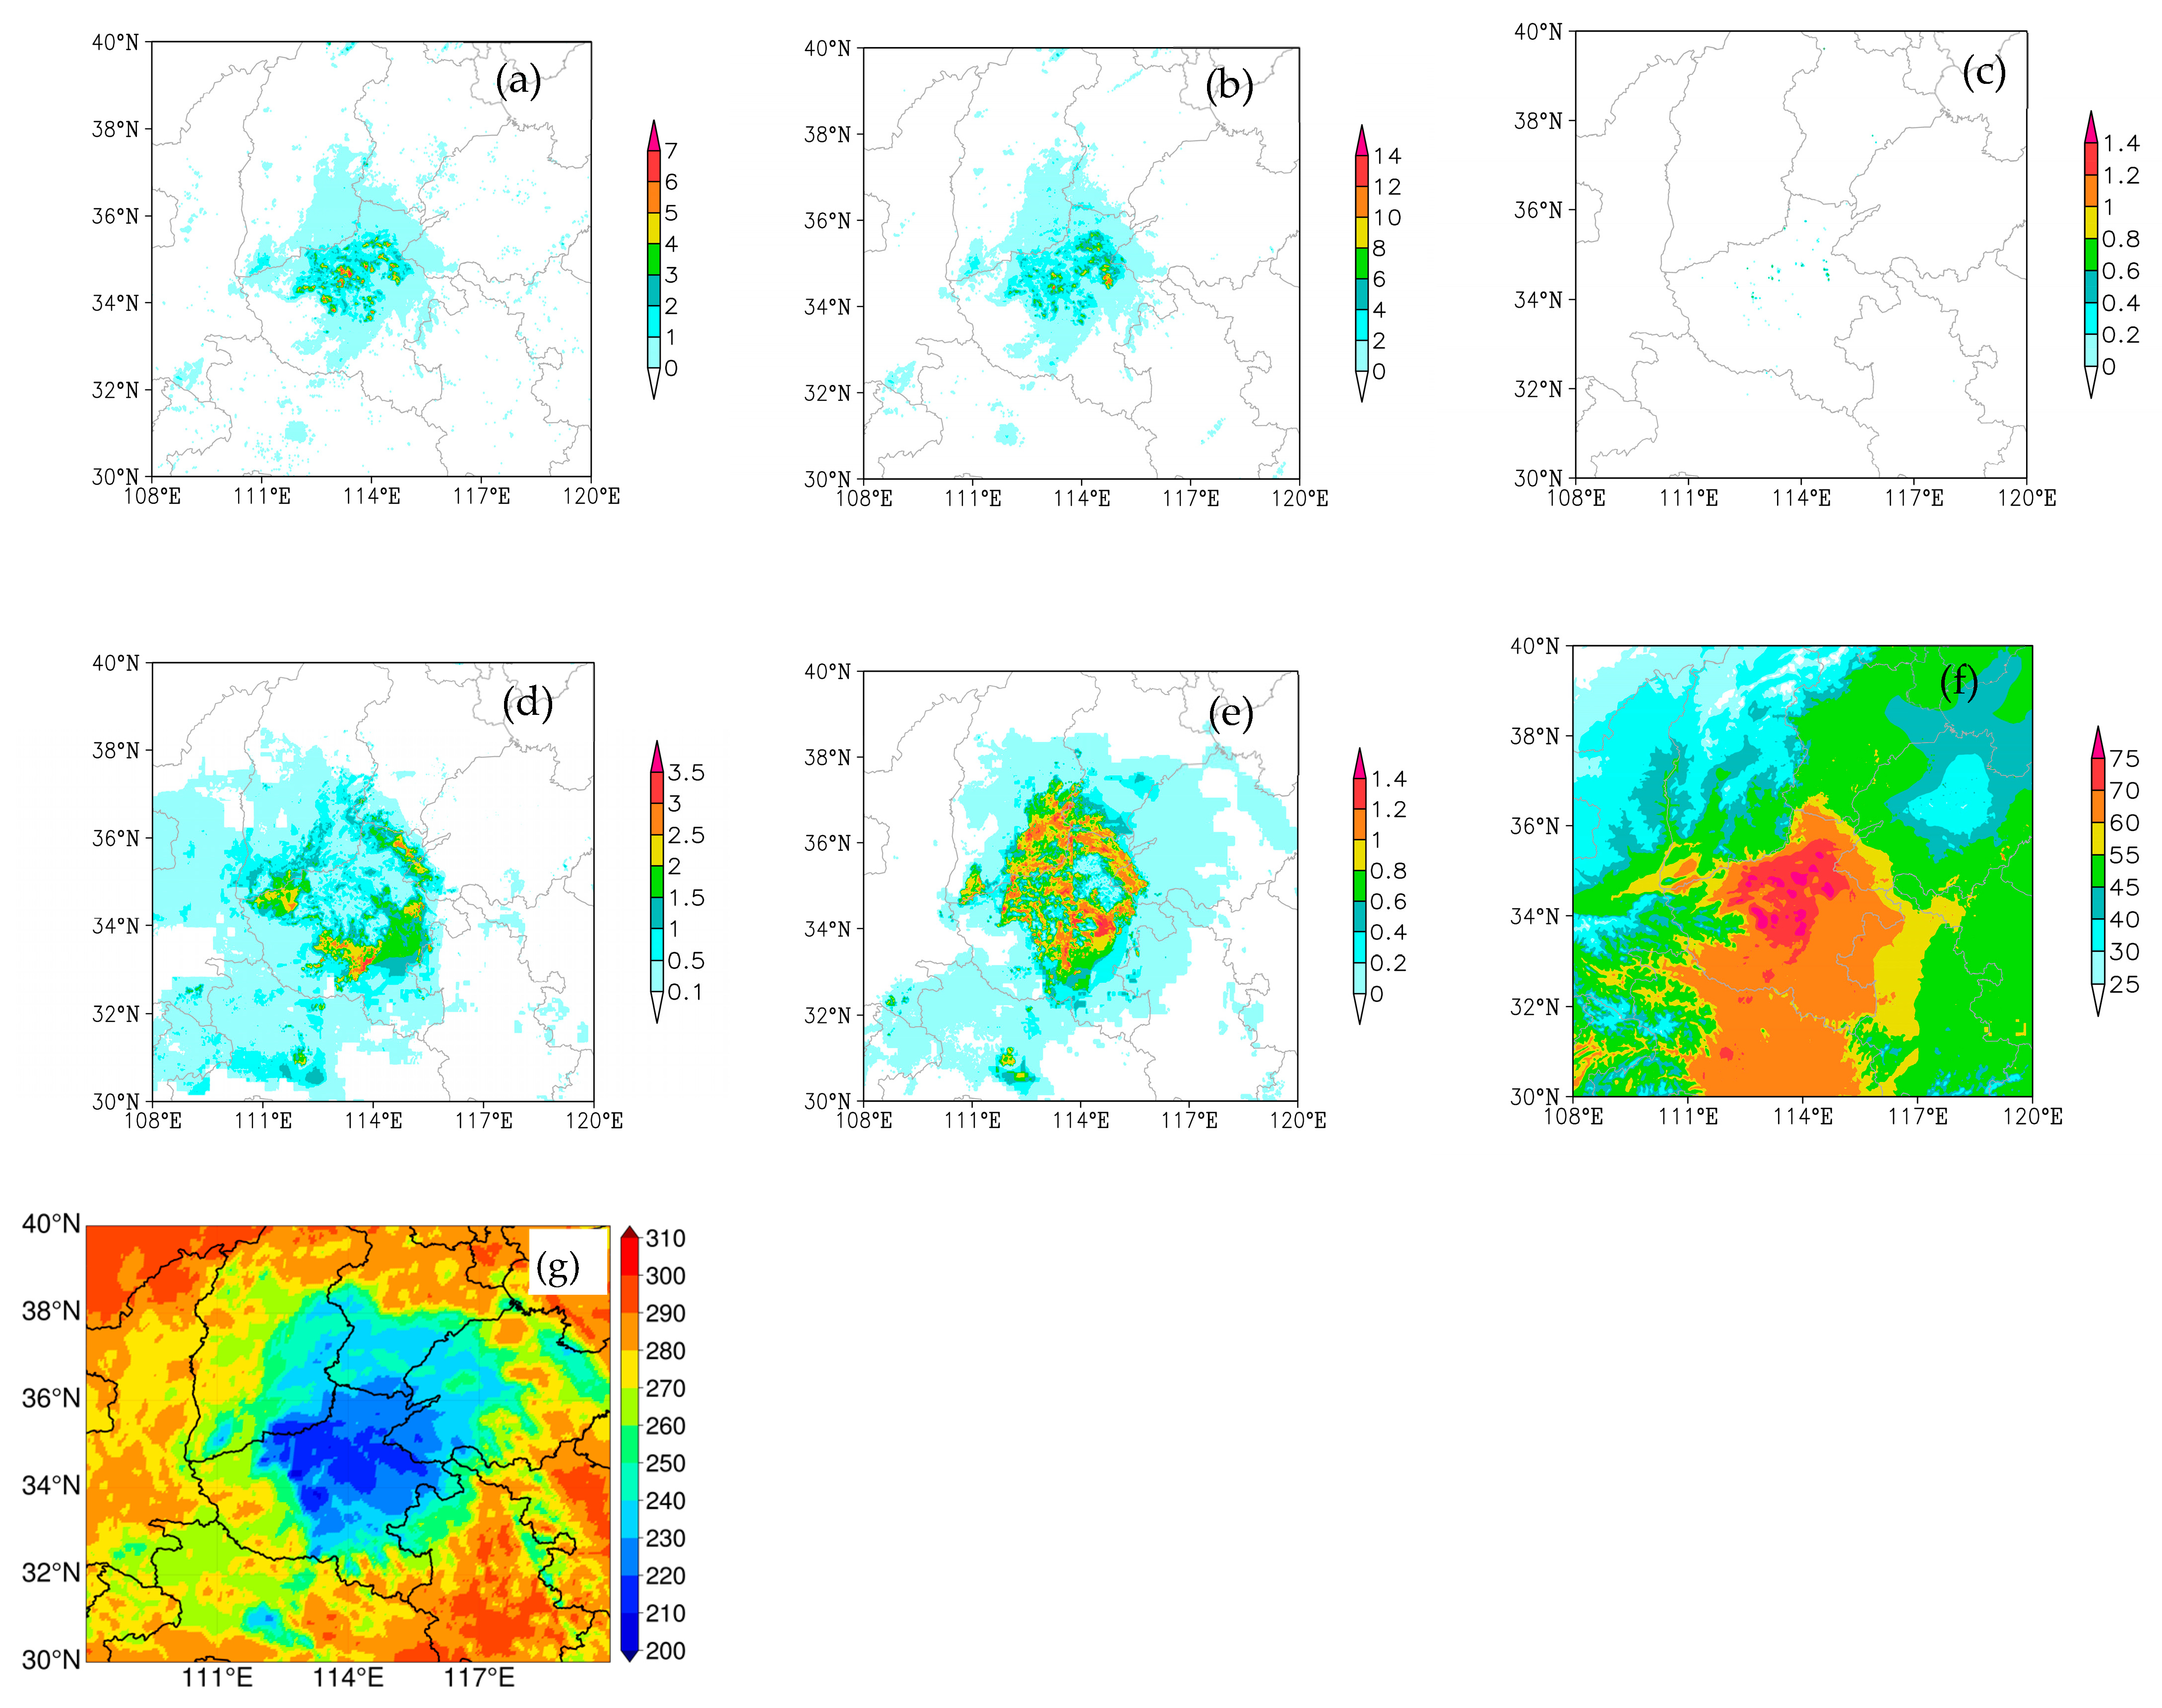
Figure 1. Hydrometeor integrated paths (unit: kg/m2) of (a) rainwater; (b) snow; (c) graupel; (d) cloud water; (e) cloud ice; and (f) precipitable water vapor in initial cloud field at 0000 UTC 20 July 2021 and (g) FY-4A satellite-observed 10.8 μm TBB (unit: K) at 0000 UTC 20 July 2021.
Remotesensing 17 02507 g001
Figure 2. (a) Composite radar reflectivity (unit: dBz) at 00:00 UTC 20 July 2021; (b) forecasted rainwater mixing ratio (unit: g/kg) from CNTL at 00:05 UTC 20 July 2021; (c) forecasted rainwater mixing ratio (unit: g/kg) from SENS at 00:05 UTC 20 July 2021.
Remotesensing 17 02507 g002
Figure 3. Temporal evolution of mean rainwater mixing ratio at 850 hPa during the forecast period (unit: g/kg).
Remotesensing 17 02507 g003
Figure 4. Brightness temperature (unit: K) in a 10.8 μm channel from FY-4A satellite and model simulations at 0100 UTC 20 July 2021: (a) FY-4A observations; (b) CNTL forecast; (c) SENS forecast.
Remotesensing 17 02507 g004
Figure 5. Precipitable water vapor (PWV, unit: kg/ m2) at 02 UTC on 20 July 2021: (a) GNSS observations; (b) 2 h forecast from CNTL; (c) 2 h forecast from SENS.
Remotesensing 17 02507 g005
Figure 6. Accumulated precipitation (unit: mm) from 0000 to 0600 UTC on 20 July 2021: (a) observations; (b) CNTL forecast; (c) SENS forecast.
Remotesensing 17 02507 g006
Figure 7. Vertical cross-sections along 35°N at 0200 UTC 20 July 2021 (2 h forecast). (a) CNTL perturbation temperature (unit: °C); (b) SENS perturbation temperature (unit: °C); (c) CNTL specific humidity (contours, unit: g/kg) and vertical velocity (shaded, unit: m/s); (d) SENS specific humidity (contours, unit: g/kg) and vertical velocity (shaded, unit: m/s); (e) difference in specific humidity between SENS and CNTL (SENS minus CNTL, unit: g/kg); (f) difference in vertical velocity between SENS and CNTL (SENS minus CNTL, unit: m/s).
Remotesensing 17 02507 g007
Figure 8. Hourly ETS of precipitation forecasts: (a) >0.1 mm; (b) >1.5 mm; (c) >7 mm.
Remotesensing 17 02507 g008
Figure 9. RMSE of 2 m temperature forecasts.
Remotesensing 17 02507 g009
Figure 10. RMSE of geopotential height forecast (differences outside of boxes are significant (95% CI)): (a) 24 h; (b) 48 h; (c) 72 h.
Remotesensing 17 02507 g010
Figure 11. RMSE of 10 m wind forecast verified at 6 h intervals (differences outside of boxes are significant (95% CI)): (a) U-component wind; (b) V-component wind.
Remotesensing 17 02507 g011
Table 1. Main configurations of the CMA-MESO 3 km system.
Model Setup TypeDetailed Settings
Model versionCMA-MESO5.1
ResolutionHorizontal grid spacing of 0.03° and 50 sigma vertical levels
Grid points and model domain2501 × 1671(70°E~145°E,10°N~60.1°N)
Radiation schemeRRTM long-wave radiation scheme [22]
Dudhia short-wave radiation scheme [23]
Land surface schemeNoah land surface scheme [24]
Boundary layer schemeMRF planetary boundary layer scheme [25]
Cloud microphysics schemeWSM6 cloud microphysics scheme [26]
Assimilation scheme3DVAR and cloud analysis
Assimilation dataRadiosonde, Airep, Synop, ships and buoys, atmospheric motion vectors (AMVs), radar VAD (velocity azimuth display), wind profiles, and GPS/PW and surface observations.
Disclaimer/Publisher’s Note: The statements, opinions and data contained in all publications are solely those of the individual author(s) and contributor(s) and not of MDPI and/or the editor(s). MDPI and/or the editor(s) disclaim responsibility for any injury to people or property resulting from any ideas, methods, instructions or products referred to in the content.