Technical Note

Contributions of Dust and Non-Dust Weather to Dust Emissions: A Case Study from the Central Taklimakan Desert

by
Xinghua Yang
1,2,3,4,
Mingjie Ma
2,3,4,
Chenglong Zhou
2,3,4,
Fan Yang
2,3,4,
Wen Huo
2,3,4,
Ali Mamtimin
2,3,4,*,
Qing He
2,3,4 and
Guohua Wang
1
1
School of Geographical Sciences, Shanxi Normal University, Taiyuan 030032, China
2
Institute of Desert Meteorology, China Meteorological Administration, Urumqi 830002, China
3
Taklimakan National Station of Observation and Research for Desert Meteorology in Xinjiang, Urumqi 830002, China
4
Xinjiang Key Laboratory of Desert Meteorology and Sandstorm, Urumqi 830002, China
*
Author to whom correspondence should be addressed.
Remote Sens. 2025, 17(14), 2531; https://doi.org/10.3390/rs17142531
Submission received: 8 June 2025 / Revised: 5 July 2025 / Accepted: 18 July 2025 / Published: 21 July 2025
(This article belongs to the Section Atmospheric Remote Sensing)

Abstract

Dust aerosols can influence climate change, the ecological environment, human health, etc. and are one of the most important factors causing global change. The specific contributions of dust events, gusts, and dust devils to dust emission remain unclear in many regions. In this study, we quantified dust emissions generated by dust events, gusts, and dust devils in the center of the Taklimakan Desert of northwestern China and investigated their respective contributions to atmospheric dust aerosols. The results illustrated that monthly dust emissions and the dust emission time for dust events, gusts, and dust devils peaked in July, August, and June, respectively, and the average monthly contributions to dust emissions were 48.2, 10.6, and 41.2% and those to emission time were 60.5, 25.5, and 14.0%, respectively. Although the dust emissions for the dust event were comparable to the sum of gusts and dust devils, the average value of AOD corresponding to the dust event was roughly 2.5 times higher than that of a non-dust day. The results presented in this study not only highlight the undeniable contribution of gusts and dust devils to dust emissions but also indicate that the specific contributions to atmospheric dust aerosols from gusts and dust devils remain uncertain.

1. Introduction

Deserts account for a third of the Earth’s land area; as such, they represent an important component of terrestrial ecosystems [1,2]. Dust aerosol emissions from desert areas are also closely linked to global change by impacting biochemical cycles, climate change, human health, agricultural production, and other areas [3,4,5,6]. For example, large volumes of dust aerosols are transported into the oceans to replenish nutrients such as iron, phosphorus, and nitrogen, enhancing primary productivity in these environments and impacting marine biochemical cycles and ecology [3,4,7]. Dust aerosols can serve as a medium for photochemical reactions, impacting atmospheric chemical processes and promoting the formation and growth of new particles in the atmosphere [8,9]. The uneven distributions of dust aerosol particles redistribute solar radiation energy vertically, modifying atmospheric dynamics and thermal structures. In addition, dust aerosols directly influence Earth’s radiation budgets through the absorption and scattering of solar radiation, ultimately influencing climate change [10,11,12,13]. Dust aerosol is also an important factor in the development of diseases of the respiratory system [6,14]. Kwon et al. [15] found in their study that small dust particles can easily become trapped in the alveolar compartment, leading to respiratory system diseases. Concurrently, dust aerosols can pose a significant threat to human health by carrying bacteria, viruses, heavy metals, toxic chemicals, and radioactive elements [6,16]. Dust aerosols can impact agricultural practices by blanketing farmland and reducing organic matter in soil, with sand particles impacting and damaging plant bodies and leaves [5,17,18]. Moreover, the presence of desert-like conditions leads to economic losses of USD 520.0 billion per year and widespread impoverishment [5,6,19]. From the above findings, it can be concluded that deserts have an undeniable impact on both the social and natural environments, with dust aerosols being a key focus in desert research [6].
Global annual dust emissions range from 1 to 3 billion tons, predominantly originating from arid and semi-arid regions. The Sahara Desert and Sahel region (North Africa) account for 50.7% of global emissions, followed by Central Asia (16.0%), Australia (14.5%), North America (5.2%), East Asia (4.9%), and the Arabian Peninsula (4.2%) [20,21]. Annual dust emissions across Asia range from 500 to 800 million tons. Of these emissions, approximately 150 to 240 million tons are deposited locally within the source regions, with 100 to 160 million tons being transported regionally within Asia. The remaining 250 to 400 million tons undergo long-range transport, primarily to the Pacific region and other global destinations [22,23]. Asia’s primary dust sources include Mongolia, the Taklimakan Desert region, and the Badain Jaran Desert region, which account for roughly 70% of continental emissions [23,24]. In recent years, global dust emissions have exhibited an increasing trend, a factor related to global warming and the reduction in large-scale precipitation. Some scholars believe that the interannual variations in global dust emissions are closely related to atmospheric circulation factors such as the Southern Oscillation Index (SOI) and the Arctic Oscillation (AO) [21].
Dust emission is a complex process and is primarily affected by meteorological, soil, and vegetation conditions, including wind [25,26], dust particle size [25,27,28], soil moisture [25,29], vegetation cover [25,26,30], air temperature and humidity [31,32], turbulent flow [33,34,35], etc. For example, it is widely believed that dust emissions are a function of wind velocity or friction velocity [20,36,37,38]. The dust particle size, soil moisture, and vegetation cover determine the soil’s susceptibility to wind erosion and the availability of sand sources; in addition, in the parameterization schemes of dust emission, the dust particle size, soil moisture, and vegetation cover are employed to correct the thresholds and thus impact dust emissions [25,26]. Air temperature and humidity can influence dust emission thresholds by modulating surface soil moisture content and interparticle viscous forces, thereby regulating dust mobilization potential [39,40,41]. Parameterization schemes for dust emission considering meteorological, soil, and vegetation conditions have been constructed and used in the simulation of dust events [25,26,36]. However, there are significant differences in the simulation results of different parameterization schemes for dust emission, and the applicability of such schemes in different regions also requires improvement [42,43]. In addition, at present, all parameterization schemes for dust emission rarely consider the effects of temperature and air humidity [25,26,36].
As is widely recognized, a dust event is a weather phenomenon in which large amounts of dust particles are carried with strong winds [6,17,25]; such events are traditionally regarded as the primary source of atmospheric dust aerosols [21,22,44]. However, in the simulation of global dust emissions, a common challenge arises in that simulated values are lower than observed values, indicating the existence of a large amount of missing dust aerosols and suggesting the existence of other dust emission mechanisms [45,46,47,48,49]. The results of recent studies demonstrate that gusts and dust devils represent significant additional contributors that warrant serious consideration [45,46,47,48,49]. In northwest China, the contribution rates of gusts to dust emission range between 18.5 and 50.4% [48]. Dust devils contribute substantially to dust emission, with their relative contributions varying significantly (7.4 to 65.0%) across different geographical regions depending on surface conditions [45,46,47,48,50]. The results of regional analyses reveal particularly high contributions (65.0%) in the United States [45], moderate contributions (38.7%) in North Africa [50], and variable but substantial contributions (7.4 to 53.0%) in China’s northwestern deserts [46,48]. Research has shown that dust emission sourced from gusts results from the instantaneous fluctuation in wind speeds being greater than the thresholds of dust emission [48,49]. Dust devils are vortices caused by the rapid warming of the Earth’s surface due to solar radiation that carry dust particles from the ground into the atmosphere, where they become dust devils [45,47,51]. The above findings indicate that there are significant differences between the above two dust emission mechanisms and dust events. However, substantial regional variability exists in the relative contributions of dust events, gusts, and dust devils to dust emissions. Consequently, the global-scale significance of these three emission mechanisms remains uncertain, necessitating further systematic investigations across diverse geographical regions.
As the second-largest mobile desert in the world, the Taklimakan Desert serves as a major source region for atmospheric dust aerosols across Asia, with a contribution rate of 20.0–30.0% [21,23,24]. Dust aerosols significantly influence global change by impacting marine ecology, the regional environment, climate change, etc. [3,10,52]. In the same vein, the Taklimakan Desert is an important carrier area for the socioeconomic development of Xinjiang, and the impact of dust aerosols on social production and human health cannot be ignored [53,54]. However, the contributions of gusts and dust devils are not taken into account in this regard, which may underestimate the contribution of the Taklimakan Desert. In addition, the specific contributions to the total dust emissions of gusts and dust devils in the Taklimakan Desert remain open to debate, as well as their impacts on atmospheric aerosols. For the above reasons, in this study, we attempted to quantify the contributions to total dust emissions of dust events, gusts, and dust devils in the Taklimakan Desert based on field experimental data and improved parameterization schemes for these variables and discuss the impact of dust emissions of dust weather (dust events) and non-dust weather (gusts and dust devils) on atmospheric aerosols. Such efforts will aid in deepening our understanding of regional dust emission processes and mechanisms and provide a reference for accurately assessing the contribution of the Taklimakan Desert to global dust aerosols.

2. Materials and Methods

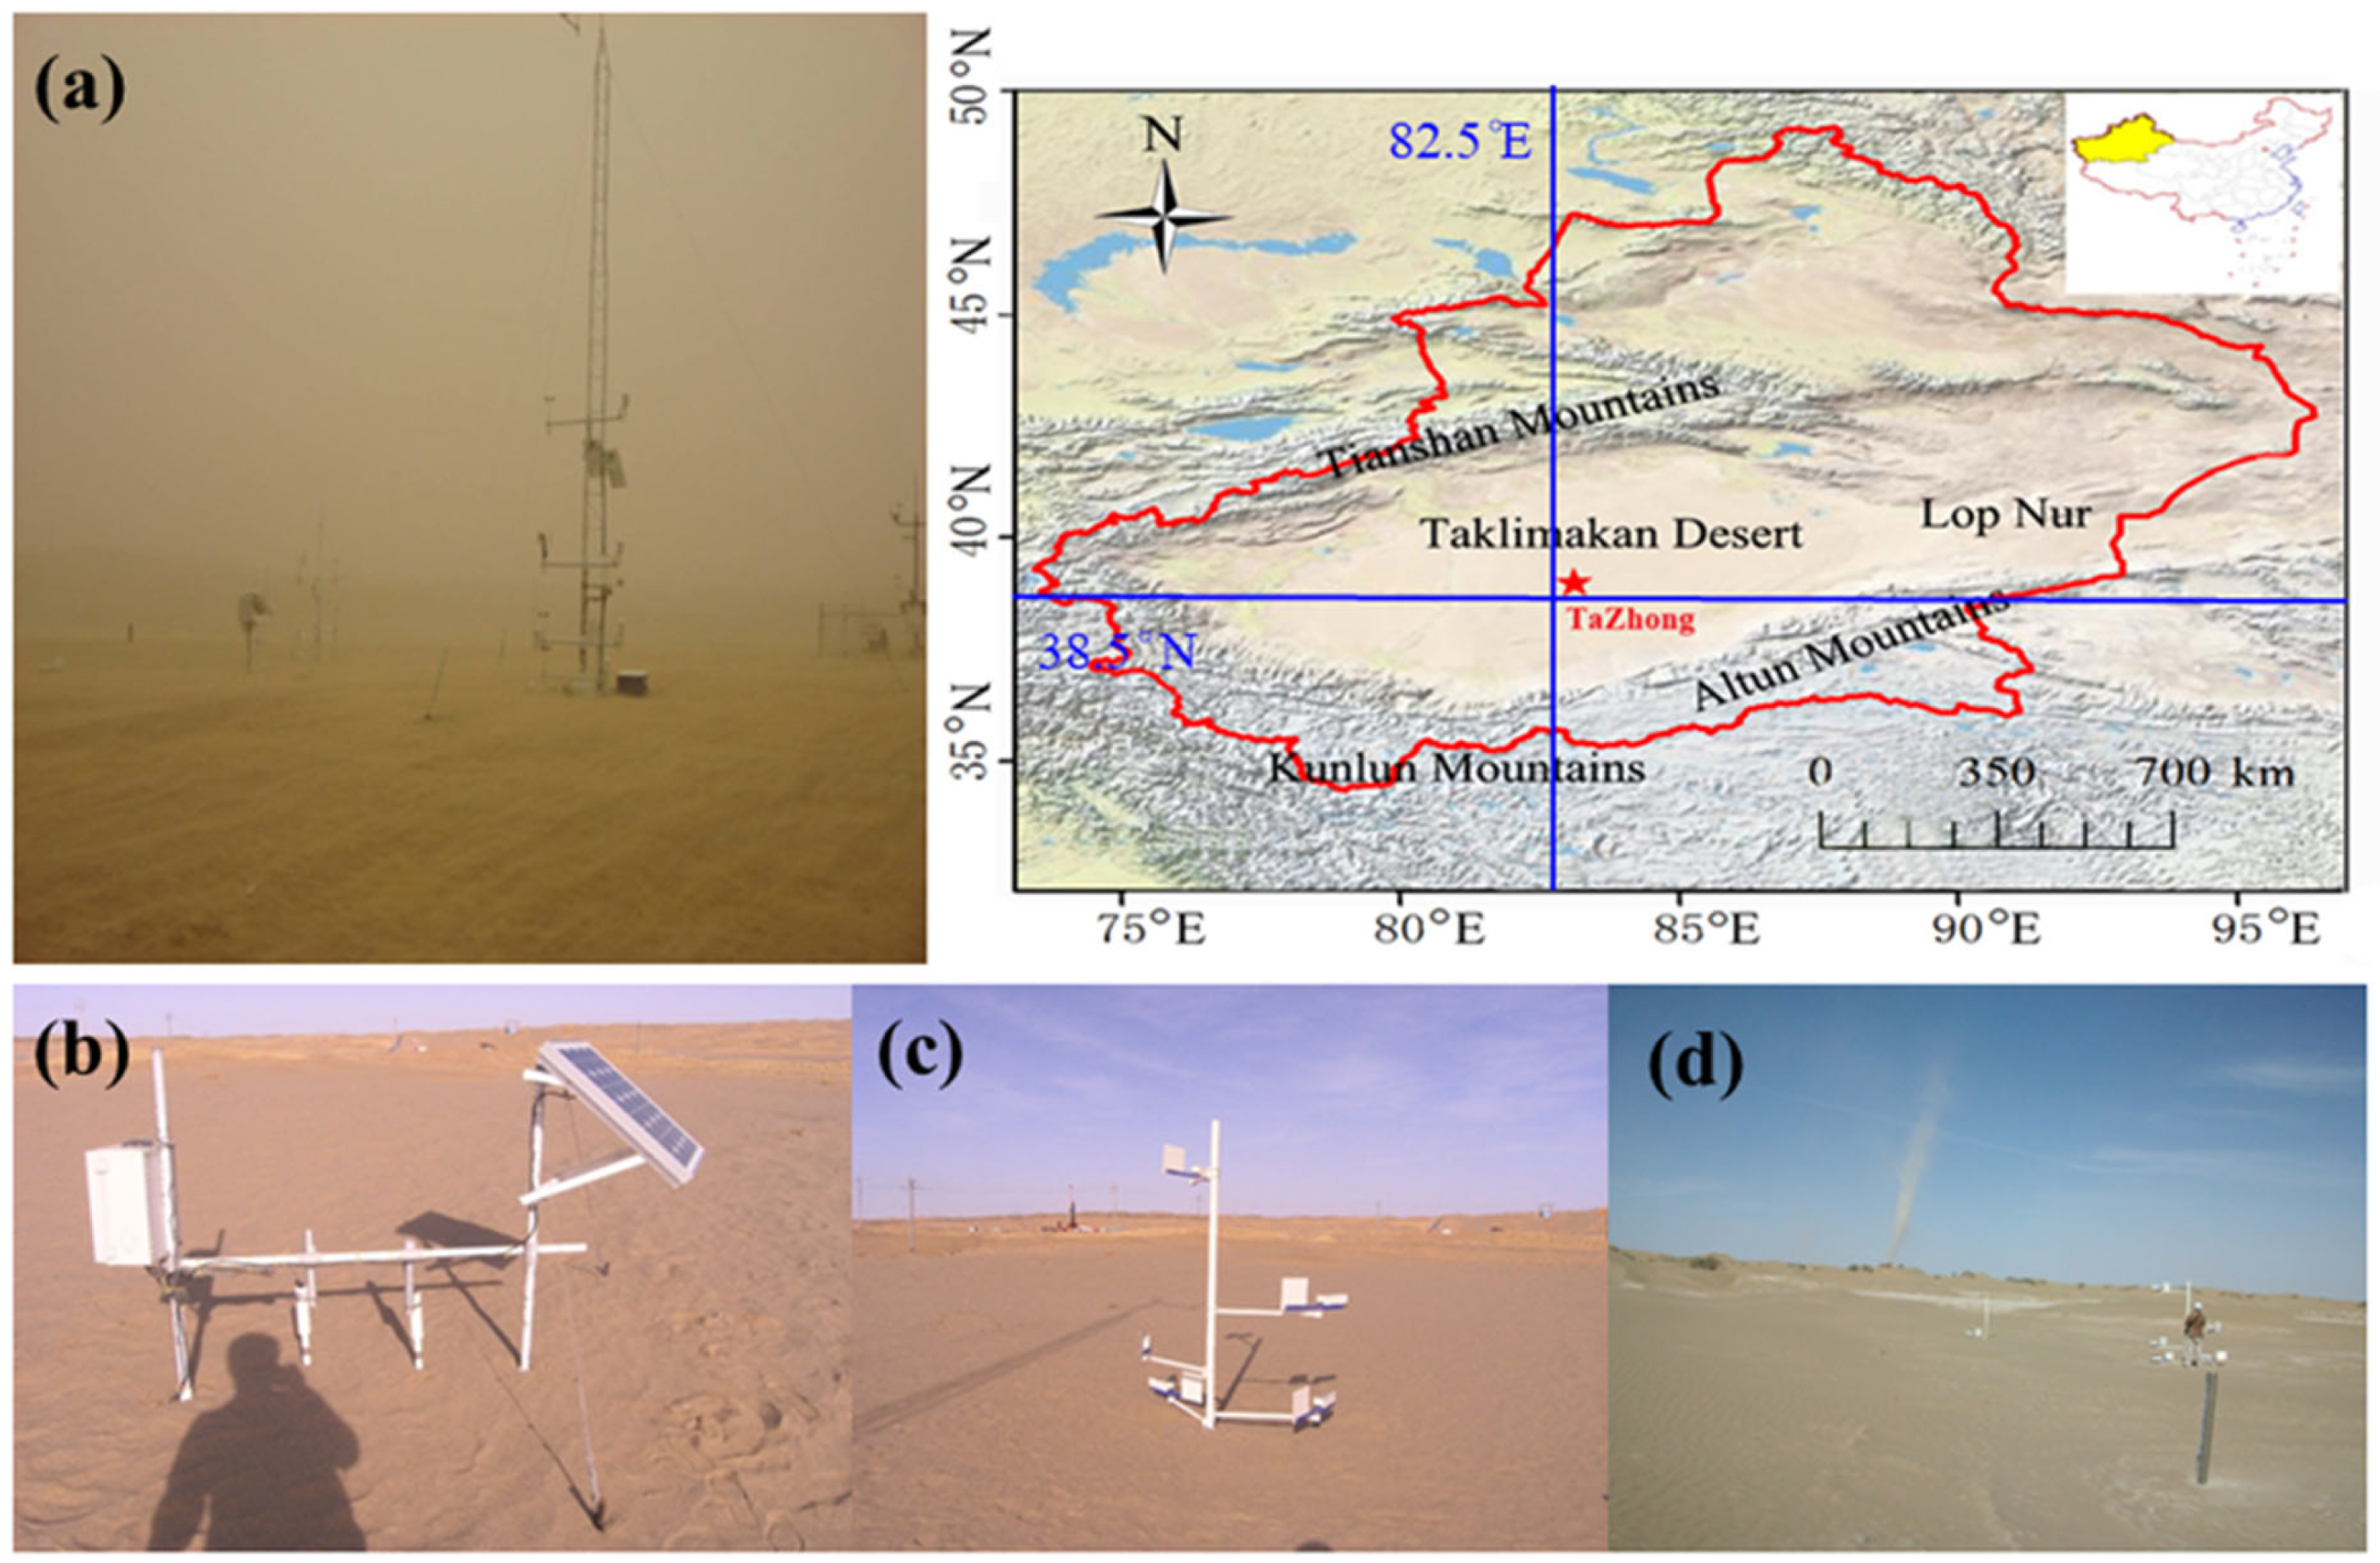
2.1. Study Area and Dataset

The study area encompasses the central Taklimakan Desert region surrounding TaZhong, as shown in Figure 1. Climatic records show pronounced water deficits in this region, with annual precipitation (25.9 mm) representing less than 0.7% of the evaporation potential (3741.8 mm). The dry climate, combined with the bare surface, leads to more than 80.0 dust days per year in the study area [55].
The wind speeds at a 2.0 m height were measured with a 010C anemometer (MetOne, Grants Pass, OR, USA), soil moisture at a depth of 1 to 2 cm below the surface was measured with a CS616 soil moisture gauge (Campbell, Napoleon, OH, USA), surface temperature was measured with a 109 L soil temperature probe (Campbell, USA), saltation particles and time at a 0.05 m height were measured with a piezoelectric saltation sensor (Sensit, Valparaiso, IN, USA), and horizontal dust fluxes at 0.05, 0.1, 0.2, 0.5, 1.0, and 2.0 m heights were measured with Big Spring Number Eight (BSNE) samplers (Figure 1). The experiments were conducted from 1 March 2008 to 28 February 2010, and all variables, excluding horizontal dust fluxes, were recorded at 1 Hz temporal resolution, with data aggregation to minute or hourly averages. GPS sounding observation data were obtained from TaZhong Meteorological Station, and the aerosol optical depth (AOD) data were acquired from the MODIS Level 2 atmospheric product at a 550 nm wavelength with the Deep Blue Algorithm (1.0° × 1.0° resolution). The daily AOD measurements were spatially interpolated onto a uniform 0.25° × 0.25° grid using a specific interpolation method. MERRA-2 reanalysis data (0.5° × 0.625° resolution) were used to compute composite flow field profiles during two study intervals: 20–23 May and 27–31 May 2009.
The presence of dust weather, including dust storms and blowing sand, is determined by the China Meteorological Administration [56]. A dust storm is a weather phenomenon in which strong winds stir up sand and dust, making the air incredibly turbid and resulting in horizontal visibility of less than 1.0 km. When sand is blown, large amounts of dust are also carried with strong winds; however, horizontal visibility ranges from 1.0 to 10.0 km. Of note, the dust weather records were also obtained from TaZhong Meteorological Station. A day is marked as a dust weather day if more than one dust event occurs; otherwise, it is marked as a non-dust day. On a non-dust day, if the saltation particles are measured, it is considered that there has been dust emission from gusts.
Dust devils often occur on sunny days with a low wind speed [46,48]; therefore, we eliminated days on which dust weather, rainfall, snow, snow cover, and average cloud cover greater than 70.0% were recorded [21,46,48,57]. Daily dust devil durations in the study area were determined based on the method of Ma et al. [57].

2.2. Dust Emissions from Dust Weather and Gusts

In the study area, the dust emissions from dust weather and gusts are defined as follows [58]:
log ( F / Q ) = 6.2
where F represents the daily dust emission (kg/km2), and Q represents the daily horizontal dust flux (kg/km), defined as follows [58]:
q ( z ) = a ( z ) b
Q = 0 2 q ( z ) d z = a b + 1 ( 2 ) b + 1 1
where q(z) represents the horizontal dust flux of measured height (kg/m2), z is the height of the sampler opening above the surface (m), a and b are fitting parameters, and Q is the total horizontal dust flux of each dust event (kg/km). At any specified time interval, horizontal dust flux is obtained by coupling continuous saltation measurements [58]. The dust emission time is the daily duration of dust emission for a dust event or gust recorded by a piezoelectric saltation sensor.

2.3. Dust Emissions from Dust Devils

The dust emission from dust devils in a given area can be defined as follows [59]:
F t o t = D t i m e × S T × σ × F d
where Ftot is the total dust emissions for dust devils (kg/km2), Dtime is the daily dust devil duration (h), ST represents the spatial density of potential dust devil occurrence, defined as the expected active vortex area per square kilometer (km2), σ represents the dimensionless ratio of the effective dust-emitting area (%), Fd quantifies the emission of an individual dust devil in the Taklimakan Desert, with the average value being 0.25 g/m2/s [21], and σ is given by the following equation [59]:
σ = μ η 1 2 Δ p ρ a i r g T R 3 2 F i n ρ a i r 1 2
where μ is a dimensionless coefficient of the turbulence dissipation of mechanical energy with an average value of 18, Δp is the pressure difference from the surface to the top of the convective boundary layer (kPa), with Δp = ρairgZCBL, where ZCBL denotes the convective boundary layer height (m), defined by GPS sounding observation data, ρair is the air density with a value of 1.23 kg/m3, g is the gravity acceleration with a value of 9.8 g/m2, TR is the radiative timescale of the convective boundary layer with a value of 9 × 10⁵ s, and Fin is the heat flux driving dust devils with a value of 11.0 kW/m2 [47]. The thermodynamic efficiency η is defined as follows [47]:
η = Γ a d Z C B L T h
where Γad denotes the adiabatic lapse rate, with a value of 10.0 K/km, and Th denotes the surface temperature (°C). Based on observational data, there is good agreement between Dtime and thermodynamic efficiency η with Dtime = 1.43η + 0.62 [57].

3. Results

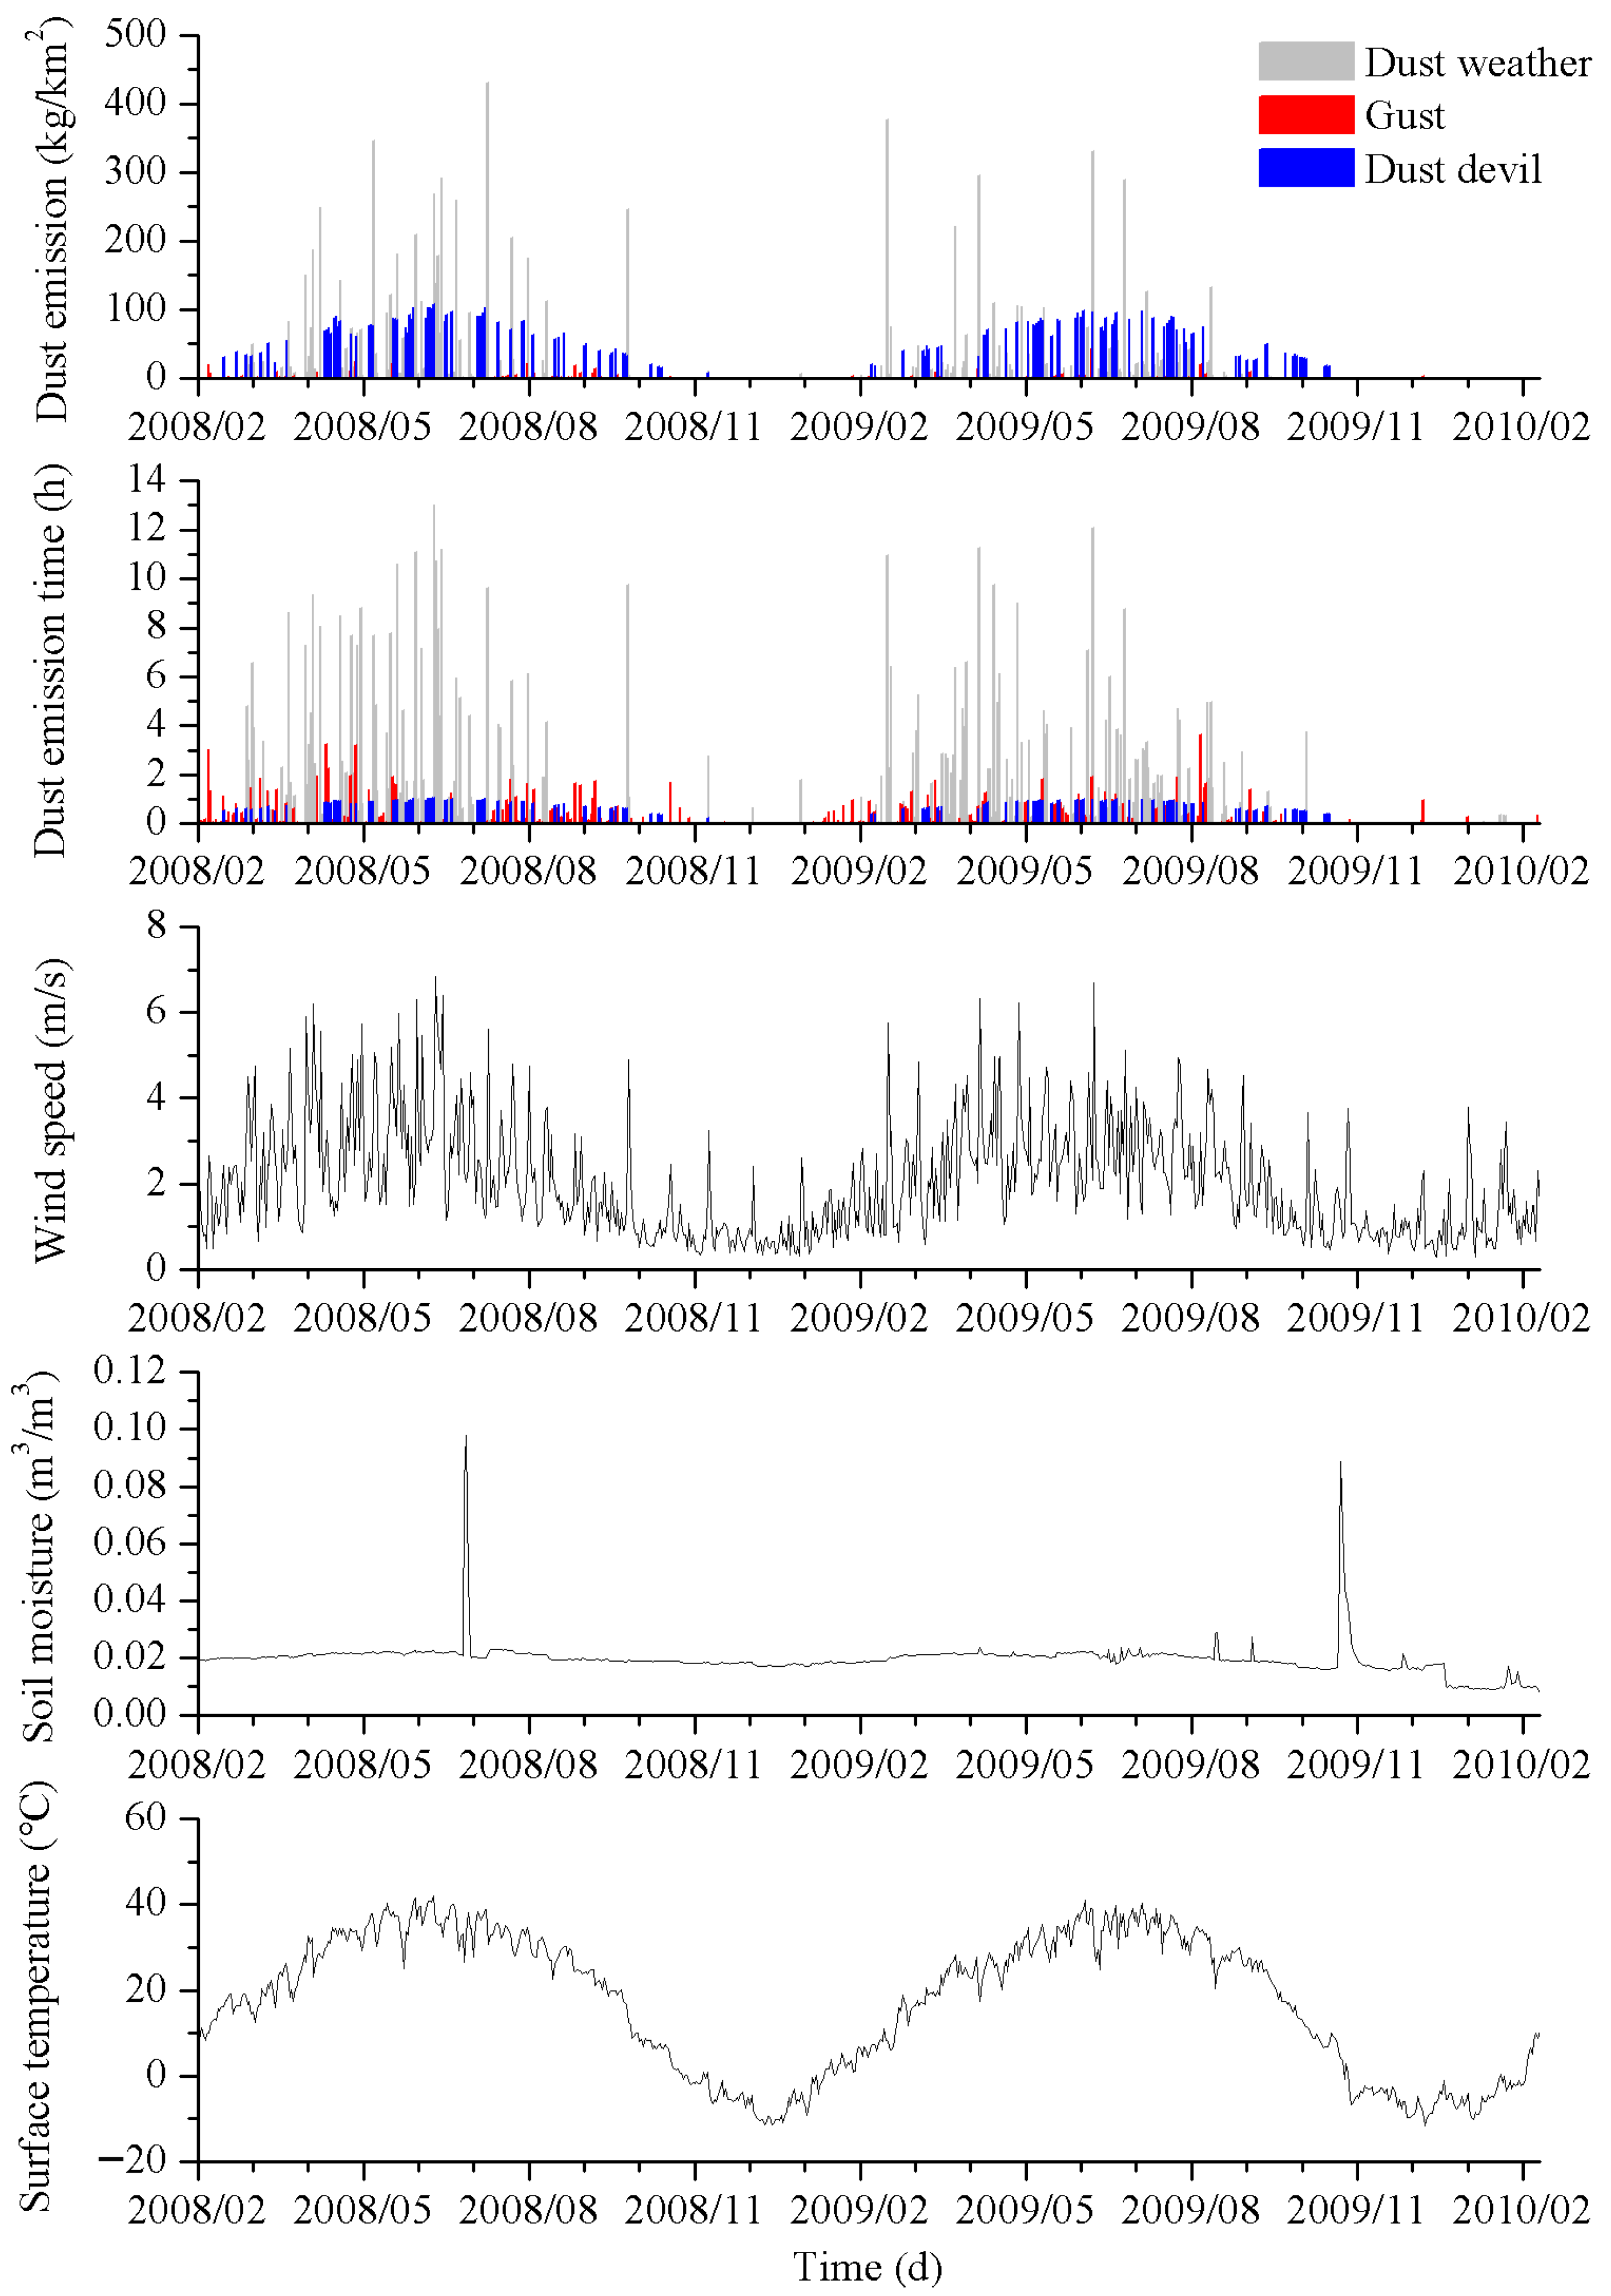
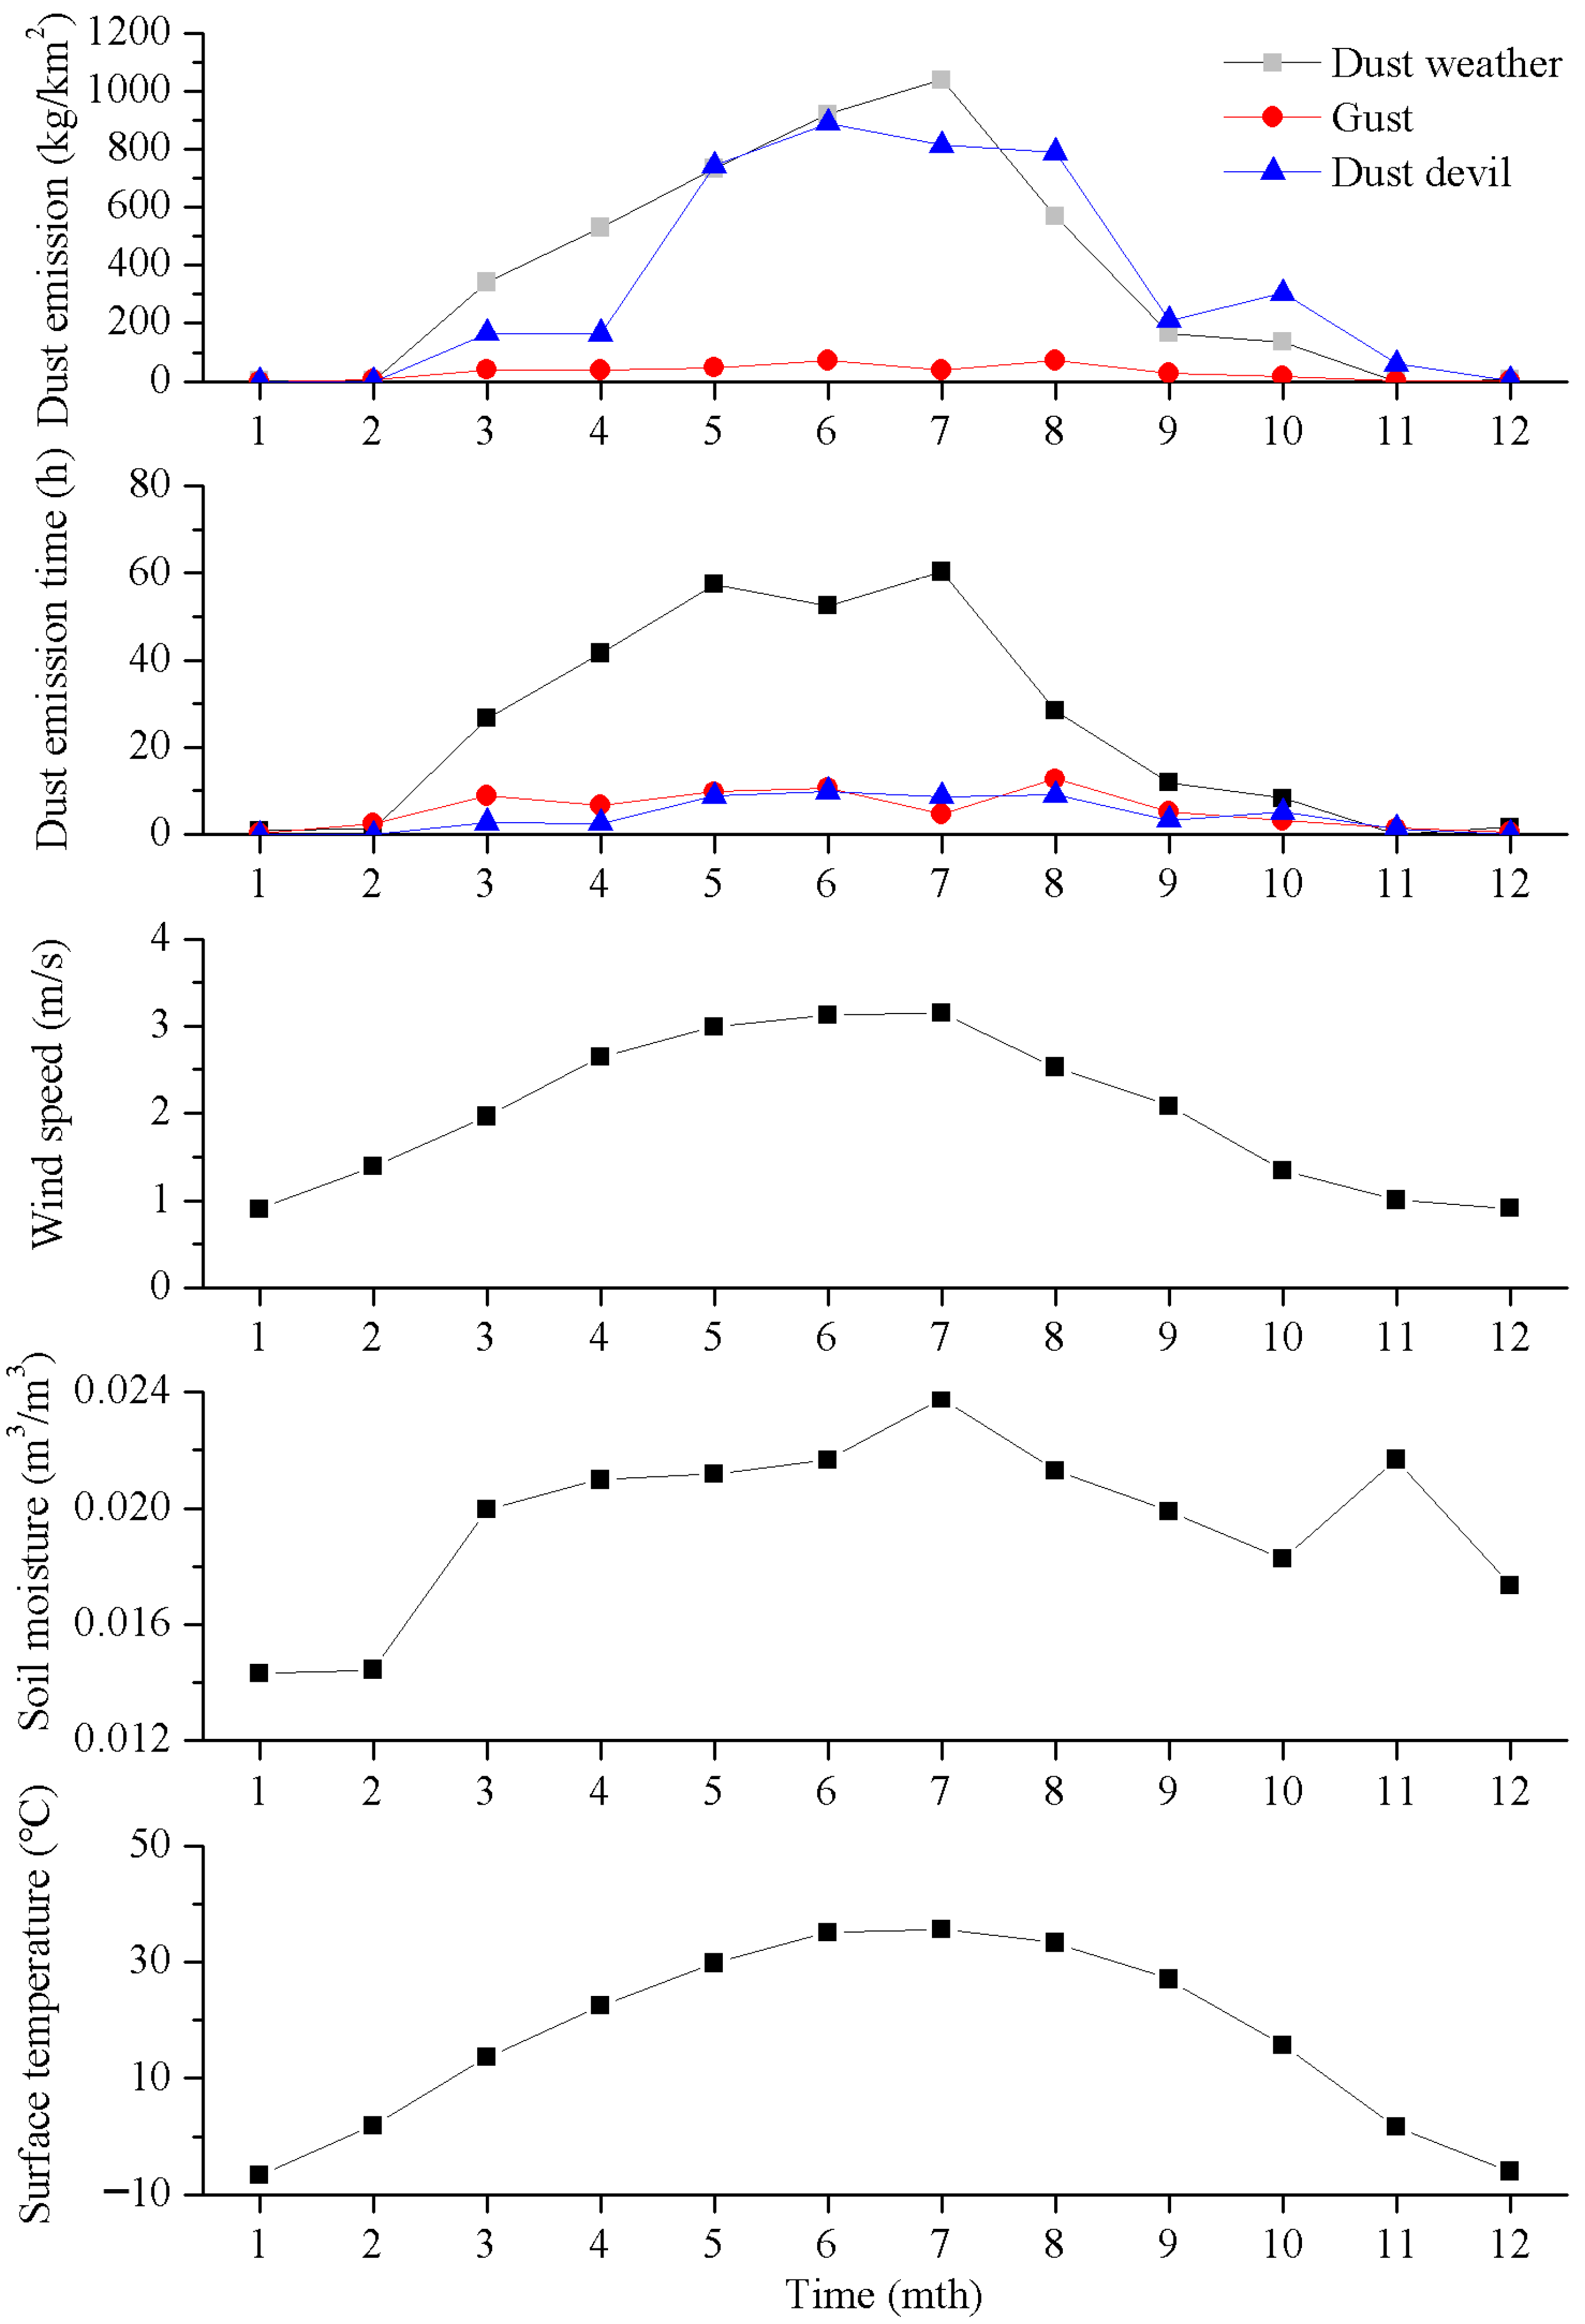
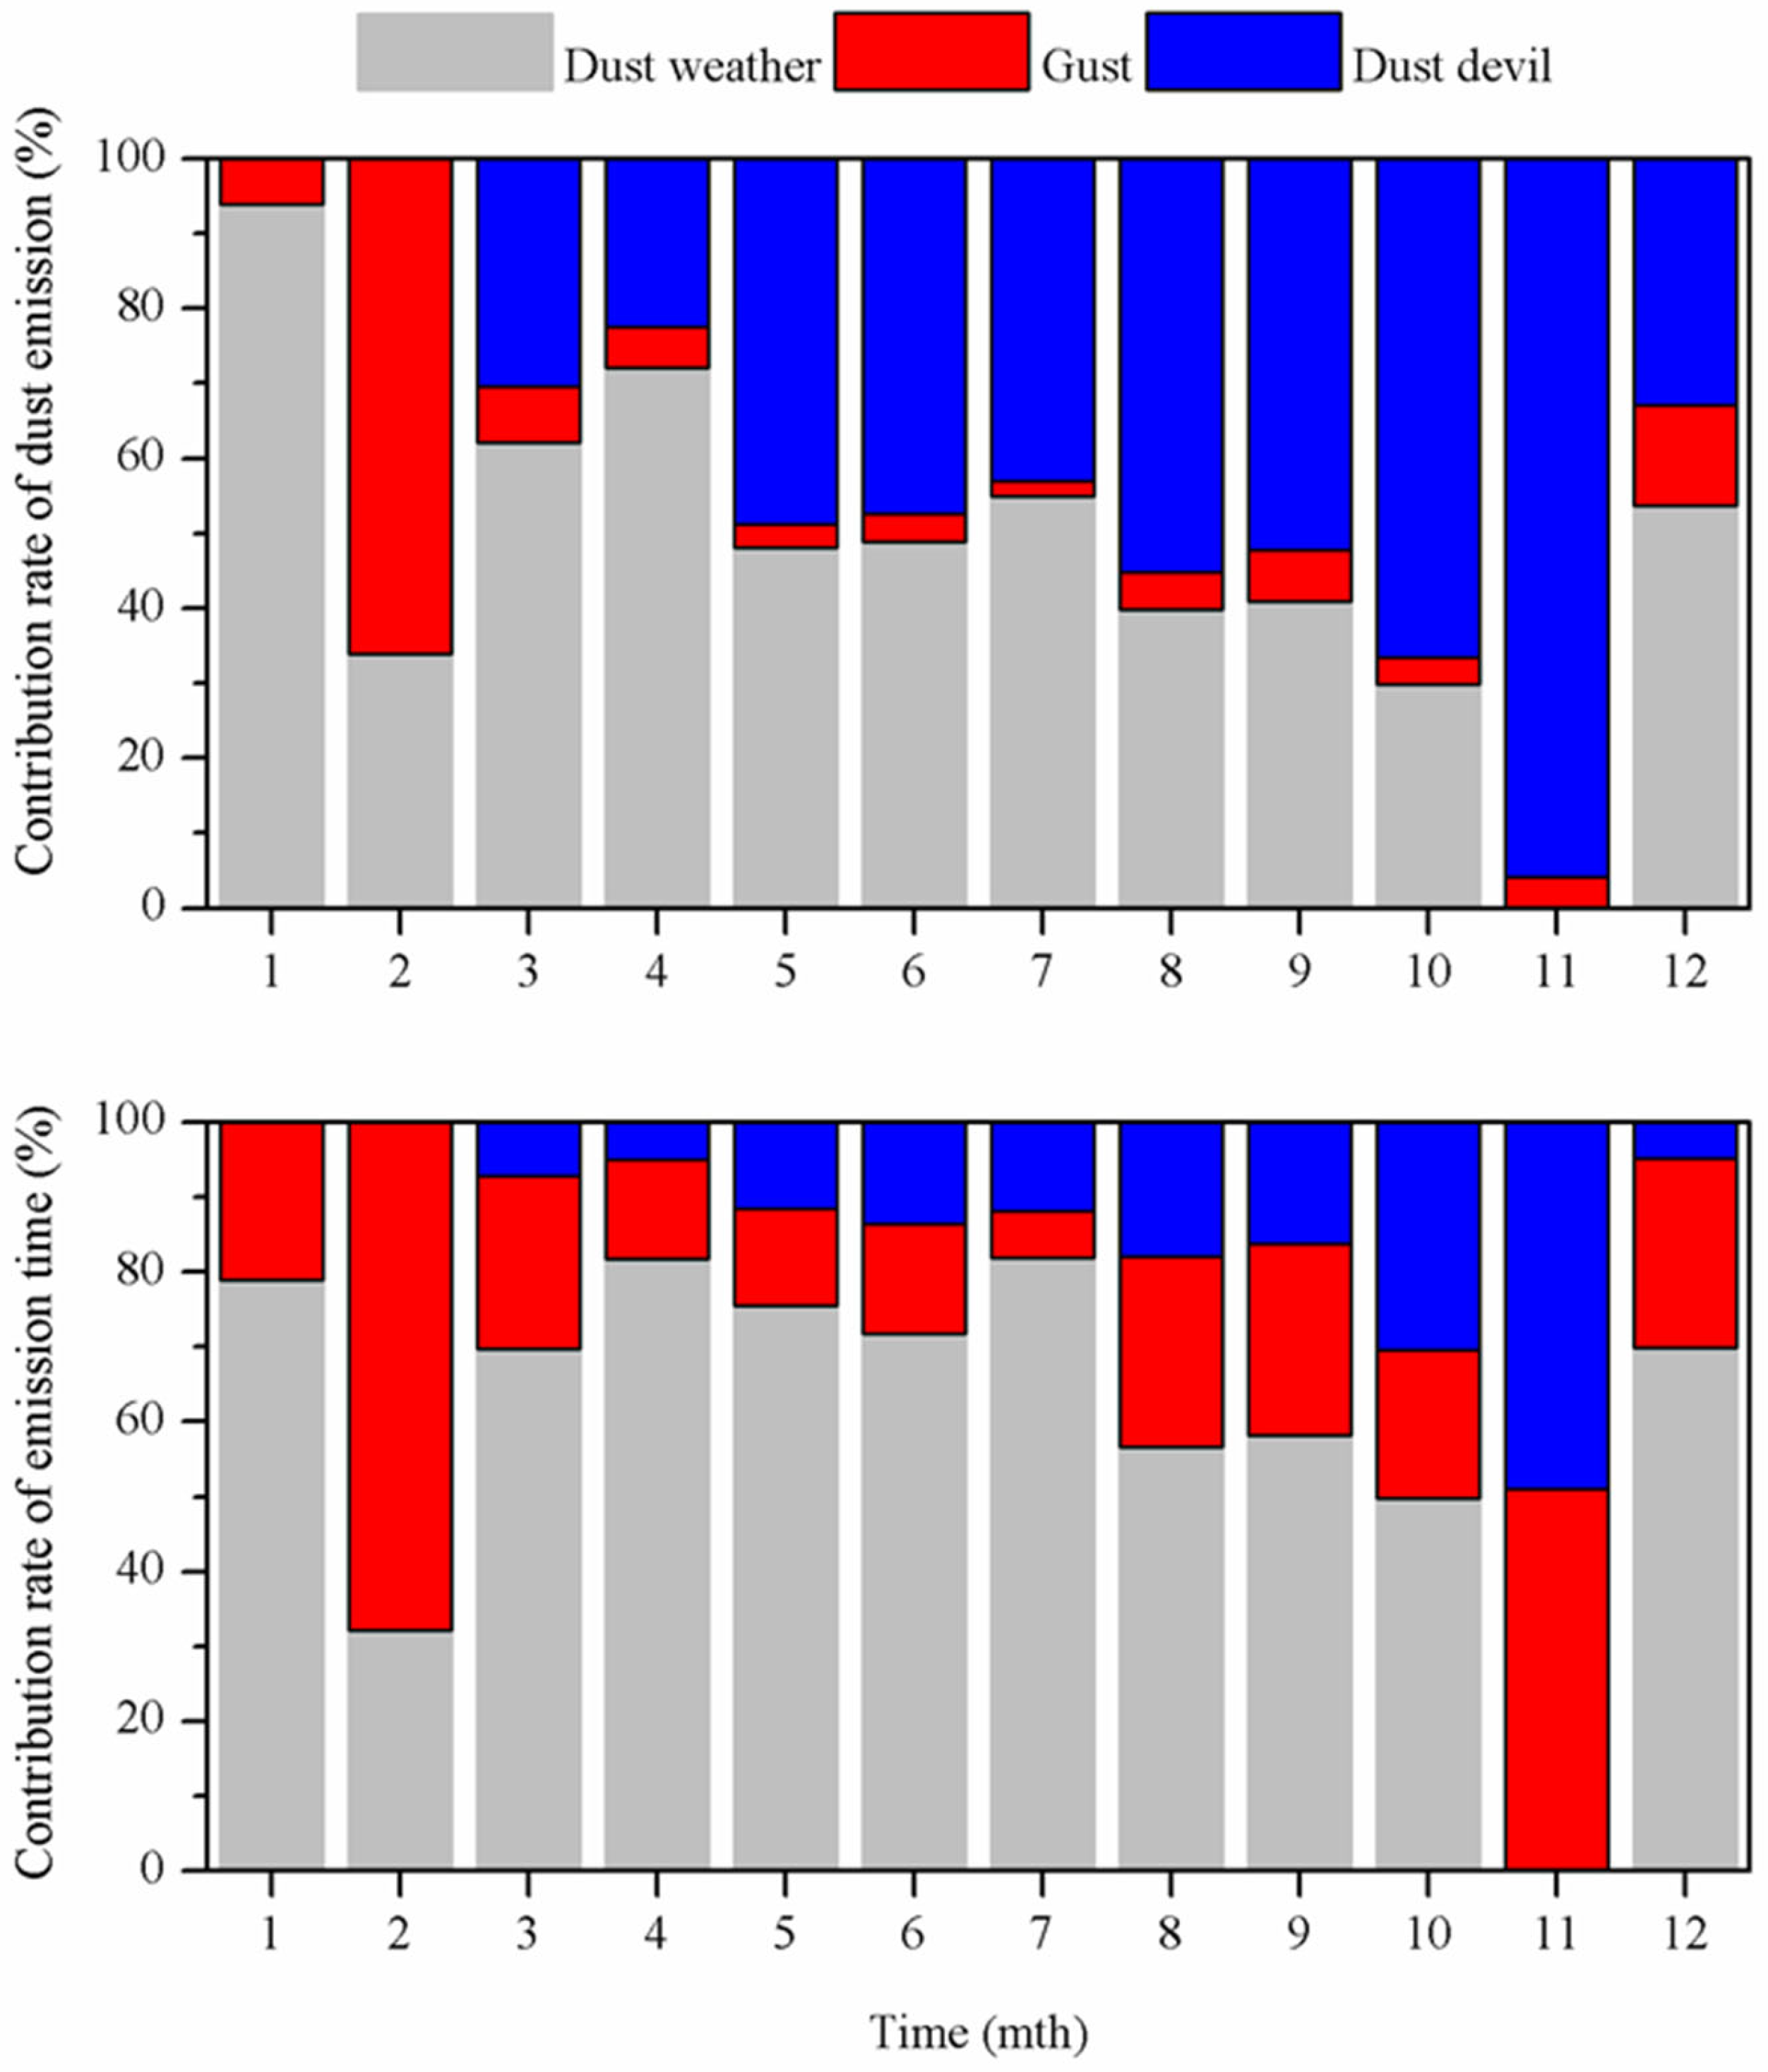
3.1. Dust Emissions for Dust Events, Gusts, and Dust Devils

The daily dust emissions and emission time for dust events, gusts, and dust devils are displayed in Figure 2. Dust events and dust devils did not occur as frequently as gusts, and the days of occurrence for each variable were 190.0, 132.0, and 303.0 d, respectively. Dust events mainly occurred in the spring and summer, and dust devils mainly occurred in the spring, summer, and autumn; in contrast, gusts can occur at any time point. The daily dust emissions for dust events, dust devils, and gusts ranged from 0.01 to 430.9, 6.8 to 107.3, and 0.005 to 43.1 kg/km2, respectively, with mean values of 46.8, 62.8, and 2.4 kg/km2, respectively. The dust emissions for dust events and gusts shared the same magnitude as the estimation in northwest China, while dust emissions for dust devils were significantly lower than those recorded in northwest China [48]. The daily dust emission time for dust events, dust devils, and gusts ranged from 0.001 to 13.02, 0.24 to 1.05, and 0.0002 to 3.63 h, respectively, with mean values of 2.9, 0.78, and 0.31 h, respectively. Dust devils and gusts exhibited maximum and minimum emission intensities, with that of dust events positioned between these variables. High values of daily dust emissions and emission time for dust events and gusts consistently corresponded to high values of wind speed (Figure 2). As mentioned above, it is widely believed that dust emissions are the function of wind velocity or friction velocity [20,36,37,38]. We found no significant relationship between daily dust emissions, the emission time for dust devils, and wind speeds (Figure 2) because dust devils were primarily influenced by thermal effects and generally occurred when the wind speed was less than 4.0 m/s [45,46,47,48,57]. Soil moisture can increase the threshold velocity of dust emission and decrease the availability of dust sources, thereby inhibiting the occurrence of dust events, gusts, and dust devils [25,26]. In the study area, 98.0% of the daily soil moisture was below the soil moisture threshold of 0.025 m3/m3 to impact dust emission in the Taklimakan Desert (Figure 2); of note, the inhibitory action of soil moisture on dust emission was negligible [58]. Among the three dust emission mechanisms, the significant relationship appeared between daily dust emissions, emission time, and ground temperature (Figure 2). The increase in ground temperature contributes to the development of atmospheric turbulence and facilitates dust emission for dust events and gusts [25,49], with the rapid warming of the surface being the main formation mechanism of dust devils [45,47,51]. The above observations demonstrate that there is a significant relationship between ground temperature and the occurrence of dust devils in the Taklimakan Desert [57].
Monthly dust emissions and emission times for dust events, gusts, and dust devils are illustrated in Figure 3. The monthly dust emissions and emission time for dust events ranged from 0.0 to 1038.4 kg/km2 and 0.0 to 60.3 h, with high values occurring from April to August and from March to August. The maximum values both occurred in July, and the minimum values both occurred in November. The monthly dust emissions and emission time for gusts ranged from 0.2 to 72.5 kg/km2 and from 0.2 to 12.8 h, with high values occurring from March to August and from March to June and in August. The maximum values both occurred in August, and the minimum values both occurred in January. The monthly dust emissions and emission time for dust devils ranged from 0.0 to 890.0 kg/km2 and 0.0 to 9.9 h, with high values occurring from May to August. The maximum values both appeared in June; in comparison, the minimum values occurred in January and February. The seasonal dust emissions and emission time for dust events, gusts, and dust devils all changed following the pattern summer > spring > autumn > winter (Table 1 and Table 2), which correlated with results recorded in northwest China [48]. The effects of the monthly wind speed, soil moisture, and surface temperature on the monthly dust emissions and emission time for dust events, gusts, and dust devils were similar to those of daily variables (Figure 3).
The results presented in Figure 4 illustrate the relative contributions of dust emissions from dust events, gusts, and dust devils to both monthly total dust emissions and emission time. In January, March, April, July, and December, the dust event played a dominant role (the contribution rate was greater than 50.0%), and the contributions to dust emissions were roughly 53.7 to 93.9%. From August to November, dust devils played a dominant role, with contributions ranging from 52.2 to 95.9%, and the contribution of gusts was greater than 50.0% only in February, at roughly 66.0%. Monthly dust emissions originated primarily from dust events (48.2%) and dust devils (41.2%), with gusts contributing modestly (10.6%), indicating that nearly 90% of TaZhong’s dust emissions are derived from these two major source types. Compared with Yumen and Dunhuang in northwest China, dust events dominated the dust emissions over a greater number of months, with the dominant effect of gust being significantly reduced in the Taklimakan Desert [48]. For emission time, dust events played a dominant role in January, March to September, and December, and the contributions to emission time ranged from roughly 56.6 to 81.9%. Gusts played a dominant role in February and November, at roughly 51.0 to 67.8%, and the contributions of dust devils amounted to less than 50.0% across all months. The average monthly contributions of dust events, gusts, and dust devils to emission time were 60.5, 25.5, and 14.0%, respectively. From the contributions of dust devils to dust emissions and emission time, dust devils exhibited higher emission efficiency. The results of other studies demonstrated that the average dust emission from dust events in the Taklimakan Desert was only 0.004 g/m2/s, which was significantly lower than that of 0.25 g/m2/s caused by dust devils [21,60]. The transportation of dust from dust events mainly occurs horizontally; in comparison, that for dust devils occurs vertically, namely, dust emission.
The results presented in Table 1 and Table 2 illustrate the contributions of dust events, gusts, and dust devils to seasonal total dust emissions and emission time in TaZhong. The contribution rates to seasonal dust emissions for dust events varied between 32.7 and 57.1%, suggesting dominant roles in spring (57.1%) and winter (51.8%). Those for dust devils varied between 15.6 and 62.3% and played a dominant role in the autumn. The contribution rates for gusts significantly decreased, compared with dust events and dust devils, by roughly 3.5 to 32.6%. The results indicated that the contributions from gusts were significantly lower than those from northwest China, influenced by differences in underlying types [48]. Compared to the contribution rates from 1.3 to 24.3% and 14.3 to 46.6% for dust devils and gusts, the contribution rates to seasonal dust emission time for dust events varied from 50.6 to 76.1%, suggesting a dominant role of dust events in all seasons.

3.2. Dust Aerosols from Dust and Non-Dust Weather

Monthly AOD data on dust (average value of all daily AODs on dust weather in a month) and non-dust weather (average value of all daily AODs on gust and dust devils in a month) and precipitation in TaZhong from March 2008 to February 2010 are shown in Figure 5. The monthly AOD with dust weather varied from 0.3 to 1.2, with high values appearing in March, April, May, June, and August; the maximum and minimum values appeared in May and December. The monthly AOD was significantly lower during non-dust weather conditions compared to dust weather periods, varying from 0.1 to 0.7, and high values appeared from March to May and in August. The maximum and minimum values appeared in May and November. Although the dust emissions for dust and non-dust weather were at a high level in June and July (Figure 3), the monthly AOD showed a significant downward trend (Figure 5), with our results being consistent with those of Li et al. [61]. Precipitation in the Taklimakan Desert was mainly concentrated in June and July [58], which coincides with the observation period (Figure 5), and precipitation can remove dust particles from the atmosphere and effectively reduce the value of the AOD.
The spatial distributions of average AOD values between March 2008 and February 2010 on dust and non-dust weather over the Taklimakan Desert are shown in Figure 6. During dust days, relatively high levels of AOD enveloped the entire desert, and AOD values were greater than 0.6. Across the entire desert, the highest AOD values were concentrated in the east, and the values were greater than 1.1. The higher values were concentrated in the southeast and south regions of the desert, the values were roughly 0.9, and AOD values showed a decreasing trend from southeast to northwest in the desert. The distributions of AOD are closely related to dust emission and deposition, and their spatial distributions are consistent with the dust emission and deposition distributions of the entire Taklimakan Desert [24]. Similar to monthly AOD, the AOD values of the entire desert were significantly lower during non-dust days, with AOD values consistently below 0.4 across the entire region and higher AOD values concentrated in the northwest and northeast regions. The above results indicate that there were significant differences in the spatial distributions of dust emission and deposition during dust and non-dust weather periods.

4. Discussion

Among the three modes of dust emission, dust devils generated the greatest uncertainty in terms of dust emission; for instance, the contribution rates for this variable were approximately 7.4–65.0% [21,45,47,48,50]. Indeed, the different underlying surfaces were one of the important reasons for the uncertainty in dust emissions from dust devils [48]; however, even with the parameterization of the frequency and duration of dust devils, understanding the dust emission of a single dust devil still requires further improvement. It is necessary to perform more observation and simulation experiments and provide data support for the parameterization of dust devils [21,45,47,48,50].
The results of previous studies demonstrate that the relative contribution percentages of gust and dust devils were higher than those of dust events in February, May to June, and August to November (Figure 4). It is even the case that the average contribution of dust events was lower than the sum of gusts and dust devils (Figure 4 and Table 1); however, the AOD values of non-dust weather were still significantly lower than those of dust weather (Figure 5 and Figure 6). To provide further clarification, the daily dust emissions and AOD from 20–31 May 2009, were analyzed as an example (Figure 7). Average annular flow field profiles from 20–23 May 2009, and 27–31 May 2009, are also shown in Figure 8. Based on meteorological records, two typical dust weather processes occurred from 20–22 May and from 24–26 May: floating dust weather occurred on 23 May and non-dust days occurred from 27–31 May. The total dust emission was recorded as 212.6 kg/km2, and the average AOD was 1.8 for dust weather processes from 20–22 May; in comparison, the total dust emission was 323.2 kg/km2, and the average AOD was only 0.2 for non-dust days from 27–31 May. During the dust weather process, the atmosphere of the entire desert was mainly characterized by upward movement, the wind speeds of the surface were higher than 8.0 m/s, and those at high altitude were relatively higher than 12.0 m/s in TaZhong, which was beneficial for the transportation of dust from the surface to high altitude, thereby increasing the values of AOD. During non-dust weather, the atmosphere was mainly characterized by downward movement, and the wind speeds on the surface and at high altitude were lower than in dust weather conditions. The downward movement suppressed the transport process, promoted the settling velocity of dust aerosols in the atmosphere, and reduced the values of AOD. In addition, gusts and dust devils mainly occurred near the surface, with heights often below a hundred meters, which also hindered the transport of dust aerosols to the upper atmosphere [45,46,47,49,59]. Of course, some factors may also introduce uncertainty into the above results; for example, due to observation errors from onboard instruments and interference from residual clouds, satellite observation data may contain certain errors [62]. MODIS aerosol products from the Multiangle Implementation of Atmospheric Correction (MAIAC), Dark Target (DT), and Deep Blue (DB) algorithms all contain certain errors [63], and observation errors and retrieval errors will directly influence uncertainties in satellite AOD accuracy. Satellites only observe the desert once a day at a specific time point; observations of gusts and dust devils are conducted throughout the day, and the temporal mismatch between satellite overpass times and gust/dust devil occurrences would underestimate the values of AOD. Moreover, gusts and dust devils are more localized events; the spatial resolution of the MODIS AOD product is 1.0° × 1.0°, and the spatial representativeness of satellite data and station observations can also introduce uncertainty into the results. Future research efforts will involve the introduction of more satellites to supplement the errors caused by a single satellite being able to perform observations only once a day. Although the results present inherent uncertainties, the contributions from gusts and dust devils to atmospheric dust aerosols require further investigation.

5. Conclusions

In this study, we investigated the temporal variations in dust emissions for dust events, gusts, and dust devils in TaZhong over the central Taklimakan Desert region, further evaluated the monthly contributions of the dust emissions from the above three dust emission modes, and discussed the effects of dust and non-dust weather on dust aerosols. Our results indicate that the maximum values of daily dust emission and emission time for dust events, gusts, and dust devils are 430.9, 107.3, and 43.1 kg/km2 and 13.02, 1.05, and 3.63 h, respectively. The monthly dust emission and emission time for the above three dust emission modes peaked in July, August, and June, respectively, and seasonal dust emissions and emission times all fluctuated followed the pattern summer > spring > autumn > winter.
For dust events, gusts, and dust devils, the average monthly contributions to dust emissions were 48.2, 10.6, and 41.2%, and those to emission time were 60.5, 25.5, and 14.0%, respectively. During the spring and winter, dust emissions were dominated by dust events, and during the autumn, dust devils played a dominant role.
In addition, the average monthly AOD of TaZhong corresponding to dust weather was 0.7, which was much higher than the value of 0.3 corresponding to non-dust weather; therefore, the contribution of gusts and dust devils to atmospheric dust aerosols still presents a number of uncertainties.

Author Contributions

Conceptualization, X.Y. and A.M.; Methodology, X.Y. and A.M.; Software, M.M.; Formal analysis, M.M., C.Z., F.Y., W.H., Q.H. and G.W.; Investigation, C.Z., F.Y., W.H., Q.H. and G.W.; Resources, C.Z., F.Y., W.H., Q.H. and G.W.; Data curation, C.Z., F.Y., W.H., Q.H. and G.W.; Writing—original draft, X.Y.; Writing—review & editing, X.Y. All authors have read and agreed to the published version of the manuscript.

Funding

This research was funded by the “Tianshan Talent” Training Program-Science and Technology Innovation Team (Tianshan Innovation Team) Project (2022TSYCTD0007), The Joint Research Project for Meteorological Capacity Improvement of CMA (24NLTSZ006), The Innovation and Development Project of Xinjiang Meteorological Service (ZD202306), The Third Xinjiang Scientific Expedition Project (2022xjkk030502), Central Scientific Research Institute of the Public Basic Scientific Research Business Professional (IDM2022007), Youth Innovation Team of China Meteorological Administration (CMA2024QN13), and China Postdoctoral Science Foundation (2022MD723851).

Data Availability Statement

Institute of Desert Meteorology, China Meteorological Administration (IDM) supplied the observation data used to support the findings of this study by the under license, therefore, they cannot be made freely available.

Acknowledgments

We thank Tazhong meteorological station, China Meteorological Bureau, and Qing Gong, Wei Zheng, and Xinping Wu for their help in the observed experiment of dust weather.

Conflicts of Interest

The authors declare no conflicts of interest.

References

  1. Exequel, E. Global Deserts Outlook; United Nations Environment Programme: Nairobi, Kenya, 2006; pp. 1–5. [Google Scholar]
  2. Tyagi, B.K. Desert Malaria; Springer: Berlin, Germany, 2023; pp. 1–21. [Google Scholar]
  3. Han, Y.X.; Zhao, T.L.; Song, L.C.; Fang, X.M.; Yin, Y.; Deng, Z.Q.; Wang, S.P.; Fan, S.X. A linkage between Asian dust, dissolved iron and marine export production in the deep ocean. Atmos. Environ. 2011, 45, 4291–4298. [Google Scholar] [CrossRef]
  4. Martin, J.H.; Fitzwater, S.E. Iron deficiency limits phytoplankton growth in the north-east Pacific subarctic. Nature 1988, 331, 341–343. [Google Scholar] [CrossRef]
  5. Middleton, N.J. Desert dust hazards: A global review. Aeolian Res. 2017, 24, 53–63. [Google Scholar] [CrossRef]
  6. UNCCD and FAO. Guideline on the Integration of Sand and Dust Storm Management into Key Policy Areas; United Nations Convention to Combat Desertification and Food and Agriculture Organization of the United Nations: Bonn, Germany; Rome, Italy, 2024; pp. 1–26. [Google Scholar]
  7. Na, H.; Qi, J.; Zhen, Y.; Yao, X.; Gao, H. Asian dust-transported bacteria survive in seawater and alter the community structures of coastal bacterioplankton in the Yellow Sea. Glob. Planet. Change 2023, 224, 104115. [Google Scholar] [CrossRef]
  8. Korhonen, H.; Napari, I.; Timmreck, C.; Vehkamaki, H.; Pirjola, L.; Lehtinen, K.E.J.; Lauri, A.; Kulmala, M. Heterogeneous nucleation as a potential sulphate-coating mechanism of atmospheric mineral dust particles and implications of coated dust on new particle formation. J. Geophys. Res. Atmos. 2003, 108, 4546. [Google Scholar] [CrossRef]
  9. Shen, X.J.; Sun, J.Y.; Che, H.Z.; Zhang, Y.G.; Zhou, C.H.; Gui, K.; Xu, W.Y.; Liu, Q.; Zhong, J.T.; Xia, C.; et al. Characterization of dust-related new particle formation events based on long-term measurement in the North China Plain. Atmos. Chem. Phys. 2023, 23, 8241–8257. [Google Scholar] [CrossRef]
  10. Tegen, I.; Lacis, A.A.; Fung, I. The influence on climate forcing of mineral aerosols from disturbed soils. Nature 1996, 380, 419–422. [Google Scholar] [CrossRef]
  11. Xia, X.; Zong, X. Shortwave versus longwave direct radiative forcing by Taklimakan dust aerosols. Geophys. Res. Lett. 2009, 36, L07803. [Google Scholar] [CrossRef]
  12. Kok, J.F.; Ward, D.S.; Mahowald, N.M.; Evan, A.T. Global and regional importance of the direct dust-climate feedback. Nat. Commun. 2018, 9, 241. [Google Scholar] [CrossRef]
  13. Che, H.; Xia, X.; Zhao, H.; Li, L.; Gui, K.; Zheng, Y.; Song, J.; Qi, B.; Zhu, J.; Miao, Y.; et al. Aerosol optical and radiative properties and their environmental effects in China: A review. Earth-Sci. Rev. 2024, 248, 104634. [Google Scholar] [CrossRef]
  14. Wang, J.Y. Preliminary Study on Chronic Respiratory Damage Caused by Sand and Dust Pollution in the Population. Doctoral Dissertation, Lanzhou University, Lanzhou, China, 2014. [Google Scholar]
  15. Kwon, H.J.; Cho, S.H.; Chun, Y.; Lagarde, F.; Pershagen, G. Effects of the Asian dust events on daily mortality in Seoul, Korea. Environ. Res. 2002, 90, 1–5. [Google Scholar] [CrossRef] [PubMed]
  16. Maki, T.; Kurosaki, Y.; Onishi, K.; Lee, K.C.; Pointing, S.B.; Jugder, D.; Yamanaka, N.; Hasegawa, H.; Shinoda, M. Variations in the structure of airborne bacterial communities in Tsogt-Ovoo of Gobi desert area during dust events. Air Qual. Atmos. Health 2017, 10, 249–260. [Google Scholar] [CrossRef] [PubMed]
  17. Lal, R. Soil degradation by erosion. Land Degrad. Dev. 2001, 12, 519–539. [Google Scholar] [CrossRef]
  18. Middleton, N.J. Impacts of dust storms on agriculture: A synthesis. E3S Web Conf. 2024, 575, 05001. [Google Scholar] [CrossRef]
  19. UNDP. Global Multidimensional Poverty Index 2023; United Nations Development Programme and Oxford Poverty and Human Development Initiative: Nairobi, Kenya, 2023; pp. 1–30. [Google Scholar]
  20. Ginoux, P.; Chin, M.; Tegen, I.; Prospero, J.M.; Holben, B.; Dubovik, O.; Lin, S.J. Sources and distributions of dust aerosols simulated with the GOCART model. J. Geophys. Res. Atmos 2001, 106, 20255–20273. [Google Scholar] [CrossRef]
  21. Liu, C. Observation, Parameterization, and Climate Simulation Study on the Process of Dust Emission. Master Thesis, Nanjing University of Information Science and Technology, Nanjing, China, 2016. [Google Scholar]
  22. Uno, I.; Eguchi, K.; Yumimoto, K.; Takemura, T.; Shimizu, A.; Uematsu, M.; Liu, Z.; Wang, Z.; Hara, Y.; Sugimoto, N. Asian dust transported one full circuit around the globe. Nat. Geosci. 2009, 2, 557–560. [Google Scholar] [CrossRef]
  23. Zhang, X.Y.; Gong, S.L.; Zhao, T.L.; Arimoto, R.; Wang, Y.Q.; Zhou, Z.J. Sources of Asian dust and role of climate change versus desertification in Asian dust emission. Geophys. Res. Lett. 2003, 30, 2272. [Google Scholar] [CrossRef]
  24. Chen, S.; Huang, J.; Li, J.; Jia, R.; Jiang, N.; Kang, L.; Ma, X.; Xie, T. Comparison of dust emissions, transport, and deposition between the Taklimakan Desert and Gobi Desert from 2007 to 2011. Sci. China-Earth Sci. 2017, 60, 1338–1355. [Google Scholar] [CrossRef]
  25. Shao, Y.P. Physics and Modelling of Wind Erosion; Springer: Berlin, Germany, 2008; pp. 117–145. [Google Scholar]
  26. Marticorena, B.; Bergametti, G. Modeling the atmospheric dust cycle: 1. Design of a soil- derived dust emission scheme. J. Geophys. Res. 1995, 100, 16415–16430. [Google Scholar] [CrossRef]
  27. Iversen, J.D.; White, B.R. Saltation threshold on Earth, Mars and Venus. Sedimentology 1982, 29, 111–119. [Google Scholar] [CrossRef]
  28. Zhang, Z.; Dong, Z.; Li, J.; Qian, G.; Jiang, C. Implications of surface properties for dust emission from gravel deserts (gobis) in the Hexi Corridor. Geoderma 2016, 268, 69–77. [Google Scholar] [CrossRef]
  29. Fcan, F.; Marticorena, B.; Bergametti, G. Parametrization of the increase of the aeolian erosion threshold wind friction velocity due to soil moisture for arid and semi-arid areas. Ann. Geophys. 1999, 17, 149–157. [Google Scholar] [CrossRef]
  30. Raupach, M.R.; Gillette, D.A.; Leys, J.F. The effect of roughness elements on wind erosion threshold. J. Geophys. Res. Atmos. 1993, 98, 3023–3029. [Google Scholar] [CrossRef]
  31. Shao, Y. Adhesion theory and model for air humidity impact on dust emission. Aeolian Res. 2024, 66, 100898. [Google Scholar] [CrossRef]
  32. Du, H.; Xue, X.; Wang, T.; Lu, S.; Liao, J.; Li, S.; Fan, Y.; Liu, X. Modeling dust emission in alpine regions with low air temperature and low air pressure—A case study on the Qinghai-Tibetan Plateau (QTP). Geoderma 2022, 422, 115930. [Google Scholar] [CrossRef]
  33. Shao, Y.; Zhang, J.; Ishizuka, M.; Mikami, M.; Leys, J.; Huang, N. Dependency of particle size distribution at dust emission on friction velocity and atmospheric boundary layer stability. Atmos. Chem. Phys. 2020, 20, 12939–12953. [Google Scholar] [CrossRef]
  34. Tan, L.; Qu, J.; Wang, H.; An, Z.; Wang, T.; Zhao, S. Turbulent flow structures over a gobi surface and their impact on aeolian sand transport. Geophys. Res. Lett. 2023, 50, e2023GL103360. [Google Scholar] [CrossRef]
  35. Zhang, J.; Li, G.; Shi, L.; Huang, N.; Shao, Y. Impact of turbulence on aeolian particle entrainment: Results from wind-tunnel experiments. Atmos. Chem. Phys. 2022, 22, 9525–9535. [Google Scholar] [CrossRef]
  36. Gillette, D.A.; Passi, R. Modeling dust emission caused by wind erosion. J. Geophys. Res. Atmos. 1988, 93, 14233–14242. [Google Scholar] [CrossRef]
  37. Lu, H.; Shao, Y. A new model for dust emission by saltation bombardment. J. Geophys. Res. Atmos. 1999, 104, 16827–16842. [Google Scholar] [CrossRef]
  38. Zhang, H.S.; Zhu, H.; Peng, Y.; Kang, L.; Chen, J.Y.; Park, S.U. Experiment on dust flux during dust storm period over sand desert area. Acta Meteorol. Sin. 2007, 65, 744–752. [Google Scholar]
  39. Ravi, S.; D’Odorico, P. A field-scale analysis of the dependence of wind erosion threshold velocity on air humidity. Geophys. Res. Lett. 2005, 32, L21404. [Google Scholar] [CrossRef]
  40. Neuman, C.M. Effects of temperature and humidity upon the transport of sedimentary particles by wind. Sedimentology 2004, 51, 1–17. [Google Scholar] [CrossRef]
  41. Barchyn, T.E.; Hugenholtz, C.H. Winter variability of aeolian sediment transport threshold on a cold-climate dune. Geomorphology 2012, 177–178, 38–50. [Google Scholar] [CrossRef]
  42. Wu, C.L.; Lin, Z.H. Uncertainty in dust budget over East Asia simulated by WRF/Chem with different dust emission schemes. Atmos. Ocean. Sci. Lett. 2013, 6, 428–433. [Google Scholar]
  43. Zhang, X.X.; Claiborn, C.; Lei, J.Q.; Vaughan, J.; Wu, S.X.; Li, S.Y.; Liu, L.Y.; Wang, Z.F.; Wang, Y.D.; Huang, S.Y.; et al. Aeolian dust in Central Asia: Spatial distribution and temporal variability. Atmos. Environ. 2020, 238, 117734. [Google Scholar] [CrossRef]
  44. Liu, B.; Peng, W.Y.; Liu, S.L.; Yang, T. Estimation on the dust lift amount and source contribution of the heavy dust weather in mid-March 2021 over Central East Asia. J. Desert Res. 2022, 42, 79–86. [Google Scholar]
  45. Gillette, D.A.; Sinclair, P.C. Estimation of suspension of alkaline material by dust devils in the United States. Atmos. Environ. 1990, 24, 1135–1142. [Google Scholar] [CrossRef]
  46. Han, Y.X.; Wang, K.H.; Liu, F.; Zhao, T.L.; Yin, Y.; Duan, J.P.; Luan, Z.P. The contribution of dust devils and dusty plumes to the aerosol budget in western China. Atmos. Environ. 2016, 126, 21–27. [Google Scholar] [CrossRef]
  47. Koch, J.; Renno, N.O. The role of convective plumes and vortices on the global aerosol budget. Geophys. Res. Lett. 2005, 32, L18806. [Google Scholar] [CrossRef]
  48. Li, J.X.; Han, Y.X.; Liu, W.J.; Cao, L.; Lu, Z.Q. Contributions of gust under stationery weather conditions to the dust aerosol budget in northwestern China. Atmos. Res. 2023, 293, 106914. [Google Scholar] [CrossRef]
  49. Zeng, Q.C.; Cheng, X.L.; Hu, F. The mechanism of soil erosion and dust emission under the action of nonsteady strong wind with descending motion and gustwind. Clim. Environ. Res. 2007, 12, 244–250. [Google Scholar]
  50. Pan, L.; Han, Y.X.; Lu, Z.Q.; Li, J.X.; Gao, F.; Liu, Z.H.; Liu, W.J.; Liu, Y.G. Integrative investigation of dust emissions by dust storms and dust devils in North Africa. Sci. Total Environ. 2021, 756, 144128. [Google Scholar] [CrossRef] [PubMed]
  51. Onishchenko, O.; Fedun, V.; Horton, W.; Pokhotelov, O.; Verth, G. Dust devils: Structural features, dynamics and climate impact. Climate 2019, 7, 12. [Google Scholar] [CrossRef]
  52. Guan, X.; Li, Q.Y. The impact of dust deposition on soil properties in western southern Xinjiang. Soils 2000, 4, 178–182. [Google Scholar]
  53. Li, C.; Wang, Y.; Lei, J.; Xu, X.; Wang, S.; Fan, J.; Fan, S. Damage by wind-blown sand and its control measures along the Taklimakan Desert highway in China. J. Arid Land 2021, 13, 98–106. [Google Scholar] [CrossRef]
  54. Zhou, J. A Study on the Impact of Sandstorms on Residents’ Health in Hotan Area, Xinjiang. Master’s Thesis, Xinjiang Medical University, Urumqi, China, 2011. [Google Scholar]
  55. Yang, X.; Zhou, C.; Yang, F.; Meng, L.; Huo, W.; Mamtimin, A.; He, Q. Saltation activity on non-dust days in the Taklimakan Desert, China. Remote Sens. 2022, 14, 2099. [Google Scholar] [CrossRef]
  56. National Weather Bureau of China. Criterion of Surface Meteorological Observation; Meteorological Press: Beijing, China, 1979; pp. 33–34. [Google Scholar]
  57. Ma, M.; Yang, X.; He, Q.; Mamtimin, A. Improvement of dust emission parameterization scheme for dust devils based on intensive observations in the northern margin of the Taklimakan Desert. Theor. Appl. Climatol. 2023, 151, 1227–1237. [Google Scholar] [CrossRef]
  58. Yang, X.H. Observation and Parameterization on Dust Emission over the Taklimakan Desert. Doctoral Dissertation, Nanjing University of Information Science and Technology, Nanjing, China, 2019. [Google Scholar]
  59. Renno, N.O.; Burkett, M.L.; Larkin, M.P. A simple thermodynamical theory for dust devils. J. Atmos. Sci. 1998, 55, 3244–3252. [Google Scholar] [CrossRef]
  60. Yang, X.H.; Xu, X.L.; He, Q.; Mamtimin, A.; Yu, B.; Tang, S.H. Sand flux estimation during a sand-dust storm at Tazhong area of Taklimakan Desert, China. J. Arid. Land 2011, 3, 199–205. [Google Scholar] [CrossRef]
  61. Li, J.L.; He, Q.; Ge, X.Y.; Abbas, A. Spatiotemporal distribution of aerosols over the Tibet Plateau and Tarim Basin (1980–2020). J. Clean. Prod. 2022, 374, 133958. [Google Scholar] [CrossRef]
  62. Xia, X.A. The MODIS aerosol optical thickness over land worldwide is significantly higher. Sci. Bull. 2006, 51, 2297–2303. [Google Scholar] [CrossRef]
  63. Mhawish, A.; Banerjee, T.; Sorek-Hamer, M.; Lyapustin, A.; Broday, D.M.; Chatfield, R. Comparison and evaluation of MODIS Multi-angle Implementation of Atmospheric Correction (MAIAC) aerosol product over South Asia. Remote Sens. Environ. 2019, 224, 12–28. [Google Scholar] [CrossRef]
Figure 1. Location of the Taklimakan Desert and the experimental site. (a) The experimental ground in dust conditions. (b) The piezoelectric saltation sensor (Sensit). (c) The BSNE samplers. (d) A dust devil in the Taklimakan Desert.
Remotesensing 17 02531 g001
Figure 2. Daily dust emissions and emission time for dust events, gusts, and dust devils and daily wind speed, soil moisture, and surface temperature in TaZhong from 1 March 2008 to 28 February 2010.
Remotesensing 17 02531 g002
Figure 3. Monthly dust emissions and emission time for dust events, gusts, and dust devils and monthly wind speed, soil moisture, and surface temperature in TaZhong from March 2008 to February 2010.
Remotesensing 17 02531 g003
Figure 4. Contributions of dust events, gusts, and dust devils to monthly total dust emissions and emission time in TaZhong from March 2008 to February 2010.
Remotesensing 17 02531 g004
Figure 5. Monthly AOD data on dust and non-dust weather and precipitation in TaZhong from March 2008 to February 2010.
Remotesensing 17 02531 g005
Figure 6. Spatial distributions of average AOD values between March 2008 and February 2010 on dust (left) and non-dust (right) weather over the Taklimakan Desert.
Remotesensing 17 02531 g006
Figure 7. Daily dust emissions and AOD from 20–31 May 2009 in TaZhong.
Remotesensing 17 02531 g007
Figure 8. Average annular flow field profiles from 20 May 2009 to 23 May 2009 (a,c), and from 27 May 2009 to 31 May 2009 (b,d). (a,b) are cross-sections along 38.5°N, and (c,d) are cross-sections along 82.5°E (see Figure 1). The arrows in the figures represent wind vectors, and the colors indicate vertical velocity (values greater than 0 indicate upward motion).
Remotesensing 17 02531 g008
Table 1. The contribution rates of dust events, gusts, and dust devils to seasonal dust emissions in TaZhong.
Dust Emission (kg/km2)SpringSummerAutumnWinter
Dust event1604.9
(57.1%)
2526.4
(48.6%)
301.9
(32.7%)
11.3
(51.8%)
Gust129.1
(4.6%)
183.9
(3.5%)
46.7
(5.1%)
7.1
(32.6%)
Dust devil1075.9
(38.3%)
2492.1
(47.9%)
574.9
(62.3%)
3.4
(15.6%)
Total2809.95202.4923.521.8
Table 2. The contribution rates of dust weather, gusts, and dust devils to seasonal dust emission time in TaZhong.
Emission Time
(h)
SpringSummerAutumnWinter
Dust event125.8
(76.1%)
141.3
(71.7%)
20.2
(50.6%)
3.8
(52.1%)
Gust25.3
(15.3%)
28.1
(14.3%)
10
(25.1%)
3.4
(46.6%)
Dust devil14.2
(8.6%)
27.7
(14.0%)
9.7
(24.3%)
0.1
(1.3%)
Total165.3197.139.97.3
Disclaimer/Publisher’s Note: The statements, opinions and data contained in all publications are solely those of the individual author(s) and contributor(s) and not of MDPI and/or the editor(s). MDPI and/or the editor(s) disclaim responsibility for any injury to people or property resulting from any ideas, methods, instructions or products referred to in the content.

