Next Issue
Volume 17, June-1
Previous Issue
Volume 17, May-1
 
 
remotesensing-logo

Journal Browser

Journal Browser

Remote Sens., Volume 17, Issue 10 (May-2 2025) – 147 articles

Cover Story (view full-size image): 
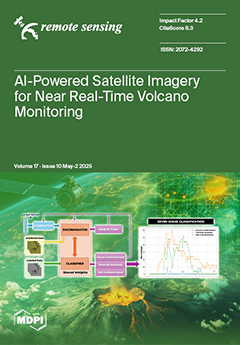
Satellite imagery enables the continuous monitoring of volcanoes, even in remote areas. To handle the vast amount of data, automated analysis is necessary. This study proposes a semi-supervised GAN model that automatically classifies SEVIRI image pixels for the detection of thermal anomalies, volcanic ash, and meteorological clouds, enabling the temporal characterization of different types of volcanic activity (explosions, lava fountains, lava flows, etc.). The model was trained and tested on Mount Etna and then applied to the Stromboli, Tajogaite, and Nyiragongo volcanoes to assess its generalization capability. The results show an average performance score of 0.9, evaluated using accuracy, precision, recall, and F1-score. View this paper
  • Issues are regarded as officially published after their release is announced to the table of contents alert mailing list.
  • You may sign up for e-mail alerts to receive table of contents of newly released issues.
  • PDF is the official format for papers published in both, html and pdf forms. To view the papers in pdf format, click on the "PDF Full-text" link, and use the free Adobe Reader to open them.
Order results
Result details
Section
Select all
Export citation of selected articles as:
17 pages, 2995 KiB  
Article
Environmental Influence on NbS (Nature-Based Solution) Mitigation of Diurnal Surface Urban Heat Islands (SUHI)
by Chih-chen Liu, Min-cheng Tu, Jen-yang Lin, Hongyuan Huo and Wei-jen Chen
Remote Sens. 2025, 17(10), 1802; https://doi.org/10.3390/rs17101802 - 21 May 2025
Viewed by 417
Abstract
Utilizing 58 Landsat-7 images taken over 10 years, the current study investigated the relationship between the mitigation of surface urban heat islands (SUHIs) by NbSs (Nature-based Solutions) and influential variables such as physical variables of NbSs, environmental variables of the streets, and meteorological [...] Read more.
Utilizing 58 Landsat-7 images taken over 10 years, the current study investigated the relationship between the mitigation of surface urban heat islands (SUHIs) by NbSs (Nature-based Solutions) and influential variables such as physical variables of NbSs, environmental variables of the streets, and meteorological variables. Parks and permeable pavements are the two types of NbS devices under examination. Reference (i.e., unaffected by any NbS) and experimental (i.e., affected by only one NbS) areas were selected to perform the analysis. Areas affected by large water bodies or more than one NbS device were excluded. The cooling effect caused by NbS was linked to the influential variables by multiple regression models. Key findings included the following: Firstly, the distance to an NbS is more important than the area of an individual NbS, implying that small and evenly distributed NbS devices might have better overall cooling effects than large but sparsely placed NbS devices. Secondly, NbSs do not significantly contribute to cooling in districts with grid-type streets, while exhibiting significant cooling for districts with complex street patterns. Older districts with complex street patterns should be the focus of NbS implementation, not newer, modern districts. However, NbS cooling is sensitive to several variables in districts with complex patterns. NbS installation in those districts requires careful planning to maximize engineering investment. Lastly, maintenance can be essential to sustain the cooling capacity of NbSs over time. Full article
Show Figures

Figure 1

23 pages, 12949 KiB  
Article
A Grid-Based Hierarchical Representation Method for Large-Scale Scenes Based on Three-Dimensional Gaussian Splatting
by Yuzheng Guan, Zhao Wang, Shusheng Zhang, Jiakuan Han, Wei Wang, Shengli Wang, Yihu Zhu, Yan Lv, Wei Zhou and Jiangfeng She
Remote Sens. 2025, 17(10), 1801; https://doi.org/10.3390/rs17101801 - 21 May 2025
Viewed by 437
Abstract
Efficient and realistic large-scale scene modeling is an important application of low-altitude remote sensing. Although the emerging 3DGS technology offers a simple process and realistic results, its high computational resource demands hinder direct application in large-scale 3D scene reconstruction. To address this, this [...] Read more.
Efficient and realistic large-scale scene modeling is an important application of low-altitude remote sensing. Although the emerging 3DGS technology offers a simple process and realistic results, its high computational resource demands hinder direct application in large-scale 3D scene reconstruction. To address this, this paper proposes a novel grid-based scene-segmentation technique for the process of reconstruction. Sparse point clouds, acting as an indirect input for 3DGS, are first processed by Z-Score and a percentile-based filter to prepare the pure scene for segmentation. Then, through grid creation, grid partitioning, and grid merging, rational and widely applicable sub-grids and sub-scenes are formed for training. This is followed by integrating Hierarchy-GS’s LOD strategy. This method achieves better large-scale reconstruction effects within limited computational resources. Experiments on multiple datasets show that this method matches others in single-block reconstruction and excels in complete scene reconstruction, achieving superior results in PSNR, LPIPS, SSIM, and visualization quality. Full article
Show Figures

Figure 1

23 pages, 2319 KiB  
Article
Codesign of Transmit Waveform and Receive Filter with Similarity Constraints for FDA-MIMO Radar
by Qiping Zhang, Jinfeng Hu, Xin Tai, Yongfeng Zuo, Huiyong Li, Kai Zhong and Chaohai Li
Remote Sens. 2025, 17(10), 1800; https://doi.org/10.3390/rs17101800 - 21 May 2025
Viewed by 285
Abstract
The codesign of the receive filter and transmit waveform under similarity constraints is one of the key technologies in frequency diverse array multiple-input multiple-output (FDA-MIMO) radar systems. This paper discusses the design of constant modulus waveforms and filters aimed at maximizing the signal-to-interference-and-noise [...] Read more.
The codesign of the receive filter and transmit waveform under similarity constraints is one of the key technologies in frequency diverse array multiple-input multiple-output (FDA-MIMO) radar systems. This paper discusses the design of constant modulus waveforms and filters aimed at maximizing the signal-to-interference-and-noise ratio (SINR). The problem’s non-convexity renders it challenging to solve. Existing studies have typically employed relaxation-based methods, which inevitably introduce relaxation errors that degrade system performance. To address these issues, we propose an optimization framework based on the joint complex circle manifold–complex sphere manifold space (JCCM-CSMS). Firstly, the similarity constraint is converted into the penalty term in the objective function using an adaptive penalty strategy. Then, JCCM-CSMS is constructed to satisfy the waveform constant modulus constraint and filter norm constraint. The problem is projected into it and transformed into an unconstrained optimization problem. Finally, the Riemannian limited-memory Broyden–Fletcher–Goldfarb–Shanno (RL-BFGS) algorithm is employed to optimize the variables in parallel. Simulation results demonstrate that our method achieves a 0.6 dB improvement in SINR compared to existing methods while maintaining competitive computational efficiency. Additionally, waveform similarity was also analyzed. Full article
(This article belongs to the Special Issue Array Digital Signal Processing for Radar)
Show Figures

Graphical abstract

28 pages, 10801 KiB  
Article
Fast and Accurate Direct Position Estimation Using Low-Complexity Correlation and Swarm Intelligence Optimization
by Yuze Duan, Zuping Tang, Jiaolong Wei, Jie Sun and Kaixian Ying
Remote Sens. 2025, 17(10), 1799; https://doi.org/10.3390/rs17101799 - 21 May 2025
Viewed by 356
Abstract
Direct Position Estimation (DPE) is an alternative GNSS positioning method that models received satellite signals as a function of the receiver’s navigation state, allowing for the direct estimation of position, velocity, and time within the navigation domain. However, existing DPE algorithms face significant [...] Read more.
Direct Position Estimation (DPE) is an alternative GNSS positioning method that models received satellite signals as a function of the receiver’s navigation state, allowing for the direct estimation of position, velocity, and time within the navigation domain. However, existing DPE algorithms face significant challenges due to the non-convex nature of the optimization problem and the large solution space, resulting in high computational complexity. To address these challenges, this paper introduces a framework for searching for navigation solutions in DPE through swarm intelligence algorithms, combined with a low-complexity correlation approach. Furthermore, an adaptive Dung Beetle Optimization (ADBO) algorithm is developed. By leveraging insights from fitness landscape analysis, the ADBO algorithm dynamically adjusts subpopulation proportions and the convergence factor while incorporating hybrid mutation strategies for effective adaptation to various types of optimization problems. Benchmark function tests demonstrate that the ADBO algorithm achieves superior convergence performance compared with other popular swarm intelligence algorithms. Both extensive simulations and real GNSS data experiments further validate that the proposed framework, incorporating the ADBO algorithm, achieves improved positioning accuracy compared to traditional positioning methods while outperforming traditional search algorithms and other swarm intelligence algorithms in both accuracy and computational efficiency. Full article
Show Figures

Figure 1

22 pages, 5602 KiB  
Article
Retrieval of Cloud Ice Water Path from FY-3F MWTS and MWHS
by Fuxiang Chen, Hao Hu, Fuzhong Weng, Changjiao Dong, Xiang Fang and Jun Yang
Remote Sens. 2025, 17(10), 1798; https://doi.org/10.3390/rs17101798 - 21 May 2025
Viewed by 189
Abstract
Microwave sounding observations obtained from the National Oceanic and Atmospheric Administration (NOAA) and the European Meteorological Operational Satellite Program (METOP) satellites have been used for retrieving the cloud ice water path (IWP). However, the IWP algorithms developed in the past cannot be applied [...] Read more.
Microwave sounding observations obtained from the National Oceanic and Atmospheric Administration (NOAA) and the European Meteorological Operational Satellite Program (METOP) satellites have been used for retrieving the cloud ice water path (IWP). However, the IWP algorithms developed in the past cannot be applied to the Fengyun-3F (FY-3F) microwave radiometers due to the differences in frequency of the primary channels and the fields of view. In this study, the IWP algorithm was tailored for the FY-3F satellite, and the retrieved IWP was compared with the fifth generation of reanalysis data from the European Centre for Medium-Range Weather Forecasts (ERA5) and the Meteorological Operational Satellite-C (METOP-C) products. The results indicate that the IWP distribution retrieved from FY-3F observations demonstrates strong consistency with the cloud ice distributions in ERA5 data and METOP-C products in low-latitude regions. However, discrepancies are observed among the three datasets in mid- to high-latitude regions. ERA5 data underestimate the frequency of high IWP values and overestimate the frequency of low IWP values. The IWP retrieval results from satellite datasets demonstrate a high level of consistency. Furthermore, an analysis of the IWP time series reveals that the retrieval algorithm used in this study better captures variability and seasonal characteristics of IWP compared to ERA5 data. Additionally, a comparison of FY-3F retrieval results with METOP-C products shows a high correlation and generally consistent distribution characteristics across latitude bands. These findings confirm the high accuracy of IWP retrieval from FY-3F data, which holds significant value for advancing IWP research in China. Full article
Show Figures

Figure 1

23 pages, 7221 KiB  
Article
SFANet: A Ground Object Spectral Feature Awareness Network for Multimodal Remote Sensing Image Semantic Segmentation
by Yizhou Lan, Daoyuan Zheng, Yingjun Zheng, Feizhou Zhang, Zhuodong Xu, Ke Shang and Zeyu Wan
Remote Sens. 2025, 17(10), 1797; https://doi.org/10.3390/rs17101797 - 21 May 2025
Viewed by 365
Abstract
The semantic segmentation of remote sensing images is vital for accurate surface monitoring and environmental assessment. Multimodal remote sensing images (RSIs) provide a more comprehensive dimension of information, enabling faster and more scientific decision-making. However, existing methods primarily focus on modality and spectral [...] Read more.
The semantic segmentation of remote sensing images is vital for accurate surface monitoring and environmental assessment. Multimodal remote sensing images (RSIs) provide a more comprehensive dimension of information, enabling faster and more scientific decision-making. However, existing methods primarily focus on modality and spectral channels when utilizing spectral features, with limited consideration of their association to ground object types. This association, commonly referred to as the spectral characteristics of ground objects (SCGO), results in distinct spectral responses across different modalities and holds significant potential for improving the segmentation accuracy of multimodal RSIs. Meanwhile, the inclusion of redundant features in the fusion process can also interfere with model performance. To address these problems, a ground object spectral feature awareness network (SFANet) specifically designed for RSIs that effectively leverages spectral features by incorporating the SCGO is proposed. SFANet includes two innovative modules: (1) the Spectral Aware Feature Fusion module, which integrates multimodal features in the encoder based on SCGO, and (2) the Adaptive Spectral Enhancement module, which reduces the confusion from redundant information in the decoder. SFANet significantly improves the mIoU by 5.66% and 4.76% compared to the baseline on two datasets, outperforming existing multimodal RSIs segmentation networks by adaptively enhanced spectral feature awareness. SFANet demonstrates significant advancements over other multimodal RSIs segmentation networks and provides new perspectives for RSI-specific network design by incorporating spectral characteristics. This work offers new perspectives for the design of segmentation networks for RSIs. Full article
Show Figures

Figure 1

17 pages, 1664 KiB  
Article
Joint Optimization of Carrier Frequency and PRF for Frequency Agile Radar Based on Compressed Sensing
by Zhaoxiang Yang, Hao Zheng, Yongliang Zhang, Junkun Yan and Yang Jiang
Remote Sens. 2025, 17(10), 1796; https://doi.org/10.3390/rs17101796 - 21 May 2025
Viewed by 300
Abstract
Frequency agile radar (FAR) exhibits robust anti-jamming capabilities and a superior low probability of intercept performance due to its randomized carrier frequency (CF) and pulse repetition frequency (PRF) hopping sequences. The advent of compressed sensing (CS) theory has effectively addressed the coherent processing [...] Read more.
Frequency agile radar (FAR) exhibits robust anti-jamming capabilities and a superior low probability of intercept performance due to its randomized carrier frequency (CF) and pulse repetition frequency (PRF) hopping sequences. The advent of compressed sensing (CS) theory has effectively addressed the coherent processing challenges of frequency agile signals. Nonetheless, the reconstructed results often suffer from elevated sidelobe levels, which lead to significant sparse recovery errors. The performance of sparse reconstruction is greatly influenced by the correlation between the dictionary matrix columns. Specifically, weaker correlation usually means better target detection performance and lower false alarm probability. Consequently, this paper adopts the maximum coherence coefficient (MCC) between the dictionary matrix columns as the cost function. In addition, in order to reduce the correlation of the dictionary matrix and improve the target detection performance, a genetic algorithm (GA) is employed to jointly optimize the CF hopping coefficients and PRFs of the FAR. The echo of optimized signals is subsequently reconstructed using the alternating direction method of multipliers (ADMM) algorithm. Simulation results demonstrate the effectiveness of the proposal. Full article
Show Figures

Graphical abstract

9 pages, 359 KiB  
Editorial
Comprehensive Analysis Based on Observation, Remote Sensing, and Numerical Models to Understand the Meteorological Environment in Arid Areas and Their Surrounding Areas
by Wen Huo and Xiefei Zhi
Remote Sens. 2025, 17(10), 1795; https://doi.org/10.3390/rs17101795 - 21 May 2025
Viewed by 274
Abstract
The evolution of meteorological environments in global arid and semi-arid regions has significant impacts on regional ecological security and global climate regulation [...] Full article
Show Figures

Figure 1

22 pages, 6793 KiB  
Article
The Spatiotemporal Variability of Ozone and Nitrogen Dioxide in the Po Valley Using In Situ Measurements and Model Simulations
by Stiliani Musollari, Andreas Pseftogkas, Maria-Elissavet Koukouli, Astrid Manders, Arjo Segers, Katerina Garane and Dimitris Balis
Remote Sens. 2025, 17(10), 1794; https://doi.org/10.3390/rs17101794 - 21 May 2025
Viewed by 313
Abstract
The Po Valley is depicted in the literature as a region with one of the most severe air pollution profiles in Europe, frequently exceeding the permitted statutory concentration limits for several air pollutants. The aim of this paper is to present an assessment [...] Read more.
The Po Valley is depicted in the literature as a region with one of the most severe air pollution profiles in Europe, frequently exceeding the permitted statutory concentration limits for several air pollutants. The aim of this paper is to present an assessment of the air quality over the Po Valley for the year 2022 as reported by ground-based air quality monitoring stations of the region and assess chemical transport modeling simulations which can enhance the spatiotemporal reporting in air quality levels which cannot be achieved by the sparse in situ monitoring station coverage. To achieve this, the concentration levels of two significant chemical compounds, namely ozone (O3) and nitrogen dioxide (NO2), are studied here. Measurements include the surface concentrations of in situ measurements from 28 stations reporting to the European Environment Agency (EEA), while chemical transport simulations from the Long-Term Ozone Simulation—European Operational Smog (LOTOS-EUROS) are employed for a comparative analysis of the relative levels observed in each of the two monitoring methods for air quality. The analysis of the EEA stations reports that, for year 2022, all selected monitoring stations exceeded the EU O3 level limit for a minimum of 33 days and the World Health Organization (WHO) limit for a minimum of 78 days. The concentrations of surface O3 and NO2 studied by both the measurements as well as the simulations exhibit a close correlation with the documented diurnal, monthly, and seasonal variability, as previously reported in the literature. The LOTOS-EUROS CTM ozone simulations demonstrate a strong correlation with the EEA measurements, with a monthly correlation coefficient of R > 0.98 and a diurnal correlation coefficient of R > 0.83, indicating that the model is highly effective at capturing the diverse spatiotemporal patterns. The co-variability between ozone and nitrogen dioxide surface levels reported by the EEA in situ measurements reports high R values from −0.76 to −0.88, while the CTM, due to the spatial resolution of the simulations which disables the identification of local effects, reports higher correlations of −0.96 to −0.99. The CTM simulations are hence shown to be able to close the spatial gaps of the in situ measurements and provide a dependable auxiliary tool for air quality monitoring across Europe. Full article
Show Figures

Graphical abstract

29 pages, 13515 KiB  
Article
The Spatiotemporal Evolution and Driving Factors of Surface Urban Heat Islands: A Comparative Study of Beijing and Dalian (2003–2023)
by Yaru Meng, Caixia Gao, Wenping Yu, Enyu Zhao, Wan Li, Renfei Wang, Yongguang Zhao, Hang Zhao and Jian Zeng
Remote Sens. 2025, 17(10), 1793; https://doi.org/10.3390/rs17101793 - 21 May 2025
Viewed by 418
Abstract
The urban heat island (UHI) effect significantly impacts urban environments and quality of life, yet research comparing coastal and inland cities is relatively lacking. This study, using the MYD11A2 dataset, analyzes the spatiotemporal evolution of land surface temperature (LST) and the surface urban [...] Read more.
The urban heat island (UHI) effect significantly impacts urban environments and quality of life, yet research comparing coastal and inland cities is relatively lacking. This study, using the MYD11A2 dataset, analyzes the spatiotemporal evolution of land surface temperature (LST) and the surface urban heat island intensity index (SUHIII) in Beijing (inland) and Dalian (coastal) from 2003 to 2023, exploring the driving factors from 2003 to 2018 and proposing mitigation strategies for similar cities. Key findings: (1) Beijing’s SUHIII is 0.45 °C higher than Dalian’s during summer days, while Dalian’s SUHIII is 0.24 °C stronger than Beijing’s during winter nights, likely due to Dalian’s maritime climate, which raises nighttime LSTs and intensifies the winter SUHIII. (2) Both cities show similar trends in LST and SUHIII, with fluctuations until 2010, an increase after 2011, and a peak in 2023, with the expansion of heat island areas occurring mainly in suburban regions. (3) From 2003 to 2018, TEMP is the primary factor promoting SUHIII, followed by ET and POP, with EVI as the main mitigating factor. Beijing’s PREP weakens SUHI, while Dalian’s PREP promotes it. Coastal cities should focus on water bodies and wetland planning to mitigate heat islands, especially in areas like Dalian which are affected by PREP. Full article
Show Figures

Graphical abstract

22 pages, 22067 KiB  
Article
Robust GNSS/INS Tightly Coupled Positioning Using Factor Graph Optimization with P-Spline and Dynamic Prediction
by Bokun Ning, Fang Zhao, Haiyong Luo, Dan Luo and Wenhua Shao
Remote Sens. 2025, 17(10), 1792; https://doi.org/10.3390/rs17101792 - 21 May 2025
Viewed by 398
Abstract
The combination of GNSS RTK and INS offers complementary advantages but faces significant challenges in urban canyons. Frequent cycle slips in carrier phase measurements and ambiguity resolution algorithms increase computational burden without improving positioning accuracy. Additionally, environmental interference introduces noise into observations, potentially [...] Read more.
The combination of GNSS RTK and INS offers complementary advantages but faces significant challenges in urban canyons. Frequent cycle slips in carrier phase measurements and ambiguity resolution algorithms increase computational burden without improving positioning accuracy. Additionally, environmental interference introduces noise into observations, potentially leading to complete signal loss. To address these issues, this paper proposes a factor graph optimization (FGO) positioning algorithm incorporating predictive observation factors. First, a penalized spline (P-spline) is constructed to predict and smooth Doppler measurements. The predicted Doppler is then fused with the dynamics model predictions to enhance robustness. Using predictive Doppler, carrier phase and pseudorange observations are reconstructed, generating predictive constraint factors to improve positioning accuracy. Real-world tests conducted in urban canyons, including Shanghai, demonstrate that the proposed method maintains stable positioning performance even under short-term signal outages, effectively mitigating cumulative positioning errors caused by data loss. Compared to traditional methods that rely solely on available observations, the proposed algorithm improves northward and dynamic positioning accuracy by 35% and 29%, respectively, providing a highly robust navigation solution for complex urban environments. Full article
Show Figures

Figure 1

17 pages, 2554 KiB  
Article
Retrieval of Dissolved Organic Carbon Storage in Plateau Lakes Based on Remote Sensing and Analysis of Driving Factors: A Case Study of Lake Dianchi
by Yufeng Yang, Wei Gao and Yuan Zhang
Remote Sens. 2025, 17(10), 1791; https://doi.org/10.3390/rs17101791 - 21 May 2025
Viewed by 275
Abstract
Dissolved organic carbon (DOC) is an essential form of carbon in lakes and has significant impact on thermal structure and carbon source-supporting food webs. Current remote sensing studies on DOC mainly focus on the retrieval of surface concentration of lakes, with limited understanding [...] Read more.
Dissolved organic carbon (DOC) is an essential form of carbon in lakes and has significant impact on thermal structure and carbon source-supporting food webs. Current remote sensing studies on DOC mainly focus on the retrieval of surface concentration of lakes, with limited understanding of three-dimensional carbon storage. This study proposes a novel vertical retrieval methodology for plateau lakes by integrating remote sensing and vertical profile analysis. Specifically, a Gaussian function-based vertical fitting model was developed to characterize DOC concentration distribution along water columns, where parameters (μ and σ) were calibrated against surface DOC concentrations retrieved from MODIS reflectance. A result-oriented storage algorithm was established by linking surface DOC concentration to DOC storage through linear relationships (R2 > 0.9), with slope and intercept functions optimized as depth-dependent equations. The mixed-layer depth (2 m) was determined through error minimization analysis of 16 vertical profiles. Applied to the eutrophic Lake Dianchi, results show significant vertical DOC variations (CV up to 101.4%) but consistent distribution patterns across profiles. Spatially, higher DOC storage occurred in central regions (80–120 g·m−2) with seasonal peaks in summer and autumn. Interannual analysis reveals wind speed and forest coverage as dominant drivers, while monthly variations correlate strongly with water temperature. This methodology advances real-time monitoring of carbon storage in deep plateau lakes, providing critical insights into lacustrine carbon cycling. Full article
(This article belongs to the Section Ecological Remote Sensing)
Show Figures

Figure 1

25 pages, 8246 KiB  
Article
A New Quasi-Linear Integral Transform Between Ocean Wave Spectrum and Phase Spectrum of an XTI-SAR
by Daozhong Sun, Yunhua Wang, Feng Luo and Xianxian Luo
Remote Sens. 2025, 17(10), 1790; https://doi.org/10.3390/rs17101790 - 20 May 2025
Viewed by 270
Abstract
Cross-Track Interferometric Synthetic Aperture Radar (XTI-SAR) can utilize variations in interferometric phase to measure sea surface velocity along radar radial direction and sea surface height, which can be used for ocean wave parameter inversion. However, research on the imaging mechanisms of XTI-SAR systems [...] Read more.
Cross-Track Interferometric Synthetic Aperture Radar (XTI-SAR) can utilize variations in interferometric phase to measure sea surface velocity along radar radial direction and sea surface height, which can be used for ocean wave parameter inversion. However, research on the imaging mechanisms of XTI-SAR systems for ocean waves remains understudied, and there are still some problems in its perception. To further study the imaging mechanism of XTI-SAR measurement systems for ocean waves, this paper describes research based on the nonlinear integral transform model and the quasi-linear integral transform model derived by Bao in 1999, which relate the XTI-SAR ocean wave spectrum to the phase spectrum. Firstly, this work derived another quasi-linear integral transform model based on the nonlinear integral transform model, and also optimized the quasi-linear integral transform model derived by Bao. The optimized quasi-linear integral transform model eliminates the need for complex calculations of cross-correlation functions between sea surface height and radar radial orbital velocity components of ocean waves, as well as the radar line-of-sight velocity transfer function, while maintaining high integral transform accuracy. Secondly, based on two-dimensional sea surface simulations, we analyzed the differences between the quasi-linear integral transform models and the nonlinear integral transform model corresponding to different XTI-SAR system configurations and different sea states. The numerical simulation results show that, for the XTI-SAR system, in general, the difference between the quasi-linear integral transform model derived in this work and the nonlinear integral transform model is greater than that of the quasi-linear integral transform model derived by Bao. However, the difference between the optimized quasi-linear integral transform model and the nonlinear integral transform model in this study is smaller, and it is more convenient when transforming the ocean wave spectrum to the phase spectrum. Full article
Show Figures

Graphical abstract

26 pages, 14974 KiB  
Article
HFEF2-YOLO: Hierarchical Dynamic Attention for High-Precision Multi-Scale Small Target Detection in Complex Remote Sensing
by Yao Lu, Biyun Zhang, Chunmin Zhang, Yifan He and Yanqiang Wang
Remote Sens. 2025, 17(10), 1789; https://doi.org/10.3390/rs17101789 - 20 May 2025
Viewed by 404
Abstract
Deep learning-based methods for real-time small target detection are critical for applications such as traffic monitoring, land management, and marine transportation. However, achieving high-precision detection of small objects against complex backgrounds remains challenging due to insufficient feature representation and background interference. Existing methods [...] Read more.
Deep learning-based methods for real-time small target detection are critical for applications such as traffic monitoring, land management, and marine transportation. However, achieving high-precision detection of small objects against complex backgrounds remains challenging due to insufficient feature representation and background interference. Existing methods often struggle to balance multi-scale feature enhancement and computational efficiency, particularly in scenarios with low target-to-background contrast. To address this challenge, this study proposes an efficient detection method called hierarchical feature enhancement and feature fusion YOLO (HFEF2-YOLO), which is based on the hierarchical dynamic attention. Firstly, a Hierarchical Filtering Feature Pyramid Network (HF-FPN) is introduced, which employs a dynamic gating mechanism to achieve differentiated screening and fusion of cross-scale features. This design addresses the feature redundancy caused by fixed fusion strategies in conventional FPN architectures, preserving edge details of tiny targets. Secondly, we propose a Dynamic Spatial–Spectral Attention Module (DSAM), which adaptively fuses channel-wise and spatial–dimensional responses through learnable weight allocation, generating dedicated spatial modulation factors for individual channels and significantly enhancing the saliency representation of dim small targets. Extensive experiments on four benchmark datasets (VEDAI, AI-TOD, DOTA, NWPU VHR-10) demonstrate the superiority of HFEF2-YOLO; the proposed method can reach an accuracy of 0.761, 0.621, 0.737, and 0.969 (in terms of mAP@0.5), outperforming state-of-the-art methods by 3.5–8.1%. Furthermore, a lightweight version (L-HFEF2-YOLO) is developed via dynamic convolution, reducing parameters by 42% while maintaining >95% accuracy, demonstrating real-time applicability on edge devices. Robustness tests under simulated degradation (e.g., noise, blur) validate its practicality for satellite-based tasks. Full article
(This article belongs to the Section Remote Sensing Image Processing)
Show Figures

Figure 1

26 pages, 18550 KiB  
Article
Imaging of Leaf Water Patterns of Vitis vinifera Genotypes Infected by Plasmopara viticola
by Erich-Christian Oerke and Ulrike Steiner
Remote Sens. 2025, 17(10), 1788; https://doi.org/10.3390/rs17101788 - 20 May 2025
Viewed by 271
Abstract
The water status of plants is affected by abiotic and biotic environmental factors and influences the growth and yield formation of crops. Assessment of the leaf water content (LWC) of grapevine using hyperspectral imaging (1000–2500 nm) was investigated under controlled conditions for its [...] Read more.
The water status of plants is affected by abiotic and biotic environmental factors and influences the growth and yield formation of crops. Assessment of the leaf water content (LWC) of grapevine using hyperspectral imaging (1000–2500 nm) was investigated under controlled conditions for its potential to study the effects of the downy mildew pathogen Plasmopara viticola on LWC of host tissue in compatible and incompatible interactions. A calibration curve was established for the relationship between LWC and the Normalized Difference Leaf Water Index (NDLWI1937) that uses spectral information from the water absorption band and NIR for normalization. LWC was significantly lower for abaxial than for adaxial leaf sides, irrespective of grapevine genotype and health status. Reflecting details of leaf anatomy, vascular tissue exhibited effects reverse to intercostal areas. Effects of P. viticola on LWC coincided with the appearance of first sporangia on the abaxial side and increased during further pathogenesis. Continuous water loss ultimately resulted in tissue death, which progressed from the margins into central leaf areas. Tiny spots of brown leaf tissue related to the reaction of partial resistant cultivars could be monitored only at the sensor’s highest spatial resolution. Proximal sensing enabled an unprecedented spatial resolution of leaf water content in host–pathogen interactions and confirmed that resistance reactions may produce a combination of dead and still-living cells that enable the development of biotrophic P. viticola. Full article
Show Figures

Figure 1

26 pages, 9582 KiB  
Article
Influencing Factors and Paths of the Coupling Relationship Between Ecosystem Services Supply–Demand and Human Well-Being in the Hexi Regions, Northwest China
by Yongge Li, Wei Liu, Meng Zhu, Qi Feng, Linshan Yang, Jutao Zhang, Zhenliang Yin and Xinwei Yin
Remote Sens. 2025, 17(10), 1787; https://doi.org/10.3390/rs17101787 - 20 May 2025
Viewed by 415
Abstract
The coupling coordination relationship between ecosystem services supply–demand and human well-being in arid inland regions is increasingly vulnerable to imbalance risks under the combined pressures of climate change and intensified anthropogenic activities. Here, we assessed dynamic changes in ecosystem services supply–demand, human well-being, [...] Read more.
The coupling coordination relationship between ecosystem services supply–demand and human well-being in arid inland regions is increasingly vulnerable to imbalance risks under the combined pressures of climate change and intensified anthropogenic activities. Here, we assessed dynamic changes in ecosystem services supply–demand, human well-being, their coupling relationships and influencing factors in the Hexi Regions by integrating remote sensing data, ecological model, ecosystem services supply–demand ratio (ESDR), coupling coordination degree (CCD) model, and the partial least squares structural equation modeling (PLS-SEM). Our results showed that the six key ecosystem services supply, demand, and ESDR in the Hexi Regions from 1990 to 2020 exhibited greater ecosystem services surplus in the Qilian Mountains and stronger deficits in urban and surrounding areas of the Hexi Corridor. The deficit of water yield accounted for 32% in the Hexi Corridor with large cropland irrigated, four times that of the Qilian Mountains, indicating a serious supply–demand mismatch in space and time. Additionally, survival-oriented human well-being across regions is still dominant. Overall, the coupling relationship between ESDR and human well-being in the Hexi Regions progressed towards a high level of coordination, with higher values observed in the oases of the Hexi Corridor and the central and eastern Qilian Mountains. The ESDR of food production and water yield showed a higher coupling coordination level with human well-being in the Qilian Mountains, where the CCD was generally exceeded by 0.7. Climate, vegetation, and land use intensity were key drivers of spatial heterogeneity in CCD. Human well-being made a greater contribution to CCD than other elements in the influence paths. Our results can provide a reference for promoting coordinated development of the ecological environment and sustainable human well-being in arid inland regions. Full article
Show Figures

Graphical abstract

21 pages, 3937 KiB  
Article
A 3D Reconstruction of Gas Cloud Leakage Based on Multi-Spectral Imaging Systems
by Lei Zhang and Liang Xu
Remote Sens. 2025, 17(10), 1786; https://doi.org/10.3390/rs17101786 - 20 May 2025
Viewed by 257
Abstract
Remote sensing imaging technology is one of the safest and most effective tools for gas leakage monitoring in chemical parks, as it enables fast and accurate access to detailed information about the gas cloud (e.g., volume, distribution, diffusion, and location) in the case [...] Read more.
Remote sensing imaging technology is one of the safest and most effective tools for gas leakage monitoring in chemical parks, as it enables fast and accurate access to detailed information about the gas cloud (e.g., volume, distribution, diffusion, and location) in the case of gas leakage. While multi-spectral imaging systems are commonly used for hazardous gas leakage detection, efforts to realize the three-dimensional reconstruction of gas clouds through data obtained from multi-spectral imaging systems remain scarce. In this study, we propose a method for realizing the three-dimensional reconstruction of gas clouds with only two multi-spectral imaging systems; in particular, the two multi-spectral imaging systems are used to simultaneously observe the three-dimensional space with gas leakage and reconstruct gas cloud images in real time. A geometric method is used for the localization in the monitoring space and the construction of a three-dimensional spatial grid. The non-axisymmetric inverse Abel transform (IAT) is then applied to the extracted gas absorbance images in order to realize the reconstruction of each layer, and these are then stacked to form a 3D gas cloud. Through the above measurement, identification, and reconstruction processes, a 3D gas cloud with geometric information and concentration distribution characteristics is generated. The results of simulation experiments and external field tests prove that gas clouds can be localized under the premise that they are completely covered by the field of view of both scanning systems, and the 3D distribution of the leakage gas cloud can be reconstructed quickly and accurately with the proposed system. Full article
Show Figures

Figure 1

16 pages, 11418 KiB  
Article
An Integrated GPR and Magnetometry Survey of the Roman Fort of Aquis Querquennis (Northwest Iberia)
by Tiago do Pereiro, João Fonte, Jesús García Sánchez, Filipe Ribeiro and Santiago Ferrer Sierra
Remote Sens. 2025, 17(10), 1785; https://doi.org/10.3390/rs17101785 - 20 May 2025
Viewed by 1331
Abstract
A comprehensive geophysical survey, combining magnetic gradiometry and ground-penetrating radar (GPR), was undertaken at the Roman fort of Aquis Querquennis to map buried archaeological structures, including potential walls and internal divisions, within its unexcavated areas. This research significantly enhances the understanding of the [...] Read more.
A comprehensive geophysical survey, combining magnetic gradiometry and ground-penetrating radar (GPR), was undertaken at the Roman fort of Aquis Querquennis to map buried archaeological structures, including potential walls and internal divisions, within its unexcavated areas. This research significantly enhances the understanding of the fort’s previously incomplete layout. The synergistic integration of geophysical data provides detailed spatial data of the buried archaeology, facilitating informed dissemination of the site’s historical significance and guiding the planning of future archaeological investigations. Full article
Show Figures

Figure 1

23 pages, 4589 KiB  
Article
Generalized Ambiguity Function for Bistatic FDA Radar Joint Velocity, Range, and Angle Parameters
by Xuchen Gao, Junwei Xie, Zihang Ding, Mengdi Zhang, Haowei Zhang, Haolong Zhai and Weihang Han
Remote Sens. 2025, 17(10), 1784; https://doi.org/10.3390/rs17101784 - 20 May 2025
Viewed by 292
Abstract
The bistatic frequency diverse array (FDA) radar system is designed to exploit the beam autoscanning of FDA radar, providing a novel solution to address spatial synchronization challenges in bistatic radar architecture, unleashing bistatic radar’s advantage in low-observable target detection, main-lobe jamming (MLJ) suppression, [...] Read more.
The bistatic frequency diverse array (FDA) radar system is designed to exploit the beam autoscanning of FDA radar, providing a novel solution to address spatial synchronization challenges in bistatic radar architecture, unleashing bistatic radar’s advantage in low-observable target detection, main-lobe jamming (MLJ) suppression, etc. To lay the theoretical foundation for subsequent research on bistatic FDA radar systems, this study develops a generalized ambiguity function (GAF) framework, jointly characterizing target velocity, range, and angular parameters, which can provide a reference for transmitted signal optimization and bistatic geometric configuration design. This paper derives the mathematical model of the bistatic FDA radar system’s GAF and validates that its structure not only depends on the transmitted signal but also exhibits strong geometric dependency, where baseline length and target position jointly reshape the bistatic triangle through numerical simulations. Full article
(This article belongs to the Special Issue Array and Signal Processing for Radar)
Show Figures

Graphical abstract

26 pages, 4037 KiB  
Article
Cascade Learning Early Classification: A Novel Cascade Learning Classification Framework for Early-Season Crop Classification
by Weilang Kong, Xiaoqi Huang, Jialin Liu, Min Liu, Luo Liu and Yubin Guo
Remote Sens. 2025, 17(10), 1783; https://doi.org/10.3390/rs17101783 - 20 May 2025
Viewed by 228
Abstract
Accurate early-season crop classification is critical for food security, agricultural applications and policymaking. However, when classification is performed earlier, the available time-series data gradually become scarce. Existing methods mainly focus on enhancing the model’s ability to extract features from limited data to address [...] Read more.
Accurate early-season crop classification is critical for food security, agricultural applications and policymaking. However, when classification is performed earlier, the available time-series data gradually become scarce. Existing methods mainly focus on enhancing the model’s ability to extract features from limited data to address this challenge, but the extracted critical phenological information remains insufficient. This study proposes a Cascade Learning Early Classification (CLEC) framework, which consists of two components: data preprocessing and a cascade learning model. Data preprocessing generates high-quality time-series data from the optical, radar and thermodynamic data in the early stages of crop growth. The cascade learning model integrates a prediction task and a classification task, which are interconnected through the cascade learning mechanism. First, the prediction task is performed to supplement more time-series data of the growing stage. Then, crop classification is carried out. Meanwhile, the cascade learning mechanism is used to iteratively optimize the prediction and classification results. To validate the effectiveness of CLEC, we conducted early-season classification experiments on soybean, corn and rice in Northeast China. The experimental results show that CLEC significantly improves crop classification accuracy compared to the five state-of-the-art models in the early stages of crop growth. Furthermore, under the premise of obtaining reliable results, CLEC advances the earliest identifiable timing, moving from the flowing to the third true leaf stage for soybean and from the flooding to the sowing stage for rice. Although the earliest identifiable timing for corn remains unchanged, its classification accuracy improved. Overall, CLEC offers new ideas for solving early-season classification challenges. Full article
(This article belongs to the Section AI Remote Sensing)
Show Figures

Figure 1

24 pages, 69346 KiB  
Article
Unsupervised Cross-Domain Polarimetric Synthetic Aperture Radar (PolSAR) Change Monitoring Based on Limited-Label Transfer Learning and Vision Transformer
by Xinyue Zhang, Rong Gui, Jun Hu, Jinghui Zhang, Lihuan Tan and Xixi Zhang
Remote Sens. 2025, 17(10), 1782; https://doi.org/10.3390/rs17101782 - 20 May 2025
Viewed by 304
Abstract
Limited labels and detailed changed land-cover interpretation requirements pose challenges for time-series PolSAR change monitoring research. Accurate labels and supervised models are difficult to reuse between massive unlabeled time-series PolSAR data due to the complex distribution shifts caused by different imaging parameters, scene [...] Read more.
Limited labels and detailed changed land-cover interpretation requirements pose challenges for time-series PolSAR change monitoring research. Accurate labels and supervised models are difficult to reuse between massive unlabeled time-series PolSAR data due to the complex distribution shifts caused by different imaging parameters, scene changes, and random noises. Moreover, many related methods can only detect binary changes in PolSAR images and struggle to track the detailed land cover changes. In this study, an unsupervised cross-domain method based on limited-label transfer learning and a vision transformer (LLTL-ViT) is proposed for PolSAR land-cover change monitoring, which effectively alleviates the problem of difficult label reuse caused by domain shift in time-series SAR data, significantly improves the efficiency of label reuse, and provides a new paradigm for the transfer learning of time-series polarimetric SAR. Firstly, based on the polarimetric scattering characteristics and manifold-embedded distribution alignment transfer learning, LLTL-ViT transfers the limited labeled samples of source-domain PolSAR data to unlabeled target-domain PolSAR time-series for initial classification. Secondly, the accurate samples of target domains are further selected based on the initial transfer classification results, and the deep learning network ViT is applied to classify the time-series PolSAR images accurately. Thirdly, with the reliable secondary classification results of time-series PolSAR images, the detailed changes in land cover can be accurately tracked. Four groups of cross-domain change monitoring experiments were conducted on the Radarsat-2, Sentinel-1, and UAVSAR datasets, with about 10% labeled samples from the source-domain PolSAR. LLTL-ViT can reuse the samples between unlabeled target-domain time-series and leads to a change detection accuracy and specific land-cover change tracking accuracy of 85.22–96.36% and 72.18–88.06%, respectively. Full article
(This article belongs to the Special Issue Advances in Microwave Remote Sensing for Earth Observation (EO))
Show Figures

Graphical abstract

15 pages, 4642 KiB  
Technical Note
Seasonal and Interannual Variations in M2 Tidal Current in Offshore Guangdong
by Caijing Huang, Tingting Zu, Lili Zeng, Rui Shi, Qiang Wang, Ping Wang, Yingwei Tian, Rongwei Zhai and Xinjun Xu
Remote Sens. 2025, 17(10), 1781; https://doi.org/10.3390/rs17101781 - 20 May 2025
Viewed by 195
Abstract
Understanding tidal changes and their potential forcing mechanisms enables a better assessment of non-stationary tidal effects for projecting extreme sea levels and nuisance flooding. In this study, we investigate the seasonal and interannual changes in the M2 tidal current off the Guangdong [...] Read more.
Understanding tidal changes and their potential forcing mechanisms enables a better assessment of non-stationary tidal effects for projecting extreme sea levels and nuisance flooding. In this study, we investigate the seasonal and interannual changes in the M2 tidal current off the Guangdong coast using currents observed via two different types of high-frequency radar from 2019 to 2022. The results indicate significant seasonal changes in the M2 tidal current in the coastal areas of the Pearl River Estuary and Cape Maqijiao, with the largest relative deviations occurring in summer, reaching 10–20%. Observations of thermohaline profiles from 2006 to 2007 and 1978 to 1988 show that runoff in summer can reach these two areas and change the stratification of seawater, in turn affecting tidal currents. A comparative analysis of the two areas suggests that the greater the runoff, the wider the area where the M2 tidal current experiences significant seasonal variation. No significant interannual changes in the M2 tidal current were detected offshore of Guangdong during the observation period. However, an abrupt change occurred in the coastal area of Shantou in 2021, primarily caused by the distortion of the antenna patterns. Full article
Show Figures

Graphical abstract

23 pages, 51122 KiB  
Article
Research on the Response Mechanism of Vegetation to Drought Stress in the West Liao River Basin, China
by Yuhong Tian, Huichao Zheng, Mengxuan Yan and Lizhu Wu
Remote Sens. 2025, 17(10), 1780; https://doi.org/10.3390/rs17101780 - 20 May 2025
Viewed by 363
Abstract
Understanding vegetation’s drought response helps predict ecosystem adaptations to climate change and offers scientific insights for managing extreme climate events. Using RS technology, this study systematically investigates the response mechanisms of vegetation to drought and their spatiotemporal variations in the ecologically sensitive semi-arid [...] Read more.
Understanding vegetation’s drought response helps predict ecosystem adaptations to climate change and offers scientific insights for managing extreme climate events. Using RS technology, this study systematically investigates the response mechanisms of vegetation to drought and their spatiotemporal variations in the ecologically sensitive semi-arid area and the national grain security zone—West Liao River Basin, China. The findings reveal that (1) from 2000 to 2018, NDVI exhibited a fluctuating upward trend, and drought trends remained pronounced in certain areas and seasons; (2) growing-season droughts impaired productivity, while winter droughts reduced soil moisture, with arid-zone vegetation being most vulnerable; (3) grasslands responded rapidly to drought, forests slowly via deep roots, and croplands suffered most during critical growth phases; and (4) drought-adapted western forests/shrubs recovered best, while eastern croplands required targeted measures like resilient crops and water management. The results of this study not only provide a scientific basis for ecological management in the West Liao River Basin but also offer valuable insights for vegetation and water resource management in other arid and semi-arid regions globally. This research holds significant importance for addressing climate change and achieving regional sustainable development. Full article
Show Figures

Figure 1

23 pages, 6182 KiB  
Article
Mapping Temperate Grassland Dynamics in China Inner Mongolia (1980s–2010s) Using Multi-Source Data and Deep Neural Network
by Xuefeng Xu, Jiakui Tang, Na Zhang, Anan Zhang, Wuhua Wang and Qiang Sun
Remote Sens. 2025, 17(10), 1779; https://doi.org/10.3390/rs17101779 - 20 May 2025
Viewed by 423
Abstract
As a vital part of the Eurasian temperate grassland, the Chinese temperate grassland is primarily distributed in the Inner Mongolia Plateau. This paper focuses on mapping temperate grassland dynamics from the 1980s to the 2010s in Inner Mongolia, which was divided into temperate [...] Read more.
As a vital part of the Eurasian temperate grassland, the Chinese temperate grassland is primarily distributed in the Inner Mongolia Plateau. This paper focuses on mapping temperate grassland dynamics from the 1980s to the 2010s in Inner Mongolia, which was divided into temperate meadow steppe (TMS), temperate typical steppe (TTS), temperate desert steppe (TDS), temperate steppe desert (TSD) and temperate desert (TD). Multi-source features, including multispectral reflectance, vegetation growth, topography, water bodies, meteorological data, and soil characteristics, were selected based on their distinct physical properties and remote sensing variations. Then, we applied deep neural network (DNN) models to classify them, achieving an accuracy of 79.4% in the 1980s and 81.1% in the 2000s. Additionally, validation in the 2010s through field reconnaissance demonstrated an accuracy of 72.7%, which was acceptable, confirming that DNN is an effective method for classifying temperate grasslands. The results revealed that TTS had the highest proportion in the study area (39%), while TMS and TSD had the lowest (8.2% and 8.1%, respectively). Grassland types have the distribution law of aggregation; according to statistics, 61.1% of the grassland area remained unchanged, and the transition zone between adjacent grassland classes was highly easy to change. The area variation mainly came from TTS, TDS, and TSD, but not TD. The mutual transformation of different grassland types occurred mainly in adjacent areas between them. This study demonstrates the potential of DNN for long-term grassland mapping and provides the most comprehensive classification maps of Inner Mongolia grasslands to date, which are invaluable for grassland research and conservation efforts in the area. Full article
Show Figures

Figure 1

25 pages, 2843 KiB  
Article
Leveraging Phenology to Assess Seasonal Variations of Plant Communities for Mapping Dynamic Ecosystems
by Thilina D. Surasinghe, Kunwar K. Singh and Lindsey S. Smart
Remote Sens. 2025, 17(10), 1778; https://doi.org/10.3390/rs17101778 - 20 May 2025
Viewed by 432
Abstract
Seasonally dynamic plant communities present challenges for remote mapping, but estimating phenology can help identify periods of peak spectral distinction. While phenology is widely used in environmental and agricultural mapping, its broader ecological applications remain underexplored. Using a temperate wetland complex as a [...] Read more.
Seasonally dynamic plant communities present challenges for remote mapping, but estimating phenology can help identify periods of peak spectral distinction. While phenology is widely used in environmental and agricultural mapping, its broader ecological applications remain underexplored. Using a temperate wetland complex as a case study, we leveraged NDVI time series from Sentinel imagery to refine a wetland classification scheme by identifying periods of maximum plant community distinction. We estimated plant phenology with ground-reference points and mapped the study area using Random Forest (RF) with both Sentinel and PlanetScope imagery. Most plant communities showed distinct phenological variations between April–June (growing season) and September–October (transitional season). Merging phenologically similar communities improved classification accuracy, with April and September imagery yielding better results than the peak summer months. Combining both seasons achieved the highest classification accuracy (~77%), with key RF predictors including digital elevation, and near-infrared and tasseled cap indices. Despite its higher spatial resolution, PlanetScope underperformed compared to Sentinel, as spectral similarities between plant communities limited classification accuracy. While Sentinel provides valuable data, higher spectral resolution is needed for distinguishing similar plant communities. Integrating phenology into mapping frameworks can improve the detection of rare and ephemeral vegetation, aiding conservation efforts. Full article
(This article belongs to the Section Ecological Remote Sensing)
Show Figures

Graphical abstract

40 pages, 17802 KiB  
Article
Mapping Windthrow Risk in Pinus radiata Plantations Using Multi-Temporal LiDAR and Machine Learning: A Case Study of Cyclone Gabrielle, New Zealand
by Michael S. Watt, Andrew Holdaway, Nicolò Camarretta, Tommaso Locatelli, Sadeepa Jayathunga, Pete Watt, Kevin Tao and Juan C. Suárez
Remote Sens. 2025, 17(10), 1777; https://doi.org/10.3390/rs17101777 - 20 May 2025
Viewed by 360
Abstract
As the frequency of strong storms and cyclones increases, understanding wind risk in both existing and newly established plantation forests is becoming increasingly important. Recent advances in the quality and availability of remotely sensed data have significantly improved our capability to make large-scale [...] Read more.
As the frequency of strong storms and cyclones increases, understanding wind risk in both existing and newly established plantation forests is becoming increasingly important. Recent advances in the quality and availability of remotely sensed data have significantly improved our capability to make large-scale wind risk predictions. This study models the loss of radiata pine (Pinus radiata D.Don) plantations following a severe cyclone within the Gisborne Region of New Zealand through leveraging repeat regional LiDAR acquisitions, optical imagery, and various surfaces describing key climatic, topographic, and storm-specific conditions. A random forest model was trained on 9713 plots classified as windthrow or no-windthrow. Model validation using 50 iterations of 80/20 train/test splits achieved robust accuracy (accuracy = 0.835; F1 score = 0.841; AUC = 0.913). In comparison to most European empirical models (AUC = 0.51–0.90), our framework demonstrated superior discrimination, underscoring its value for regions prone to cyclones. Among the 14 predictor variables, the most influential were mean windspeed during February, the wind exposition index, site drainage, and stand age. Model predictions closely aligned with the estimated 3705 hectares of cyclone-induced forest damage and indicated that 20.9% of unplanted areas in the region would be at risk of windthrow at age 30 if established in radiata pine. The resulting wind risk surface serves as a valuable decision-support tool for forest managers, helping to mitigate wind risk in existing forests and guide adaptive afforestation strategies. Although developed for radiata pine plantations in New Zealand, the approach and findings have broader relevance for forest management in cyclone-prone regions worldwide, particularly where plantation forestry is widely practised. Full article
Show Figures

Figure 1

29 pages, 1755 KiB  
Review
A Review of Machine Learning Applications in Ocean Color Remote Sensing
by Zhenhua Zhang, Peng Chen, Siqi Zhang, Haiqing Huang, Yuliang Pan and Delu Pan
Remote Sens. 2025, 17(10), 1776; https://doi.org/10.3390/rs17101776 - 20 May 2025
Viewed by 652
Abstract
Ocean color remote sensing technology has proven to be an indispensable tool for monitoring ocean conditions, as it has consistently provided critical data on global ocean optical properties, color, and biogeochemical parameters over several decades. With the rapid advancement of artificial intelligence, the [...] Read more.
Ocean color remote sensing technology has proven to be an indispensable tool for monitoring ocean conditions, as it has consistently provided critical data on global ocean optical properties, color, and biogeochemical parameters over several decades. With the rapid advancement of artificial intelligence, the integration of machine learning (ML) models into ocean color remote sensing has become a significant focus within the scientific community. This article provides a comprehensive review of the current status and challenges associated with ML models in ocean color remote sensing, assessing their applications in atmospheric correction, color inversion, carbon cycle analysis, and data reconstruction. This review highlights the advancements made in applying ML techniques, such as neural networks and deep learning, to improve data accuracy, enhance resolution, and enable more precise predictions of oceanic phenomena. Despite challenges such as model generalization and computational complexity, ML has significant potential for enhancing our understanding of marine ecosystems, facilitating real-time monitoring, and supporting global climate models. Full article
(This article belongs to the Section Environmental Remote Sensing)
Show Figures

Graphical abstract

20 pages, 8652 KiB  
Article
A Detection and Cover Integrated Waveform Design Method with Good Correlation Characteristics and Doppler Tolerance
by Haoting Guo, Fulai Wang, Nanjun Li, Zezhou Wu, Chen Pang, Lei Zhang and Yongzhen Li
Remote Sens. 2025, 17(10), 1775; https://doi.org/10.3390/rs17101775 - 20 May 2025
Viewed by 221
Abstract
With the increasing complexity of the electromagnetic environment, radar waveform design needs to break through the limitation of traditional single-function architectures, prompting the emergence of integrated radar waveforms. Currently, the mainstream integrated signals are achieved through conventional waveform synthesis or time/frequency division multiplexing. [...] Read more.
With the increasing complexity of the electromagnetic environment, radar waveform design needs to break through the limitation of traditional single-function architectures, prompting the emergence of integrated radar waveforms. Currently, the mainstream integrated signals are achieved through conventional waveform synthesis or time/frequency division multiplexing. However, the former suffers from limited design flexibility and is confined to single scenario applications, while the latter has interference between different sub-channels, which will limit the performance of multi-function radar. Aiming at the above problems, this paper proposes a waveform optimization method for a detection and cover integrated signal with high Doppler tolerance. By constructing a joint optimization model, the sidelobe characteristics of the signal’s autoambiguity function and the output response of the non-cooperative matched filter were incorporated into the unified objective function framework. The gradient descent algorithm is used to solve the model, and the optimized waveform with low sidelobe characteristics and multiple false target interference abilities is obtained. When the optimized waveform generates multiple false targets to cover our radar position, its peak sidelobe level (PSL) drops below −23 dB, and most of the sidelobe levels in the range-Doppler interval of interest drop below −40 dB. Finally, the proposed integrated waveform undergoes hardware-in-the-loop experiments, experimentally validating its performance and the effectiveness of the proposed method. Full article
Show Figures

Figure 1

41 pages, 12709 KiB  
Article
Refinement of Trend-to-Trend Cross-Calibration Total Uncertainties Utilizing Extended Pseudo Invariant Calibration Sites (EPICS) Global Temporally Stable Target
by Minura Samaranayake, Morakot Kaewmanee, Larry Leigh and Juliana Fajardo Rueda
Remote Sens. 2025, 17(10), 1774; https://doi.org/10.3390/rs17101774 - 20 May 2025
Viewed by 341
Abstract
Cross-calibration is an essential technique for calibrating Earth observation satellite sensors, which involves taking nearly simultaneous images of a ground target to compare an uncalibrated sensor to a well-calibrated reference sensor. This study introduces the hyperspectral Trend-to-Trend (T2T) cross-calibration technique utilizing EPICS Cluster [...] Read more.
Cross-calibration is an essential technique for calibrating Earth observation satellite sensors, which involves taking nearly simultaneous images of a ground target to compare an uncalibrated sensor to a well-calibrated reference sensor. This study introduces the hyperspectral Trend-to-Trend (T2T) cross-calibration technique utilizing EPICS Cluster 13 Global Temporally Stable (Cluster 13-GTS) as the calibration target, offering better temporal stability than previous targets used in T2T cross-calibration by an absolute difference of 0.4%, between coefficients of variation across all bands excluding CA band. A multispectral sensor-specific normalized hyperspectral profile was developed using the EO-1 Hyperion hyperspectral profile over Cluster 13-GTS to improve Spectral Band Adjustment Factor (SBAF) estimation, capturing sensor-specific Relative Spectral Response (RSR) variations and introducing the ability to use the multispectral sensor-specific hyperspectral profile for calibrating future satellite sensors like Landsat Next with super-spectral bands. SBAFs were derived from EO-1 Hyperion normalized to multispectral sensors, which were interpolated to 1 nm, ensuring precise spectral band adjustments following a Monte Carlo simulation approach for uncertainty quantification. Results show that reference sensor-specific hyperspectral profiles at 1 nm spectral resolution improve SBAF accuracy and exhibit total uncertainty within 5.8% across all bands and all sensor pairs with L8 as the reference sensor. These findings demonstrate that integrating reference sensor-specific high-resolution hyperspectral data and stable calibration targets improves T2T cross-calibration accuracy, supporting future super-spectral missions such as Landsat Next. Full article
Show Figures

Graphical abstract

14 pages, 3915 KiB  
Article
Investigation of the Application of Measured Meteorological Observations in Real-Time Precise Point Positioning
by Qinglan Zhang, Shirong Ye, Jingchao Xia, Peng Zhang, Dezhong Chen and Peng Jiang
Remote Sens. 2025, 17(10), 1773; https://doi.org/10.3390/rs17101773 - 19 May 2025
Viewed by 309
Abstract
Tropospheric delay is the main error source that affects the further improvement of the accuracy of space geodesy. High-precision zenith tropospheric delay (ZTD) can be used as a prior value for precise point positioning (PPP) in global navigation satellite systems (GNSSs) to enhance [...] Read more.
Tropospheric delay is the main error source that affects the further improvement of the accuracy of space geodesy. High-precision zenith tropospheric delay (ZTD) can be used as a prior value for precise point positioning (PPP) in global navigation satellite systems (GNSSs) to enhance the speed and accuracy of real-time PPP solutions. Using the Saastamoinen ZTD model, we computed ZTDs using different meteorological elements. One ZTD was termed MZTD and was obtained from 80 reference sites in the China Mainland Crustal Movement Observation Network (CMONOC), the other was termed HZTD and was obtained from elements acquired from the improved version of the hourly global pressure and temperature atmospheric model (HGPT2). The results indicate that the accuracy of the MZTD was 12.94% higher than that of the HZTD, with the ZTDs estimated by post-processing GNSS values as the reference values. Additionally, the MZTD and HZTD were both applied as constraints to the PPP solution. The application of the MZTD constraints to the PPP floating-point solution resulted in a 28.9% improvement in accuracy and a 36.4% decrease in convergence time in the U-direction as a maximum, compared with the application of the HZTD constraints. Full article
Show Figures

Figure 1

Previous Issue
Next Issue
Back to TopTop