Abstract
Dissolved organic carbon (DOC) is an essential form of carbon in lakes and has significant impact on thermal structure and carbon source-supporting food webs. Current remote sensing studies on DOC mainly focus on the retrieval of surface concentration of lakes, with limited understanding of three-dimensional carbon storage. This study proposes a novel vertical retrieval methodology for plateau lakes by integrating remote sensing and vertical profile analysis. Specifically, a Gaussian function-based vertical fitting model was developed to characterize DOC concentration distribution along water columns, where parameters (μ and σ) were calibrated against surface DOC concentrations retrieved from MODIS reflectance. A result-oriented storage algorithm was established by linking surface DOC concentration to DOC storage through linear relationships (R2 > 0.9), with slope and intercept functions optimized as depth-dependent equations. The mixed-layer depth (2 m) was determined through error minimization analysis of 16 vertical profiles. Applied to the eutrophic Lake Dianchi, results show significant vertical DOC variations (CV up to 101.4%) but consistent distribution patterns across profiles. Spatially, higher DOC storage occurred in central regions (80–120 g·m−2) with seasonal peaks in summer and autumn. Interannual analysis reveals wind speed and forest coverage as dominant drivers, while monthly variations correlate strongly with water temperature. This methodology advances real-time monitoring of carbon storage in deep plateau lakes, providing critical insights into lacustrine carbon cycling.
1. Introduction
Lakes, which cover only 0.53% of the Earth’s surface area, play a significant role in regulating the global carbon cycle and climate change [1,2]. Dissolved organic carbon (DOC) is an important yet understudied form of carbon in inland waters [3]. In lakes, DOC primarily originates from two sources: allochthonous and autochthonous. Allochthonous DOC is mainly derived from river inflow into the lake [4], while autochthonous DOC primarily comes from the decomposition of aquatic plants and phytoplankton [5]. Colored dissolved organic matter (CDOM), the optically active fraction of DOC, strongly absorbs ultraviolet and shortwave infrared radiation [6]. Hyperspectral sensors aboard remote sensing satellites can effectively capture these characteristics. Existing studies often retrieve surface CDOM concentrations through remote sensing and then establish the relationship between DOC and CDOM to indirectly estimate surface DOC concentration (DOCc) [7]. However, the relationship between DOC and CDOM is influenced by many factors, such as precipitation, photobleaching, and microbial decomposition, leading to significant regional and seasonal variations in this relationship [8]. Algal growth and degradation result in the production of substantial amounts of autochthonous DOC [5,9], increasing the difference in the vertical DOC concentration distribution of lakes. Most remote sensing studies have been limited to the lake surface, with a lack of understanding regarding DOC concentration variations below the lake surface, differences between deep and surface DOC concentrations, and changes in lake DOC storage (DOCs).
Given the instability of the relationship between DOC and its optically active component CDOM, using high-temporal-resolution remote sensing imagery to directly estimate lake DOCc may establish more immediate and robust retrieval models [2,5], thereby capturing the variation characteristics of lake DOC storage over short periods and large areas. The Moderate-resolution Imaging Spectroradiometer (MODIS), with its nearly daily revisit cycle, can meet the needs for dynamic monitoring of inland waters. However, its spatial resolution of ≥250 m limits its application in small lakes [10].
Lake Dianchi is the largest freshwater lake in the Yunnan-Guizhou Plateau and is also one of the most seriously eutrophic lakes in China [11]. Influenced by the southwest monsoon from the Indian Ocean, precipitation in the Dianchi basin is unevenly distributed, with most rainfall occurring during the rainy season [12]. The local low wind speeds not only facilitate the expansion of algal blooms but also maintain vertical stratification in the lake’s water quality [13]. Due to various meteorological conditions, the extent of phytoplankton blooms can vary significantly and may exhibit vertical migration, leading to non-uniform vertical distribution of lake Chla [14], which may follow Gaussian, exponential, or power-law distributions [15]. Correspondingly, the DOC concentration associated with Chla also exhibits similar vertical variations. Current research on water quality indicators based on vertical concentration variations is extensive [16,17], with methods divided into process-oriented and result-oriented approaches. The process-oriented approach relies on extensive vertical measurement data and hydrodynamic data to establish vertical concentration fitting models, combined with surface concentration retrieval models for estimation [2,18,19]. In contrast, the result-oriented approach directly establishes a linear relationship between surface water quality concentrations and the storage at different depths, which is simpler and requires less vertical data [16]. Currently, there is a lack of research on DOCs in Dianchi using remote sensing technology. There is limited understanding of the spatiotemporal distribution characteristics of DOCs in deep lakes like Dianchi. Therefore, quantitative retrieval of DOCs in Dianchi based on remote sensing methods can address technical challenges in real-time monitoring of carbon storage in large deep lakes, enhance the understanding of vertical variations in DOC concentration in deep lakes on the plateau, and provide important guidance for further understanding the carbon cycle in plateau lakes.
This study involved three field measurements of Dianchi Lake’s Waihai sub-region in January, March, and July 2023, obtaining surface and vertical DOC concentration data. Based on the measured surface DOC data and MODIS imagery, a DOCc retrieval model was developed. Statistical analysis of the measured vertical DOC concentration data was performed to identify vertical concentration variation patterns in Waihai and establish a DOCs retrieval model using a result-oriented approach. Long-term retrieval of DOCs in the Waihai was conducted, and its spatiotemporal variations and driving factors were analyzed. The main objectives of this study are: (1) to develop an integrated retrieval algorithm for plateau lakes that links imagery to surface DOC concentration and then to DOC storage; (2) to analyze the spatiotemporal variation characteristics of DOC storage in Waihai; and (3) to identify significant factors influencing changes in DOC storage in Dianchi.
2. Materials and Methods
2.1. Study Area
Dianchi is located within the city of Kunming, Yunnan Province, covering an area of 309.50 km2, with a corresponding storage capacity of 1.56 billion m3 and an average depth of 5.3 m. The total watershed area is 2920 km2 [20,21]. In 1996, the Haigeng Dam was completed, dividing Dianchi into northern Caohai and southern Waihai. The two regions differ significantly in water quality and area (Figure 1). Southern Waihai is the main part of Dianchi, with an area of 289.2 km2, accounting for 96.4% of the lake. This study focuses on Waihai, and Dianchi will be used as a shorthand for Waihai in the following sections. The average annual precipitation in the Dianchi basin is 933.3 mm, with an average of 816.8 mm during the flood season, constituting 87.5% of the annual precipitation. The average annual temperature and evaporation in the basin are 14.7 °C and 1409.4 mm, respectively [22], with minimal temperature variation throughout the year and high evaporation rates. The main rivers in the Dianchi basin flow through the urban area of Kunming, where farmland and construction land are predominant, leading to significant anthropogenic disturbances. Waihai has long been in a eutrophic state, classified as moderately to lightly eutrophic between 2001 and 2018 [23]. According to the 2022 Yunnan Province Ecological Environment Bulletin, the water quality of Waihai is categorized as Class V, failing to meet the Class III water function target, with a nutritional status of mild eutrophication.
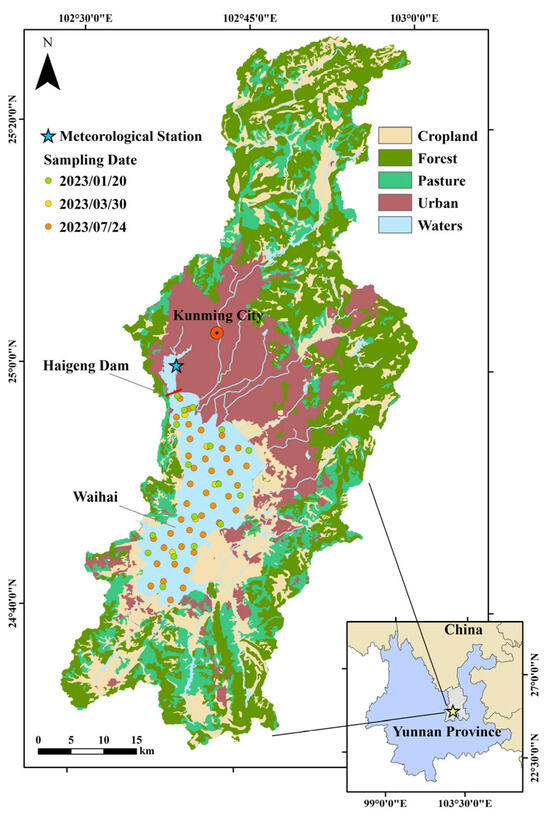
Figure 1.
Location of metrological, hydrological, and water quality gauging stations of Lake Dianchi basin.
2.2. DOC Sampling and Remote Sensing Image Acquisition
Dianchi was sampled on 20 January, 30 March, and 24 July 2023. A total of 47 surface DOCc measurements, 16 vertical DOC concentration measurements, and corresponding latitude and longitude coordinates for the sampling points were collected (Figure 1). Water samples taken from depths greater than 0.5 m were used to measure surface concentrations. For vertical concentrations, five water samples were collected at equal intervals between 0.5 m below the surface and 0.5 m above the bottom, with the sampling intervals based on the measured depth. The statistical data for the water samples is shown in Table 1. The CV in the table is the abbreviation of the coefficient of variation. The degree of dispersion of a set of data is characterized by dividing the standard deviation by the mean. The calculation formula is in Section 2.3.3. DOC was measured using the combustion oxidation-non-dispersive infrared absorption method, with sample pretreatment involving 0.45 μm membrane filtration. The instrument used was a Shimadzu TOC-L CPH.

Table 1.
Observed DOC concentration in Lake Dianchi.
MODIS Terra Level-3 Surface Reflectance Product MOD09GA from 2000 to 2023 was obtained from Google Earth Engine. This product has a temporal resolution of 1 day and a spatial resolution of 500 m, including seven bands: red (R: 645 nm), near-infrared (N: 859 nm), blue (B: 469 nm), green (G: 555 nm), and three shortwave infrared bands (S1: 1240 nm, S2: 1640 nm, and S3: 2130 nm). All bands are atmospherically corrected and have been widely used in related lake studies [24]. Image processing included cloud and haze masking, calculation of the Floating Algae Index (FAI), the Normalized Difference Vegetation Index (NDVI), and the Modified Normalized Difference Water Index (MNDWI). The actual surface reflectance is obtained by multiplying the pixel values by 0.0001, with pixel values greater than 0.0246 at band S3 (2130 nm) indicating cloud or haze obstruction [24]. FAI values greater than −0.004 indicate algal coverage [5], and NDVI < 0 combined with MNDWI > 0 indicate that the pixel is water rather than terrestrial vegetation [25,26]. The vector boundary of Dianchi was contracted inward by one pixel (500 m) to reduce the impact of land adjacency effects. Surface DOC concentration data and corresponding reflectance images were paired to form matchups. The size of the time window is a key factor affecting the quality and quantity of the data pairing, with smaller time windows being preferable [27]. Due to the frequent cloudy and rainy weather in Dianchi during the summer, the number of high-quality images is limited. Given that the previous related studies have controlled the maximum data matching time within one week [7], the time windows for the three measurement periods were set to ±2 days (January), ±1 day (March), and ±7 days (July).
2.3. Remote Sensing Retrieval Methods for DOC Storage
2.3.1. Surface DOC Concentration Retrieval Model
Raw image bands may exhibit high correlations, and using a single band to represent the optical activity of DOC has limitations. However, new features derived from combinations of multiple bands can provide deeper insights [28,29], with band combinations shown in Table 2. The DOCc from the matchups was used as the dependent variable, and the band combination with the highest correlation was selected as the independent variable. A leave-one-out cross-validation method was employed to establish the surface DOC retrieval model [30].
Table 2.
The combination forms of band reflectance.
2.3.2. DOC Storage Retrieval Model
When DOCc at different depths within a single vertical profile has been measured, the current depth’s measured DOCs is the integral of DOC concentrations at various depths. The specific calculation formula is as follows:
In the formula, represents the DOCc at the -th depth starting from 0.5 m below the water surface. According to the standard of “Technical Specifications for Monitoring of Surface Water and Wastewater in China (HJ/T 91-2002)” [31], we take the concentration of DOC measured at 0.5 m above the water surface as the surface DOC concentration.
Formula (1) assumes that the variation between two adjacent measurements within a single vertical profile is uniform. However, in reality, this is more complex. The distribution function of vertical DOCc in the water column can vary with changes in climatic conditions and topography [2,32]. In such cases, needs to be replaced with a corresponding fitting function, generally obtained from extensive vertical measurement data.
Given the limited vertical measurement data and to simplify the computation process, this study employs a result-oriented method. Based on relevant studies on Chla storage calculation [16,33], using the result-oriented method to estimate DOC storage requires three assumptions: (1) all vertical measurement data can be approximated by a fitting function; (2) DOCc at a certain depth can be considered to vary uniformly; and (3) DOCs is linearly related to surface DOCc, with both the intercept and slope of this relationship being functions of depth. The specific formula is as follows:
In Formula (2), is the integral of vertical DOCc when the surface concentration is DOCc (unit: mg·m−2), with and representing the functions for the slope and intercept, respectively.
The final DOCs calculation method is as follows:
- Construct a DOCc retrieval model based on remote sensing image spectral data and measured surface concentration data.
- Analyze and determine the optimal fitting function type (Gaussian, exponential, or power function) for vertical DOCc changes in Dianchi based on the characteristics of measured vertical DOCc data. Calibrate the parameters of the fitting function, initializing the parameters based on different surface DOCc.
- Determine the depth of the well-mixed layer in Dianchi based on assumption (2). Use the fitting function to calculate DOCs above the mixed layer depth, and use uniform integration to calculate DOCs from the mixed layer depth to the bottom. The final DOCs for a single section is the sum of the DOCs from these two parts.
- The lake depth is obtained from lake elevation data, which comes from the literature [34]. Based on assumption (3), calculate measured DOCs from measured vertical DOCc to explore the relationship between DOCs at different depths and surface DOCc, and use lake depth to determine the parameters in Formulas (2)–(4).
- Use the surface DOCc retrieved in Step One, lake depth data from Step Four, and the calibrated formulas to retrieve DOCs in Dianchi.
2.3.3. Model Accuracy Evaluation
The model accuracy is evaluated for a single vertical profile using the coefficient of determination (R2), mean absolute percentage error (MAPE), mean absolute error (MAE), and mean ratio (MR). The formulas are as follows:
where represents the measured value, is the simulated value from the linear regression model, represents the model’s predicted value, is the mean of the measured values, is the mean of the predicted values, represents the data size, and denotes the data index.
Research on DOCs in the Dianchi area is currently lacking. This study draws on research related to Chla storage in Dianchi [16,33,35,36] and uses four indices—Coefficient of Variation (CV), Mean Residence Time (MRD), Concentration Profile (CP), and Water Column Concentration Difference (WCCD)—to quantitatively describe the vertical DOCc variation characteristics in Dianchi. The formulas are as follows:
where and represent the standard deviation and mean of the current vertical concentration, represents the measurement depth below the lake surface (0.5 m), represents the DOC concentration (g·m−3) measurement at the depth, and and represent the maximum and minimum values of the vertical profile concentration (g·m−3), respectively. Among them, CV is a percentage, and the other three types of indices are all dimensionless.
2.4. Other Data Sources and Processing Methods
Aside from images and DOC data, other data used in the study include meteorological data, land use data, and anthropogenic nitrogen and phosphorus inputs. Meteorological data (temperature, precipitation, and wind speed) from 2000 to 2020 were obtained from the National Meteorological Information Center (https://data.cma.cn/). Land use type raster data (30 m resolution) were sourced from the Resource and Environmental Science and Data Center (http://www.resdc.cn/). Annual net nitrogen input (Net Anthropogenic Nitrogen Input, NANI) and net phosphorus input (Net Anthropogenic Phosphorus Input, NAPI) for the Dianchi basin from 2000 to 2018 were obtained from the literature [37]. All data were used to calculate seasonal and annual averages. Missing data for certain years were linearly interpolated from adjacent years to analyze the impact on the long-term changes in DOCs retrieval for Dianchi. The M-K test was used to examine the time series changes in the data.
3. Results
3.1. Surface DOC Concentration Retrieval for Lakes
As shown in Figure 2, there is a high correlation between measured DOCc and single-band reflectance from MODIS (r > 0.43), with particularly high correlations among single bands, especially in the visible range (r > 0.90). Due to redundancy among the band data and the inadequacy of a single band to represent the variations in Dianchi DOCc, band combinations are necessary. This study uses all original bands to form combinations and calculates their correlation with the measured surface DOC concentration. The results are shown in Figure 3a, where the THR (BRG) band combination exhibits the highest correlation with measured DOCc (R2 = 0.61, p < 0.01). Using the leave-one-out method, the THR (BRG) combination with the highest correlation is used as the independent variable to establish the DOCc retrieval model. The fitting results and accuracy are shown in Figure 3b. Although the model tends to overestimate the measured concentrations to some extent (MR > 1), the DOCc retrieval model maintains overall low error levels (MAE = 14.76%, MAPE = 1.48%, MR = 1.02) and achieves high interpretive accuracy (R2 = 0.662, p < 0.01).
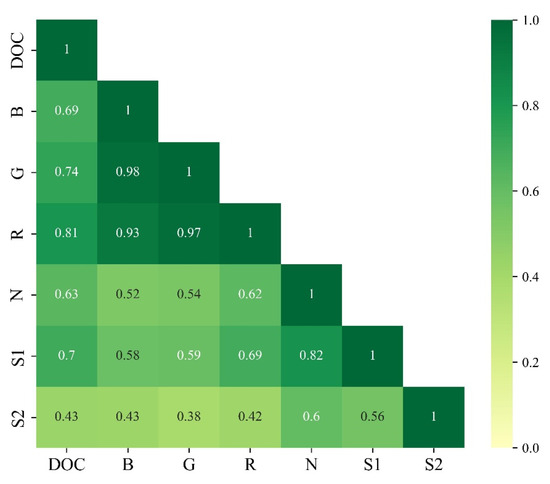
Figure 2.
Pearson correlation between measured surface DOC concentration and spectral data.
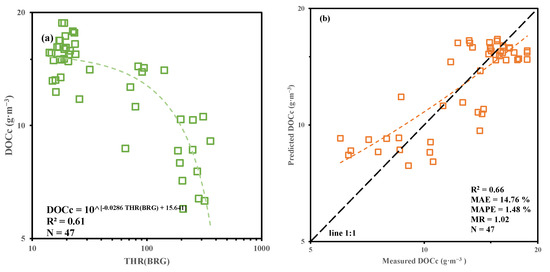
Figure 3.
Pearson correlation of the Surface DOC concentration and band combination (a), and the fitting performance of the derived algorithm (b).
3.2. Vertical Profile DOC Concentration Variation Characteristics in Dianchi
The vertical profile DOCc data for Dianchi obtained from three measurements are shown in Table 3. We further calculated the CV of four indices to quantitatively characterize the variation differences of different profiles in the same index. The concentration variation within a single vertical profile is quite pronounced, with variations in the coefficient of variation (CV) and water column concentration difference (WCCD) reaching 101.40% and 91.30%, respectively. However, the mean residence time (MRD) and concentration profile (CP) variations across all profiles remain relatively low (MRD = 3.00%, CP = 15.77%), indicating that DOCc in different vertical profiles of Dianchi may follow a similar pattern of change. Statistical results from different months also show that the vertical DOCc in Dianchi generally maintains characteristics of large variation in CV and WCCD, while MRD and CP exhibit lower variations. Notably, all profiles have CP > 1, indicating that the vertical DOCc variations follow a non-uniform distribution. Fitting of the vertical DOCc profiles (n = 16) to Gaussian, exponential, and power-law functions reveals that the Gaussian function provides the best fit (n = 9). The number of profiles best fit by exponential and power-law functions are three and four, respectively. Considering that exponential and power-law functions can be transformed into Gaussian functions, this study uses the Gaussian function as the fitting function for vertical DOC concentration changes in Dianchi. The specific parameters of the Gaussian function for each pixel (each vertical profile) are related to surface concentration. The parameters μ and σ of the Gaussian function are fitted using the surface concentration data from the 16 profiles. The parameters for the Gaussian function used to characterize vertical concentration changes are calibrated based on the retrieved surface concentrations. The calibrated Gaussian function is then used for subsequent storage calculations.
Table 3.
Statistical descriptors of DOC concentration profiles in Dianchi.
To assess whether the measured DOCs in Dianchi satisfy assumptions (2) and (3) of the storage estimation, we integrate the measured DOCc to obtain DOCs at different depths, as illustrated in Figure 4. Since the measurements start from 0.5 m below the water surface, the DOCc variation in the 0–0.5 m range is considered uniform. To better explore the relationship between measured DOCs at different depths and surface DOCc, linear interpolation of DOCc with a 0.25 m interval is performed, ensuring that the integral results between adjacent measurement points remain unchanged. Figure 4a shows that DOCs at different depths exhibit a linear relationship with surface DOCc (R2 > 0.9), indicating that the measured vertical data meet the assumptions required for storage estimation.
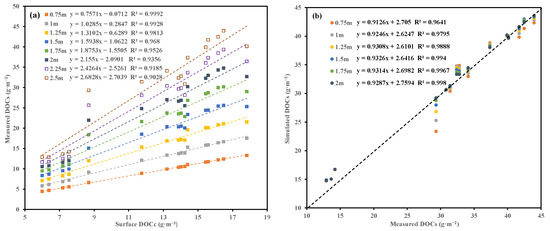
Figure 4.
Surface DOC concentration vs. simulated DOC storage above different depths (a); simulated whole vertical DOC storage vs. measured DOC storage when the mixed layer is set below different depths (b).
Similarly, to determine the starting depth of the mixed layer with a 0.25 m interval, the value of “0.75 m” on the vertical axis in Figure 5a represents the mixed layer starting from 0.75 m below the water surface. The total error in Figure 5b is the sum of the absolute errors for all measurement points under each depth scenario. When the mixed layer is set at 0.75 m, the maximum error occurs at the 12th station, reaching −5.95 g·m−2. Although the maximum error for DOCs estimation at station 14 is 2.54 g·m−2 when the mixed layer is set at 2 m, the total error is only 11.96 g·m−2 in 2.0 m (Figure 5b), which is the smallest among all scenarios (Figure 4b). All depth scenarios show significant overestimation errors at stations 13 to 16, with errors greater than 1.3 g·m−2. In contrast, for the remaining stations, the DOCs estimation errors for the 2 m mixed layer depth scenario remain at very low levels, with an average error of less than 0.12 g·m−2. Therefore, based on the vertical DOCc data measured in this study, the mixed layer for Dianchi can be set at a depth of 2 m below the water surface according to assumption (2).
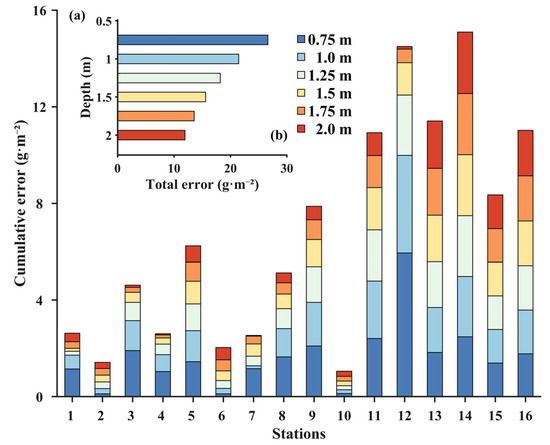
Figure 5.
Error between measured DOCs and fitted DOCs of mixed layers at different depths across different sites (a), total error of mixed layer calculation at different depths (b).
3.3. DOC Storage Estimation for Dianchi
Based on the relationship between estimated DOCs at different depths and surface DOCc, coefficients for Formulas (2)–(4) were determined, as shown in Figure 6. Both the slope and intercept have a very high correlation with depth (R2 > 0.98). Therefore, the parameters for the Formulas (2) and (3) can be set as = 1.1088 and = −0.0732; the parameters for the Formulas (2)–(4) can be set as = −0.0968, = −1.3288, and = 1.0818. Figure 6 shows that the surface DOCc model and vertical DOCs model developed using the leave-one-out method were applied to all observed vertical profiles for DOCs retrieval. Figure 7 shows that the performance indicators of the retrieval are satisfactory (R2 = 0.88, MAPE = 19.28%, and MAE = 17.80%). The vertical model generally underestimates DOCs for all profiles (MR = 0.96), with overestimation for lower concentrations (<30 g·m−2) and underestimation for higher concentrations (>50 g·m−2).
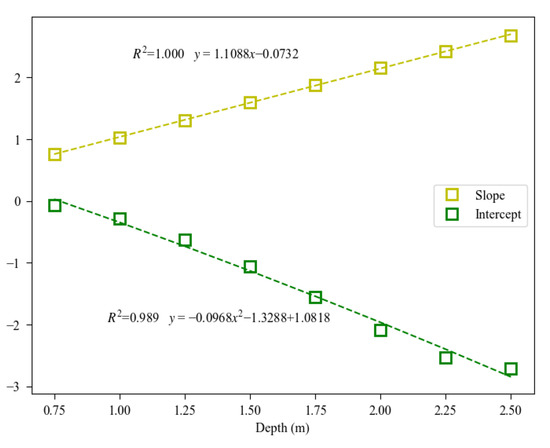
Figure 6.
The fitting relationship between slope and intercept with water depth in DOCs retrieval model.
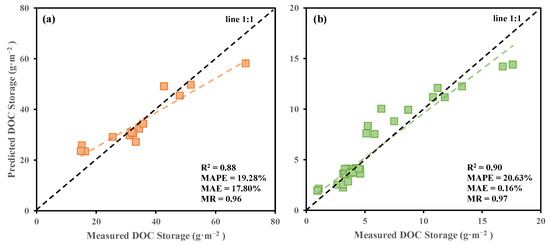
Figure 7.
The fitting results of the DOC storage retrieval model are presented in (a) with overlaid upper layer DOC storage and in (b) without overlaid upper layer DOC storage.
3.4. Spatiotemporal Variation Characteristics of DOC Storage
Based on the developed surface DOCc and vertical DOCs retrieval model, DOCs in Dianchi were inverted using MOD09GA images from 2000 to 2023. The results of DOCc (Figure 8) and DOCs (Figure 9) are aggregated on a monthly basis. The analysis reveals distinct spatial distribution differences in DOCs across various time periods, with a consistent spatial feature of “high central storage”. From April onward, large areas of high DOC storage (80–100 g·m−2) start to appear in the central part of the Dianchi. In May, these high-storage areas continue to expand, and regions with extremely high storage (>120 g·m−2) begin to form. By July, the area with high storage reaches its maximum and remains significant through September, with the extent of extremely high storage also peaking in September. From October to November, the extent of high and extremely high storage slightly decrease, but these areas still represent the largest proportion. Starting in December, there is a rapid reduction in both high and extremely high storage areas, reaching their minimum by March. It is noteworthy that the southern part of the Dianchi also exhibits a similar spatial variation pattern from July to December, with consistent high and extremely high DOCs features.
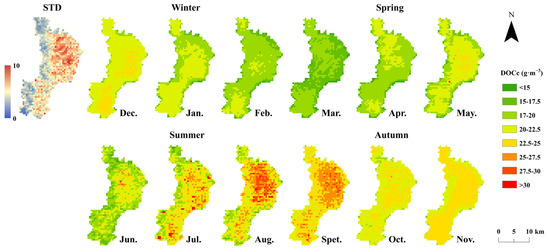
Figure 8.
Spatial variation of monthly average DOC concentration in Lake Dianchi Waihai from 2000 to 2023.
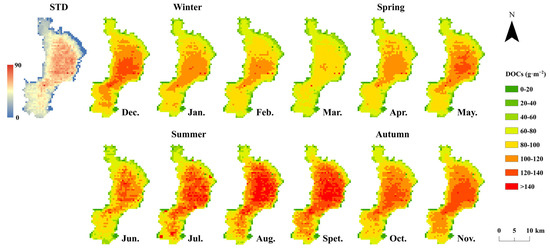
Figure 9.
Spatial variation of monthly average DOC storage in Lake Dianchi from 2000 to 2023, categorized into low storage (0–80 g·m−2), medium storage (80–100 g·m−2), high storage (100–120 g·m−2), and ultra-high storage (>120 g·m−2).
As shown in Figure 10, the DOC storage in the Waihai of Dianchi Lake began to decline from 2002 (93.9 g·m−2), reached the lowest point (72.5 g·m−2) in 2010, and then gradually increased to the highest value (105.8 g·m−2) in 2022. Generally, the average annual DOC storage are 86.8 g·m−2, showing no significant changing trend. To explore the temporal variation of DOCs in Dianchi, seasonal mean values for different years were analyzed (with winter including January and February of the current year and December of the previous year), as shown in Table 4 and Figure 9. The analysis reveals significant seasonal differences in DOCs. From the seasonal mean values between 2000 and 2023, it is evident that summer and autumn have higher mean DOCs (86.2 and 96.8 g·m−2, respectively) compared to spring and winter. However, winter exhibits the widest range and highest standard deviation of DOCs (55.0–126.4 g·m−2, with a standard deviation of 15.3 g·m−2). The M-K trend analysis indicates a significantly increasing trend in DOCs during autumn and winter. The line charts also show clear seasonal variations, with DOCs in summer and autumn generally exceeding those in spring and winter. Autumn DOCs are consistently higher than the annual average throughout the period, while spring DOCs are generally lower than the annual average, except in 2011. Summer DOCs fluctuate around the annual average but ultimately tend to be below it, whereas winter DOCs exhibit a contrasting trend. Notably, since 2009, summer DOCs have shown considerable variability, and autumn DOCs have aligned with summer trends since 2013. The M-K analysis shows a significantly increasing trend in winter DOCs, with a marked rise after reaching a low in 2006, even peaking in 2022. Figure 10 highlights periods with a coefficient of variation of seasonal DOCs less than 10% within consecutive years. During the periods of 2002–2005 and 2017–2020, summer and winter DOCs were quite similar, while autumn DOCs were consistently higher than spring DOCs. Overall, the temporal variation of DOCs in Dianchi displays a pattern of “high levels in summer and autumn, with a significant increase in winter, eventually surpassing summer levels”.
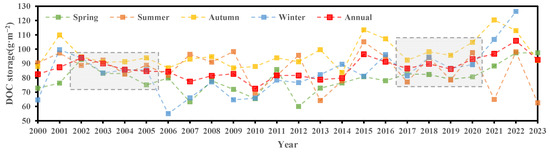
Figure 10.
Temporal variation of seasonal average DOC storage in Dianchi, with the grey dashed box indicating years where the coefficient of variation of seasonal averages was below 10%.
Table 4.
Statistics of DOC Storage in different seasons and trend discrimination.
4. Discussion
This study developed a surface DOC concentration retrieval model for Dianchi using daily MODIS remote sensing images and measured surface DOCc data. The advantage of this model lies in that the storage retrieval in the second step is calculated based on the surface DOCc results of the first step. However, the measured data volume is an important factor limiting the direct retrieval of surface DOCc, a non-optically active substance. Under the premise of clarifying the vertical concentration distribution of the lake, it is very feasible to replace the first step of this model with a more excellent surface DOCc retrieval algorithm. The model demonstrated a high degree of accuracy in estimating DOCc, revealing distinct spatial and temporal variations in DOCs across the lake. The analysis showed that DOCc in Dianchi exhibit a pronounced spatial pattern, with the highest concentrations typically found in the central areas. Seasonal trends indicate that summer and autumn generally have higher DOCs compared to spring and winter. The results highlight a significant increase in DOCs during autumn and winter, particularly after a low period in 2006, suggesting that seasonal factors and climatic conditions play a critical role in DOC dynamics. The surface DOCc retrieval model, based on MODIS imagery, was effective in correlating with measured DOC data. The vertical DOCs model also performed well, reflecting the surface DOCc and vertical profiles accurately. At present, there have been studies that have conducted remote sensing inversion of DOC reserves in shallow lakes like Taihu Lake [5]. The changes in the vertical DOC concentration in these lakes are significantly different from those in typical deep lakes like Dianchi Lake. This also indicates that the generalization ability of the DOC storage model developed based on deep lakes in this study needs to be further verified in other nearshore shallow-water environments. Similarly, in the future, more and more appropriate vertical concentration fitting functions can be used for comparison to improve the accuracy of vertical retrieval.
However, the study acknowledges the need for further refinement, including more extensive datasets and consideration of additional environmental factors, to enhance the model’s accuracy and provide a deeper understanding of DOC changes in response to climate and human activities. Future research should focus on integrating more detailed data and examining the impacts of environmental changes on DOCs in Dianchi.
To investigate the key factors influencing DOCs in Dianchi, we calculated the correlation coefficients between DOCs and major natural and anthropogenic factors for the annual average values of DOCs (Figure 11). Among the natural factors, water temperature (T) had the weakest correlation with DOCs (r < 0.01), while precipitation (P) and wind speed (WS) showed positive and negative correlations, respectively (r = 0.47 and r = −0.54). Anthropogenic factors were categorized into nutrient inputs (NANI and NAPI) and land use types. Except for urban land, which showed a positive correlation with DOCs, all other land use types were negatively correlated. The top three influential anthropogenic factors were forest land (r = −0.68), NAPI (r = −0.45), and NANI (r = −0.40). Factors that exhibited a significant correlation with the annual average DOCs in Dianchi included precipitation, wind speed, NAPI, and forest land. Both natural and anthropogenic factors each contributed half to the significant correlations observed. Precipitation showed a significant positive correlation with DOCs, while the remaining factors showed significant negative correlations.
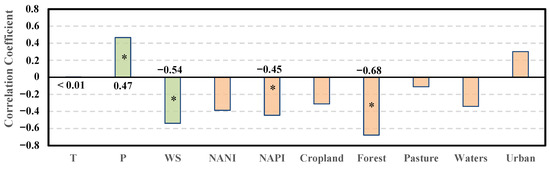
Figure 11.
The correlation coefficients between driving factors and the annual average DOCs in Dianchi. Green represents natural factors, while orange represents anthropogenic factors, and “*” represents significance.
Temperature, precipitation, and wind speed are significant factors influencing the variation in DOC storage in Dianchi, primarily through their indirect effects on the growth of phytoplankton in eutrophic lakes [38,39]. The interannual variation in water temperature in Dianchi is minimal (n = 20, Mean = 16.1 ± 0.4 °C), showing very low correlation with the annual average DOCs (r < 0.01). However, the monthly water temperature variation is substantial (Min = 4.2 °C, Max = 22.5 °C, and Mean = 16.1 ± 4.2 °C), with a significant positive correlation with DOCs on a monthly scale (p < 0.05). Higher water temperatures can promote the proliferation of blue-green algae [39,40]. From 2000 to 2022, the monthly average water temperature in Dianchi was 16.1 ± 4.2 °C, with months where the average temperature exceeded 20 °C accounting for 23.5% of the time (mainly in summer, with a few instances in spring and autumn). The average water temperatures for spring, summer, autumn, and winter were 17.5 ± 0.8 °C, 20.6 ± 0.4 °C, 15.9 ± 0.4 °C, and 10.3 ± 0.7 °C, respectively. The pronounced seasonal temperature differences result in blue-green algae blooms predominantly occurring in summer and autumn, with a corresponding noticeable increase in DOCs. In contrast, winter blooms are less severe, leading to a decrease in DOCs, but high-concentration areas still persist until March. Precipitation, particularly heavy rainfall, affects lake eutrophication levels [40]. During the rainy season, monthly average precipitation in Dianchi is significantly higher than the annual average, increasing nutrient inflows from rivers and causing airborne pollutants to settle into the lake, providing abundant resources for algae [39,41]. Increased precipitation can also raise relative humidity and reduce evaporation, indirectly increasing lake surface temperatures [42], which explains why precipitation is the most significantly correlated natural factor, despite its potential to dilute the water body to some extent. Wind speed is also a notable factor affecting DOCs in Dianchi. The monthly average wind speed increased from 1.48 m·s−1 in 2000 to 2.96 m·s−1 in 2010 and has since stabilized at 2.39 m·s−1. Although wind speed has increased, it remains below the warning threshold (<4.5 m·s−1) [13]. Persistent low wind speeds can accelerate the vertical migration and expansion of blue-green algae blooms, affecting the vertical distribution of DOCs in Dianchi, which aligns with findings in the literature [24,43].
NANI and NAPI, both anthropogenic factors, show a significant negative correlation with the annual average DOCs in Dianchi, with NAPI having a more pronounced effect. Excessive nutrient inputs increase the concentrations of total nitrogen and total phosphorus in the lake, leading to eutrophication and providing nutrients for the growth of blue-green algae [40,44]. Between 2000 and 2010, both NANI and NAPI showed a gradual increase, with average values of 10,945 and 2645 kg·km−2, respectively. By 2010, they reached their peak annual averages of 12,580 and 3087 kg·km−2. From 2011 to 2020, both NANI and NAPI declined to varying degrees and then stabilized. Despite reductions of 9.6% and 34.8% from 2010 levels, these nutrient loads still exceed the critical nutrient load for Dianchi [45]. Phosphorus remains a key factor in algal blooms, and Dianchi continues to face high phosphorus pressure [46]. Similarly, the proportion of forested land in the Dianchi watershed increased and then decreased to 34% by 2010. In contrast, urban land area increased from 9.8% to 22.3%. Rapid urbanization and industrialization in the watershed have significantly increased the release of DOC from terrestrial plant leaves into the lake, directly contributing to higher DOCs in Dianchi [46]. The decreasing forest area results in reduced DOC release from terrestrial plants. However, forests can intercept pollutants such as nitrogen and phosphorus, reducing nutrient loads and alleviating lake eutrophication, which indirectly suppresses increases in lake DOCs [47]. Additionally, forests can influence local conditions such as near-surface temperatures, inflow temperatures, and suburban wind speeds, which in turn affect lake eutrophication and DOC levels [48,49].
The direct and indirect effects of the aforementioned factors on Dianchi DOCs are present simultaneously, and there are also interactions between these factors. Due to limitations in the data available, this study did not explore the impact of certain factors on the monthly average DOCs in greater depth. Additionally, there is a significant spatial variation in DOCs across the lake (as shown in Figure 9), and the land use types in Dianchi vary considerably, with urban areas dominating the north and agricultural areas predominant in the south. Future research could delve deeper into the driving factors for different sub-regions to better understand these spatial variations and their impacts.
5. Conclusions
This study developed a leave-one-out cross-validation-based DOCc retrieval model and a linear fitting algorithm for DOCs based on measured vertical DOCc data to estimate the DOCs of Dianchi. The accuracy validation shows that the algorithm is effective for remotely sensing DOCs in Dianchi. The main conclusions drawn from this study are as follows:
- (1)
- The vertical DOCc variation in Dianchi can be accurately modeled using a Gaussian function, and concentration changes below a depth of 2 m can be considered uniform. DOCs at different depths show a linear relationship with surface DOCc. The retrieval method for DOCs based on result-oriented conditions demonstrates good accuracy.
- (2)
- The spatial distribution of DOCs in Dianchi from 2000 to 2023 shows a pattern of “high in the center and low around the edges”. The temporal variation of DOCs follows a “high in summer and autumn, low in spring and winter, but with significant winter increases eventually exceeding summer levels” trend.
- (3)
- Annual average DOCs in Dianchi are significantly positively correlated with precipitation and significantly negatively correlated with wind speed, NAPI, and forest land. On a monthly scale, DOCs are significantly positively correlated with monthly mean water temperature. Precipitation and forest land are identified as the most important natural and anthropogenic factors affecting DOCs, respectively.
Author Contributions
Y.Y.: Writing—original draft, Software, and Methodology. W.G.: Writing—review and editing and Project administration. Y.Z.: Supervision and Funding acquisition. All authors have read and agreed to the published version of the manuscript.
Funding
This work was supported by the National Key Research and Development Program of China (Grant No. 2021YFC3201004).
Data Availability Statement
The original image data support the findings of this study are openly available on Google Earth Engine. This study’s training and testing data and code can be obtained through my email, yann4you@163.com.
Conflicts of Interest
The authors declare that they have no known competing financial interests or personal relationships that could have appeared to influence the work reported in this paper.
References
- Stets, E.G.; Striegl, R.G.; Aiken, G.R.; Rosenberry, D.O.; Winter, T.C. Hydrologic support of carbon dioxide flux revealed by whole-lake carbon budgets. J. Geophys. Res. Biogeosci. 2009, 114, G000783. [Google Scholar] [CrossRef]
- Liu, D.; Sun, Z.; Shen, M.; Tian, L.; Yu, S.; Jiang, X.; Duan, H. Three-dimensional observations of particulate organic carbon in shallow eutrophic lakes from space. Water Res. 2023, 229, 119519. [Google Scholar] [CrossRef]
- Harkort, L.; Duan, Z. Estimation of dissolved organic carbon from inland waters at a large scale using satellite data and machine learning methods. Water Res. 2023, 229, 119478. [Google Scholar] [CrossRef]
- Liu, D.; Du, Y.; Yu, S.; Luo, J.; Duan, H. Human activities determine quantity and composition of dissolved organic matter in lakes along the Yangtze River. Water Res. 2020, 168, 115132. [Google Scholar] [CrossRef]
- Liu, D.; Yu, S.; Xiao, Q.; Qi, T.; Duan, H. Satellite estimation of dissolved organic carbon in eutrophic Lake, Taihu, China. Remote Sens. Environ. 2021, 264, 112572. [Google Scholar] [CrossRef]
- Cardille, J.A.; Leguet, J.-B.; del Giorgio, P. Remote sensing of lake CDOM using noncontemporaneous field data. Can. J. Remote Sens. 2013, 39, 118–126. [Google Scholar] [CrossRef]
- Chen, J.; Zhu, W.; Tian, Y.Q.; Yu, Q. Monitoring dissolved organic carbon by combining, Landsat-8.; Sentinel-2 satellites: Case study in Saginaw River estuary Lake Huron. Sci. Total Environ. 2020, 718, 137374. [Google Scholar] [CrossRef]
- Pan, X.; Wong, G.T. An improved algorithm for remotely sensing marine dissolved organic carbon: Climatology in the northern South China Sea shelf-sea and adjacent waters. Deep Sea Res. Part II Top. Stud. Oceanogr. 2015, 117, 131–142. [Google Scholar] [CrossRef]
- Qu, X.; Xie, L.; Lin, Y.; Bai, Y.; Zhu, Y.; Xie, F.; Giesy, J.P.; Wu, F. Quantitative qualitative characteristics of dissolved organic matter from eight dominant aquatic macrophytes in Lake, Dianchi, China. Environ. Sci. Pollut. Res. 2013, 20, 7413–7423. [Google Scholar] [CrossRef]
- Qi, L.; Hu, C.; Duan, H.; Zhang, Y.; Ma, R. Influence of Particle Composition on Remote Sensing Reflectance MERIS Maximum Chlorophyll Index Algorithm: Examples from Taihu Lake Chaohu Lake. IEEE Geosci. Remote Sens. Lett. 2015, 12, 1170–1174. [Google Scholar]
- Kong, H.; Lu, Y.; Dong, X.; Zeng, S. Quantification of the Coordination Degree between Dianchi Lake Protection Watershed Social-Economic Development: A Scenario-Based Analysis. Sustainability 2021, 13, 116. [Google Scholar] [CrossRef]
- Duan, Z.; Wang, M.; Chang, X.; Gao, W. Response of river-lake hydrologic regimes to local climate change in the Yunnan-Guizhou Plateau region, China. Reg. Environ. Change 2020, 20, 122. [Google Scholar] [CrossRef]
- Zhang, Y.; Loiselle, S.; Shi, K.; Han, T.; Zhang, M.; Hu, M.; Jing, Y.; Lai, L.; Zhan, P. Wind Effects for Floating Algae Dynamics in Eutrophic Lakes. Remote Sens. 2021, 13, 800. [Google Scholar] [CrossRef]
- Xue, K.; Zhang, Y.; Duan, H.; Ma, R.; Loiselle, S.; Zhang, M. A Remote Sensing Approach to Estimate Vertical Profile Classes of Phytoplankton in a Eutrophic Lake. Remote Sens. 2015, 7, 14403–14427. [Google Scholar] [CrossRef]
- Xue, K.; Zhang, Y.; Ma, R.; Duan, H. An approach to correct the effects of phytoplankton vertical nonuniform distribution on remote sensing reflectance of cyanobacterial bloom waters. Limnol. Oceanogr. Methods 2017, 15, 302–319. [Google Scholar] [CrossRef]
- Bi, S.; Li, Y.; Lyu, H.; Mu, M.; Xu, J.; Lei, S.; Miao, S.; Hong, T.; Zhou, L. Quantifying Spatiotemporal Dynamics of the Column-Integrated Algal Biomass in Nonbloom Conditions Based on OLCI Data: ACase Study of Lake Dianchi China. IEEE Trans. Geosci. Remote Sens. 2019, 57, 7447–7459. [Google Scholar] [CrossRef]
- Qi, L.; Hu, C.; Visser, P.M.; Ma, R. Diurnal changes of cyanobacteria blooms in Taihu Lake as derived from GOCI observations. Limnol. Oceanogr. 2018, 63, 1711–1726. [Google Scholar] [CrossRef]
- Uitz, J.; Claustre, H.; Morel, A.; Hooker, S.B. Vertical distribution of phytoplankton communities in open ocean: An assessment based on surface chlorophyll. J. Geophys. Res. Ocean. 2006, 111, C08005. [Google Scholar] [CrossRef]
- Ardyna, M.; Babin, M.; Gosselin, M.; Devred, E.; Bélanger, S.; Matsuoka, A.; Tremblay, J. Parameterization of vertical chlorophyll a in the Arctic Ocean: Impact of the subsurface chlorophyll maximum on regional seasonal annual primary production estimates. Biogeosciences 2013, 10, 4383–4404. [Google Scholar] [CrossRef]
- Dongshao, W.; Min, C.; Zhongzhao, D.; Yuan, Z.; Wei, G. The variation and source-sink effect of total phosphorus flux input and output of Lake Dianchi during 2001–2018. J. Lake Sci. 2023, 35, 1306–1319. [Google Scholar] [CrossRef]
- Kediao, H.; Wei, G.; Changqun, D.; Yuangao, Z.; Ying, P.; Chang’E, L.; Wei, Z.; Guiying, Y. Water level variation and its driving factors in Lake Dianchi, Fuxian and Yangzong during 1988–2015. J. Lake Sci. 2019, 31, 1379–1390. [Google Scholar] [CrossRef]
- Duan, Z.; Gao, W.; Cheng, G.; Zhang, Y.; Chang, X. Warming surface Lake heatwaves as key drivers to harmful algal Blooms: Acase study of Lake Dianchi China. J. Hydrol. 2024, 632, 130971. [Google Scholar] [CrossRef]
- Wu, D.; Cao, M.; Gao, W.; Duan, Z.; Zhang, Y. Simulating critical nutrient loadings of regime shift in the shallow plateau Lake Dianchi. Ecol. Model. 2024, 491, 110689. [Google Scholar] [CrossRef]
- Ma, J.; He, F.; Qi, T.; Sun, Z.; Shen, M.; Cao, Z.; Meng, D.; Duan, H.; Luo, J. Thirty-Four-Year Record (1987–2021) of the Spatiotemporal Dynamics of Algal Blooms in Lake Dianchi from Multi-Source Remote Sensing Insights. Remote Sens. 2022, 14, 4000. [Google Scholar] [CrossRef]
- Du, Y.; Zhang, Y.; Ling, F.; Wang, Q.; Li, W.; Li, X. Water bodies’ mapping from sentinel-2 imagery with modified normalized difference water index at 10-m spatial resolution produced by sharpening the SWIR band. Remote Sens. 2016, 8, 354. [Google Scholar] [CrossRef]
- Zeng, S.; Du, C.; Li, Y.; Lyu, H.; Dong, X.; Lei, S.; Li, J.; Wang, H. Monitoring the particulate phosphorus concentration of inland waters on the Yangtze Plain and understanding its relationship with driving factors based on OLCI data. Sci. Total Environ. 2022, 809, 151992. [Google Scholar] [CrossRef]
- Kayastha, P.; Dzialowski, A.R.; Stoodley, S.H.; Wagner, K.L.; Mansaray, A.S. Effect of Time Window on Satellite and Ground-Based Data for Estimating Chlorophyll-a in Reservoirs. Remote Sens. 2022, 14, 846. [Google Scholar] [CrossRef]
- Ha, N.; Koike, K.; Nhuan, M.T.; Canh, B.D.; Thao, N.T.P.; Parsons, M. Landsat 8/OLITwo Bands Ratio Algorithm for Chlorophyll-AConcentration Mapping in Hypertrophic Waters: An Application to West Lake in Hanoi (Vietnam). IEEE J. Sel. Top. Appl. Earth Obs. Remote Sens. 2017, 10, 4919–4929. [Google Scholar] [CrossRef]
- Zhang, T.; Huang, M.; Wang, Z. Estimation of chlorophyll-a Concentration of lakes based on SVM algorithm and Landsat 8 OLI images. Environ. Sci. Pollut. Res. 2020, 27, 14977–14990. [Google Scholar] [CrossRef]
- Wong, T.-T. Performance evaluation of classification algorithms by k-fold and leave-one-out cross validation. Pattern Recognit. 2015, 48, 2839–2846. [Google Scholar] [CrossRef]
- HJ/T 91-2002; Technical Specifications Requirements for Monitoring of Surface Water and Waste Water. Code of China: Beijing, China, 2002.
- Frolov, S.; Ryan, J.P.; Chavez, F.P. Predicting euphotic-depth-integrated chlorophyll- a from discrete-depth and satellite-observable chlorophyll-a off central California. J. Geophys. Res. Ocean. 2012, 117, 2011jc007322. [Google Scholar] [CrossRef]
- Li, J.; Zhang, Y.; Ma, R.; Duan, H.; Loiselle, S.; Xue, K. Liang Satellite-Based Estimation of Column-Integrated Algal Biomass in Nonalgae Bloom Conditions: A Case Study of Lake Chaohu China. IEEE J. Sel. Top. Appl. Earth Obs. Remote Sens. 2017, 10, 450–462. [Google Scholar] [CrossRef]
- Rui, Z.; Zhen, W.; Lei, Z.; Yihui, C.; Yanhong, Y.; Yong, L. Nutrient cycling flux of Lake Dianchi: A three-dimensional water quality modelling approach. J. Lake Sci. 2017, 29, 819–826. [Google Scholar] [CrossRef]
- Wade, M.J.; Fitzpatrick, C.L.; Lively, C.M. 50-year anniversary of Lloyd’s “mean crowding”: Ideas on patchy distributions. J. Anim. Ecol. 2018, 87, 1221–1226. [Google Scholar] [CrossRef]
- Ma, J.; Loiselle, S.; Cao, Z.; Qi, T.; Shen, M.; Shen, J.; Song, K.; Duan, H. Unbalanced impacts of nature nurture factors on the phenology area intensity of algal blooms in global large lakes: MODIS observations. Sci. Total Environ. 2023, 880, 163376. [Google Scholar] [CrossRef]
- Wei, G.; Guowei, C.; Chang’An, Y.; Yan, C. Identifying spatiotemporal alteration of nitrogen to phosphorus ratio of Lake Dianchi and its driving forces during 1988–2018. J. Lake Sci. 2021, 33, 64–73. [Google Scholar] [CrossRef]
- Jiang, G.; Ma, R.; Loiselle, S.A.; Duan, H.; Su, W.; Cai, W.; Huang, C.; Yang, J.; Yu, W. Remote sensing of particulate organic carbon dynamics in a eutrophic lake (Taihu Lake, China). Sci. Total. Environ. 2015, 532, 245–254. [Google Scholar] [CrossRef]
- Jing, Y.; Zhang, Y.; Hu, M.; Chu, Q.; Ma, R. MODIS-Satellite-Based Analysis of Long-Term Temporal-Spatial Dynamics and Drivers of Algal Blooms in a Plateau Lake Dianchi, China. Remote Sens. 2019, 11, 2582. [Google Scholar] [CrossRef]
- Xu, H.; Paerl, H.W.; Qin, B.; Zhu, G.; Gaoa, G. Nitrogen phosphorus inputs control phytoplankton growth in eutrophic Lake, Taihu, China. Limnol. Oceanogr. 2010, 55, 420–432. [Google Scholar] [CrossRef]
- Zhang, Y.; van Dijk, M.A.; Liu, M.; Zhu, G.; Qin, B. The contribution of phytoplankton degradation to chromophoric dissolved organic matter (CDOM) in eutrophic shallow lakes: Field and experimental evidence. Water Res. 2009, 43, 4685–4697. [Google Scholar] [CrossRef]
- Wang, Q.; Sun, L.; Zhu, Y.; Wang, S.; Duan, C.; Yang, C.; Zhang, Y.; Liu, D.; Zhao, L.; Tang, J. Hysteresis effects of meteorological variation-induced algal blooms: Acase study based on satellite-observed data from Dianchi Lake China (1988–2020). Sci. Total Environ. 2022, 812, 152558. [Google Scholar] [CrossRef]
- Wang, S.; Zhang, X.; Wang, C.; Chen, N. Multivariable integrated risk assessment for cyanobacterial blooms in eutrophic lakes and its spatiotemporal characteristics. Water Res. 2023, 228, 119367. [Google Scholar] [CrossRef] [PubMed]
- Feng, L.; Hou, X.; Zheng, Y. Monitoring and understanding the water transparency changes of fifty large lakes on the Yangtze Plain based on long-term MODIS observations. Remote Sens. Environ. 2019, 221, 675–686. [Google Scholar] [CrossRef]
- Li, X.; Janssen, A.B.; de Klein, J.J.; Kroeze, C.; Strokal, M.; Ma, L.; Zheng, Y. Modeling nutrients in Lake Dianchi (China) and its watershed. Agric. Water Manag. 2019, 212, 48–59. [Google Scholar] [CrossRef]
- Yan, K.; Yuan, Z.; Goldberg, S.; Gao, W.; Ostermann, A.; Xu, J.; Xu, J.; Zhang, F.; Elser, J. Phosphorus mitigation remains critical in water protection: Areview meta-analysis from one of China’s most eutrophicated lakes. Sci. Total Environ. 2019, 689, 1336–1347. [Google Scholar] [CrossRef]
- Lee, S.W.; Hwang, S.J.; Lee, S.B.; Hwang, H.S.; Sung, H.C. Landscape ecological approach to the relationships of land use patterns in watersheds to water quality characteristics. Landsc. Urban Plan. 2009, 92, 80–89. [Google Scholar] [CrossRef]
- Tang, L.; Yang, K.; Shang, C.; Peng, Z.; Luo, Y. Spatial impact of urban expansion on lake surface water temperature based on the perspective of watershed scale. Front. Environ. Sci. 2022, 10, 991502. [Google Scholar] [CrossRef]
- Li, Y.; Tao, J.; Zhang, Y.; Shi, K.; Chang, J.; Pan, M.; Song, L.; Jeppesen, E.; Zhou, Q. Urbanization shifts long-term phenology and severity of phytoplankton blooms in an urban lake through different pathways. Glob. Change Biol. 2023, 29, 4983–4999. [Google Scholar] [CrossRef]
Disclaimer/Publisher’s Note: The statements, opinions and data contained in all publications are solely those of the individual author(s) and contributor(s) and not of MDPI and/or the editor(s). MDPI and/or the editor(s) disclaim responsibility for any injury to people or property resulting from any ideas, methods, instructions or products referred to in the content. |
© 2025 by the authors. Licensee MDPI, Basel, Switzerland. This article is an open access article distributed under the terms and conditions of the Creative Commons Attribution (CC BY) license (https://creativecommons.org/licenses/by/4.0/).