1. Introduction
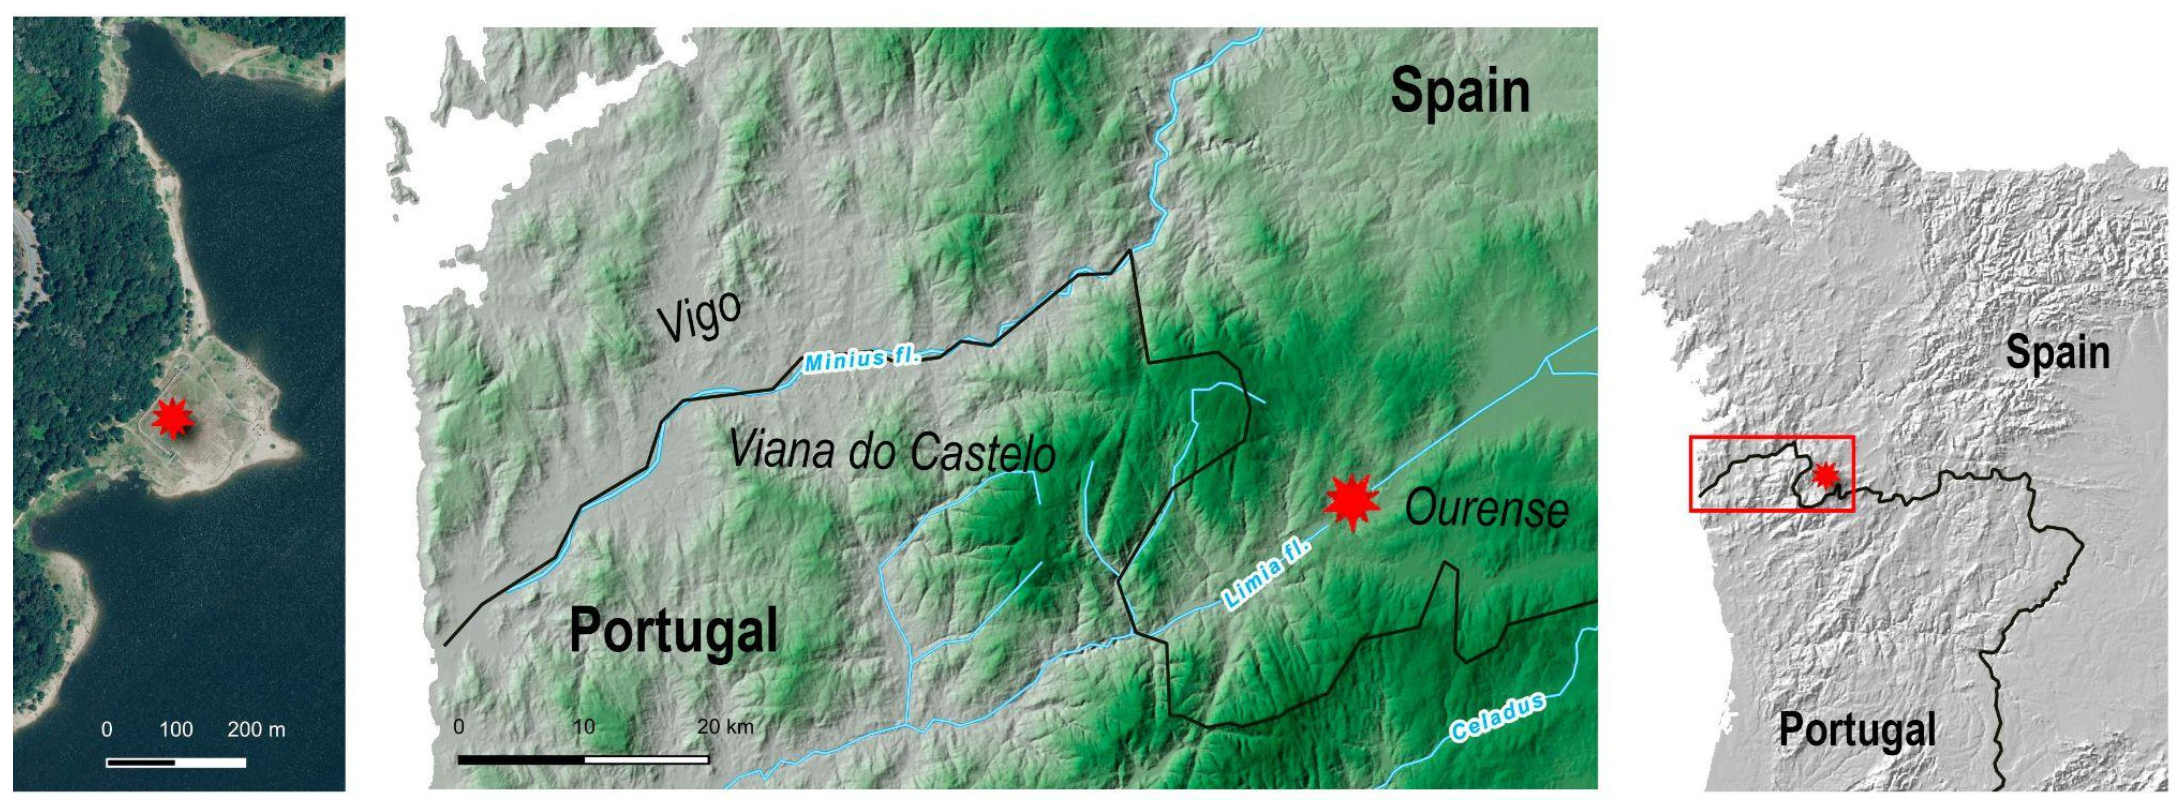
This paper details a geophysical prospection campaign at the Roman fort of
Aquis Querquenis (Bande, Ourense, Spain), located within the Lima river valley (
Figure 1). The primary objective was to map and characterise buried architectural features in the unexcavated areas of the fort, enabling a reconstruction of its full internal organisation.
Aquis Querquennis, dating from the second half of the first to the first half of the second century AD, served as a key strategic point along the Via XVIII (also called Via Nova) of the Antonine Itinerary. This major Roman road linked
Bracara Augusta (nowadays Braga in northern Portugal) to
Asturica Augusta (nowadays Astorga in Northwest Spain), passing through the Gerês–Xurés Mountains, an area of significant Roman gold mining activity.
This non-invasive geophysical survey supplements existing archaeological data. By identifying subsurface anomalies associated with disturbed elements and structures, integrating geophysical results and archaeological information, this study aims to generate robust scientific insights for further in-depth site analysis. The survey of this type of Roman fortification is rather unusual in the Iberian NW, chiefly because geophysical efforts have been oriented toward ephemeral examples. This situation is related to the overall lack of research in those ephemeral contexts and the need to incorporate them into the historical–archaeological debates about the Roman conquest. Among such research, we could mention several relevant cases such as Alto da Raia [
1], where a magnetometry survey has been combined with GPR (ground-penetrating radar) and high-resolution LiDAR data (Light Detection and Ranging).
2. Aquis Querquennis
The archaeological complex of
Aquis Querquennis is located between the villages of Portoquintela and O Baño, belonging to the parish of San Xoán do Baño at the end of the municipality of Bande, in the natural region of A Baixa Limia, in the southwest of the province of Ourense (Galicia, Spain) (
Figure 1). It is located on the right bank of the Lima river, occupying a mid-slope location, in the surroundings of thermal springs, which have been used over time for their mineral and medicinal properties, giving rise to the name of the place, which in ancient times was
Aquae Querquennae, changed in the Middle Ages to San Martiño de Calidas and more recently to O Baño. Both the fort and the site of the thermal outcrops are intermittently flooded by the waters of the As Conchas reservoir, built by the FENOSA hydroelectric company in the late 1940s, where the parish church of San Xoán de O Baño used to stand, along with the abbot’s quarters, several houses in the village and a spa building dedicated to the use of medicinal mining waters, from which the ruins can still be seen when the height of the dam drops, usually during the summer and autumn months, thus allowing both archaeological research and tourist use of the site. It was one of the first dams to be built in Galicia, inaugurated by General Francisco Franco to supply electricity to the city of Vigo, which by the middle of the 20th century was beginning to decline as an industrial centre.
The first archaeological interventions carried out at the site were performed by a group of friends led by Florentino López Cuevillas in the 1920s. Several structures were uncovered, one of which has been identified today as a section of the fort wall, but given the brief description offered and the lack of planimetry, it is impossible to determine exactly where the interventions were carried out [
2]. It was in 1975 when Antonio Rodríguez Colmenero began a programme of systematic excavations which have continued intermittently to the present day, uncovering a series of archaeological remains which were initially identified as belonging to the third
mansio of the Via Nova [
3]. As the investigations progressed, the ruins were soon identified as belonging to a military fort which, according to the chronology of the materials found, had been related to the
Legio VII Gemina, either as auxiliary troops or as a detachment of the legion itself. At first, it was hypothesised that it could be
Cohors I Celtiberorum, because its prefect
Gaius Aquilus Novaugustanus appeared making a pact of hospitality in Castromao (Celanova), or
Cohors I Galica, because a signifier of this unit appeared dedicating an altar to the indigenous god
Bandue Veigebreaego preserved in the church of Rairiz da Veiga near the site. However, it was in the archaeological survey of 2004, with the exhumation of the building of the
principia, that a military mark appeared for the first time, stamped on a tegula identified as CIII, referring to
Cohors III, a unit directly dependent on the legion itself [
4].
Today, after 50 years of archaeological excavations, a large part of this military enclosure has been excavated to the top of the bedrock. A series of independent buildings have been identified for troop barracks, infirmaries, granaries, the general barracks and, more recently, the residence of the unit’s superior command, known as the praetorium, articulated around two main axes, the via principalis that crosses the enclosure from north to south and the via praetoria and via decumana heading east–west, interrupted by the building of the principia, which has a typical hypodynamic plan, imitating the classical models that have been built.
As a result of these archaeological interventions, we believe we are looking at the presence of a detachment made up of mixed infantry and cavalry units, configuring a cohors quingenaria equitata, made up of six infantry centurions and four cavalry classes, the former in the western (retentura) and central (latera praetori) parts and the latter in the eastern part (praetentura).
Through the study of the different materials recovered in the various archaeological excavation campaigns, we can affirm that the military fort of
Aquis Querquennis had a short period of occupation from the middle of the reign of Emperor Vespasian, when
Legio VII Gemina was moved, in the year 74–75 AD, from the
Limes Germanicus to the new settlement in
Legio (nowadays León, Spain), until the beginning of the reign of Emperor Hadrian, when
Cohors III abandoned the barracks and set off for a new destination in the newly conquered lands of Dacia (Romania), where marks of this unit were found in the fort of
Porolissum, together with marks of
Legio VII Gemina [
5]. A period of 25–30 years related to the construction of the Via Nova became the base of operations for the military engineers who carried out the work of designing and executing this road, which was inaugurated for the first time in 79–80 AD under Emperor
Titus, as reflected in the different milestones dedicated to this prince [
4].
3. Material and Methods
This geophysical survey campaign employed a combination of GPR and magnetometry to map the subsurface remains of the Roman military fort of Aquis Querquennis. Decades of archaeological excavations have revealed that, while GPR can effectively detect intact stone structures, it is less effective in areas where stone foundations have been looted, leaving only the rock-cut trenches filled with deposits. Consequently, magnetic methods were essential for identifying these features, as well as burnt structures such as kilns or furnaces.
Geological maps from the area (Geode Z1200 Galicia-Trás-os-Montes and MAGNA 1:50k-Lobios) indicate that it is composed of Nebulitic lithostratigraphy with semi-coarse to fine micaceous granulometry. This refers to a specific metamorphic facies characterised by the presence of two micas—typically muscovite and biotite—in medium to medium–fine-grained rocks. This facies indicates intermediate metamorphic conditions, often associated with regional metamorphism in orogenic belts. The grain size and mineral composition reflect the pressure and temperature conditions under which the rocks formed. Zones with nebulitic textures and two-mica facies are typically associated with complex metamorphic and structural histories. These complexities can create variations in magnetic properties, making the zone ideal for detecting magnetic contrasts and mapping subsurface structures [
6].
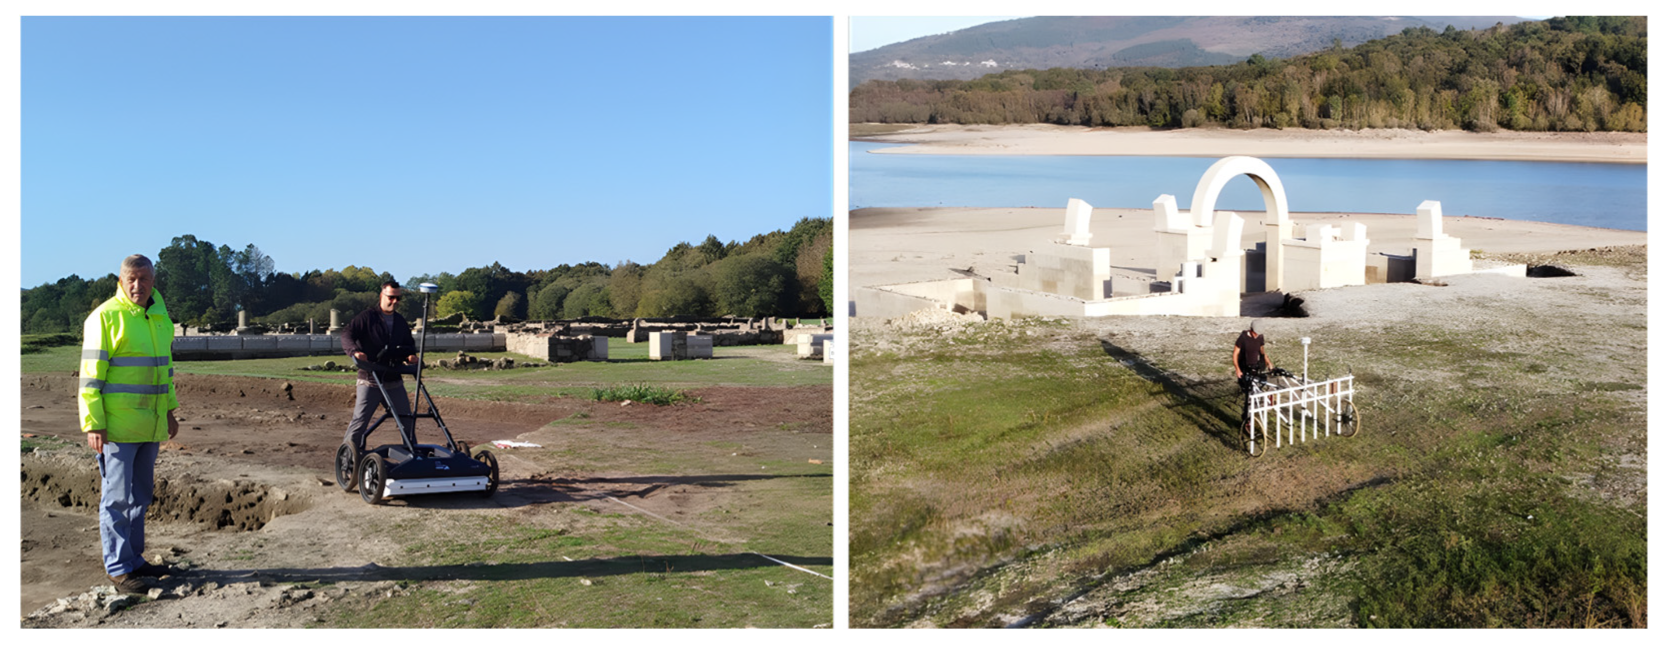
Both GPR and magnetometry surveys were conducted to delineate the layout of the building remains within the defensive walls (
Figure 2). The GPR survey covered 6427 sq. metres, while the magnetometric survey was conducted over 6549 sq. metres. However, the coverage did not overlap totally; thus, the effort of data integration was required for the whole central part of the survey area. This discrepancy was related to the type of terrain, which was more abrupt over the camp’s defences. This integrated approach has proven successful in similar studies of Roman military sites within the Iberian Peninsula and across Europe as one of the key methodologies to investigate such kinds of sites, either temporal or semi-permanent, as in the case of Aquis Querquennis. It is difficult to summarise briefly the state of the art, albeit new approaches continue to pop up in the scientific literature [
7,
8,
9,
10]. Combining geophysical techniques, chiefly magnetic methods (caesium vapour and gradient) summed to the capability to inspect the geometry of underground features with GPR, allows one to obtain nuanced plans of such camps and improve the understanding of the landscape around these sites [
11,
12,
13]. Thus, geophysical surveys are an integral part of landscape and regional studies related to the presence of the Roman army.
During the survey, the terrain enclosed within the fort walls offered optimal conditions for data acquisition., characterised by a relatively flat surface with minimal vegetation. Minor surface rock fragments in some areas did impact data quality.
A magnetic survey covering approximately 6500 m2 was conducted on the western side of the Roman fort. Data were collected using a SENSYS Type F non-magnetic pushcart multichannel carrier equipped with five FGM650/10 single-axis fluxgate magnetometers, spaced 50 cm apart. A zig-zag pattern with overlapping lines ensured comprehensive coverage. Georeferencing was achieved using a Stonex 9A differential GPS with RTK corrections. Data were acquired and exported using SENSYS MonMX (5.01-11) software and processed with SENSYS MAGNETO® (3.01-14). Processing steps included a Constant Median filter and a Hodrick–Prescott low-pass filter (cutoff frequency: 1 Hz).
A GPR survey, also covering approximately 6500 m2, was performed across the northern interior of the defensive walls, with a test survey conducted on the western wall and ditch. The survey utilised an IDS StreamDP multichannel GPR system with 30 channels (19 VV + 11 HH) with a frequency between 200 MHz and 1000 MHz, mounted on a smart cart. Georeferencing was achieved using a Stonex 9A differential GPS with RTK corrections, and data collection lines followed a zig-zag pattern with overlapping lines. uMap software (01.000.000_build007) facilitated on-field data acquisition.
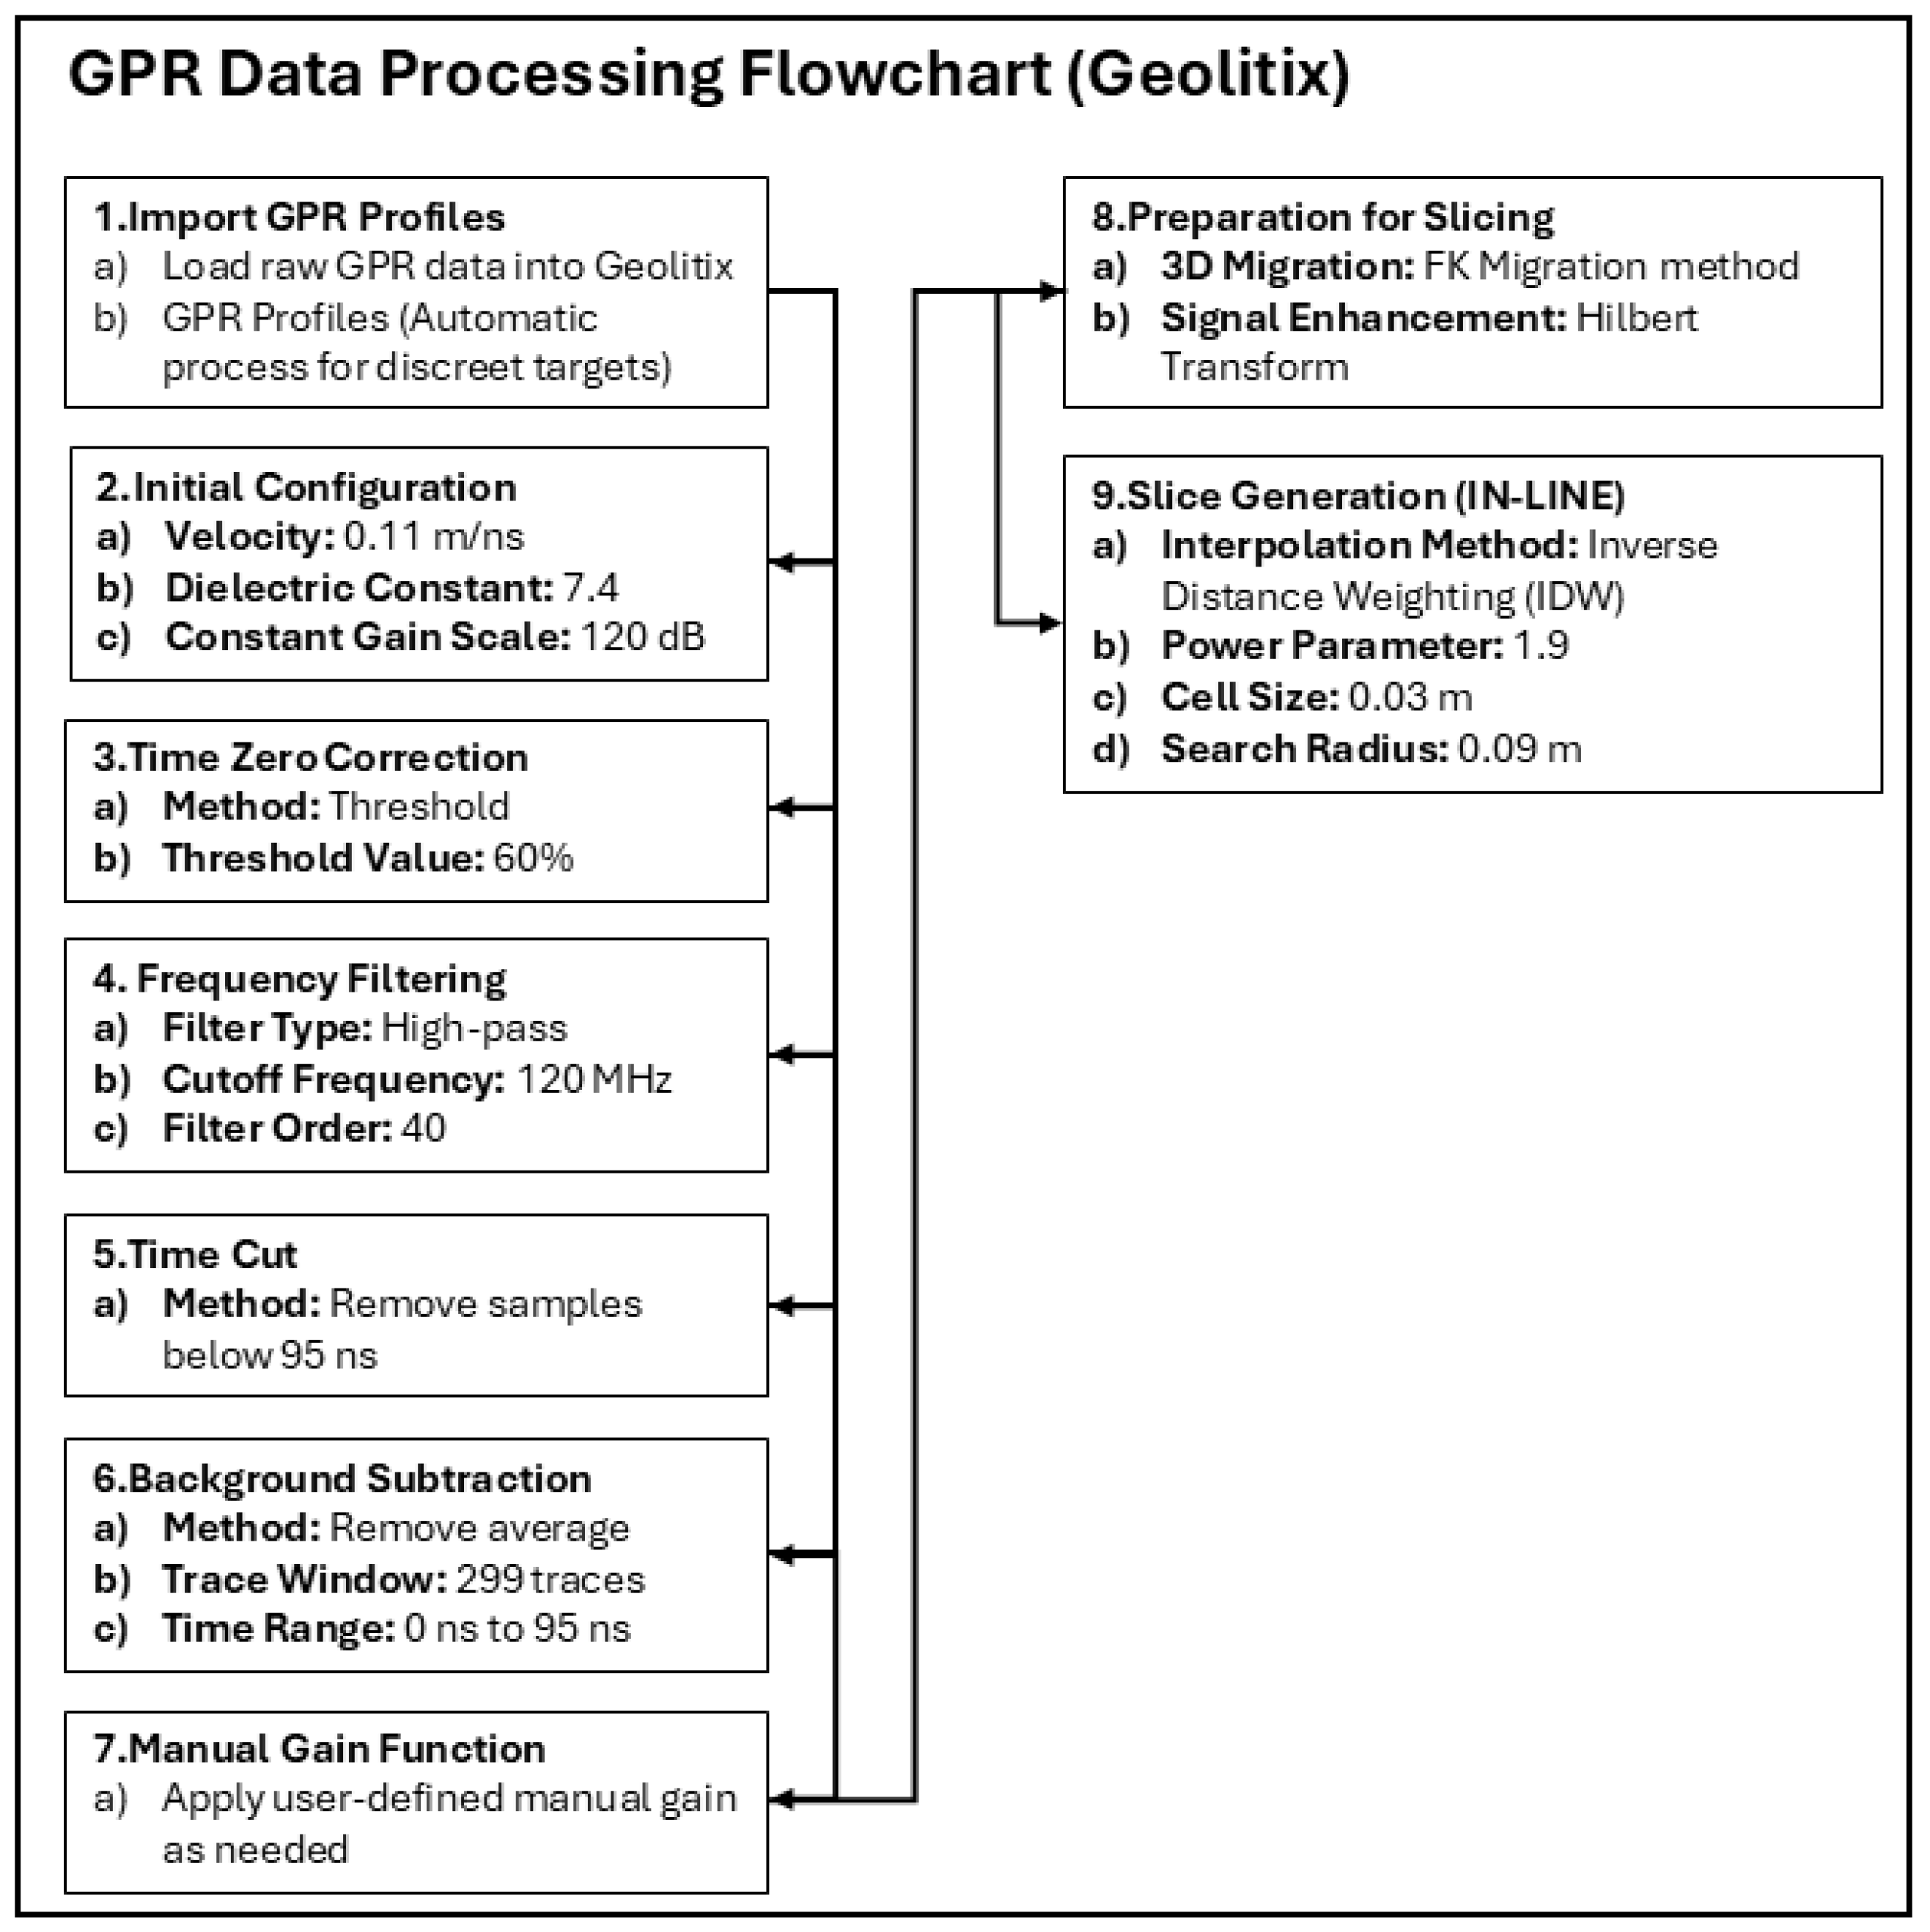
Data processing, essential for visualisation and interpretation, was performed using Geolitix software (
Figure 3). Individual profiles were imported into Geolitix, and relative geometry was added. The profiles were then processed collectively using the following steps, based on established methodologies [
14,
15]: signal propagation speed determination (hyperbola fitting), constant scale adjustment, time zero adjustment, dewow filtering, energy decay compensation, background removal, band-pass filtering and data migration using the F-K Stolt algorithm. Time slices were generated at 10 cm depth intervals and exported. Finally, these 3D interpolated time slices were integrated into a GIS platform (QGIS LTR 3.40.4) to create interpretative maps of the identified features.
A prior survey on this site, conducted in 2017, investigated its morpho-geophysical characteristics using multiple techniques, including GPR [
16]. This initial study employed a MALÅ Geosciences RAMAC system with a 500 MHz antenna to acquire parallel 2D profiles at 20 cm intervals. Data collection commenced from the lower left corner along the x-axis. Two test grids were established near the porta principalis sinistra (Grid 1: 156 m2) and porta principalis dextra (Grid 2: 787 m2) to identify subsurface structures. This revealed a barrack’s right wing in Grid 1 and a partial barrack structure in Grid 2, both previously undetectable through surface inspection. Despite the successful identification of these features, the unidirectional data acquisition of the GPR system, lacking GNSS integration, restricted the survey area to a maximum of 943 m2.
4. Results
4.1. Magnetic
Following the processing of the data, it is possible to observe an image with greater contrast between anomalies and the surrounding area. The interpretation of the magnetic data is a result of the analysis of the data, either individually or as a whole, through variables which represent the range of values collected and the geometrical shape of the anomalies, as proposed by [
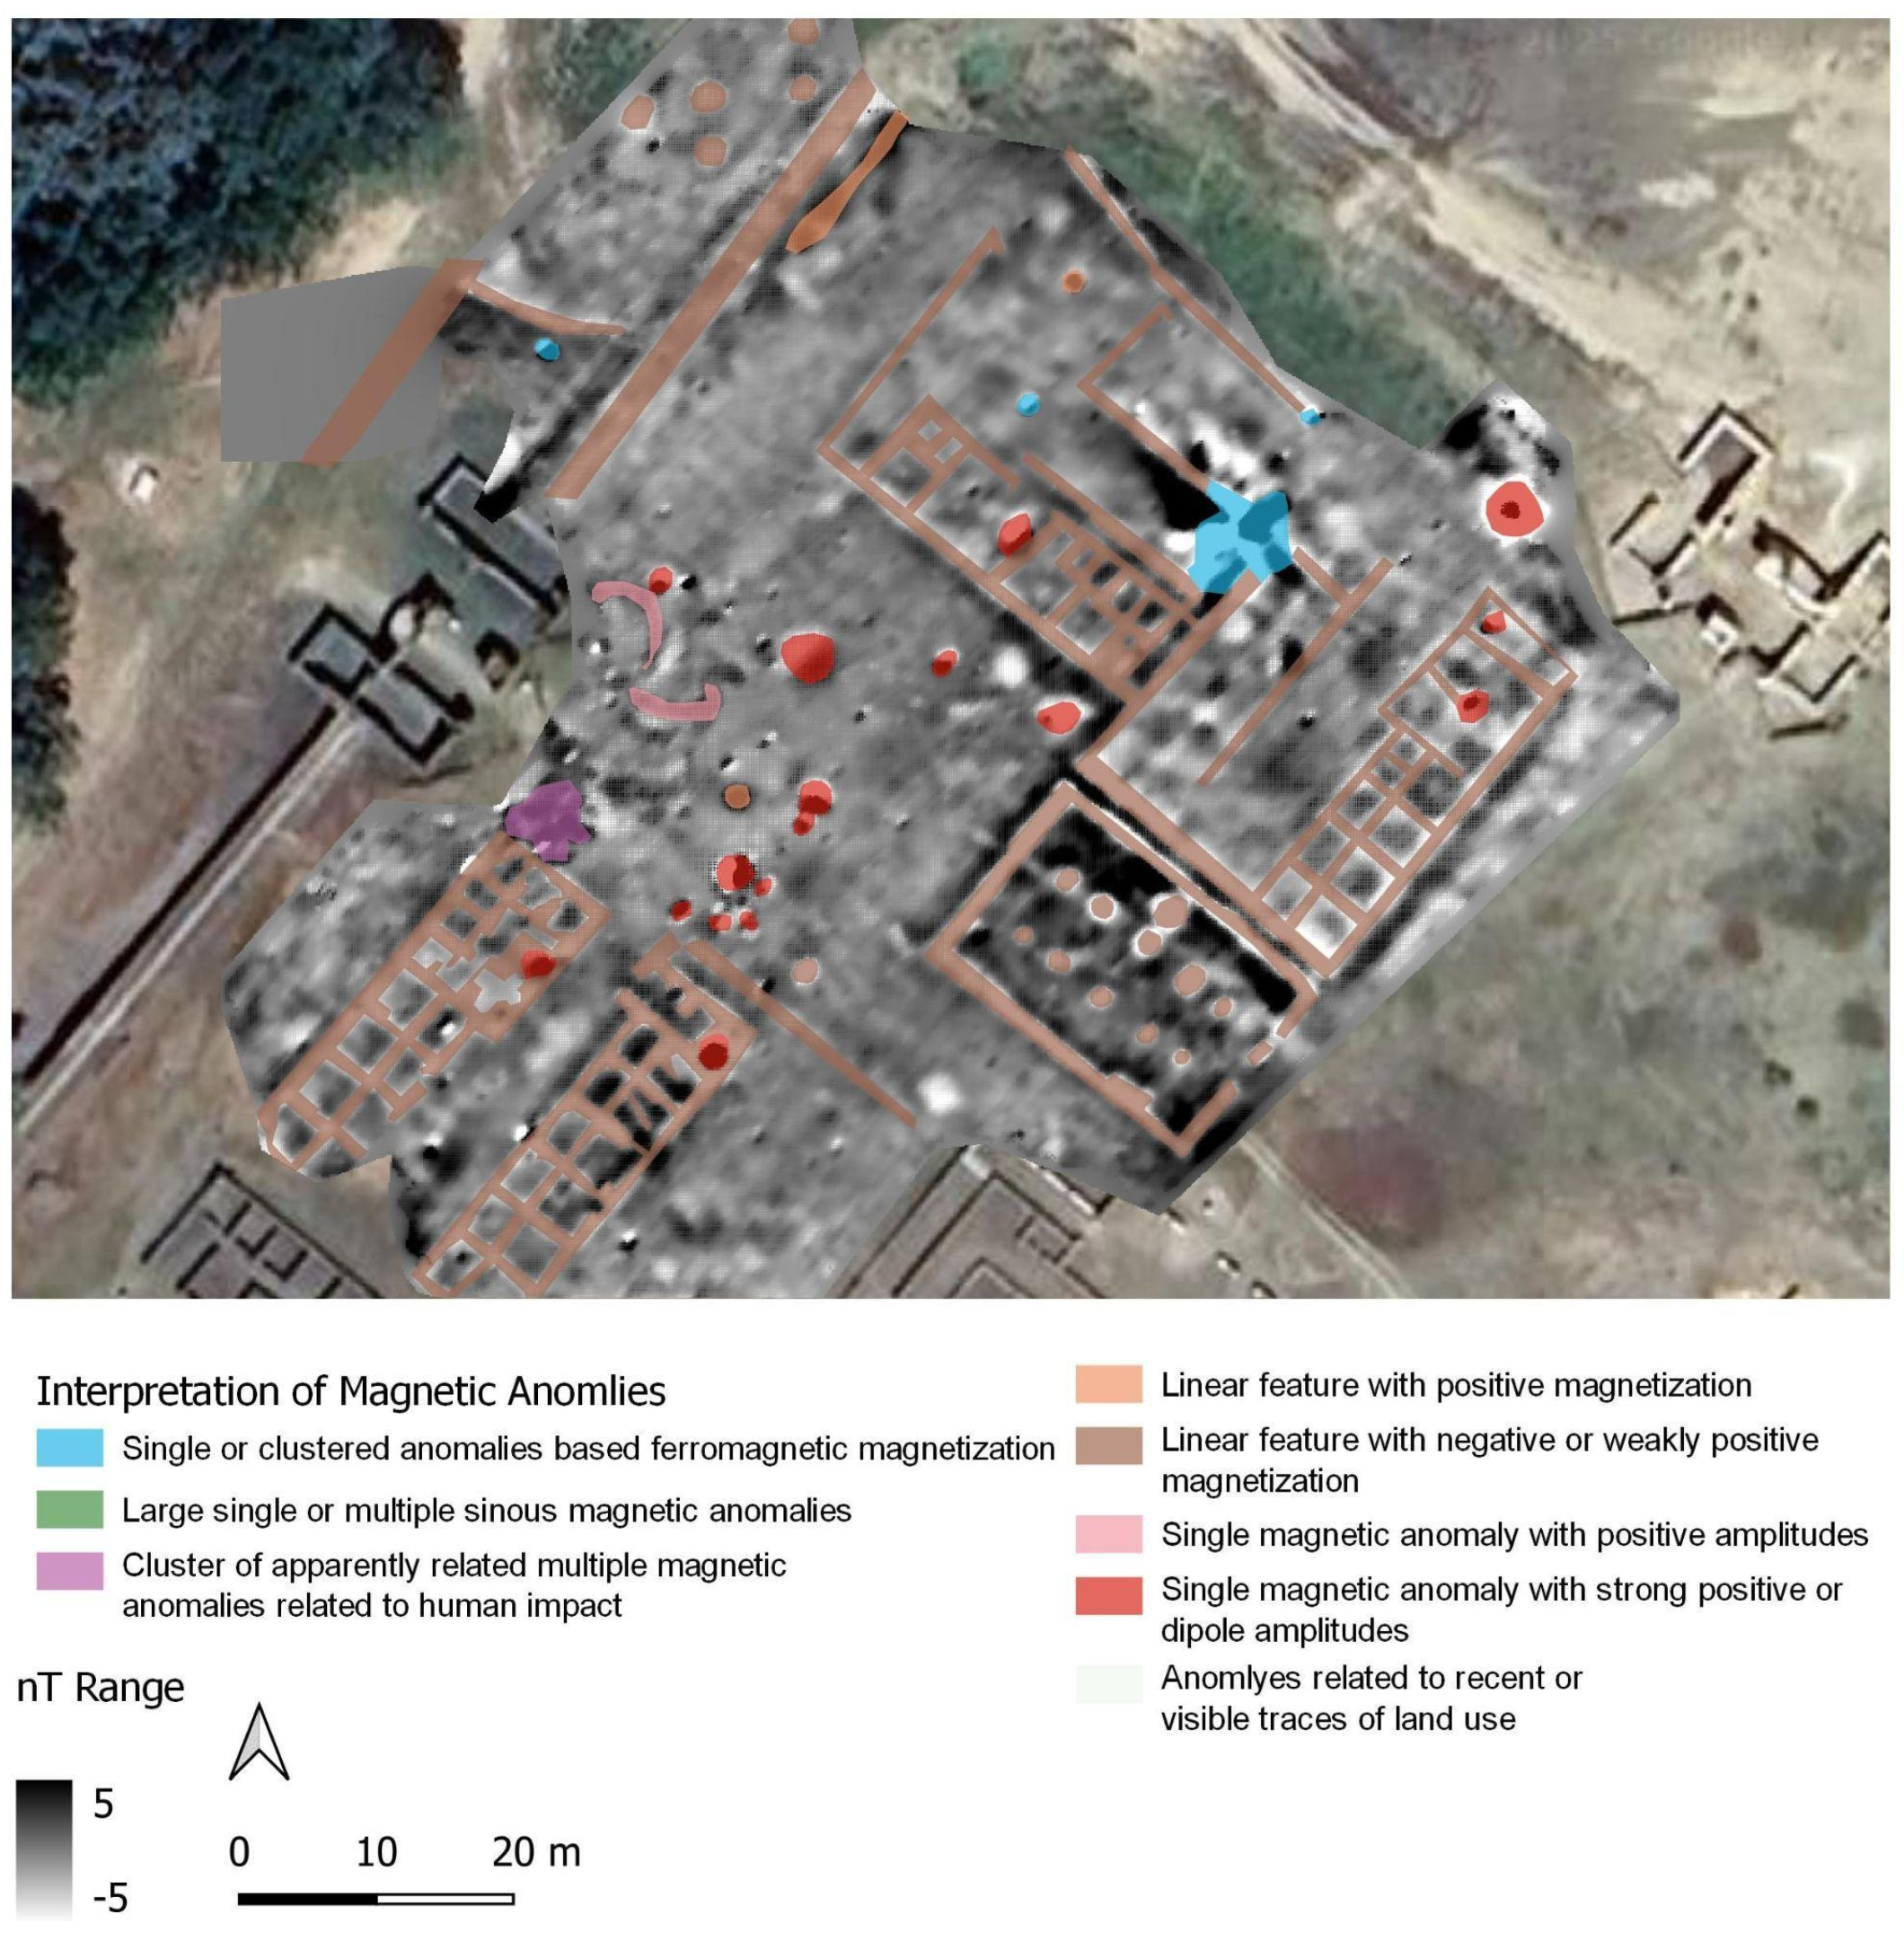
17]. These correspond to the unique characteristics of each material and/or type of remains (positive or negative). It is therefore possible to make the following considerations regarding the anomalies present in the dataset, taking into account the characteristics analysed based on the data collected and processed. The interpretation process aims to relate the interpretation of phenomena, either natural or human, to certain magnetic anomalies. These anomalies are interpreted spatially thanks to their strength, measured in nT, and their morphology, which could be linear or form shaped areas.
Linear features with negative or weakly positive magnetization are the most prominent in the magnetogram and correspond to the walls and foundations, as illustrated in
Figure 4. The alignment of the foundation walls is distinguishable and is marked in light brown. These patterns are consistent with the expected layout of the military barracks, and three units have been identified. Additionally, a previously unknown building was discovered (which will be discussed later).
A single magnetic anomaly characterised by strong positive or dipole amplitudes can be identified, corresponding to features exhibiting high thermoremanent magnetisation, such as burnt structures, kilns and ovens (see
Figure 5, dark red). These structures offer significant insights into the functional areas of the fort and the daily life of the army men within the camp. The magnetogram reveals the presence of these anomalies in specific locations of interest. The ones located within the barracks compartments may be indicative of small indoor heating fireplaces, as previously identified in excavated areas. The most significant anomaly of this type is observed on the left side of the porta praetoria, in front of one of the barracks. Given the presence of ovens in proximity to the troop barracks, this pronounced anomaly is likely to be associated with a military oven [
1,
18,
19]. Finally, a cluster of these anomalies is visible in the area devoid of building remains, situated immediately in front of the porta principalis. If these anomalies are related to the military occupation of the fort, it can be hypothesised that they correspond to areas of production.
Single or clustered anomalies, exhibiting strong (ferromagnetic) magnetisation, are present in specific locations on the magnetogram (see
Figure 5—red). Notably, a substantial area of magnetisation is observed in the barrack situated in the northeastern corner.
A cluster of multiple magnetic anomalies, seemingly related to human impact, is observed on the left side of the porta principalis (Pink), as inferred from their magnetic amplitudes.
A single magnetic anomaly with positive amplitude can be identified on the right side of the porta principalis, and it is associated with the presence of trenches carved into the rock.
4.2. Ground-Penetrating Radar (GPR)
Interpreting GPR data collected in archaeological contexts is often a challenging task that requires time, experience and skill, because these kinds of sites are usually complex [
20,
21,
22].
After executing the aforementioned processing steps, the B-Scans were inspected thoroughly. It was observed that there was minimal background noise and that all the constructed structures contrasted very well with the local geology, forming distinctive hyperbolas. It was determined through comprehensive observation and analysis that elevated levels of noise were primarily apparent within the NE-E-SE zone. This likely results from surface debris and a deep river terrace.
It was also observed that the favourable electrical conductivity exhibited by the sediments enabled the attainment of depths of approximately 6 m, with the result that the data were obtained with a high degree of clarity.
For the archaeological contexts and structures observed, the uppermost layer of the site becomes discernible at an approximate depth of 30 cm, while the total thickness of the sedimentary overlay is estimated at 55 cm, on average.
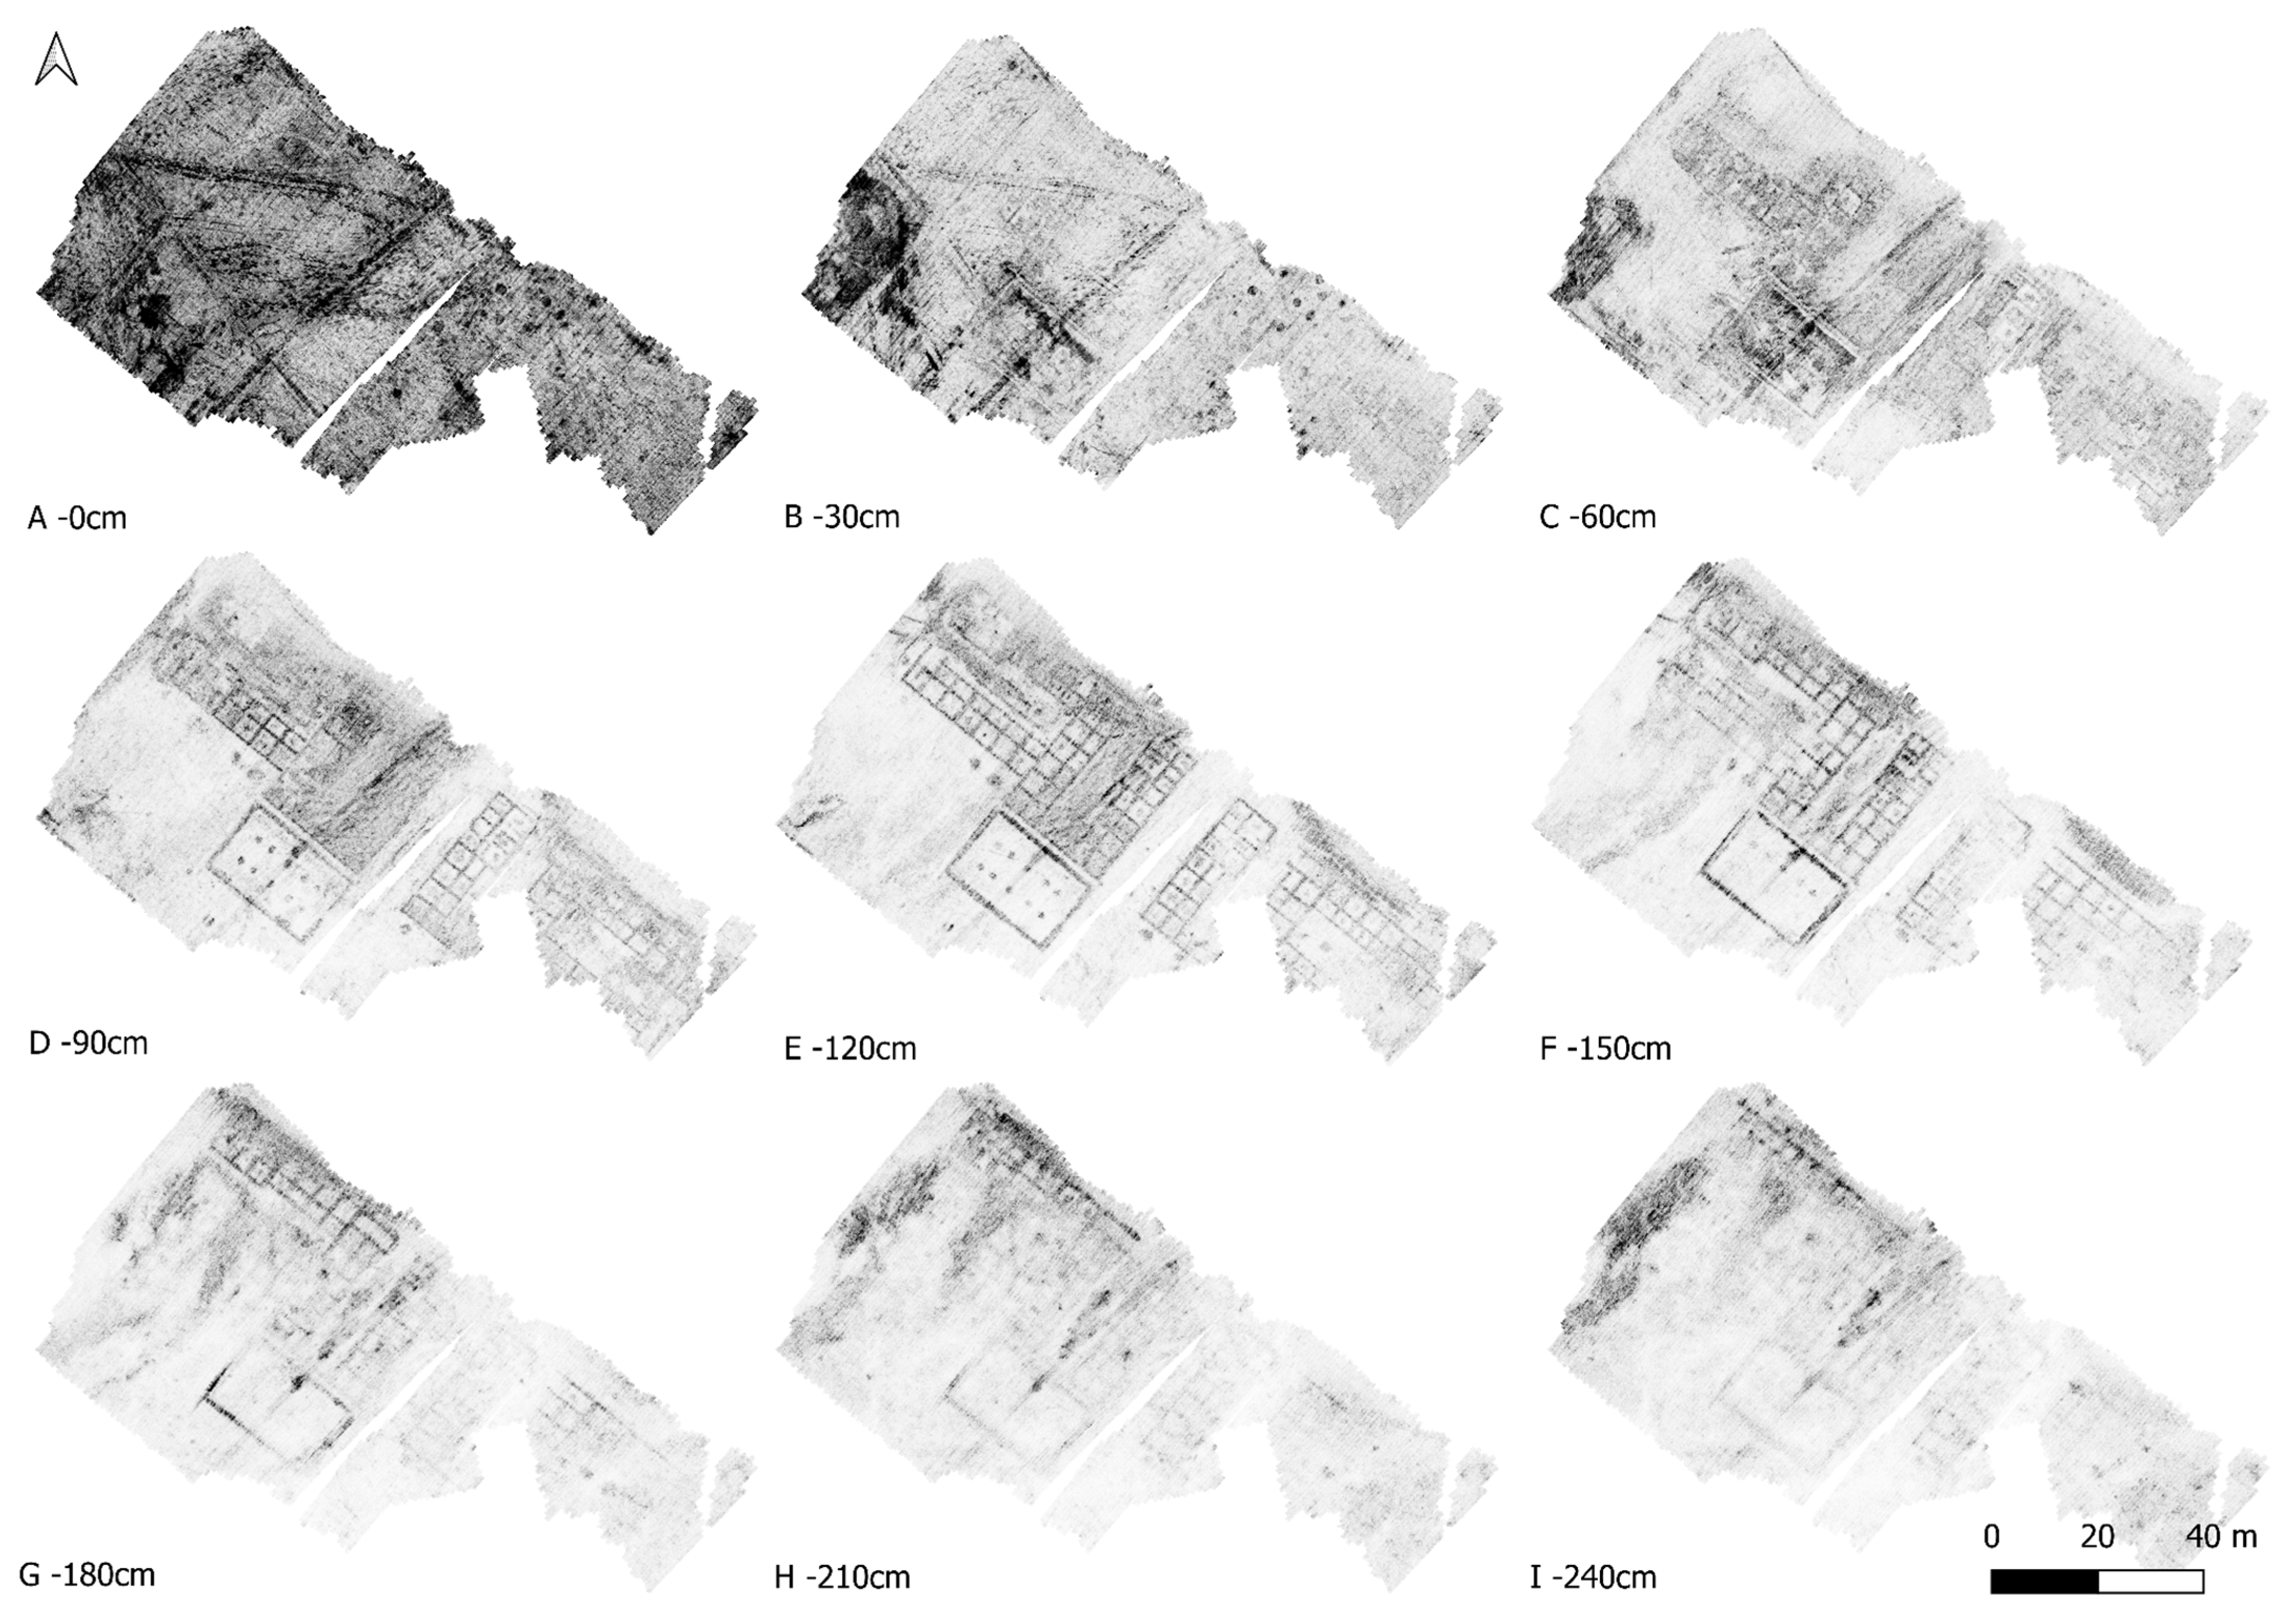
Following the creation of the C-Scans (slices), the contrast produced by the reflections of greater intensity is observable. As illustrated in
Figure 6, there is a discernible presence of multiple linear reflections, extending from approximately 30–160 cm until their complete dissipation at approximately 2 m.
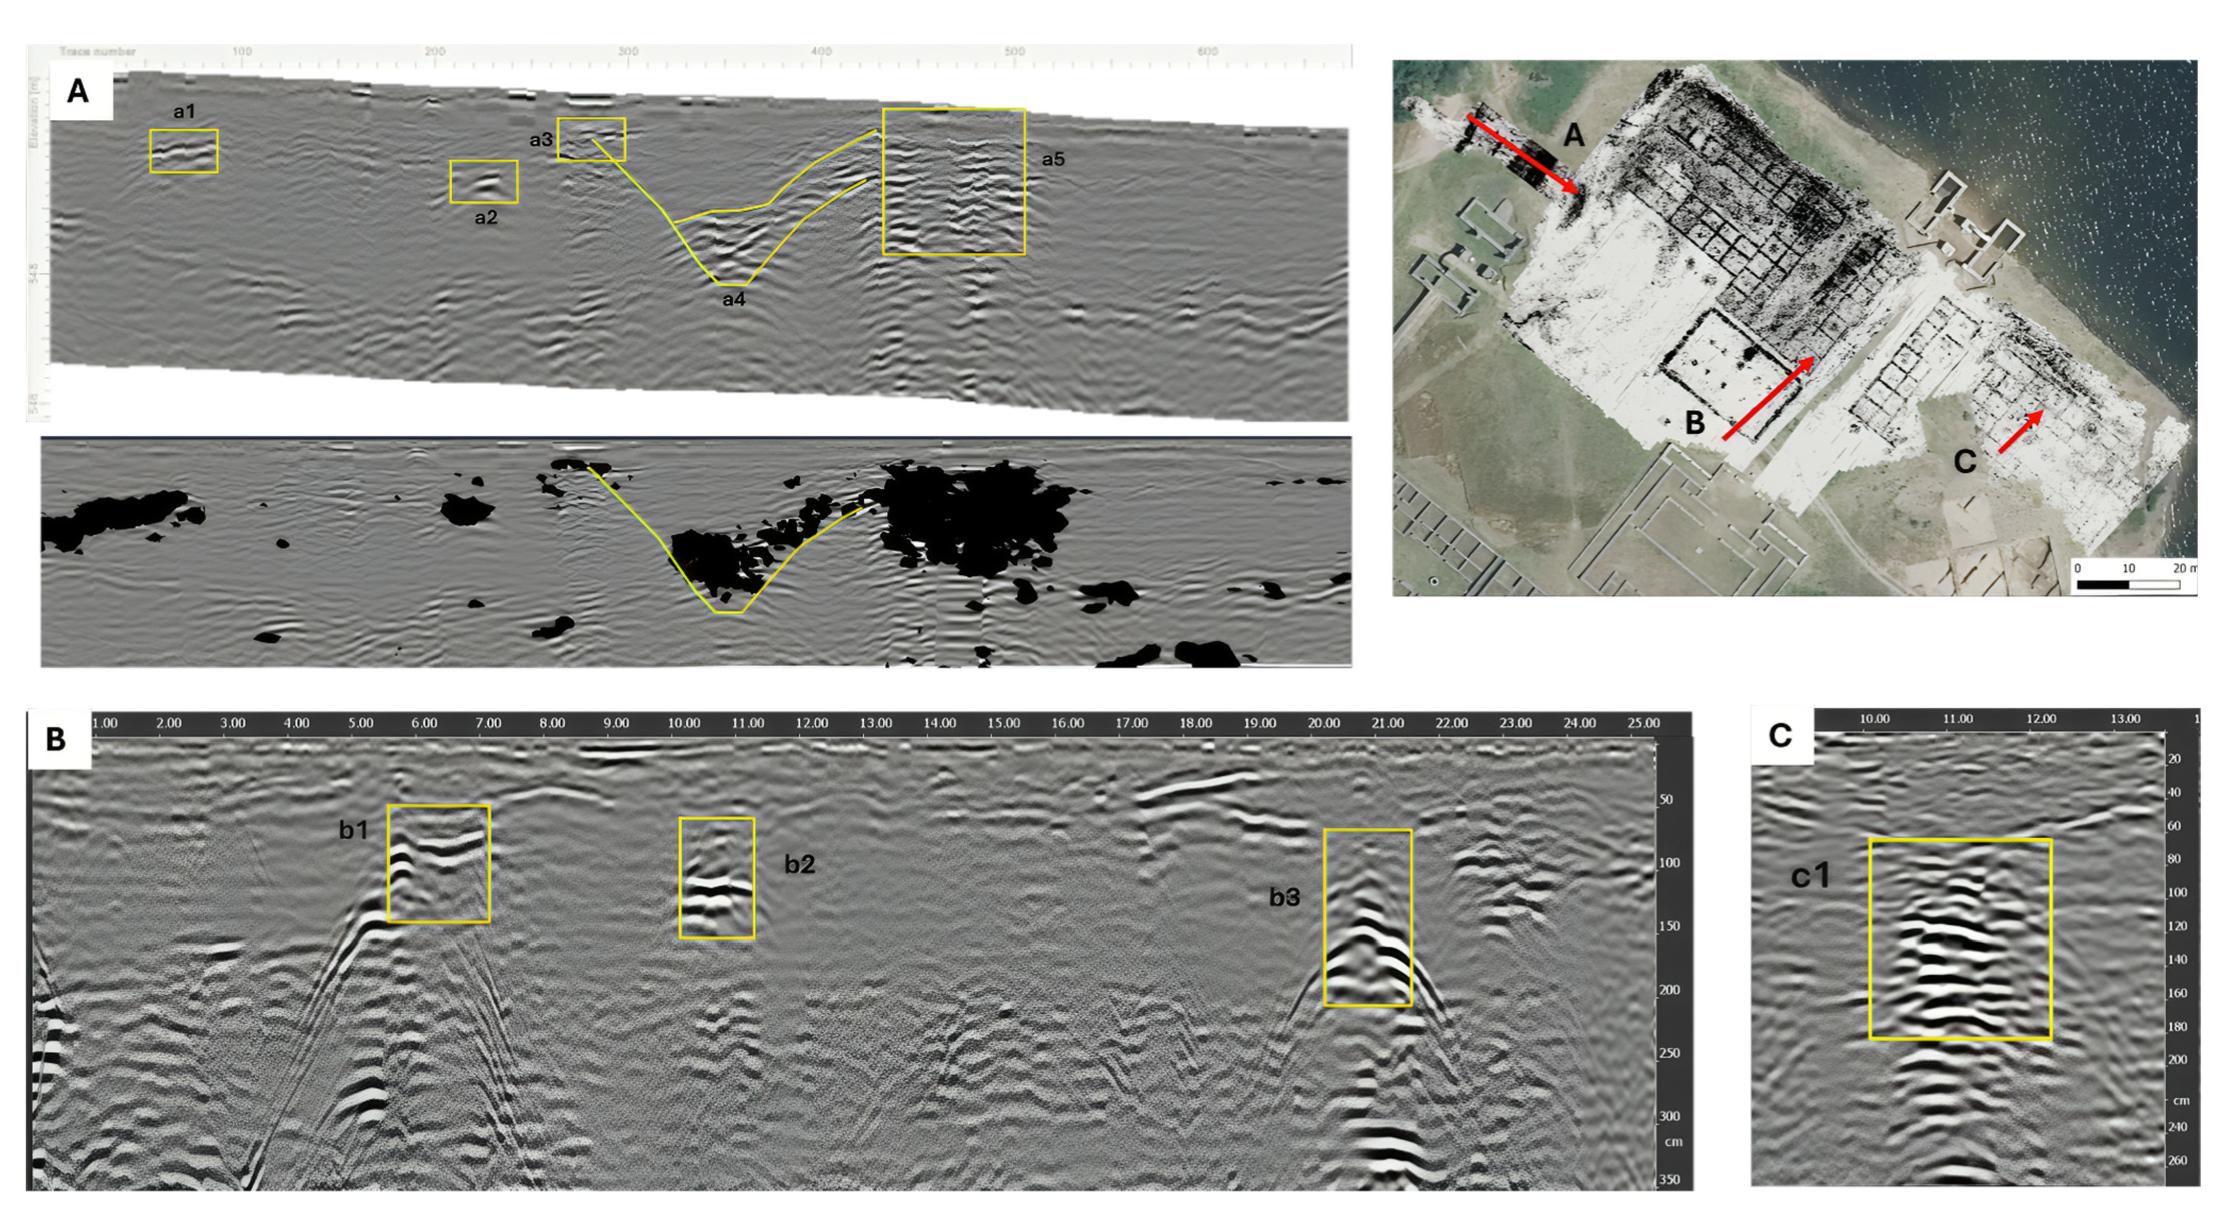
As demonstrated in
Figure 6, the apparent dimensions of the reflections can be readily observed in the B-Scans, and they can be characterised as walls. As illustrated in
Figure 6B, a profile can be observed on one of the newly identified structures, and it is evident that b1 and b3 correspond to thick lateral foundations, while b2 corresponds to a pillar.
As illustrated in
Figure 6C, the B-Scan profile that traverses a circular reflection may be indicative of a cistern well, a type of structure that has been observed in the area. There is a disparity in levels between the convergence of buried soils that form a reflection at depth with good dielectric conductivity. This is indicative of the anticipated structural type.
As demonstrated in the B-Scan made between the defensive wall and the outer ditch (see
Figure 7A), the reflection corresponding to the wall (a5) and the profile of the ditch (a4) with two types of sedimentary filling can be clearly discerned. Given the absence of significant contrast, it can be deduced that the reflection at the upper level likely corresponds to natural sedimentation. The reflection at the lower level exhibits a high amplitude and could be indicative of the deliberate obliteration of the wall.
On the outer side of the ditch, a positive reflection relative to it is evident, which could correspond to an external slope (a3). Furthermore, the presence of reflections in a1 and a2 suggests the potential for these to correspond with walls, which could be the sides of an ancient road.
The most significant anomalies are constituted by the continuous linear reflections, which are consistent with the stone foundations of military buildings. All these reflectors are combined in a new image representing a thicker depth section (
Figure 8) The arrangement of these features suggests the modular organisation typical of soldiers’ barracks [
23,
24]. However, a single edifice deviates from this geometry, exhibiting a distinct architectural arrangement. This building is rectangular in shape, with dimensions measuring 15.50 m in width and 24 m in length. It features an entrance facing southeast, and the interior is divided into ten equal sections, with five pillars situated on each side, parallel to the length of the structure.
It can also also noted that some areas have horizontal patterns of high reflection, possibly indicating compacted floors or stone slabs. These anomalies can be identified both within and outside the confines of the barracks. Further anomalies have been identified for which a resolution to the geometry is not currently feasible.
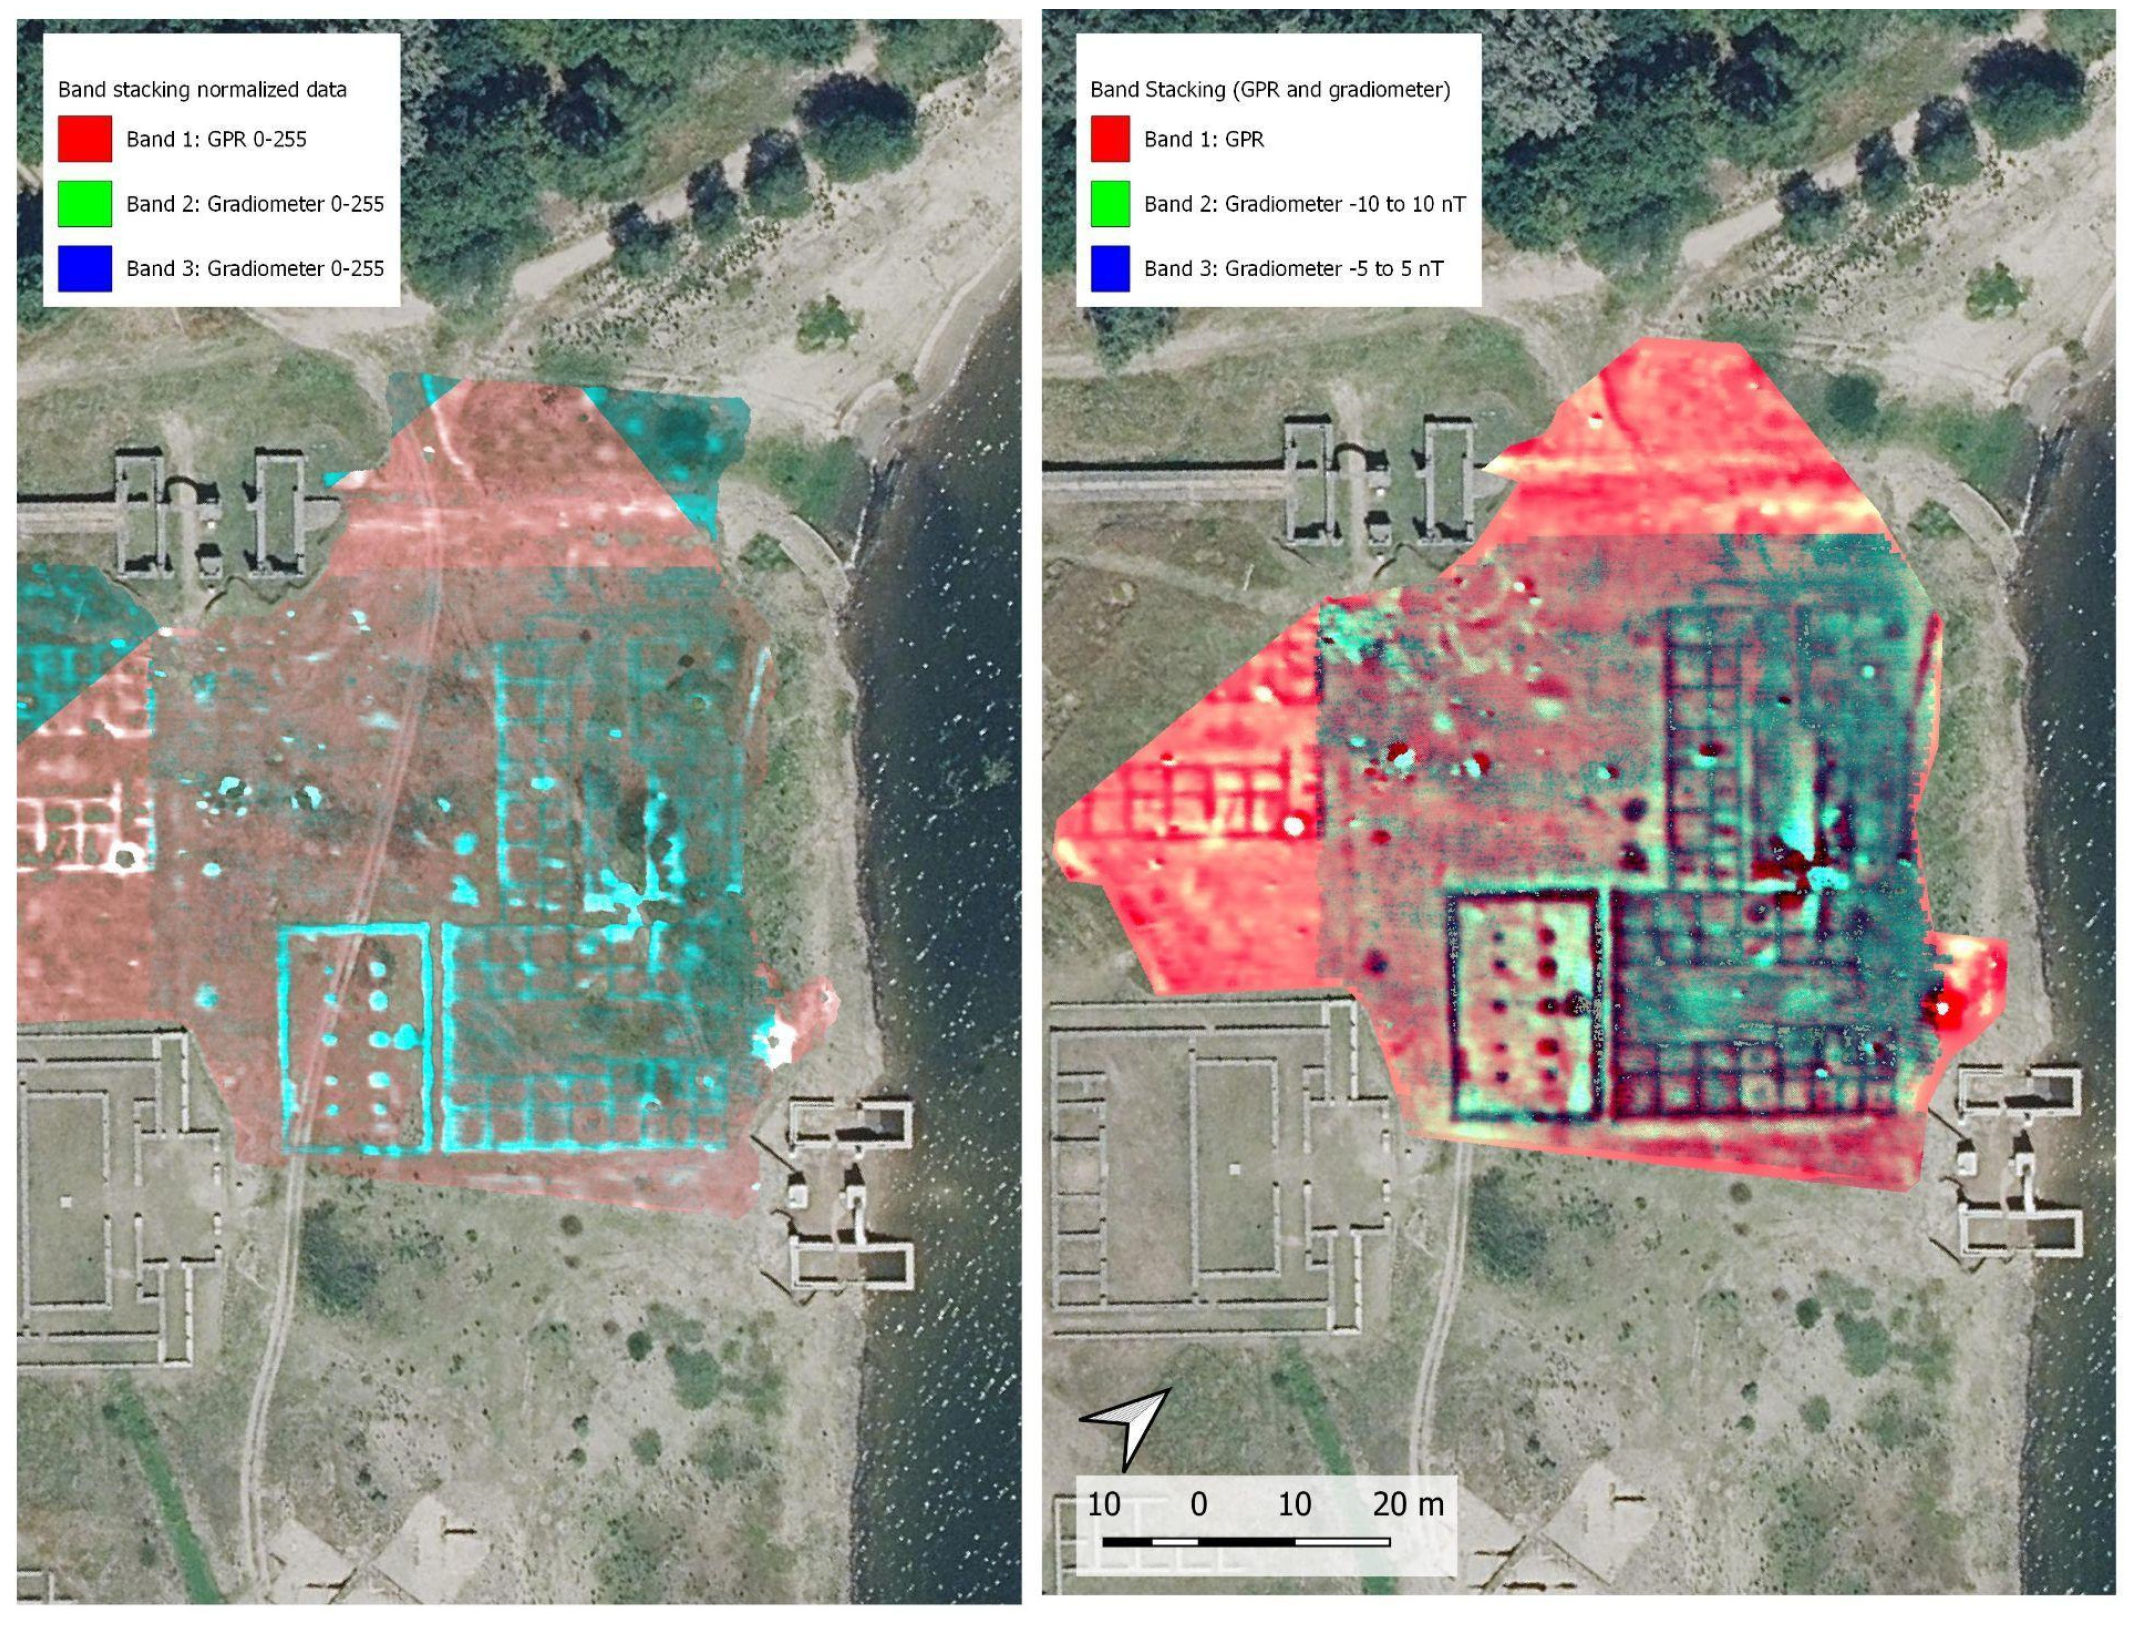
A possibility we aim to explore with these two methods is the visual combination of magnetic and GPR surveys, despite differences in the nature of both techniques (
Figure 9). However, we have already stressed the capabilities of method integration to gain a better understanding of Roman military sites. It could also be an advantage for visual representational purposes. The method we use derives from the experience of [
25] in Falerii Novi, where a large magnetometric survey was carried out sometime before the GPR survey [
26]. The proposed data fusion technique is the creation of a single composite image with bands from different prospecting methods. In this regard, we use the Red Band for the GPR survey, the Green Band for the magnetometric survey in a range of −10 to 10 nT, and the Blue Band again for the magnetometric survey in a range of −5 to 5 nT. This provides an initial visualisation that integrates the dynamic range of nT, showing functional areas and the geometric accuracy derived from the GPR data. The second step is to advance the data integration, converting both datasets to the same scale of 0–255.
5. Discussion
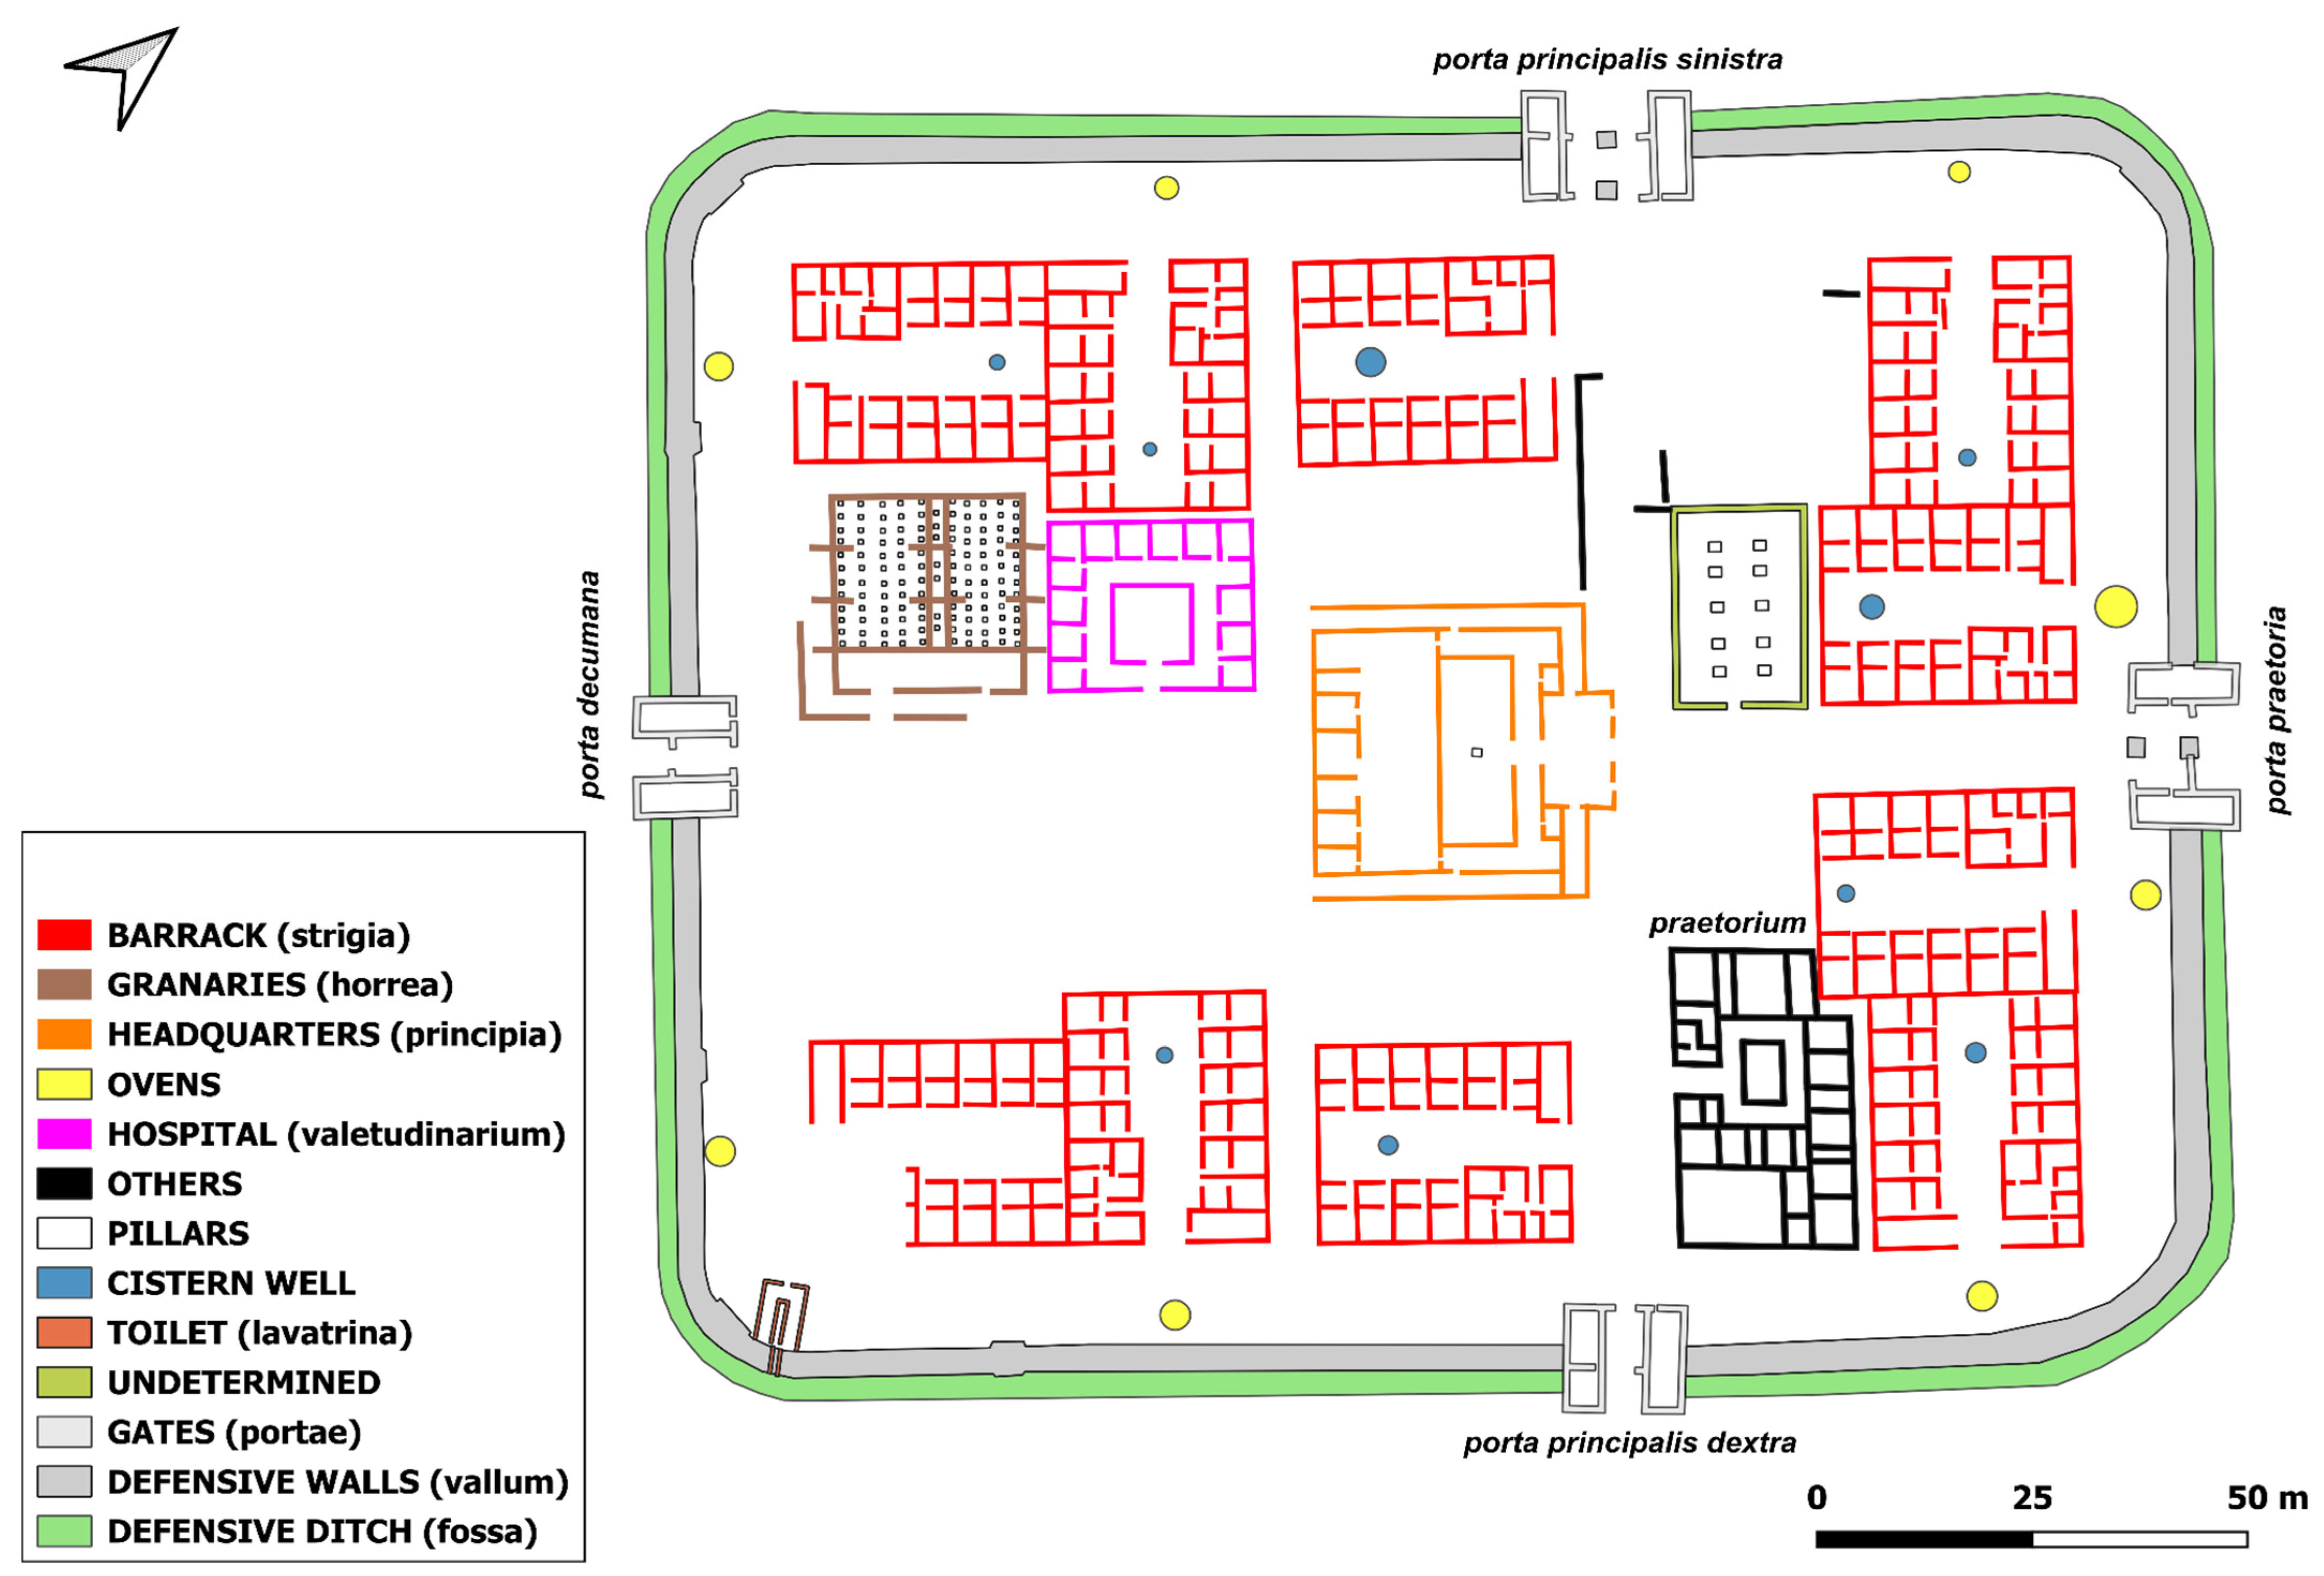
The site’s preservation conditions are exceptional in terms of the detectability of major phasing with non-invasive methods such as those employed, GPR and magnetometry (
Figure 10). The results of the archaeological excavations suggest that, following its abandonment, the visible structures were dismantled primarily through the looting of stone, most likely for utilisation in the medieval and modern buildings that are located in the vicinity. This plundering of raw materials was followed by agricultural subdivision on the site, which ensured that the preserved levels remained undisturbed and unaltered in depth. The construction of the dam and the subsequent filling of the reservoir resulted in the erosion of the sedimentary cover in the north-northeastern part of the fort. However, the topographical context of the fort’s location on a flat platform resulted in the dynamic accumulation of sedimentary deposits, which in turn offered protection to the archaeological layers situated at the base.
The aforementioned geology, when considered in conjunction with the preservation factors, resulted in the favourable outcomes achieved through the implementation of the selected geophysical methodologies. On the one hand, the use of magnetometry was favoured by the almost non-existent background noise related to the almost residual presence of extensive collapsed structures. Conversely, the absence of contemporary occupations signifies that debris accumulation had not occurred. Finally, the presence of looting pits filled with sediment, extending almost to the base of the structures, produced a marked contrast between these anomalies and the background, thereby facilitating the visualisation of a detailed layout. These factors also facilitate the comprehension of the results obtained using GPR. In addition to the conductivity of the soils being adequate, the presence of elements with different dielectric conductivities made it possible to observe the contrasts between the various archaeological realities.
The geophysical prospection carried out in the unexcavated area of the fort resulted in the detection of four new troop barracks. This forced us to change our initial assumptions, considering that the contingent of troops quartered in the Roman fort of Aquis Querquennis probably consisted of a miliaria unit made up of ten centuria distributed in groups of manipuli (two centuria) distributed as follows: one in the northwestern corner and another in the southwestern corner of the retentura area, two centuria flanking the principia building and another two manipuli in the praetentura area, one occupying the northeastern corner and the other the southeastern corner next to the praetorium building.
In this area, another new structure was also detected, with a basilica plan and two rows of five pilasters, which can potentially be identified as the building used for workshops (
fabrica), with its entrance in the centre of the main façade accessed from the via
praetoria. Nevertheless, there is no sign of industrial activity related to fire. No dipolar anomalies were documented here, and furnaces appear closer to the camp’s wall. Alternative functions, such as storage for loot, prisoners, or hostages, as described in classical texts (Livy 10.32.8; 41.2.11; DMC 18. [
18]), should be considered.
An alternative interpretation for the space is its potential use as a stable for the equites’ horses. This aligns with Ramsay’s analysis of Polybius’s classical camp description, where he identifies cavalry positioned facing the forum and quaestorium: “Still further to the right and left of the praetorium in 9, 10, and 9′, 10′, looking respectively towards the forum and the quaestorium, were a body of cavalry, selected from the extraordinarii equites (
οἱ τῶν ἐπιλέκτων ἱππέων ἀπόλεκτοι), and a body of cavalry serving as volunteers out of compliment to the general” [
27].
Furthermore, the presence of furnaces within the barracks offers insights into the daily life of the Roman army, potentially revealing patterns of spatial organisation and socialisation around these focal points. This aspect, currently under-explored, presents a promising avenue for research. Applying methodologies from household archaeology and space syntax could illuminate whether rooms containing fire sources held a significant role within the camp’s organisational structure. While this paper introduces the question without providing a definitive analysis, it underscores the capacity of geophysical prospection to identify functional areas and generate new research questions.
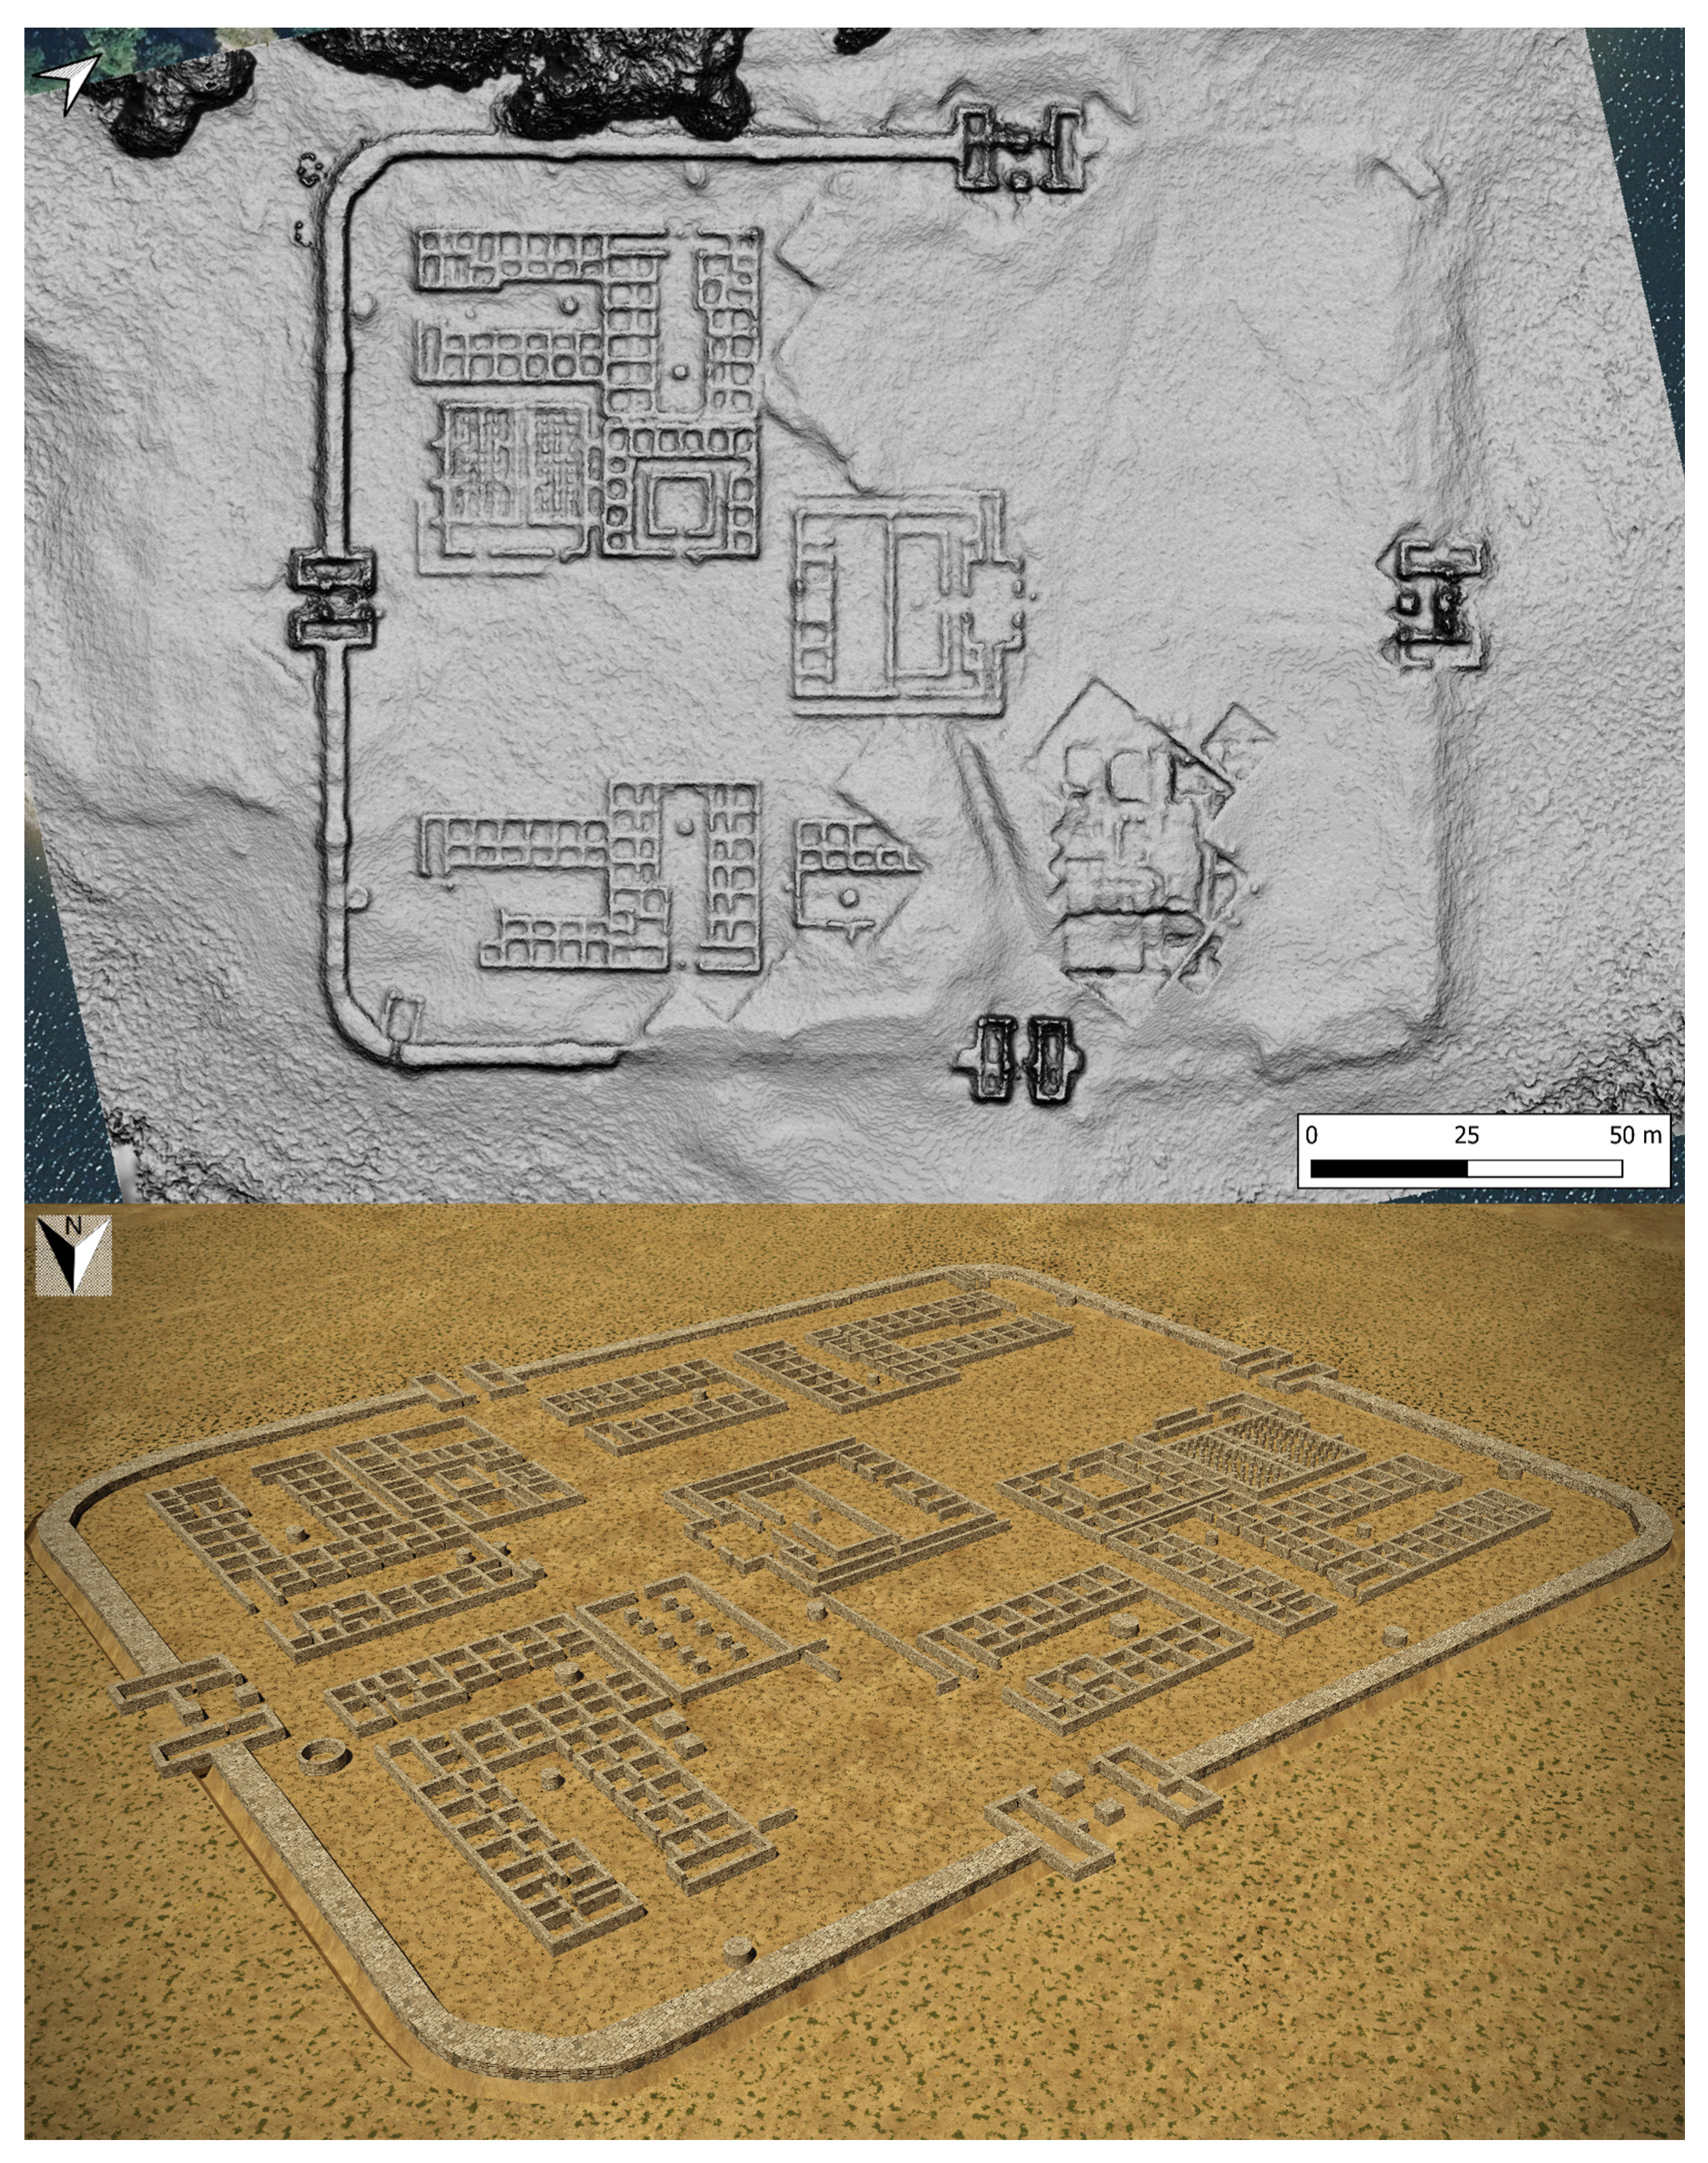
To initiate the 3D reconstruction of the unexcavated area, the initial crucial step involved the seamless integration of vectorized elements derived from two distinct but complementary datasets: GPR data interpretation and a drone-derived photogrammetric survey (
Figure 11). This combined dataset provided a comprehensive spatial understanding of subsurface anomalies and surface topography.
Leveraging these integrated 2D vector elements, a sufficiently accurate and georeferenced 2D base map was meticulously created. This base served as the foundational framework for the subsequent second phase of the project, which focused on the detailed 3D modelling of the identified archaeological structures using AutoCAD 2025 software (
Figure 12).
The third and final phase involved enhancing the visual realism and interpretability of the 3D models through the application of realistic lighting, appropriate texturing, and high-quality rendering using 3D Studio Max software (
Figure 11). This process aimed to produce a compelling and informative virtual representation of the subsurface and surface features.
The use of these data will facilitate the completion of the existing virtual reconstructions (
http://www.aquisquerquennis.es/pt/pagina-inicial/), thereby facilitating a more profound comprehension of the site, thus ensuring a more suitable experience for visitors.


 ,
, 