Article

Imaging of Leaf Water Patterns of Vitis vinifera Genotypes Infected by Plasmopara viticola

by
Erich-Christian Oerke
* and
Ulrike Steiner
INRES–Plant Pathology, Rheinische Friedrich-Wilhelms-Universitaet Bonn, Nussallee 9, D-53115 Bonn, Germany
*
Author to whom correspondence should be addressed.
Remote Sens. 2025, 17(10), 1788; https://doi.org/10.3390/rs17101788
Submission received: 24 April 2025 / Revised: 17 May 2025 / Accepted: 19 May 2025 / Published: 20 May 2025

Abstract

:
The water status of plants is affected by abiotic and biotic environmental factors and influences the growth and yield formation of crops. Assessment of the leaf water content (LWC) of grapevine using hyperspectral imaging (1000–2500 nm) was investigated under controlled conditions for its potential to study the effects of the downy mildew pathogen Plasmopara viticola on LWC of host tissue in compatible and incompatible interactions. A calibration curve was established for the relationship between LWC and the Normalized Difference Leaf Water Index (NDLWI1937) that uses spectral information from the water absorption band and NIR for normalization. LWC was significantly lower for abaxial than for adaxial leaf sides, irrespective of grapevine genotype and health status. Reflecting details of leaf anatomy, vascular tissue exhibited effects reverse to intercostal areas. Effects of P. viticola on LWC coincided with the appearance of first sporangia on the abaxial side and increased during further pathogenesis. Continuous water loss ultimately resulted in tissue death, which progressed from the margins into central leaf areas. Tiny spots of brown leaf tissue related to the reaction of partial resistant cultivars could be monitored only at the sensor’s highest spatial resolution. Proximal sensing enabled an unprecedented spatial resolution of leaf water content in host–pathogen interactions and confirmed that resistance reactions may produce a combination of dead and still-living cells that enable the development of biotrophic P. viticola.

1. Introduction

Grapevine (Vitis vinifera L.) was grown for the production of table grapes and wine, in 2023, on about 6.6 million ha worldwide (https://www.fao.org/faostat/en/#data, accessed on 3 January 2025). As many vineyards are in regions where water is a limiting resource and drought stress may reduce the quality and quantity of grapevine production, monitoring of the crop water status is very important in viticulture and has become a major research area [1].
Stomatal conductance, water potential, canopy temperature, and vegetation indices are widely used to characterize the water status of grapevine and other crop species [1,2,3,4]. Measurements of stomatal conductance and water potential of leaves, stems, or plants result in a mean value per measuring object, deliver no spatial information, and require contact between plant tissue and sensor. In contrast, thermal and spectral sensing and imaging provide various vegetation indices, are contactless and may be applied on various platforms and scales; e.g., ground-based spectrometry and thermography [5], aerial thermography [6,7], aerial multispectral and thermal imagery [8,9,10], and ground-based hyperspectral imaging [11].
The effects of water content on leaf reflectance are greatest in spectral bands centered at 1450, 1940, and 2500 nm. Secondary effects occur at 980 nm and 1240 nm [12,13,14]. In satellite and airborne imagery, the SWIR wavebands are usually saturated with atmospheric water vapor, which has a higher concentration over the full atmospheric column between sensor and vegetation than the liquid water of the plant tissue [15]. As the SWIR water absorption bands are not suitable for remote sensing of the water content of vegetation, wavebands from the NIR range are used instead. Spectral band ratios developed to estimate the water content of vegetation from remote sensing include the normalized difference water index (NDWI; [16]) and the plant water index (PWI; [17]). These spectral ratio indices use the (broad) wavebands provided by satellite-borne or airborne sensors.
Wavebands around 1200 nm and 1400 nm have been used to predict the water status of grapevines, also from aerial SWIR data [18,19]. The best models used SWIR data (750–1700 nm) from UAV and allowed predicting stem water potential with R² of 0.54. Random Forest and Support Vector Machine models used wavebands located around 1420 nm and 1460 nm, and 1050 nm and 1200 nm, respectively [20].
In proximal sensing, the content of atmospheric water vapor of the column between leaf tissue and sensor is considerably lower than the content of liquid water in living plant tissue. Reflection from ground-based hyperspectral imaging at 1410 nm and 1520 nm was correlated with the water status of tomato leaves [21]. For the period 2019 to 2022, Sanaeifar et al. [22] listed 41 studies in which proximal hyperspectral sensors were used for drought detection of various plant species on the leaf and canopy scale; 20 non-imaging sensors, 18 in the VISNIR range, and 2 using SWIR data, in grapevine [23] and in oak phenotyping [24], respectively. Oerke & Steiner [25] successfully used a normalized difference water index NDWI1937 for characterizing the water status of apple leaves infected by Venturia inaequalis.
Knowledge of the effect of leaf diseases on the water status of crop plants is limited (see review by Grimmer et al. [26]). Leaf diseases such as downy mildew, powdery mildew, and various leaf spot diseases are described to affect yield formation of grapevine and to aggravate the effects of drought conditions on host physiology without knowing details on their effect on leaf water status [27,28].
Downy mildew of grapevine is caused by the obligate biotrophic oomycete Plasmopara viticola (Berk. & M.A. Curtis) Berl & De Toni and is one of the most devastating diseases worldwide [29]. Despite frequent fungicide use, it causes considerable production losses in grapevine production. As the completion of its life cycle depends on host plant resistance and environmental conditions, the use of (partially) resistant cultivars and the use of fungicides according to forecast models, depending on leaf wetness duration, are essential tools in downy mildew control [30,31,32,33].
Plant-pathogen interactions may be classified as compatible (successful infection leading to disease and pathogen reproduction) or incompatible (successful plant defense, no disease and no pathogen survival) [34]. In more detail, however, there is a continuum in the level of compatibility of interactions. The interaction between the susceptible genotype Mueller-Thurgau, a typical representative of European grapevine Vitis vinifera, and P. viticola is fully compatible and results in the abundant formation of abaxial sporangia. Partial, i.e., incomplete resistance of grapevine cultivars to P. viticola depends on genes (Rpv) introgressed from Vitis species from the Americas and Asia [35,36]. Rpv3 (derived from V. rupestris) and Rpv10 (from V. amurensis) confer a high level of resistance to cultivars Regent (carrying Rpv3-1) and Solaris (Rpv3-3, Rpv10), respectively, to P. viticola. Resistance reactions of Regent and Solaris include the formation of spots of brown tissue with some necrotic (dead) cells. Earlier studies, however, revealed that P. viticola can survive and even sporulate on this tissue, which includes living cells containing haustoria of the pathogen [37].
The influence of downy mildew on leaf transpiration has been investigated using thermography in cucumber [38,39] and grapevine [40]. Hyperspectral imaging of the leaf water content of apple leaves infested by Venturia inaequalis demonstrated that increased transpiration does not inevitably reduce the water content of colonized leaf tissue, as the plant may compensate for the increased water loss through the cuticle provided water supply is not limiting [25]. Only in advanced stages of pathogenesis, the imaging sensor system revealed highly localized water gradients around infections. The study also revealed that the adaxial sides of non-infected apple leaves had higher leaf water content than the abaxial side. However, the relationship between leaf water content (LWC) and Normalized Difference Leaf Water Index was calibrated only for adaxial apple leaf tissue. It was not clear whether the difference in NDLWI1937 values between leaf sides resulted from an effect on the SWIR water absorption bands, on the tissue structure-characterizing NIR waveband at 1047 nm, or on both leaf characteristics. In dicotyledonous plants, the arrangement of leaf tissues is strongly asymmetric, with the chloroplast-rich palisade parenchyma near the upper surface to intercept incoming light and the spongy mesophyll and large air spaces on the abaxial side of the leaf near the lower surface where the stomata are located [15]. This bifacial arrangement is likely to cause differences in the spectral characteristics between adaxial and abaxial leaf surfaces. The water-transporting vascular bundle is oriented more to the abaxial side of leaves, with xylem and phloem often located underneath the palisade parenchyma.
Imaging sensors enable the detection, mapping, and modelling of the biochemical and physiological processes in compatible and incompatible host–pathogen interactions [37,41,42,43]. The objective of the study reported herein was to improve our understanding of the effect of P. viticola on the leaf water status of grapevine leaves, depending on the compatibility of the host–pathogen interaction, by applying an innovative method of LWC mapping on the tissue scale. Four objectives were addressed; (I) to establish the relationship between LWC measured gravimetrically and a normalized difference vegetation index based on the SWIR water absorption band(s) for adaxial and abaxial sides of grapevine leaves; (II) to check the validity of this relationship under various environmental conditions, e.g., background and grapevine genotype; (III) to map the effect of downy mildew on the leaf water status in compatible and incompatible interactions; and (IV) to track the changes in LWC during pathogenesis in longitudinal studies.

2. Materials and Methods

2.1. Plant Growth

Grapevine (Vitis vinifera L.) plants of cultivars Mueller-Thurgau, Regent, and Solaris were grown from green cuttings in commercial substrate ED 73 (Balster Einheitserdewerk, Froendenberg, Germany) in plastic pots (10 × 10 cm, 0.9 L volume) in a greenhouse at 23/20 °C (day/night), 60% relative humidity (RH), and a photoperiod of 16 h (>300 μmol m−2 s−1). Plants were watered as necessary and fertilized before the experiment once with 100 mL of a 0.2% solution of Poly Crescal (Aglukon, Düsseldorf, Germany). The cultivars differ in field susceptibility to downy mildew: cv. Mueller-Thurgau (white wine, rating 7), cv. Regent (red wine, 3), cv. Solaris (white wine, 3) (scale 1 = resistant, to 9 = susceptible; [44]).

2.2. Inoculum Preparation and Inoculation

Sporangia of Plasmopara viticola produced on the abaxial side of grapevine leaves of the susceptible cv. Mueller-Thurgau were stored at −18 °C. Sporangia were washed off the leaves with water containing 0.1% Tween-20, adjusted to a concentration of 5 × 10⁴ mL−1, and sprayed onto the abaxial side of the upper four leaves (1.2 mL per leaf) of grapevines by turning the plants upside down during spraying.
For each cultivar, 4–6 plants were inoculated with the pathogen when at least six leaves were fully developed. Inoculated plants were incubated for 24 h at 100% RH, 23/20 °C, 16 h photoperiod; subsequently, they were grown at 60% RH. Non-inoculated control plants were not subjected to spells of 100% RH.

2.3. Disease Assessment

The severity of P. viticola colonization of grapevine leaves was assessed visually starting 3 days post-inoculation (d p.i.). To induce sporulation of P. viticola, infected plants were incubated for 14 h (19.00 to 09.00) at 100% RH. For cv. Mueller-Thurgau, the percent (abaxial) leaf area covered by whitish sporangia was estimated using the classes 0, 1, 2, 5, 10, 20, 30, …, 90, 100%. For cvs. Regent and Solaris, the percentage leaf area covered by tiny brownish leaf spots was estimated using the same classes.
On images of leaf tissue, the size of individual leaf spots was assessed by counting the number of pixels with NDLWI1937 values < 0.55.

2.4. Leaf Thickness

The thickness of grapevine leaves was assessed using a digital sliding caliper (Workzone DMV-SL05, Dario GmbH & Co KG, Hamburg, Germany). The thickness of intercostal areas and second-order leaf veins of ten mature, fully developed leaves and 10 young leaves (leaf level 2 and 3 from top) per grapevine genotype was measured.

2.5. Gravimetric Assessment of Leaf Water Content

The leaf water content (LWC) of grapevine leaves was measured gravimetrically as LWC = (fresh mass − dry mass)/fresh mass × 100. Per treatment, the fresh mass of 8–10 leaves was weighed directly after leaf detachment, and the dry mass after drying at 72 °C for at least 12 h. The LWC value is in contrast to the relative water content, as it does not consider the maximum water content of plant tissue. The experiment was carried out twice.

2.6. Hyperspectral Imaging (HSI)

2.6.1. Measuring System

Hyperspectral images in the shortwave infrared (SWIR) range (940 to 2544 nm) were recorded using a camera with the ImSpector N25E spectrograph (Spectral Imaging Ltd., Oulu, Finland) and an objective with a focal length of 30 mm and a field-of-view of 18°. An effective sensor slit length of 9.6 mm and 320 pixels per line result in a sensor pixel size of 30 µm. Spectral resolution was 6.3 nm (256 bands). Three ASD-Pro-Lamps (Analytical Spectral Devices Inc., Boulder, CO, USA) on each side of the camera provided a near-solar light spectrum and gave even illumination of the scene. Camera and lamps were arranged on a motorized line stage (SP-X-Stage-Dual2, Spectral Imaging Ltd.), which moved the measuring system above the plants. Camera and line stage were controlled using the SpectralCube software (Spectral Imaging Ltd.). Imaging data were recorded in a darkened room for optimal and reproducible measuring conditions.
During HSI measurements, the leaves attached to grapevine stems were fixed between two grids (mesh size 30 × 40 mm) of black fibers in a frame 0.35 m above a black polypropylene background to support the leaves from below and to smooth them from above. The potted grapevine plants and the supporting system were placed on a motorized table in order to vertically adjust the leaves to a working distance of 0.3 m (for maximum spatial resolution) to 0.6 m (for maximal spatial coverage). A set of four reflection images per object were recorded in order to allow the calculation of reflectance values: (I) white reference bar (Spectral Imaging Ltd.) with horizontal size and vertical level similar to the object area; (II) dark current image; (III) image of the object area of interest with optimized exposure time; and (IV) dark current image of the object area.
Hyperspectral images were recorded from leaves without visible water droplets on the surfaces. Leaf surfaces of plants incubated under 100% RH for 14 h overnight in order to induce P. viticola sporulation had to be dried under ambient conditions for >6 h before measurements.

2.6.2. Processing of Hyperspectral Data

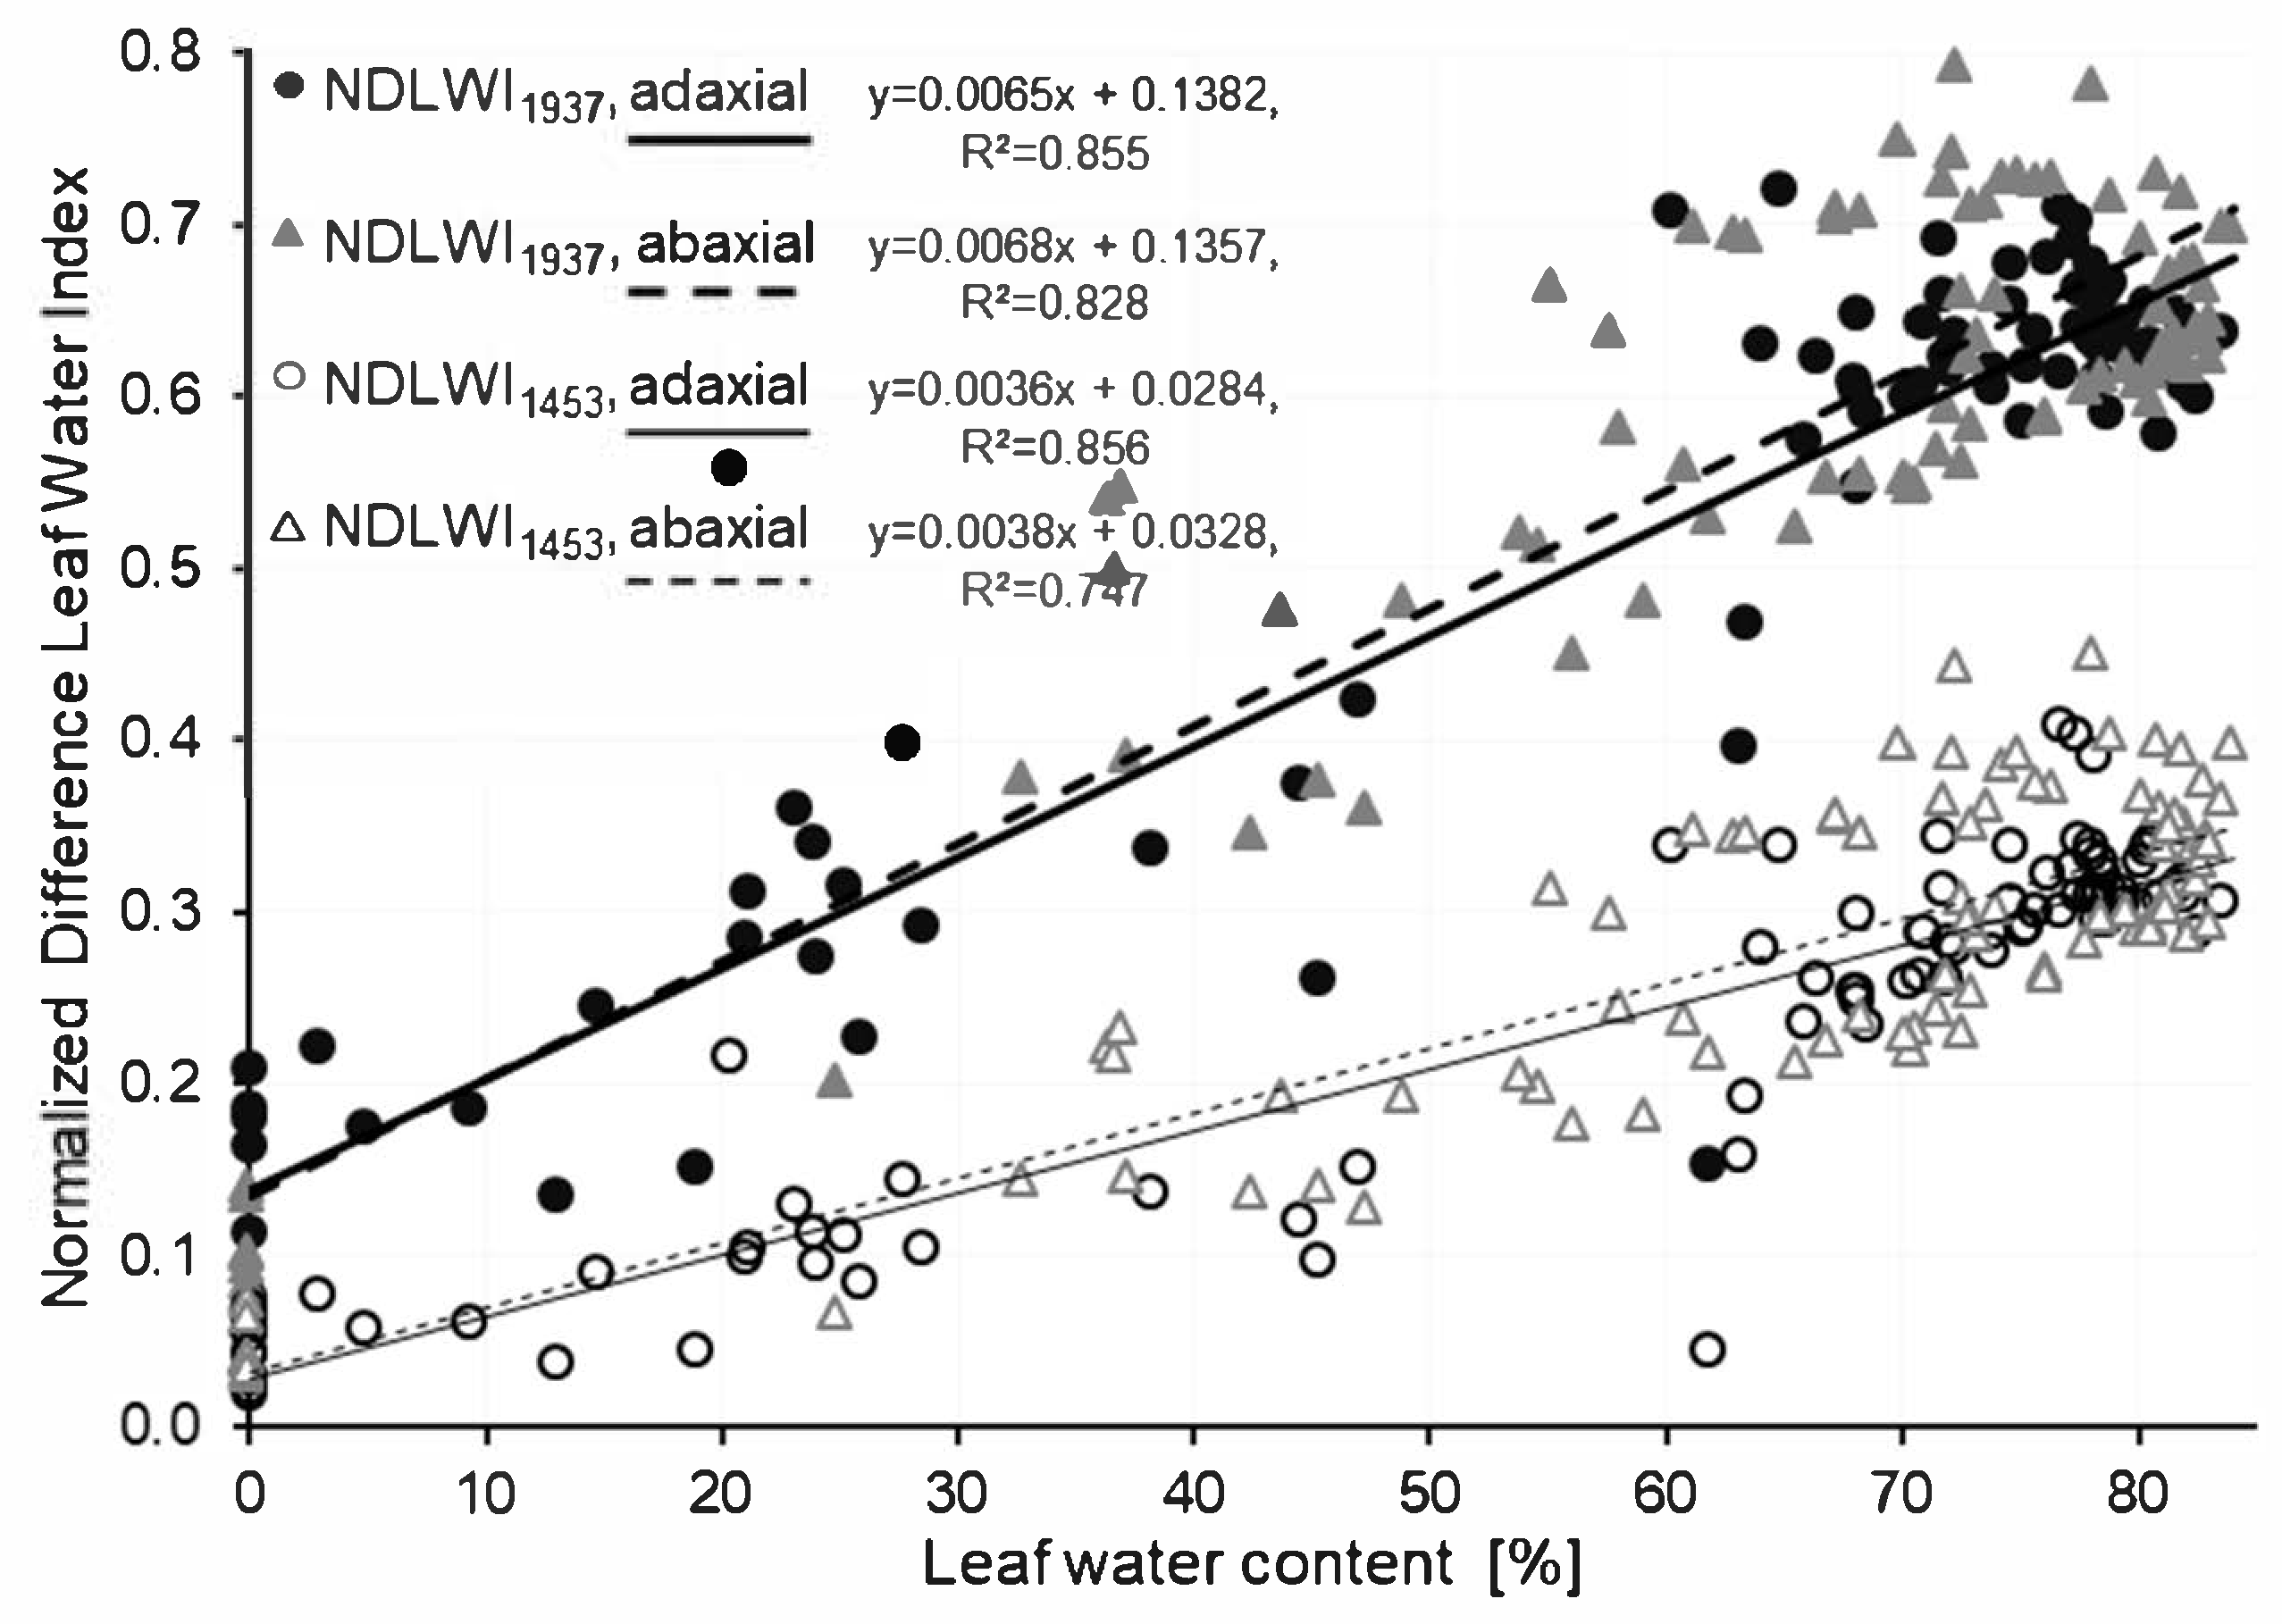
The raw image data (reflection values, 240 wavebands in the range from 997 to 2500 nm) were converted into hyperspectral reflectance images using the software ENVI + IDL 5.0 (EXELIS Visual Information Solutions, Boulder, CO, USA). Data from the 4 images of an object were imported and normalized by a customized IDL tool. Spectral vegetation indices—Normalized Difference Leaf Water Index (NDLWI) values—were calculated using the values of the water absorption bands at 1453 nm (band #82) and 1937 nm (band #159), respectively, and 1124 nm (near infrared, band #30) for normalization: NDLWI1453 = (R1124 − R1453)/(R1124 + R1453) and NDLWI1937 = (R1124 − R1937)/(R1124 + R1937), respectively.
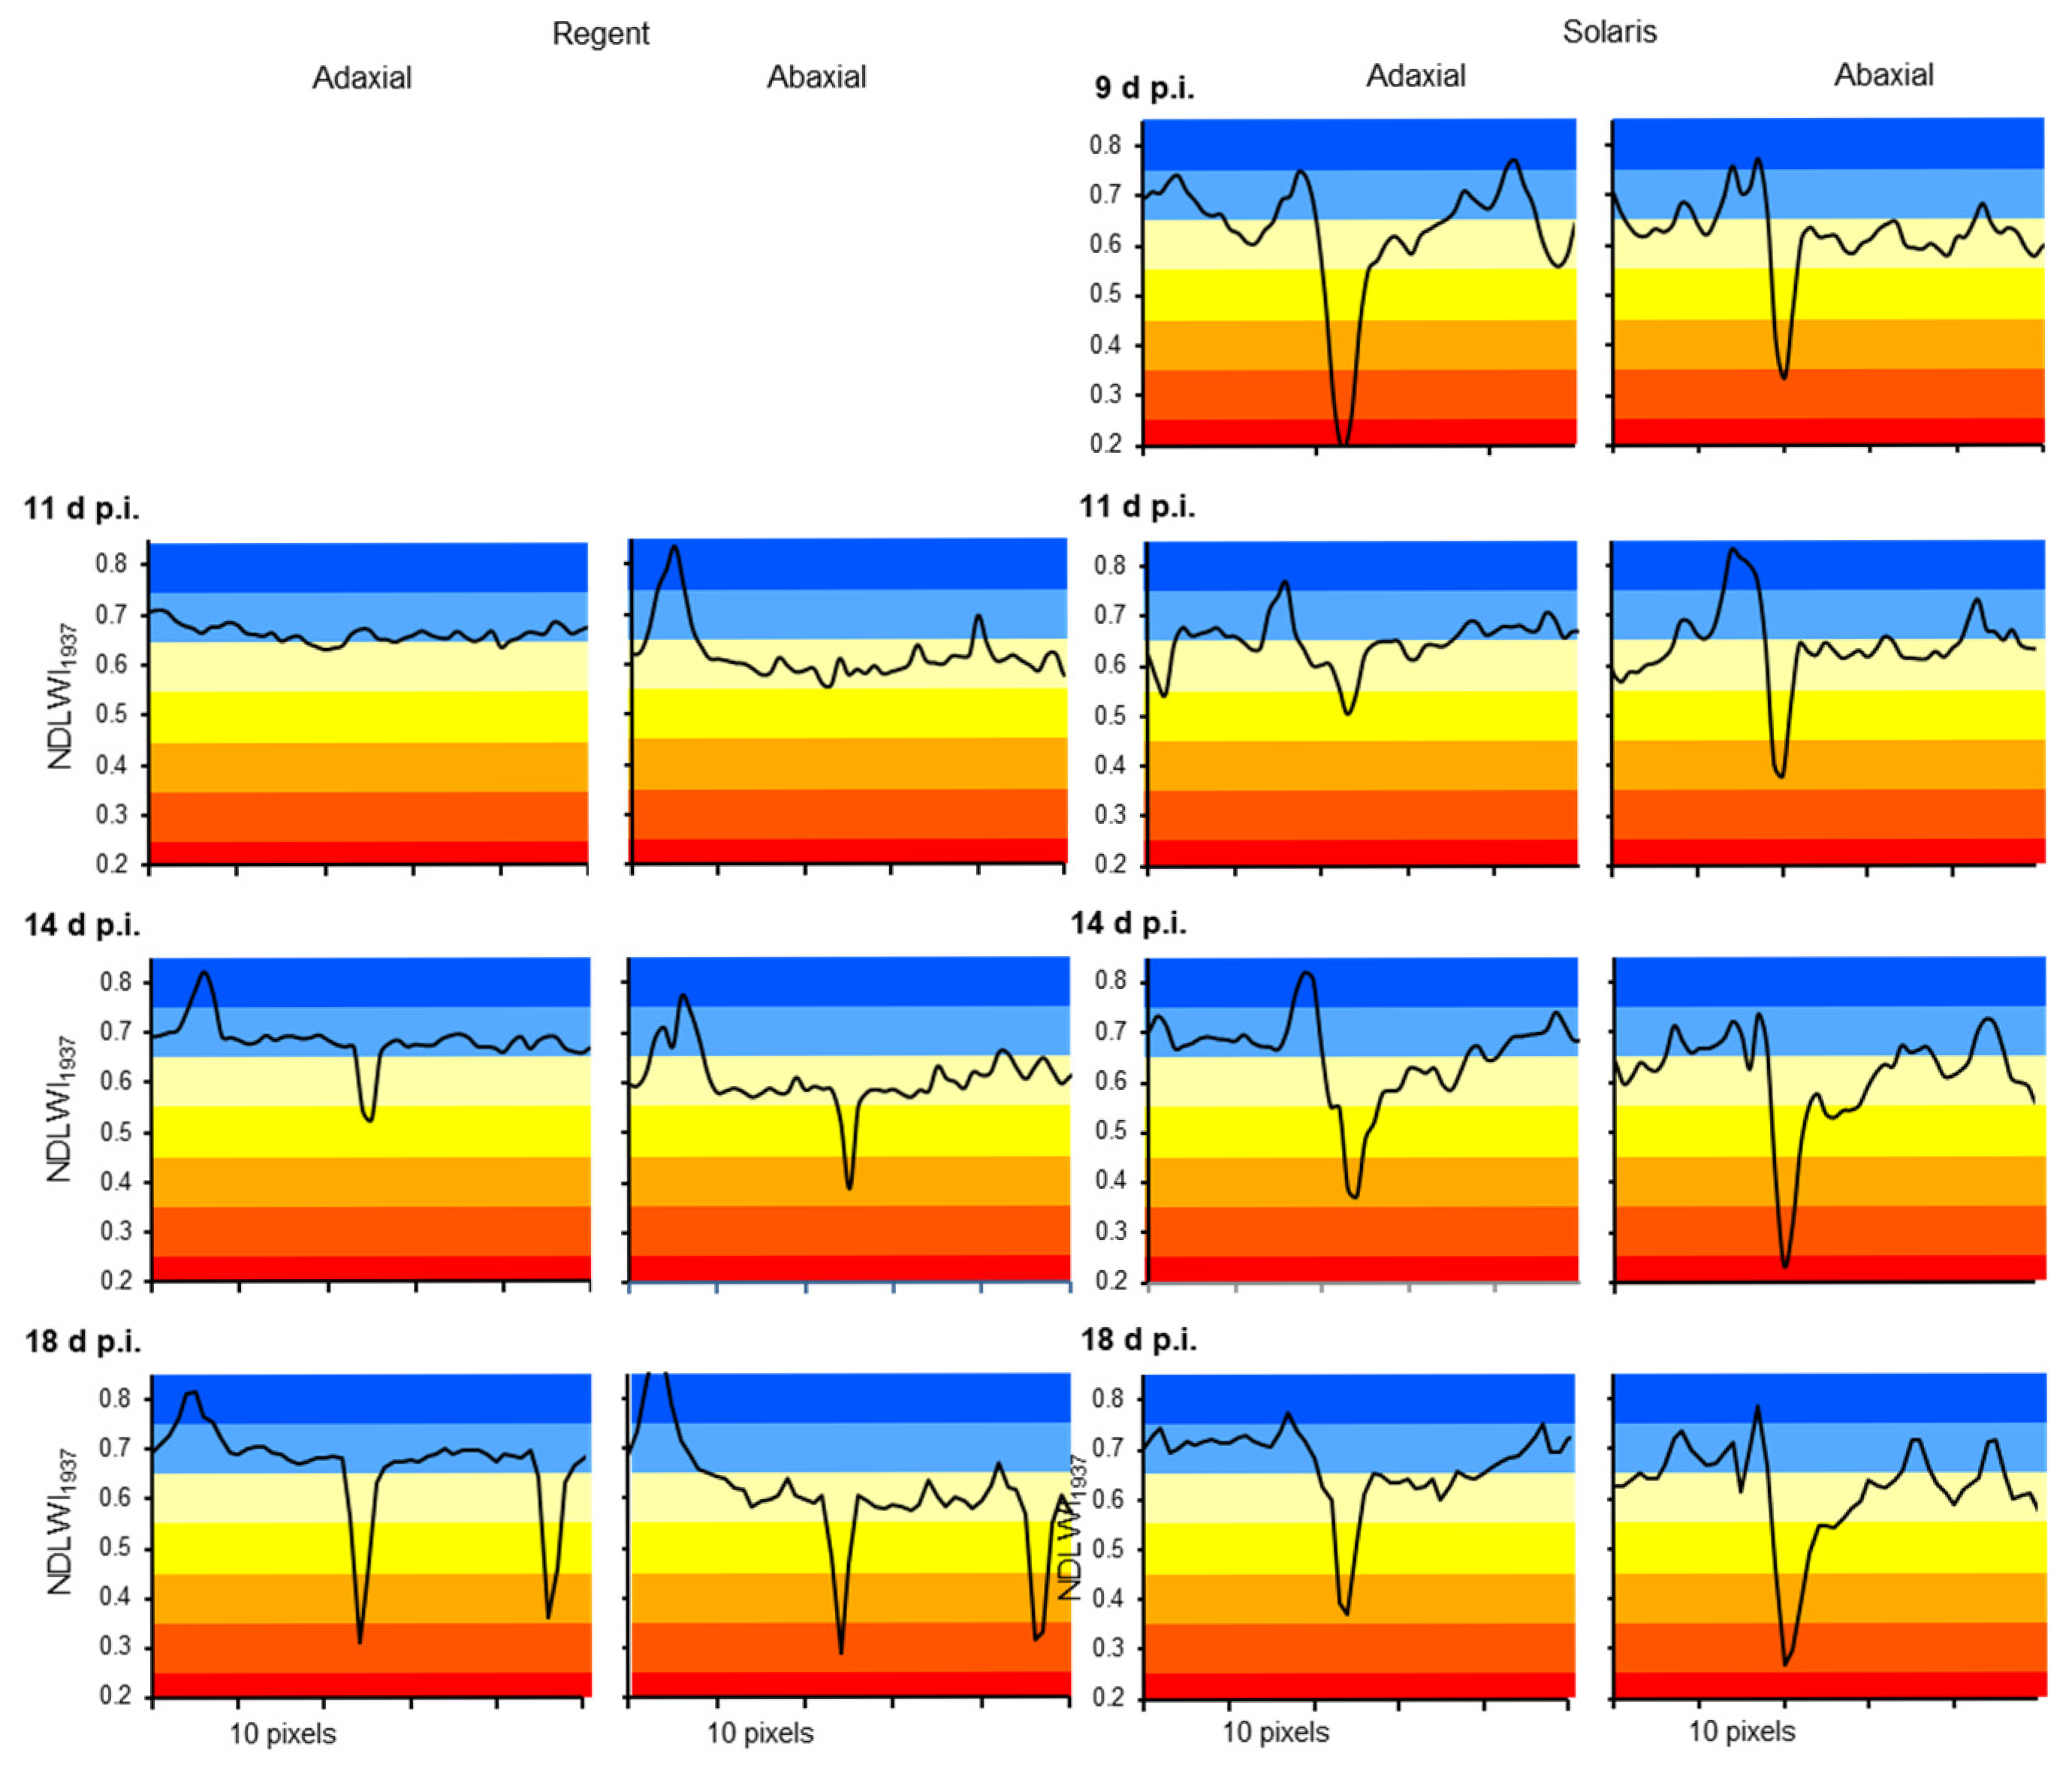
Graphic illustrations of x-profiles and y-profiles along transects through leaf areas were prepared after data transfer from ENVI + IDL to Excel.

2.7. Calibration of Normalized Difference Leaf Water Indices

Non-inoculated young and mature leaves of grapevine (cv. Mueller-Thurgau) attached to the plants—with optimal leaf water content—and after detachment and drying for 2, 5, and 8 h, respectively, were recorded with the hyperspectral SWIR camera using a working distance of 60 cm. Young leaves (n = 10) dried under ambient air conditions (20–22 °C, 50% RH), mature leaves (n = 10) were dried at 40 °C in a drying chamber at maximum ventilation. After spectral recording, the weight of leaves was measured gravimetrically. After the fourth hyperspectral measurement, all leaves were desiccated to dryness at 70 °C for 14 h, and the dry matter of leaves was measured after equilibration with ambient air.
Marking the perimeter of the leaves recorded, averaging the spectral information of these regions of interest (ROIs), and extracting the reflectance values at 1124 nm, 1453 nm, and 1937 nm yielded the spectral information for the calibration curves NDLWI1453 vs. leaf water content and NDLWI1937 vs. leaf water content, respectively. Due to the venation of the grapevine leaf, ROIs included varying percentages of leaf veins and intercostal areas, respectively.

2.8. Statistical Analysis

For statistical analysis, individual grapevine leaves were used as the experimental unit. Statistical analyses were conducted using the software SPSS Statistics vers. 26.0 (IBM Germany GmbH, Ehningen, Germany). Data were tested for normal distribution and equality of variances using the Shapiro–Wilk test and Levene’s test, respectively. For normally distributed data, a standard ANOVA was performed. For significant F-values, mean comparisons were performed using the Tukey–Kramer test at a significance level of p ≤ 0.05. T-test statistics (significance level p ≤ 0.05) were applied to detect significant differences between healthy and infected leaves as well as adaxial and abaxial leaf sides. Data series were related to each other by the Pearson correlation coefficient (r). All experiments were conducted in biologically independent repetitions at least twice.

3. Results

3.1. Relationship Between Leaf Water Content and Normalized Difference Leaf Water Index

Spectral information of non-inoculated grapevine leaves (cv. Mueller-Thurgau) recorded before detachment and after different times of drying, respectively, and gravimetric leaf water content (LWC) values of these leaves were combined to generate calibration curves for the relationship between the Normalized Difference Leaf Water Index (NDLWI). Reflectance at 1453 nm (R1453) and R1937, representing water absorption bands, were used, as well as R1124—the maximum reflectance of grapevine leaves in the NIR range –for normalization. For calibration, young and mature grapevine leaves were used, and reflectance was recorded for the adaxial and the abaxial leaf side, respectively, in separate experiments (Figure S1). As leaf age had no significant effect, data for young and mature leaves were combined into general calibration curves, which had high coefficients of determination (R²) for both indices (Figure 1). With a stronger slope than NDLWI1453, NDLWI1937 was used for all following experiments. The difference in the calibration curves between adaxial and abaxial leaf sides was consistent, but statistically not significant.
As the regression between LWC and NDLWI1937 was calculated from mean values (of both parameters) from leaves with varying portions of leaf veins and intercostal areas differing in tissue thickness and water content, spectral index values were used instead of derived LWC values to investigate the effect of P. viticola infections on the spatial patterns of leaf water content heterogeneity of grapevine leaves. Only for average values per leaf, LWC was calculated from NDLWI1937. For images with high spatial resolution, LWC values were not used because of the heterogeneity in the thickness of grapevine leaf tissue varying among and within leaves (Figure S2).
In order to characterize the origin of the spectral leaf water signal, effects of the background (color) of the recorded leaves and of the stacking of leaves differing significantly in LWC were examined (Figure 2). Black and white paperboard below the recorded leaf differed in their effects on leaf reflectance in the SWIR range, which, in response, had a strong effect on the NDLWI values derived. However, a black background resulted in reflectance values very similar to those of leaf areas recorded “without” background (black background 0.35 m below the rack carrying the leaves) represented by the rectangle in the center of leaves, a white background substantially increased reflectance values as well as NDLWI values by about 0.2 units. Therefore, all hyperspectral images were recorded using a stage of fine black fibers (3 × 4 cm spacing) supporting the grapevine leaves to be imaged. The stacking of dried and naturally hydrated leaves in both combinations indicated that the origin of the SWIR signal (and NDLWI value) was the top leaf layer, provided the time of contact between tissues differing in hydration was short, and that the contribution of lower layers to the signal was neglectable (Figure 2b).

3.2. Effect of Plasmopara viticola Development on Spatial Pattern of Grapevine Leaf Water Content in Compatible Interaction

Depending on inoculum density and greenhouse temperature, Plasmopara viticola caused typical downy mildew symptoms—formation of whitish sporangia on the abaxial leaf side, sometimes in combination with oil flecks on the adaxial side—5 to 8 days post-inoculation (d p.i.) on cv. Mueller-Thurgau. These symptoms occurred only after induction of sporulation by spells of high RH (100% RH for 14 h overnight). Without sporangia induction, intensive tissue colonization by P. viticola caused spots with reduced chlorophyll content, slight wilting symptoms of leaves, and tissue damage in later stages (11–18 d p.i.).
The effect of downy mildew development on the leaf water status of cv. Mueller-Thurgau leaves was investigated in a series of hyperspectral images with the first images recorded 5 d p.i. (Figure 3; all sub-figures in Figure S3a–e). The water content of non-diseased leaf blades was characterized by high values of main veins, lower values of veins of higher order, and tapering off to intercostal areas and the leaf margin. Focusing on the abaxial leaf side where sporangia—when induced—protrude through stomata, the longitudinal analysis revealed severe effects on leaf water patterns at 9 d p.i., with NDLWI1937 dropping <0.55 for large areas of infected leaves. In earlier stages, the latent colonization had no effect on leaf water status. Inoculated leaves without induction of sporangia formation caused an increased heterogeneity of intercostal NDLWI1937 values at 9 d p.i., which developed into narcotization of leaf margins characterized by NDLWI1937 values < 0.3 in later stages. This phenomenon was much stronger for leaves with sporulation, even after mechanical removal of sporangia. This treatment indicated that the sporangia themselves did not contribute to the low NDLW values.
At higher magnification and with smaller steps of NDLWI1937 levels in water content visualization, first modifications in the leaf water pattern due to P. viticola were observed 7 d p.i. when first sporangia appeared on the abaxial leaf side (Figure 4a). Large parts of the leaf were still free from sporangia and had a rather homogenous NDLWI1937 pattern, especially when visualized at full range (0.05–0.85) of NDLWI1937 values. With narrow steps in the range 0.45 to 0.85, the leaf map indicated several spots with NDLWI1937 values < 0.55. The comparison of SWIR information with RGB images confirmed the spatial coincidence of reduced leaf water content and sites of sporangia formation. The permanent overlay of grapevine leaf parts resulted in a small area of increased NDLWI1937 values (Figure 4a, bottom right). Even higher spatial resolution enabled the precise assignment of NDLWI1937 values to infection sites. X- and Y-profiles of NDLWI1937 values along transects through sites of sporulation demonstrated the highly localized—4 and 8 pixels (=0.13 and 0.25 mm), respectively—reduction of leaf water content (Figure 4b). The effect on NDLWI1937 intensified with the size of the sporulating area from 0.45–0.50 to 0.40–0.45.
In case the formation of abaxial sporangia was not induced, progress in downy mildew pathogenesis resulted in decreased chlorophyll content and heterogenous leaf water content 9 d p.i. (Figure 5a,c). NDLWI1937 values exhibited higher within-leaf variation, but not a modified level—except for some spots with reduced LWC at the margin. Non-inoculated control leaves had the typical pattern of veins high in LWC, intercostal areas with values 0.1 to 0.15 units lower, and reduced water content values tapering off to the leaf margin. Leaf colonization associated with strong abaxial sporangia formation by P. viticola caused a large-scale decrease in the water content of intercostal areas and veins (of higher order) by 0.1–0.2 NDLWI1937 units and desiccation of marginal leaf tissue (NDLWI1937 values < 0.3; Figure 5d,e). The water content of non-diseased tissue of infected leaves was very similar to that of non-infected leaves. Mechanical removal of the desiccated sporangia caused a slight increase in abaxial NDLWI1937 values.
The negative effect of P. viticola on the water status of compatible grapevine leaves depended on the severity of downy mildew symptoms per leaf and was even promoted by spells of 100% RH, inducing abundant sporangia formation on abaxial leaf sides (Figure 6). Although more pronounced on the abaxial side, the effect of downy mildew on the pattern of leaf water status could also be measured on the adaxial side, even at 7 d p.i. when downy mildew reduced NDLWI1937 values by 0.2 units or less. The desiccation of leaf margins and tissue spots in later stages caused identical NDLWI1937 values < 0.3 on both leaf sides. As NDLWI1937 of adaxial sides was always about 0.05 units higher than that of abaxial sides—irrespective whether infected or not—the contrast in leaf water contact between affected and non-affected areas was stronger for the adaxial side (Figure S3). LWC of veins of strongly damaged grapevine tissue indicated a still functional system of water transport.

3.3. Effect of Plasmopara viticola Development on Spatial Patterns of Water Content of Grapevine Leaves in Interactions with Reduced Compatibility

The partially resistant grapevine cultivars Regent and Solaris responded to P. viticola infection with the formation of tiny spots of brownish tissue, which were visible on both leaf sides irrespective of RH during plant growth after inoculation. These symptoms of resistance appeared 7 to 11 d p.i. and progressed with time in a cultivar-dependent manner.
First experiments on the influence of P. viticola infection of cvs. Regent and Solaris with partial downy mildew resistance were not successful, as the spatial resolution of the sensor system was not sufficient when the working distance was 0.6 m (0.67 mm per pixel; Figure 7a). The tiny brownish tissue spots (Ø 1–2 mm) on leaves were clearly visible in RGB images. In corresponding NDLWI1937 images, however, they were hardly detected or not at all. Imaging data with the best spatial resolution available—0.34 mm per pixel, working distance 0.3 m—were suitable to detect and to characterize the spots of resistance reactions for both host genotypes (Figure 7b–e). NDLWI1937 profiles of the affected leaf tissue of both V. vinifera cultivars demonstrated a sharp and strong decline in water content with NDLWI1937 values as low as 0.3. The spatial dimension of this effect was strictly limited—2 to 6 pixels—and the water content of neighboring tissue was not affected.
Longitudinal studies covering the development of tissue reaction of both partially resistant cultivars for the period 5 to 18 d p.i. revealed no effects of P. viticola infection before spots of brown tissue appeared. The number and size of brownish spots of leaf tissue increased with time (Figure S4). Detailed analysis of NDLWI1937 images of cv. Regent revealed first tissue reactions 11 d p.i. and an increase in the number and size of spots, which were sharply confined and strongly reduced in water content (Figure 8). The development over time was very similar on both leaf sides and was in agreement with observations of symptoms in RGB images. The small step size in the visualization of NDLWI1937 values (0.05 units per color) confirmed the local character of the infection effect. The size of one spot increased from 1 pixel 11 d p.i. to 5 and 7 pixels 14 and 18 d p.i., respectively, another spot grew from 3 to 6 pixels within 4 days after first appearance.
Tracking of individual spots on leaves for the period 7 to 18 d p.i. demonstrated different progress in the effect of resistance reaction to P. viticola infection on the water status of spots of cv. Solaris (Figure 9). Although the reduction in water content of colonized tissue was detectable on both leaf sides already 9 d p.i., the area and the degree of water content reduction varied with the leaf side. On the adaxial side, brownish tissue started with a large area of NDLWI1937 values < 0.55 (e.g., 26 pixels), but this area decreased to 6 pixels within the next 7 d. On abaxial side, the spot size of NDLWI1937 values < 0.55 was smaller (10 pixels) 9 d p.i. and increased to 21 18 d p.i. RGB images gave no evidence for changes in the size of brown spots; however, some spots revealed the transient deposition of amorphous material on the abaxial side 11 d p.i.
Profiles of NDLWI1937 values along transects through individual leaf spots caused by P. viticola infection indicated a rapid decrease of leaf water content from 0.65–0.70 to 0.45–0.55 and 0.30–0.35 at 14 and 18 d p.i., respectively (Figure 10). The size of the affected tissue area increased with the level of NDLWI1937 reduction. Brown spots of cv. Solaris had a strong reduction in leaf water content in the early stage, a transient resurge 11 d p.i. (when deposits on the stomata reduce stomatal transpiration) and a subsequent aggravation and attenuation—in both the level of reduction and the area affected—of the effect on water content for the abaxial and adaxial leaf sides, respectively.

3.4. Reassessment of Water Content Differences Between Adaxial and Abaxial Leaf Sides

Consistently lower NDLWI1937 values of abaxial leaf sides prompted the question whether this difference really indicated significant differences in the water status across small distances between palisade parenchyma and spongy parenchyma (leaf thickness 0.2–0.3 mm) or if it was due to changes in reflectance characteristics of plant tissue in the NIR range. Spectra of leaf tissue from grapevine cultivars Mueller-Thurgau, Regent, and Solaris, non-inoculated and 8 d p.i. P. viticola-infected, respectively, were analyzed in more detail (Figure 11). Averages of four ROIs with >6500 pixels per treatment (cultivar × leaf side × infection) revealed that the spectral difference between the sides of leaves at 1124 nm was larger than the differences among grapevine genotypes. Differences in leaf thickness among cultivars could not be retrieved in the spectra. The water absorption band at 1937 nm exhibited higher values (=lower water content) for the abaxial than for the adaxial leaf side (Figure 11a). Substantial sporangia formation on the abaxial side of Mueller-Thurgau leaves increased adaxial R1124, had no effect on abaxial value, and increased both R1937 values. Therefore, the effect of downy mildew on mean NDLWI1937 per leaf was not significant (Figure 11b). Little formation of tiny brown spots on the leaves of cv. Regent had no significant effect on adaxial and abaxial leaf spectrum and NDLWI1937, whereas substantial formation of brown spots of cv. Solaris reduced both R1124 values and R1937 values and resulting in NDLWI1937 values significantly different among treatments (Figure 11d).
Separate assessment of NDLWI1937 for leaf veins (first and second order) and intercostal areas, respectively, for adaxial and abaxial leaf surfaces of the three grapevine cultivars confirmed that intercostal areas had abaxial NDLWI1937 values significantly (p < 0.01) lower than the corresponding adaxial areas (Figure 12). The veins of these leaves showed the opposite effect with higher abaxial NDLWI1937 values. Assuming an area ratio of 0.8:0.2 between intercostal area and veins for grapevine leaves, the differences between adaxial and abaxial NDLWI1937 values per leaf were +0.034, +0.059, and +0.038 for cvs. Mueller-Thurgau, Regent, and Solaris, respectively. This effect explains the higher contrast of abaxial leaf sides in NDLWI1937 visualizations, which was consistent for the three genotypes during these studies.

4. Discussion

4.1. Relationship Between Leaf Water Content and NDLWI1937

The Normalized Difference Leaf Water Index for grapevine uses the water absorption band at 1940 nm and the maximum NIR reflectance at 1124 nm, and is very similar to the NDLWI established for apple leaves [25]. Proximal sensing enables the use of SWIR water absorption bands without the risk of corruption of the water signal on its path from leaf to sensor. Normalization by a NIR waveband proved to be very useful when studying the variation of this spectral information depending on grapevine genotype and leaf tissue variability. The greater y-axis intercept of the NDLWI1937 as compared to apple leaves is likely to result from the inclusion of young grapevine leaves, which had higher reflectance of dried leaves than older ones. The higher tissue variability of grapevine leaves covering intercostal areas and veins of several orders also contributed to a lower coefficient of determination of the regression line for grapevine leaves (0.855 compared to 0.918 for apple leaves; Figure S2). As downy mildew pathogens primarily produce abaxial disease symptoms, a calibration curve was also established for the lower leaf side of grapevine leaves in a separate experiment, which was almost identical to the relationship for the adaxial side.
Grapevine genotypes significantly differed in the thickness of leaf tissue and veins, and intercostal areas caused considerable variability of tissue thickness within leaves. Although the normalization of the leaf water index using the sum of both wavebands proved to increase its robustness to tissue variability and illumination conditions, NDLWI1937 was used to visualize patterns of the leaf water status of infected leaves instead of LWC values calculated from the calibration curve. The variability in the relationship between spectral information and leaf water content resulted from using mean values for both the water content of whole leaves and averages of spectral information. Although spectral information may be sub-classified easily to veins (of various orders) and intercostal areas, it is hard to obtain the ground truth of the water content of specific leaf parts. The use of LWC values calculated from the calibration curve for maps of the leaf water status would neglect the effect of within-leaf variability. Moreover, the relative differences displayed in NDLWI1937 maps were used for leaves of grapevine cultivars differing in leaf thickness.
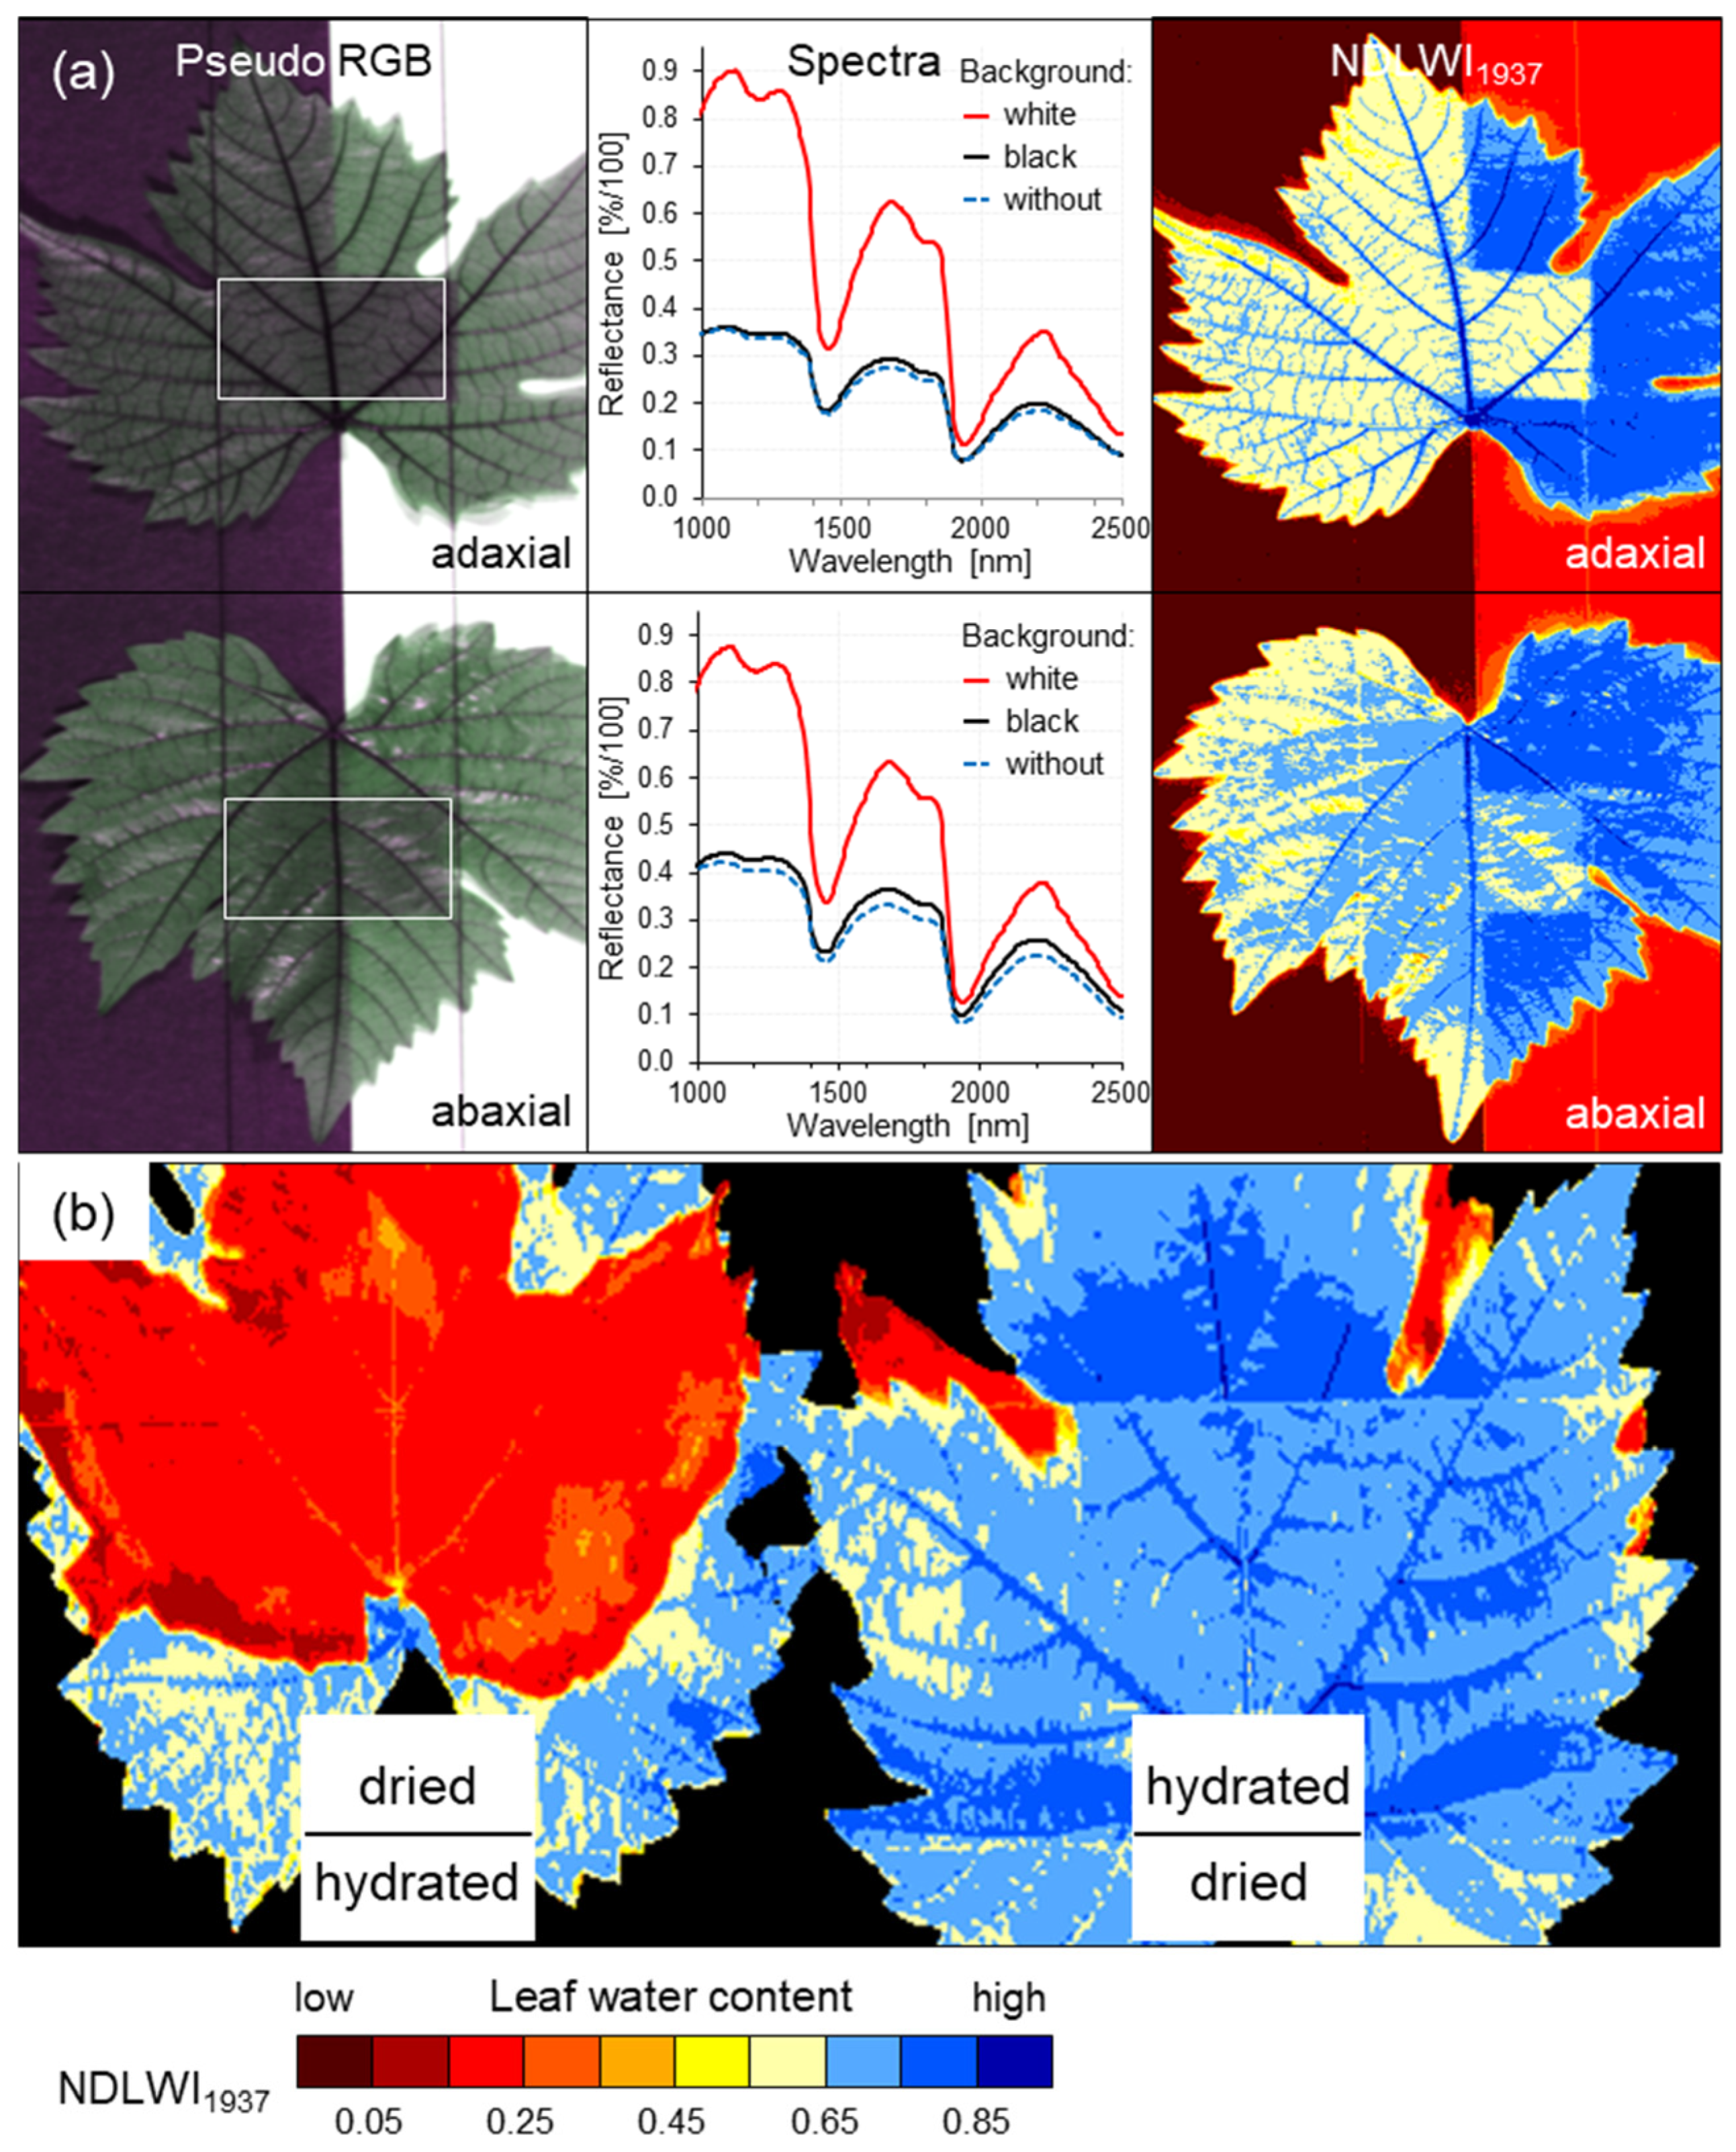
Interestingly, experiments with different backgrounds and with the stacking of leaves varying in leaf water content demonstrated that the reflection of the normally transmitted part of the irradiation by a white and dry background significantly increased SWIR reflectance and NDLWI1937 values by 0.15 to 0.20 units. Using a non-reflecting background about 0.35 m below the measured leaf, grapevine tissue with a leaf water content strongly differing from that of the leaf of interest above, in contrast, had hardly any effect on the spectral information of the incoming signal. This lack of influence suggested that back-scattering SWIR originates from the upper part of irradiated tissue. The idea was supported by slightly increased NDLWI1937 values for permanently overlapping parts of grapevine leaves where the lower tissue impairs the water loss through transpiration of the upper tissue.

4.2. Effects of Leaf Side

Adaxial leaf sides of grapevine leaves had significantly higher mean NDLWI1937 values than corresponding abaxial sides, irrespective of grapevine genotype and health status of living plant tissue. This result confirmed earlier observations on apple leaves [25]. As valid for all cultivars, this observation was independent of leaf thickness. Interestingly, the difference between adaxial and abaxial tissue water content was observed only for living intercostal tissue. Necrotic tissue did not exhibit this difference.
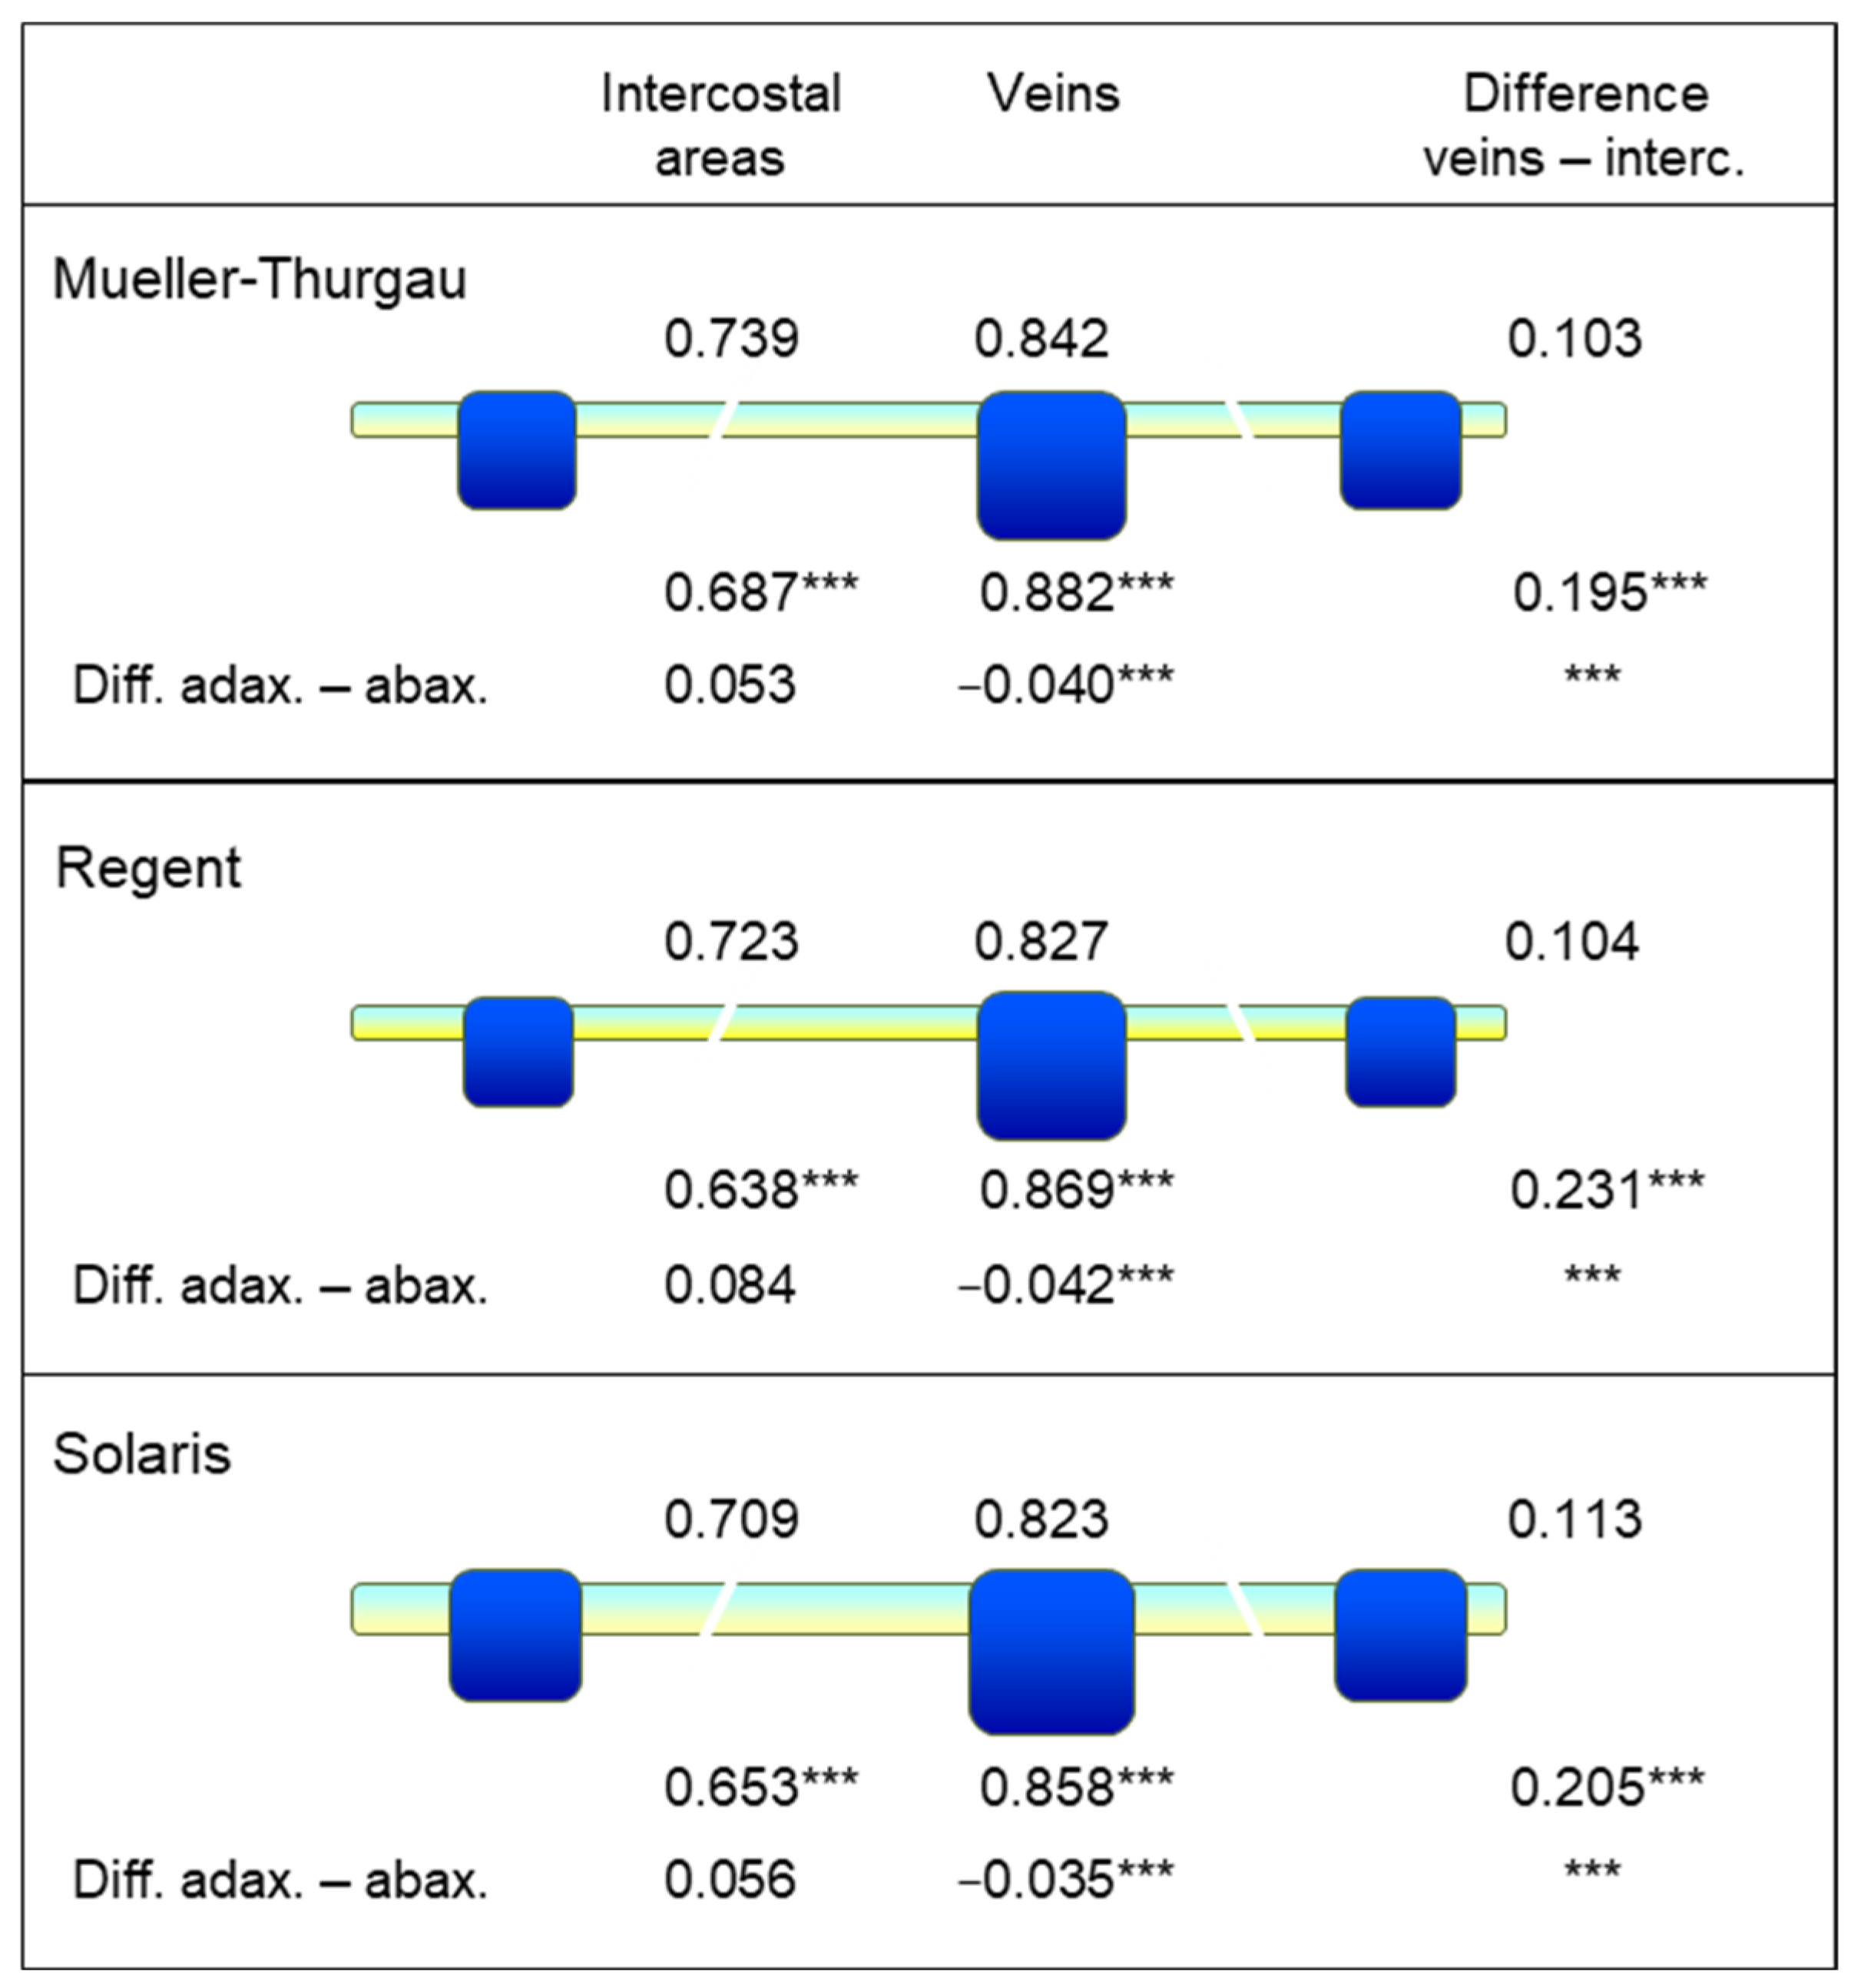
A more detailed data analysis confirmed this effect for the intercostal areas, whereas NDLWI
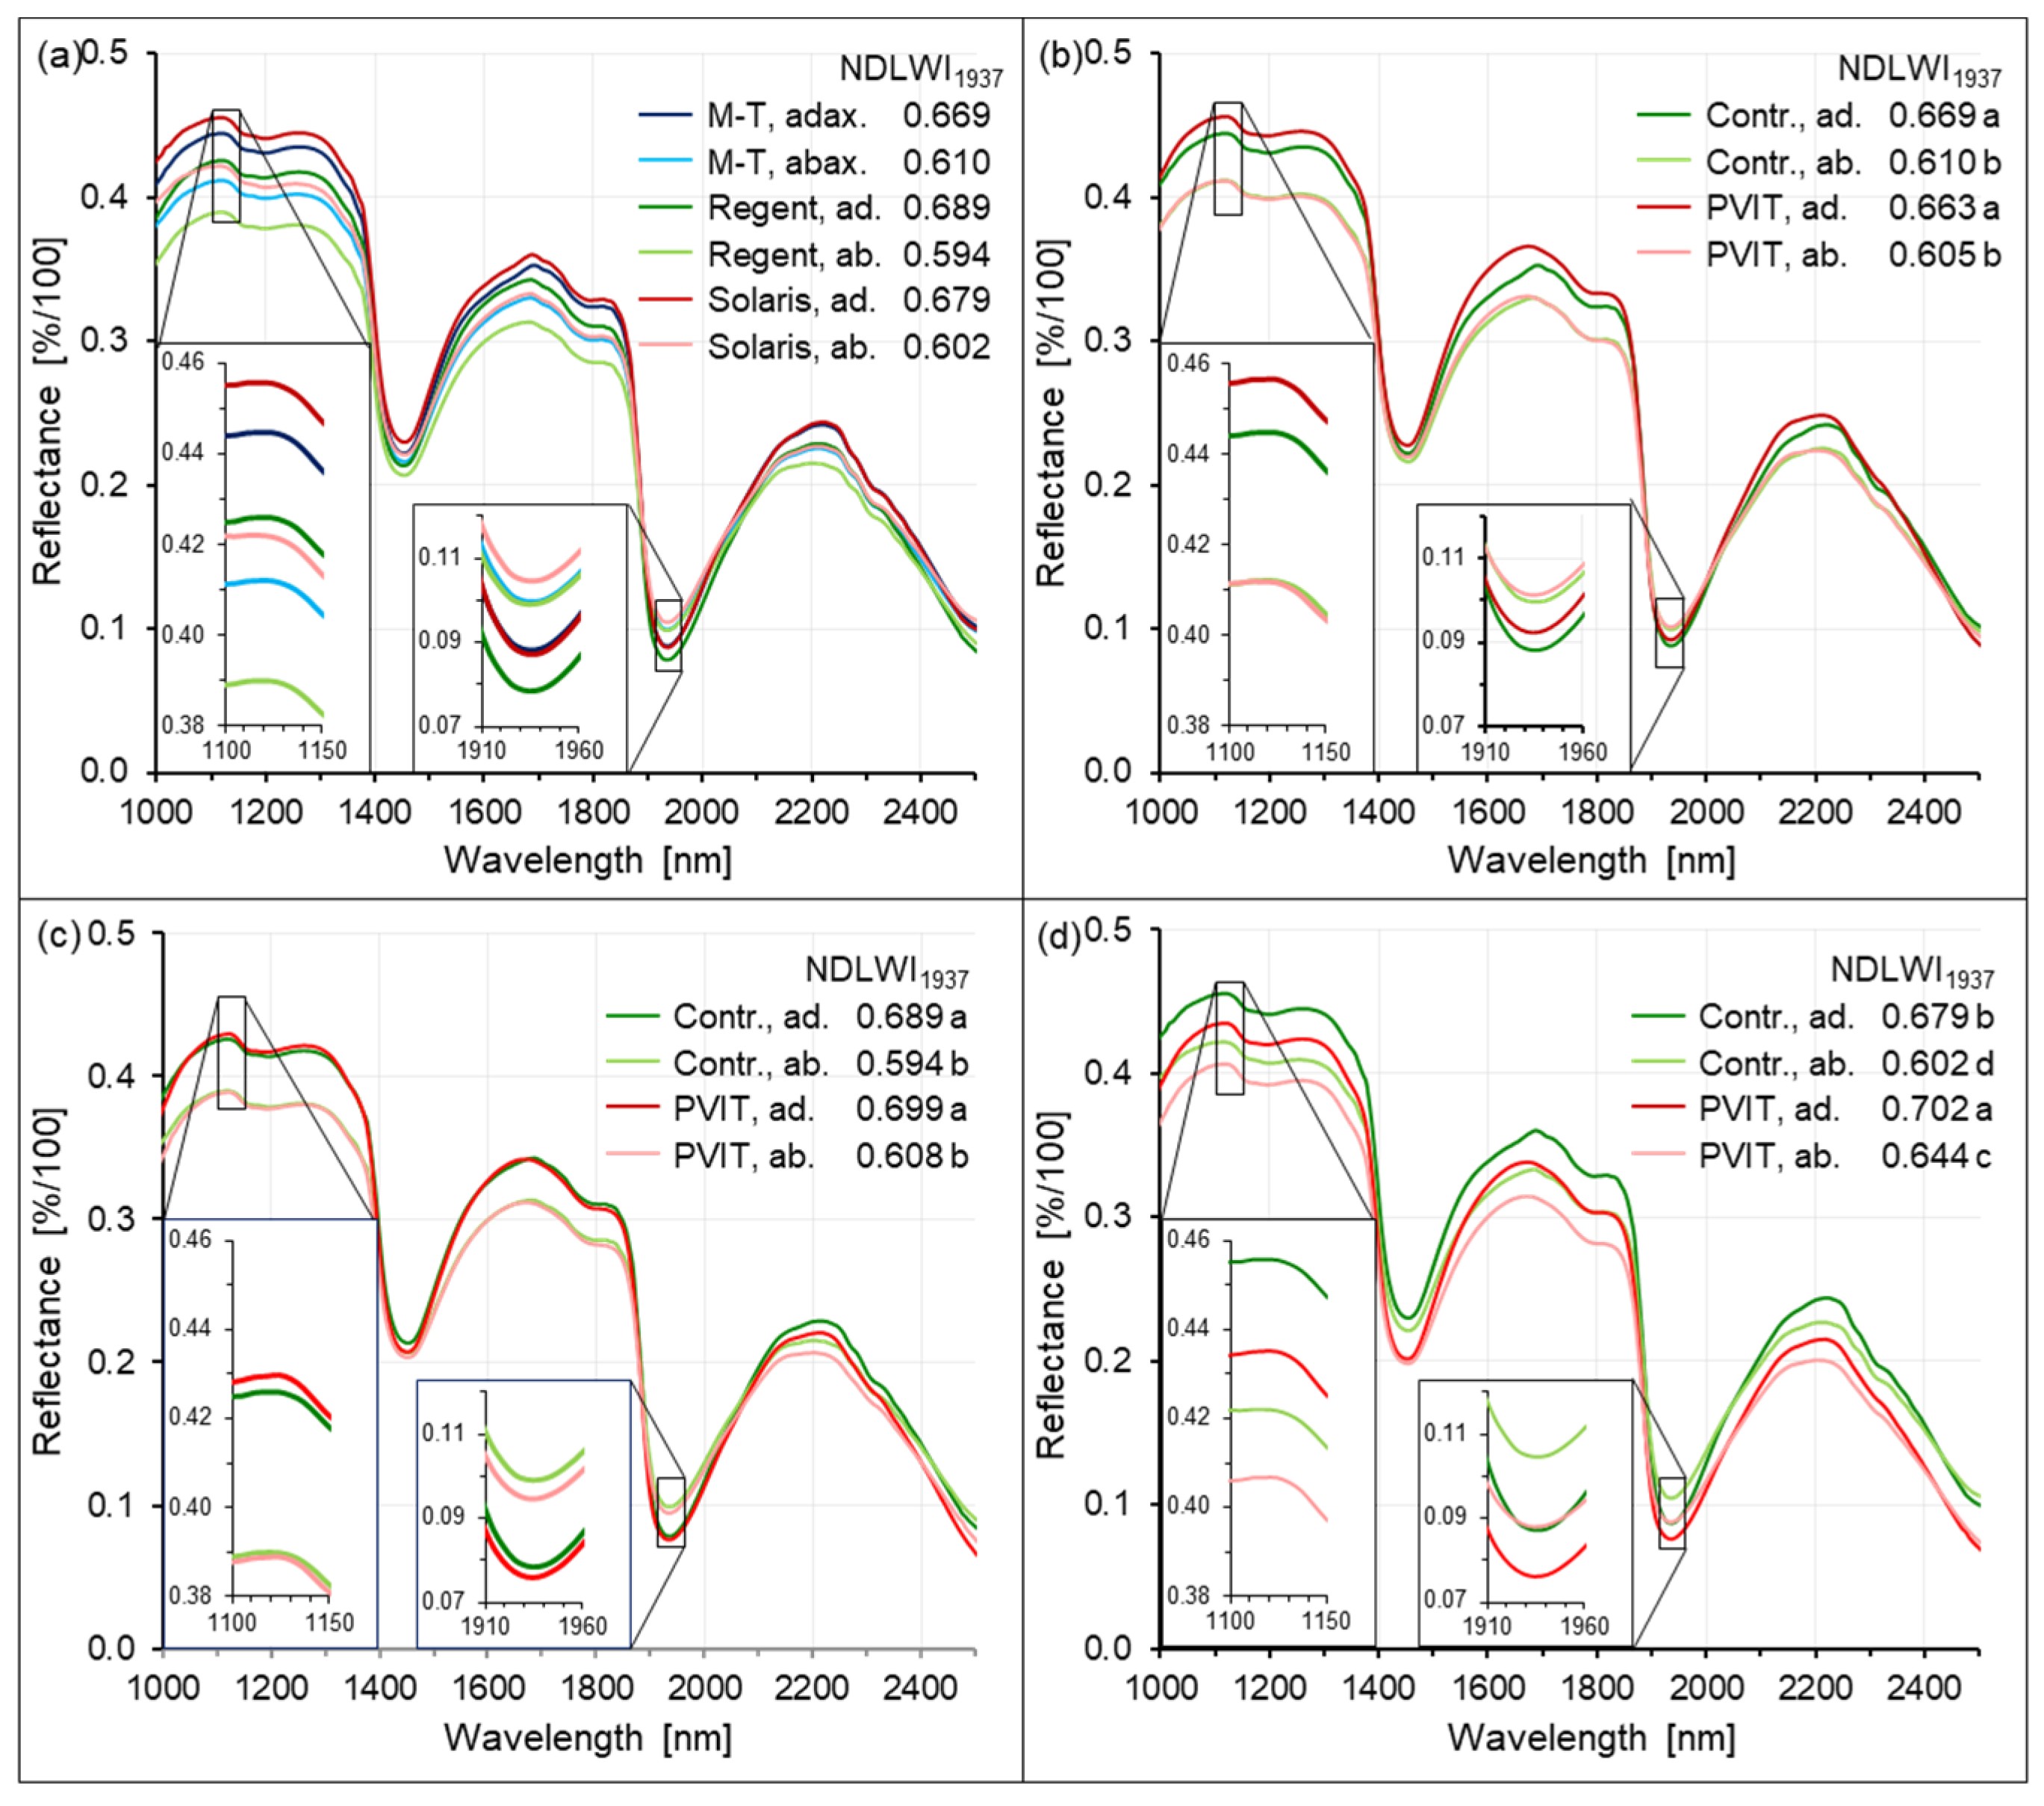
1937 values of leaf veins were higher for the abaxial leaf side. Reflectance spectra revealed that grapevine genotype, leaf side, and host tissue reaction to P. viticola infection affected reflectance in the NIR range (represented by R1124) as well as at the water absorption bands. By calculating NDLWI1937 as a proxy for the leaf water status on the tissue scale, the normalized difference index reliably eliminated spectral differences from tissue as influenced by the volume and structure of plant cells and the intercellular space typical for the bifacial leaves of dicotyledonous plant species [15]. The higher water content of adaxial leaf sides is likely to result from the combination of the compact cell layer of the palisade parenchyma, rich in cytoplasm and metabolically highly active, and the effectiveness of an intact cuticle as a water barrier. The spongy parenchyma of the adaxial leaf side, in contrast, comprises a high portion of intercellular spaces responsible for the allocation of CO2 and O2 within tissue and is the site where constantly liquid water is transformed into water vapor, which escapes the leaf through the stomata of the abaxial epidermal layer.
Vascular strands are located below the palisade parenchyma and protrude from the abaxial surface of intercostal areas, significantly in the case of lower-order veins (Figure S2). Localization, specific morphology (pear-shaped, prominent abaxial side considerably wider than adaxial side), and histological organization (less pronounced bifacial character, lack of stomata, large parenchymatic cells below the vascular bundle) of veins within the leaf plain result in a higher abaxial water content of veins. The higher contrast between veins and intercostal areas for the abaxial side confirms the fine differences in water content on a small scale. The ability to measure LWC differences between both sides of the same leaf can be explained only by the fact that reflectance from tissue near the surface directed to the sensor has a significantly higher contribution to the overall signal than lower tissue.

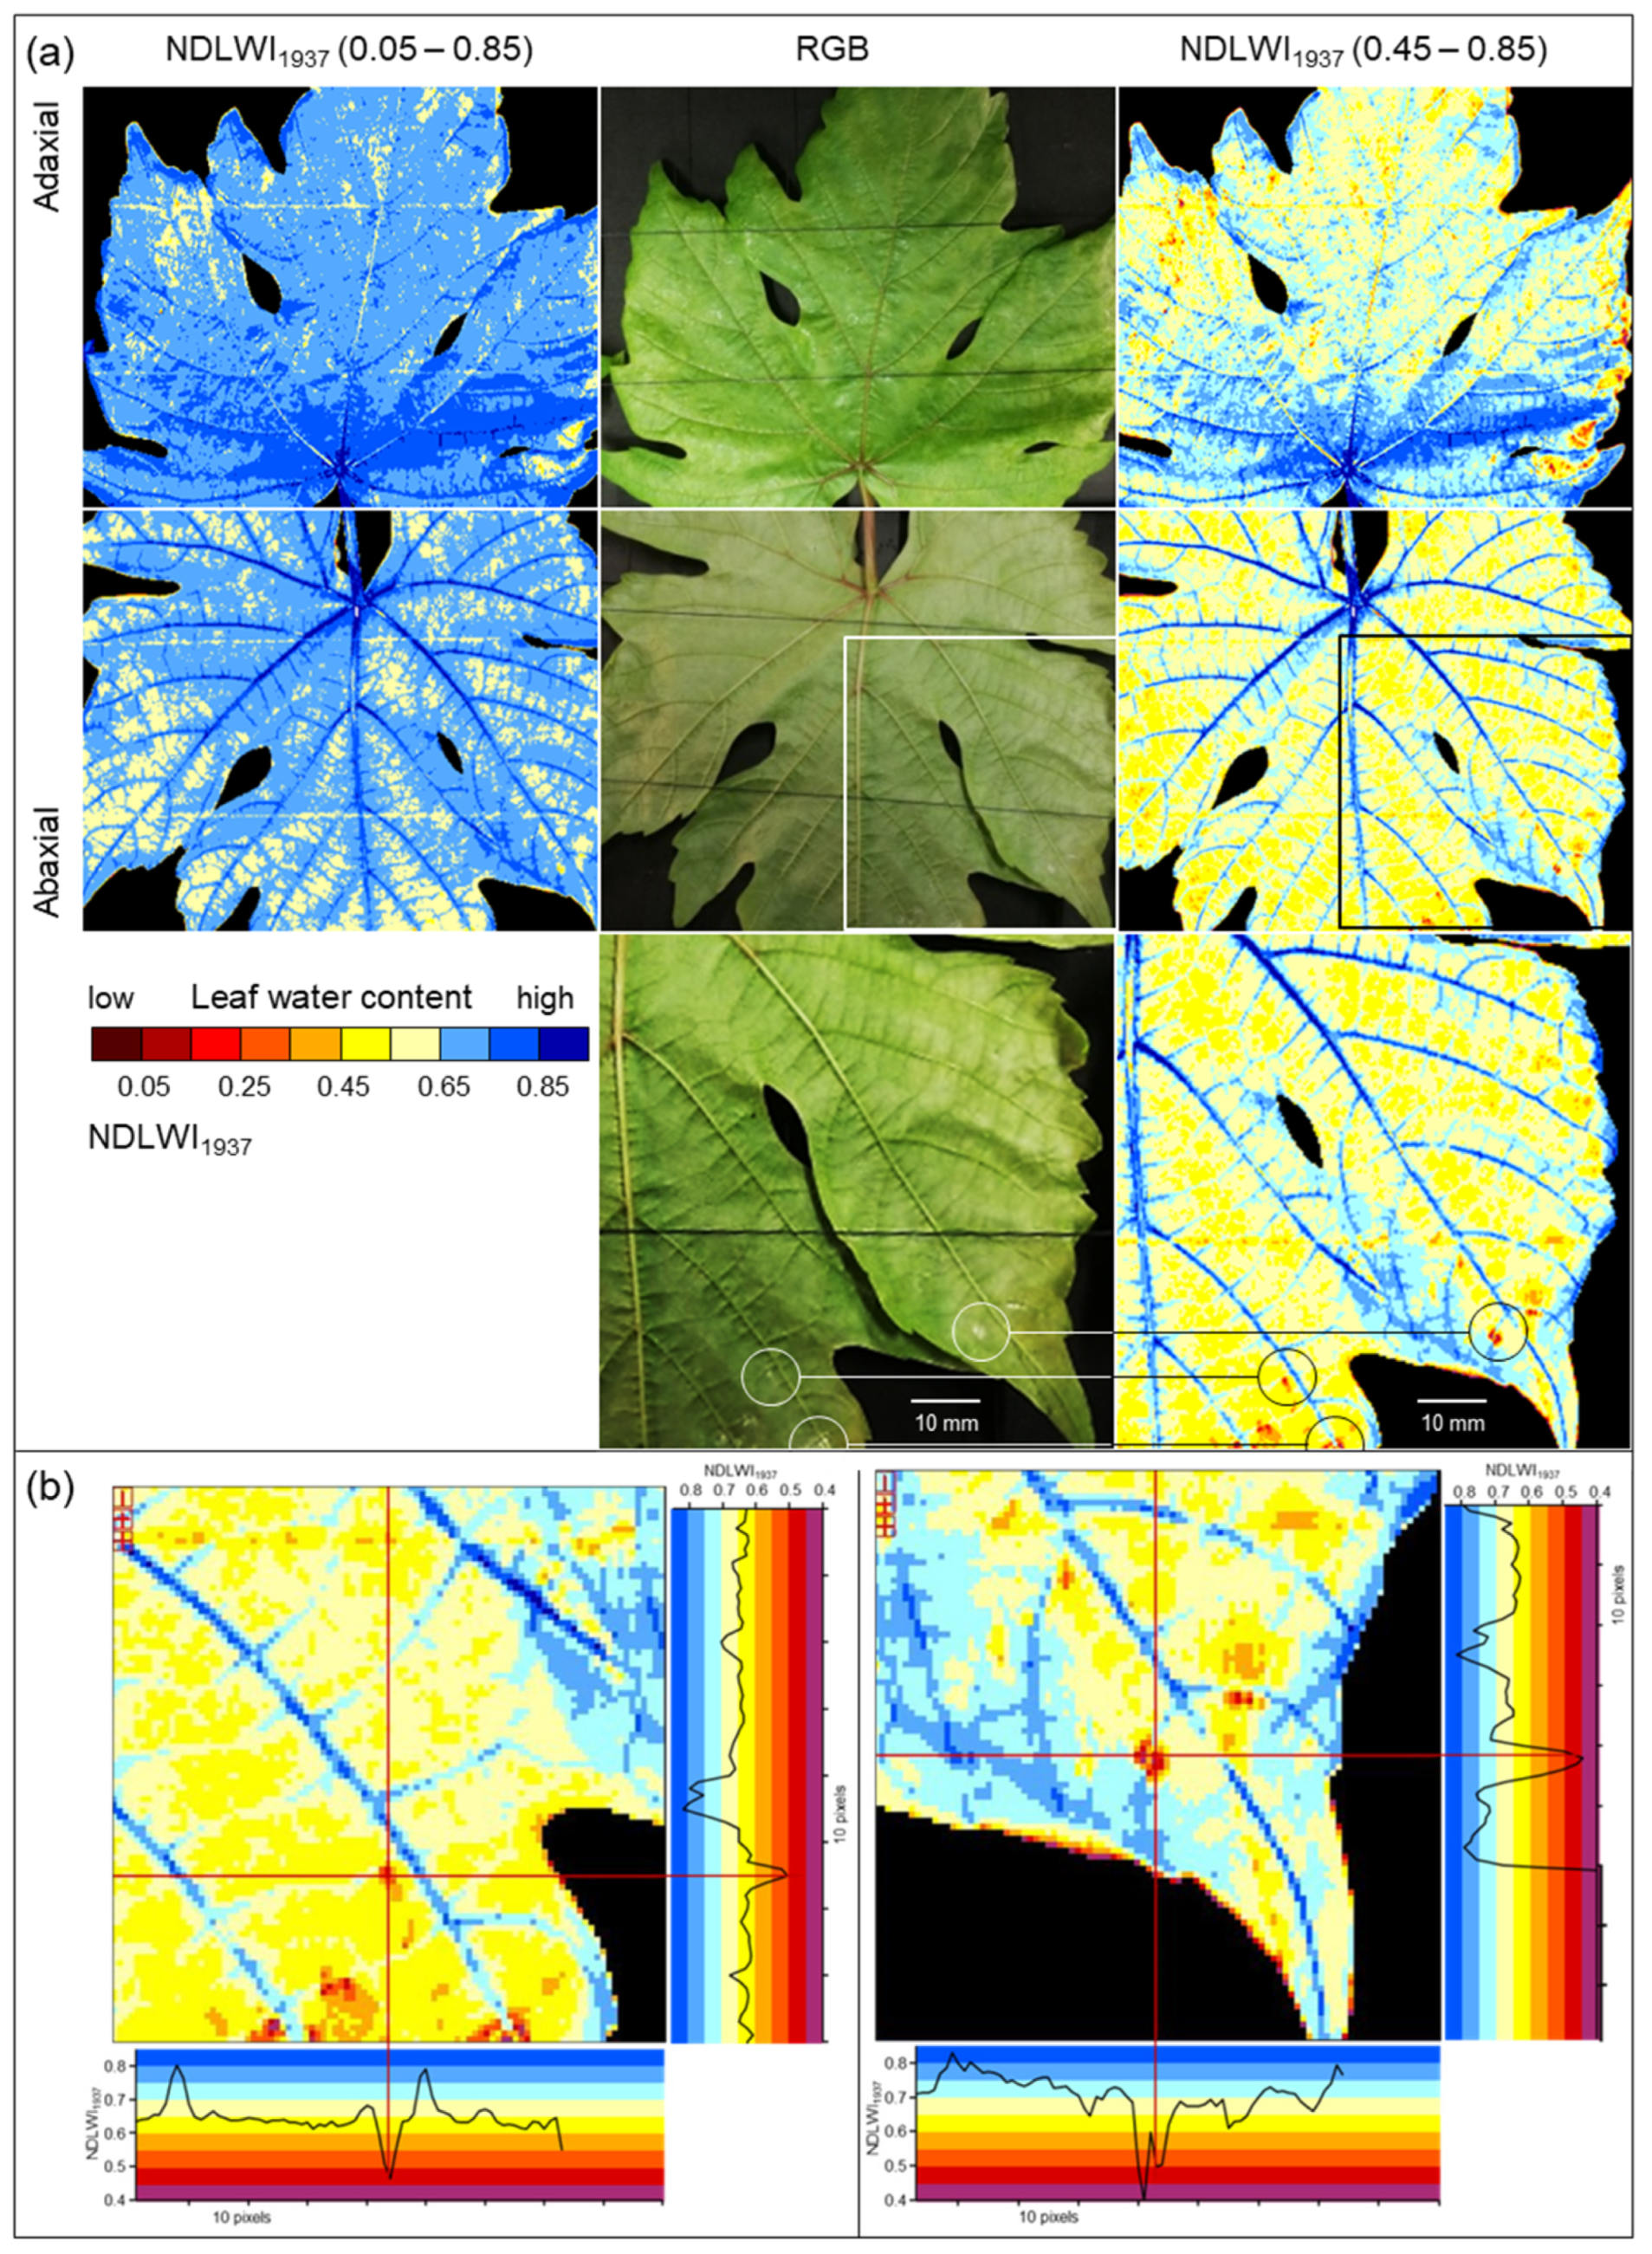
4.3. Spatial Resolution of Spectral Information

Compared to RGB cameras and hyperspectral sensor systems working in the VISNIR range, the spatial resolution of SWIR cameras is often considerably lower. This discrepancy may result in uncertainty whether no differences in SWIR data really indicate no effect on leaf water status or whether the effect is too small to be detected because of technical limitations. Spatial resolution limits the sensing system’s capability to detect small deviations from the normal status (healthy), i.e., in the case of plant pathology, to detect tiny primary disease symptoms with a diameter often <1 mm. Spectral anomaly may be small in spatial dimension as well as in spectral reflectance: The important role of spatial resolution in the detection and monitoring of brown leaf spots, i.e., the resistance reaction in interactions with reduced compatibility to P. viticola infection, highlighted that it also limits sensor sensitivity. The spatial resolution of the sensor (with squared sensing units) has to be high; the pixel size of reflectance images has to be smaller than a third of the diameter of the usually circular symptoms of pathogen infection. Only when spatial resolution was adequate could the full dimension of leaf water reduction due to the tiny spots of brown leaf tissue be assessed (Figure 13). For large-scale symptoms (of downy mildew sporangia or disease symptoms from other pathogens) or factors like nutrient supply, which affect all plant parts similarly, spatial resolution is not critical, and effects on plant water status may be detectable using non-imaging devices.
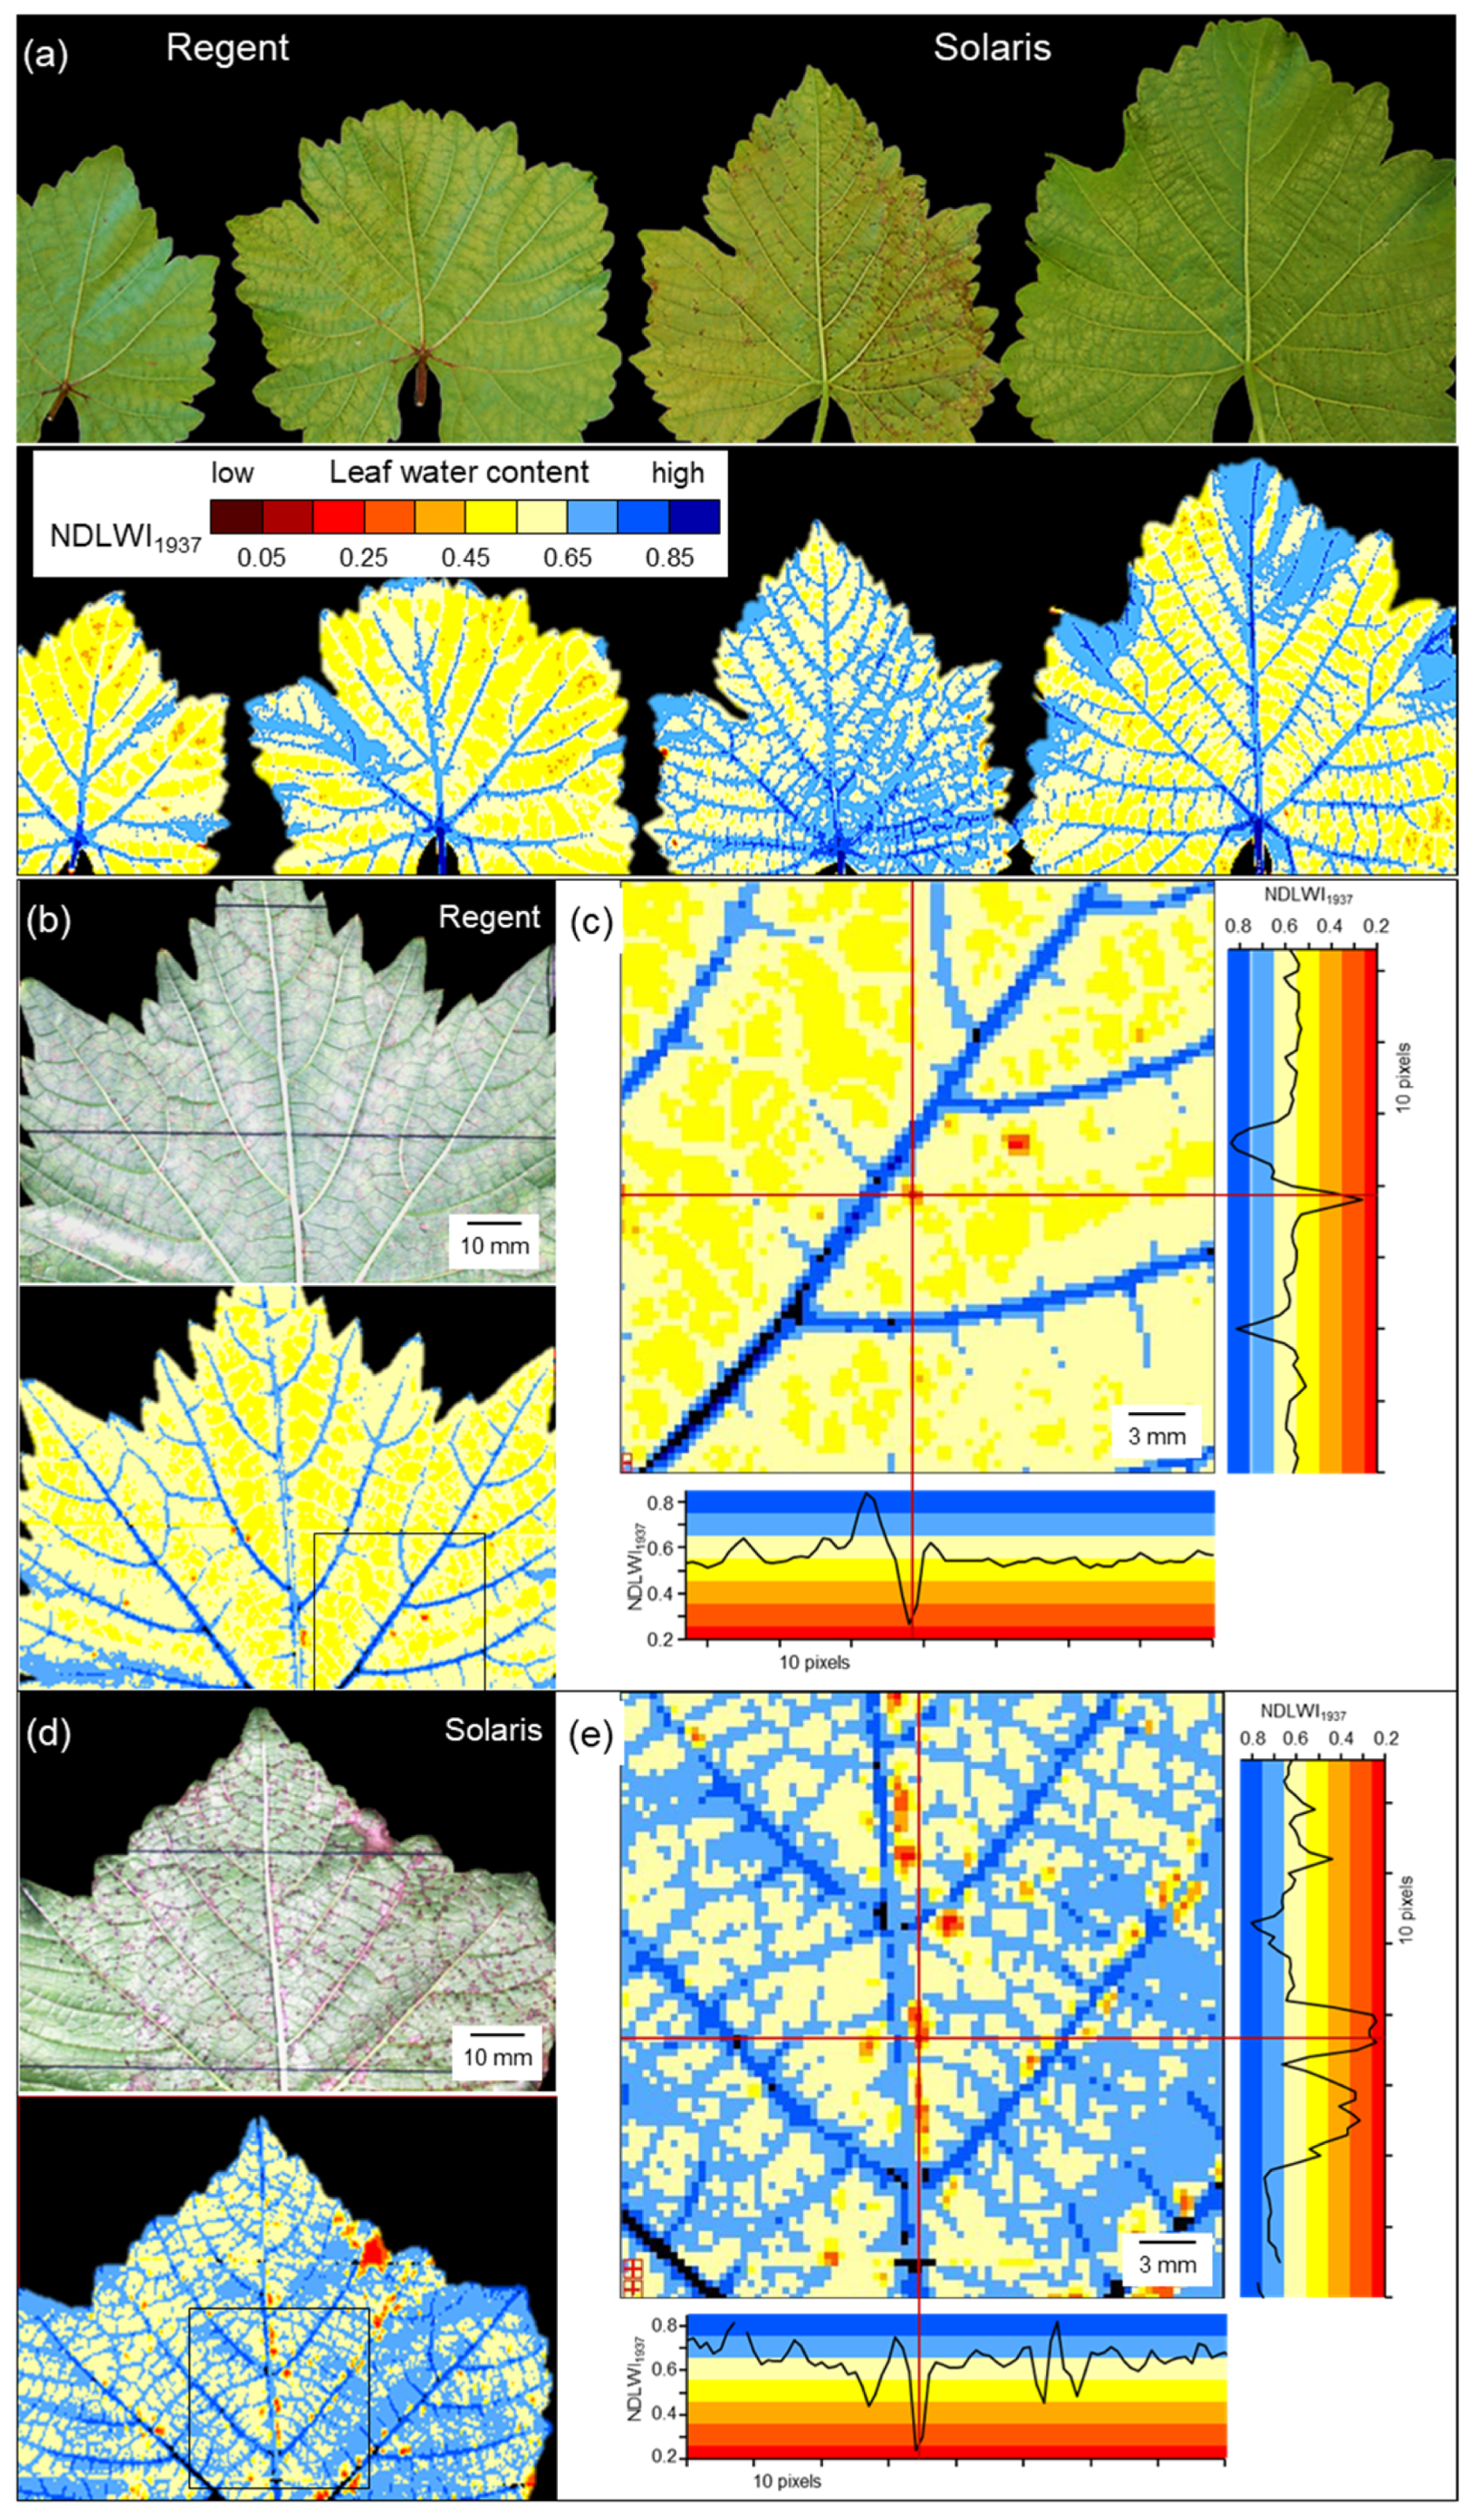
The highest spatial resolution of the SWIR camera was not only suitable to detect the tiny brown tissue spots in response to P. viticola infection, but also to quantify and differentiate between response levels. Brown tissue spots had NDLWI1937 values lower than grapevine tissue with abaxial downy mildew symptoms; however, levels were often higher than those of leaf necroses and water status of leaf spots varied with the time of pathogenesis, sometimes in both directions. This information is in agreement with observations of the little, but consistent development of biotrophic P. viticola in these brown spots of cvs. Regent and Solaris, which also results in pathogen sporulation and spread [37]. The transient resurge in the water content of cv. Solaris spots also indicated that brownish tissue differs from necroses and may represent a combination of necrotic and living cells. The area of brown spots visible in the VIS range differed from the area with modified tissue water content, stressing the difference between visible symptom and the effect on the water status as assessed from SWIR information.

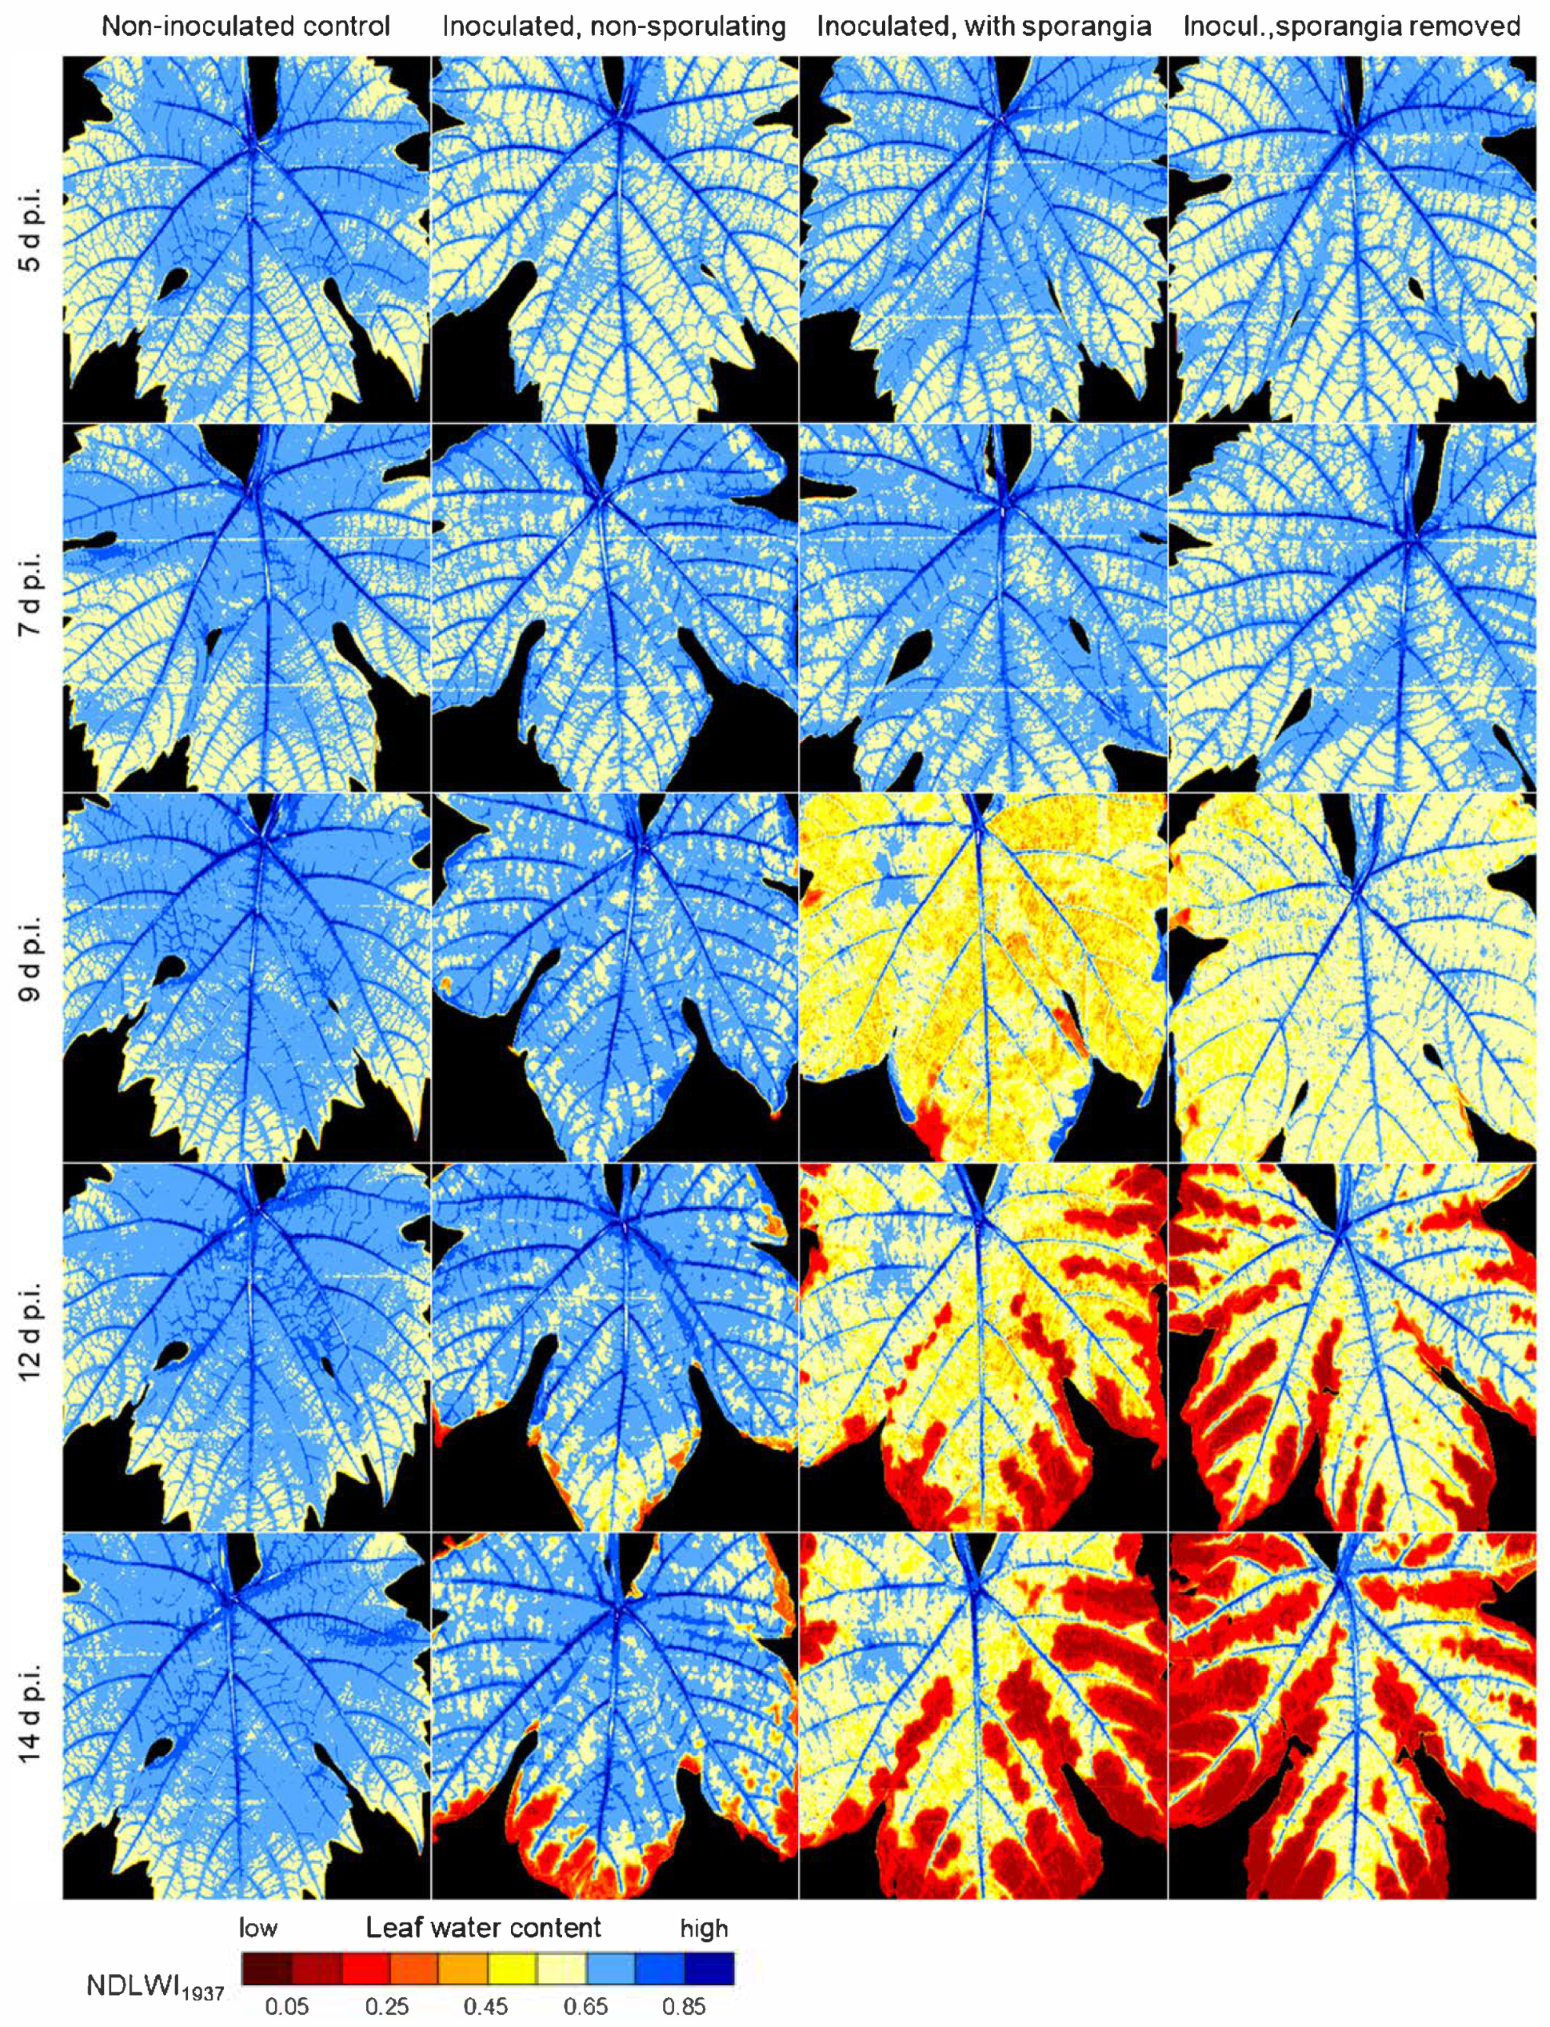
4.4. Leaf Water Response to P. viticola Infection

As expected, the leaf water status of grapevine leaves infected by the downy mildew pathogen P. viticola depended on the compatibility of the interaction. For partial resistant grapevine genotypes, infections resulted in the formation of tiny spots of brownish tissue associated with highly localized considerable LWC reduction; however, as the affected area generally remained small and LWC of non-infected tissue was hardly affected, the leaves maintained greenness and functionality. Disease resistance, though only partial, successfully protected leaves from severe damage and safeguarded their contribution to overall plant development.
The Rpv3-1-mediated resistance of cv. “Regent” is associated with a defense mechanism that triggers the synthesis of fungi-toxic stilbenes and programmed cell death [45]. Cultivar “Solaris” confers resistance to P. viticola associated with necrosis formation, callose deposition, and stilbene accumulation [46]. In the early stages of pathogenesis in cv. Solaris, the collapse of infected palisade cells largely restricts the expansion of P. viticola to the spongy parenchyma, where tissue colonization ultimately may result in the formation of sporangiophores with sporangia on the abaxial leaf surface [37,47]. The formation of callose and amorphous material on stomata has been reported to impede 
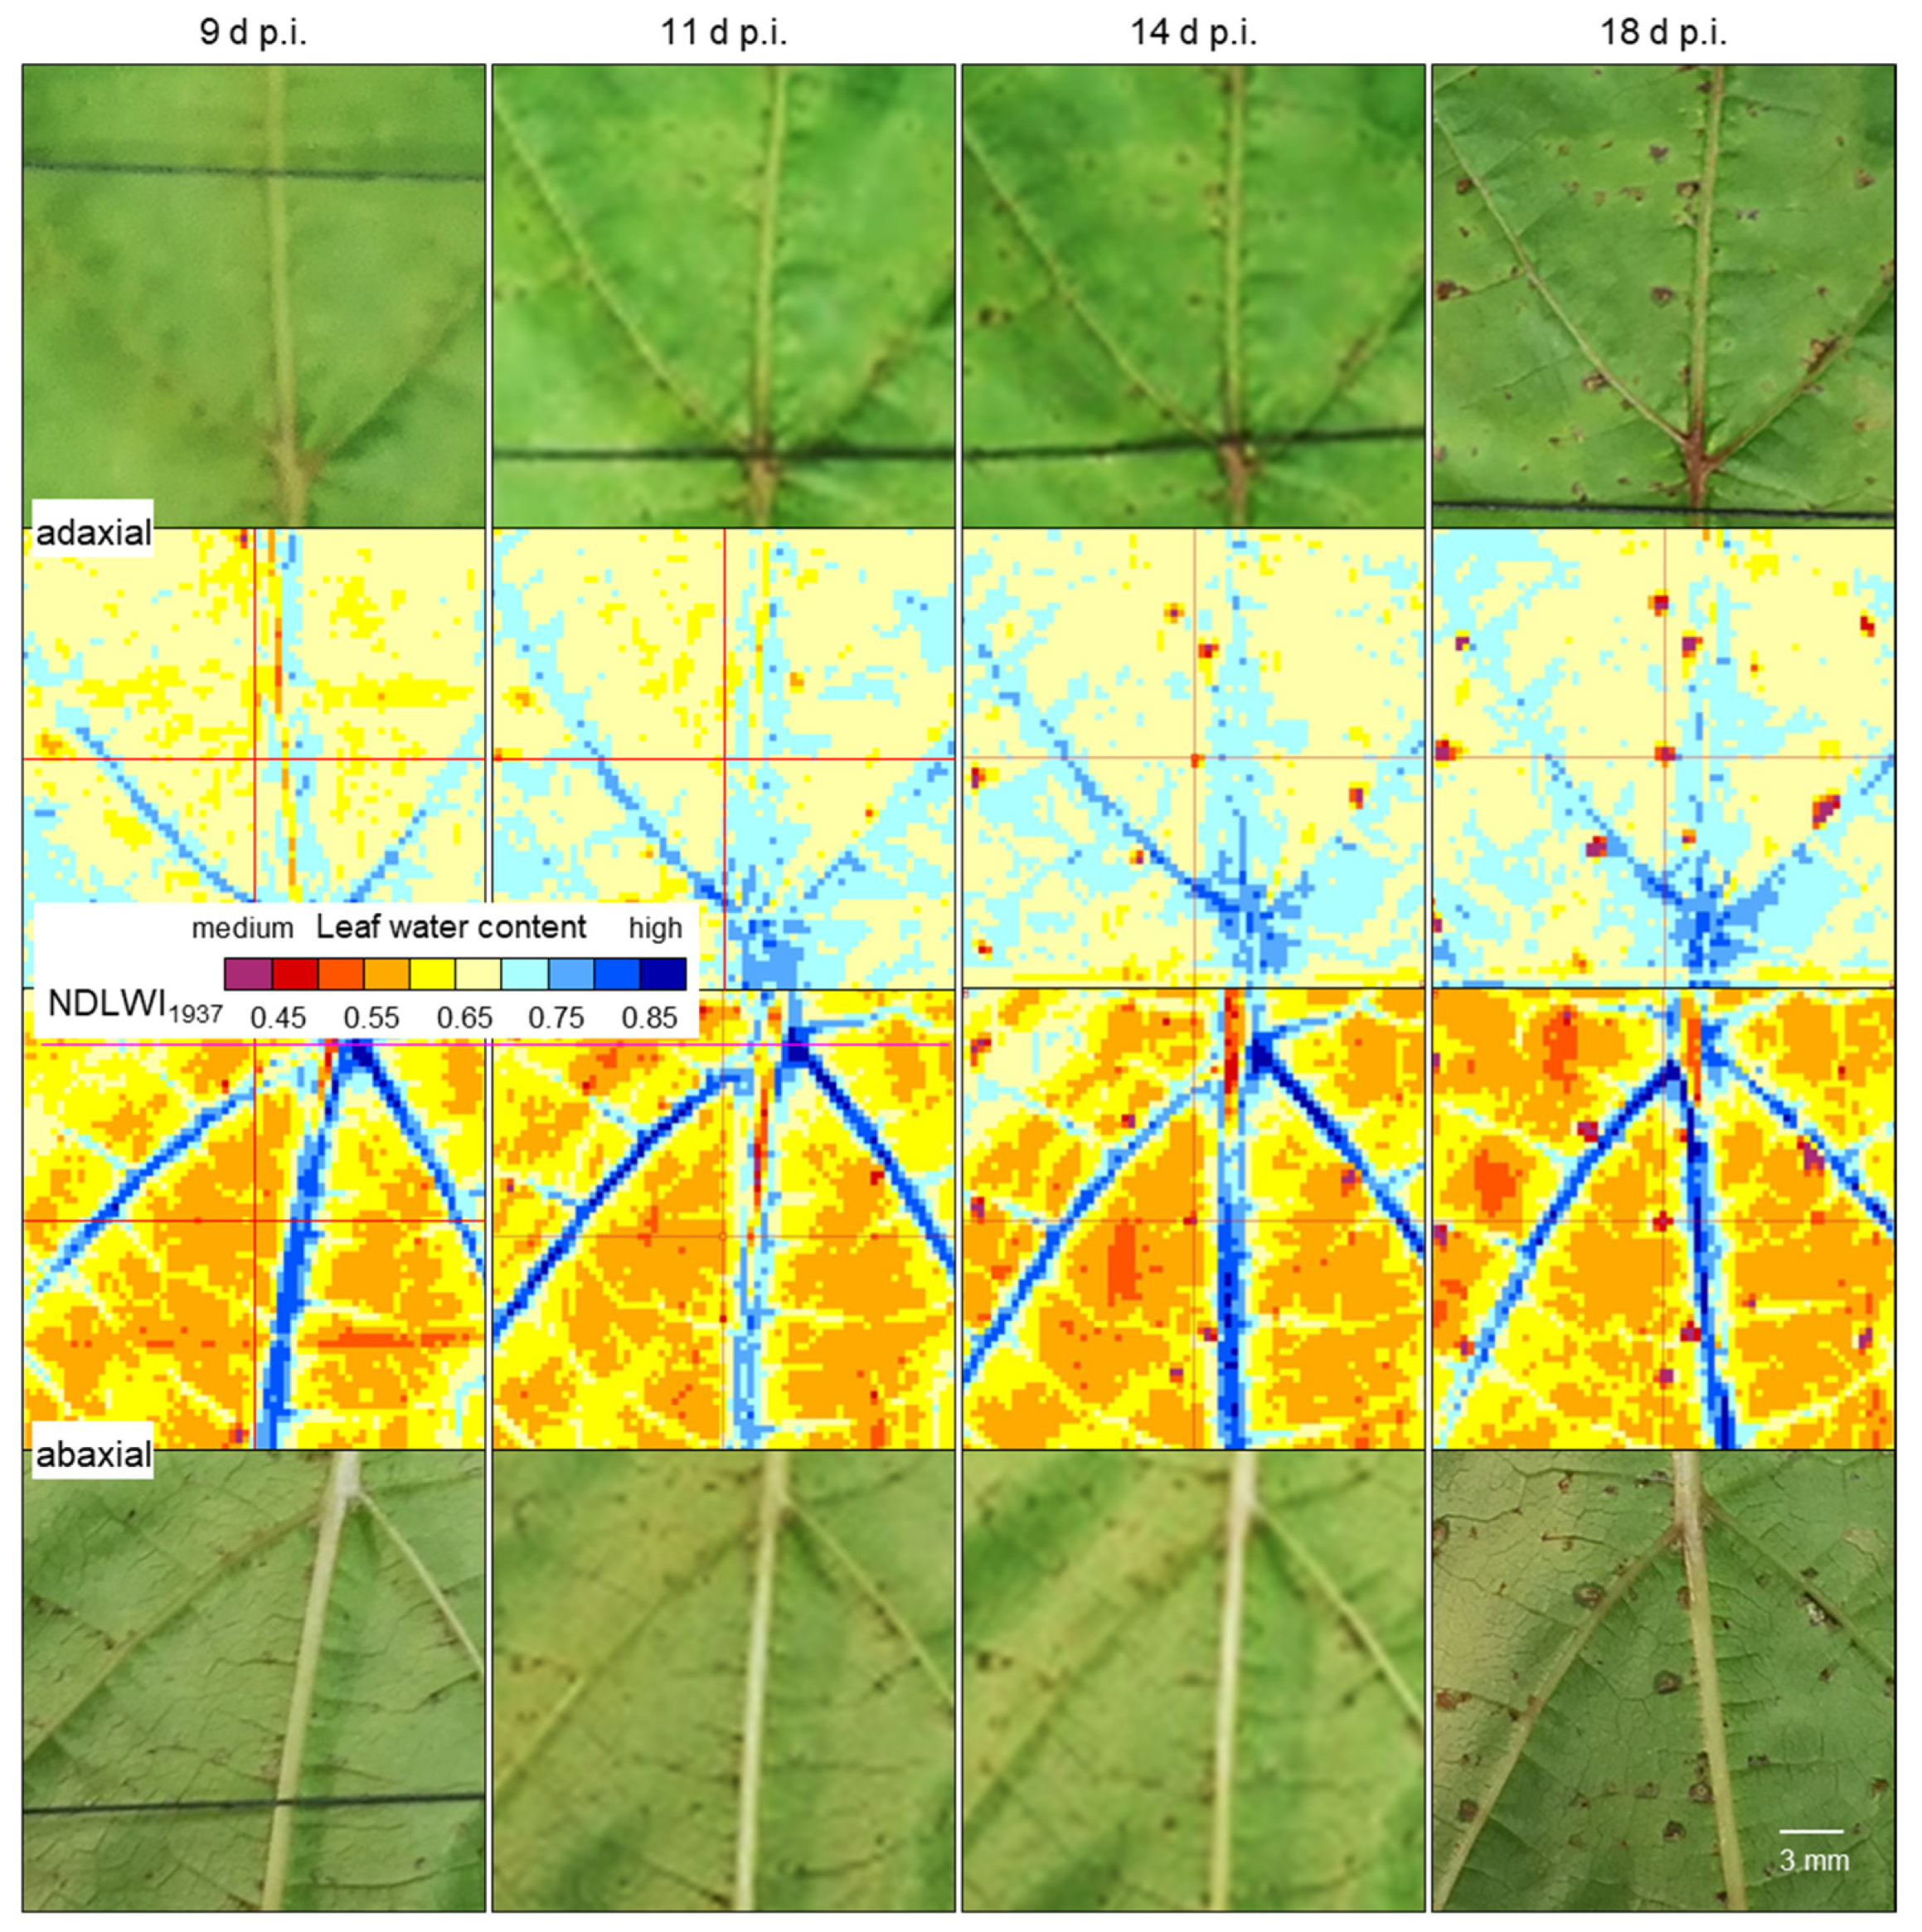
P. viticola sporulation on cv. Solaris [47,48]. Reduced or delayed sporulation may also (transiently) limit the effect on leaf water status of brownish leaf spots as observed 11 d p.i. in this study.
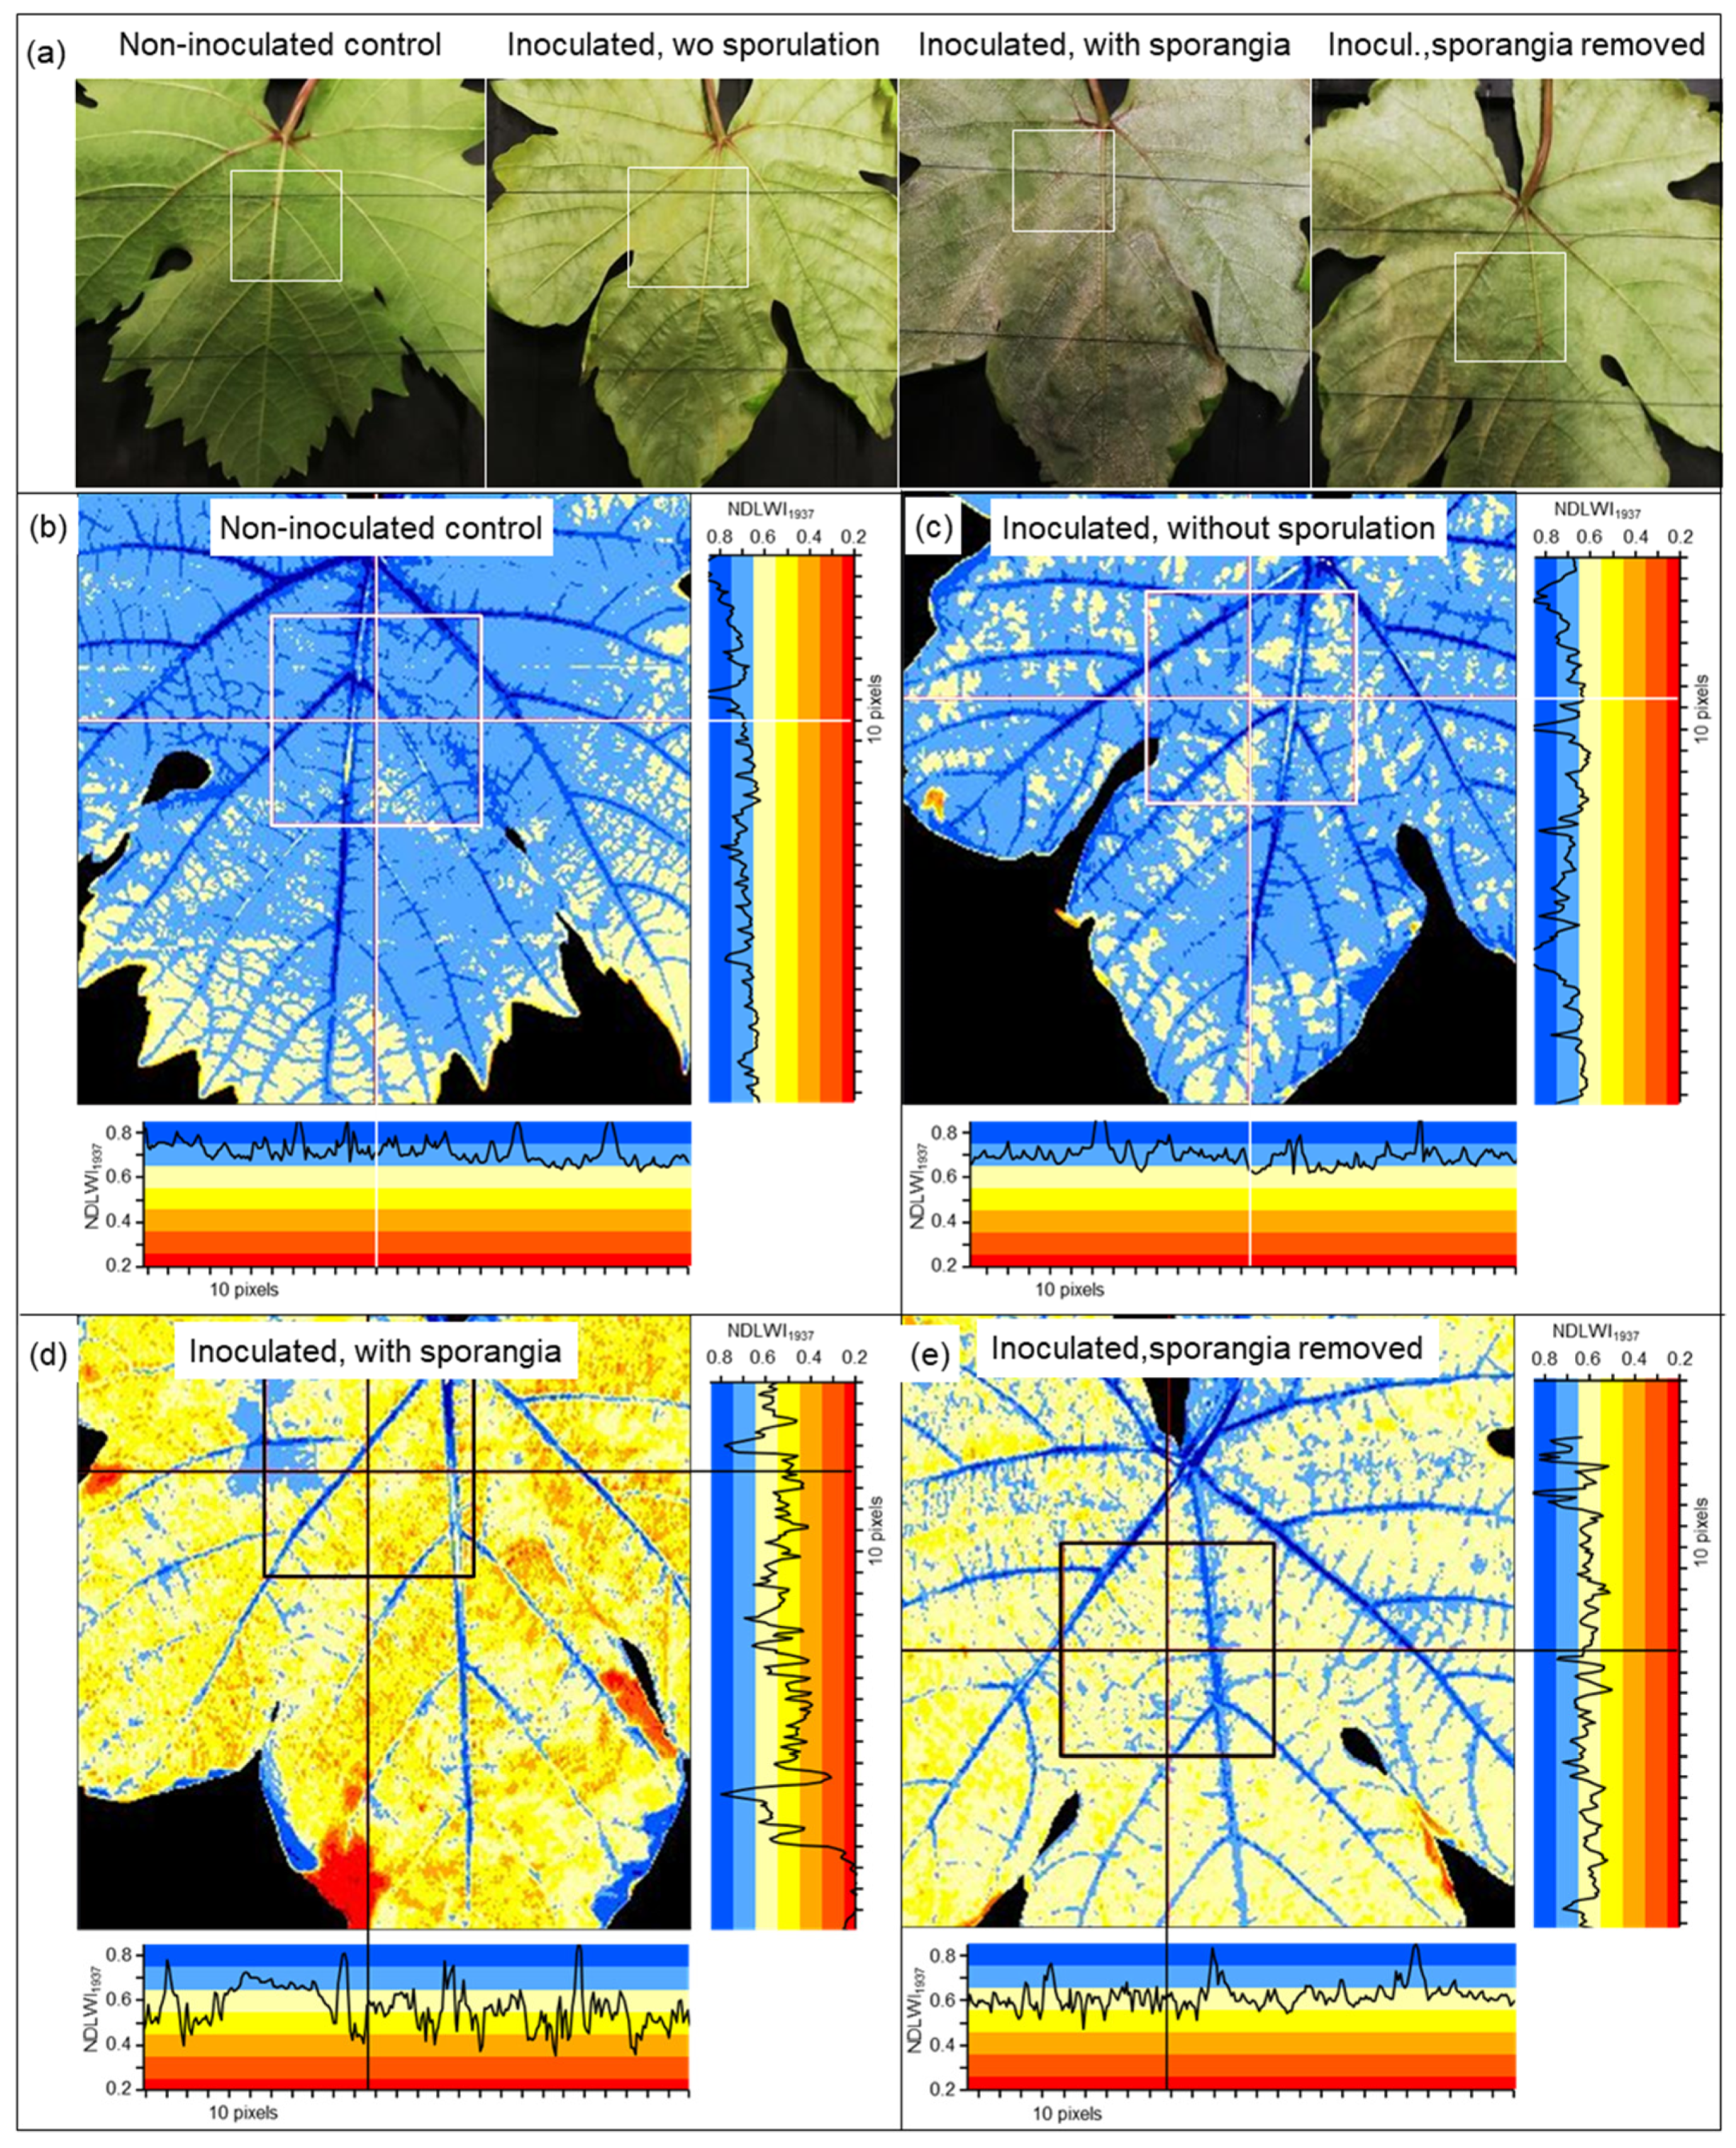
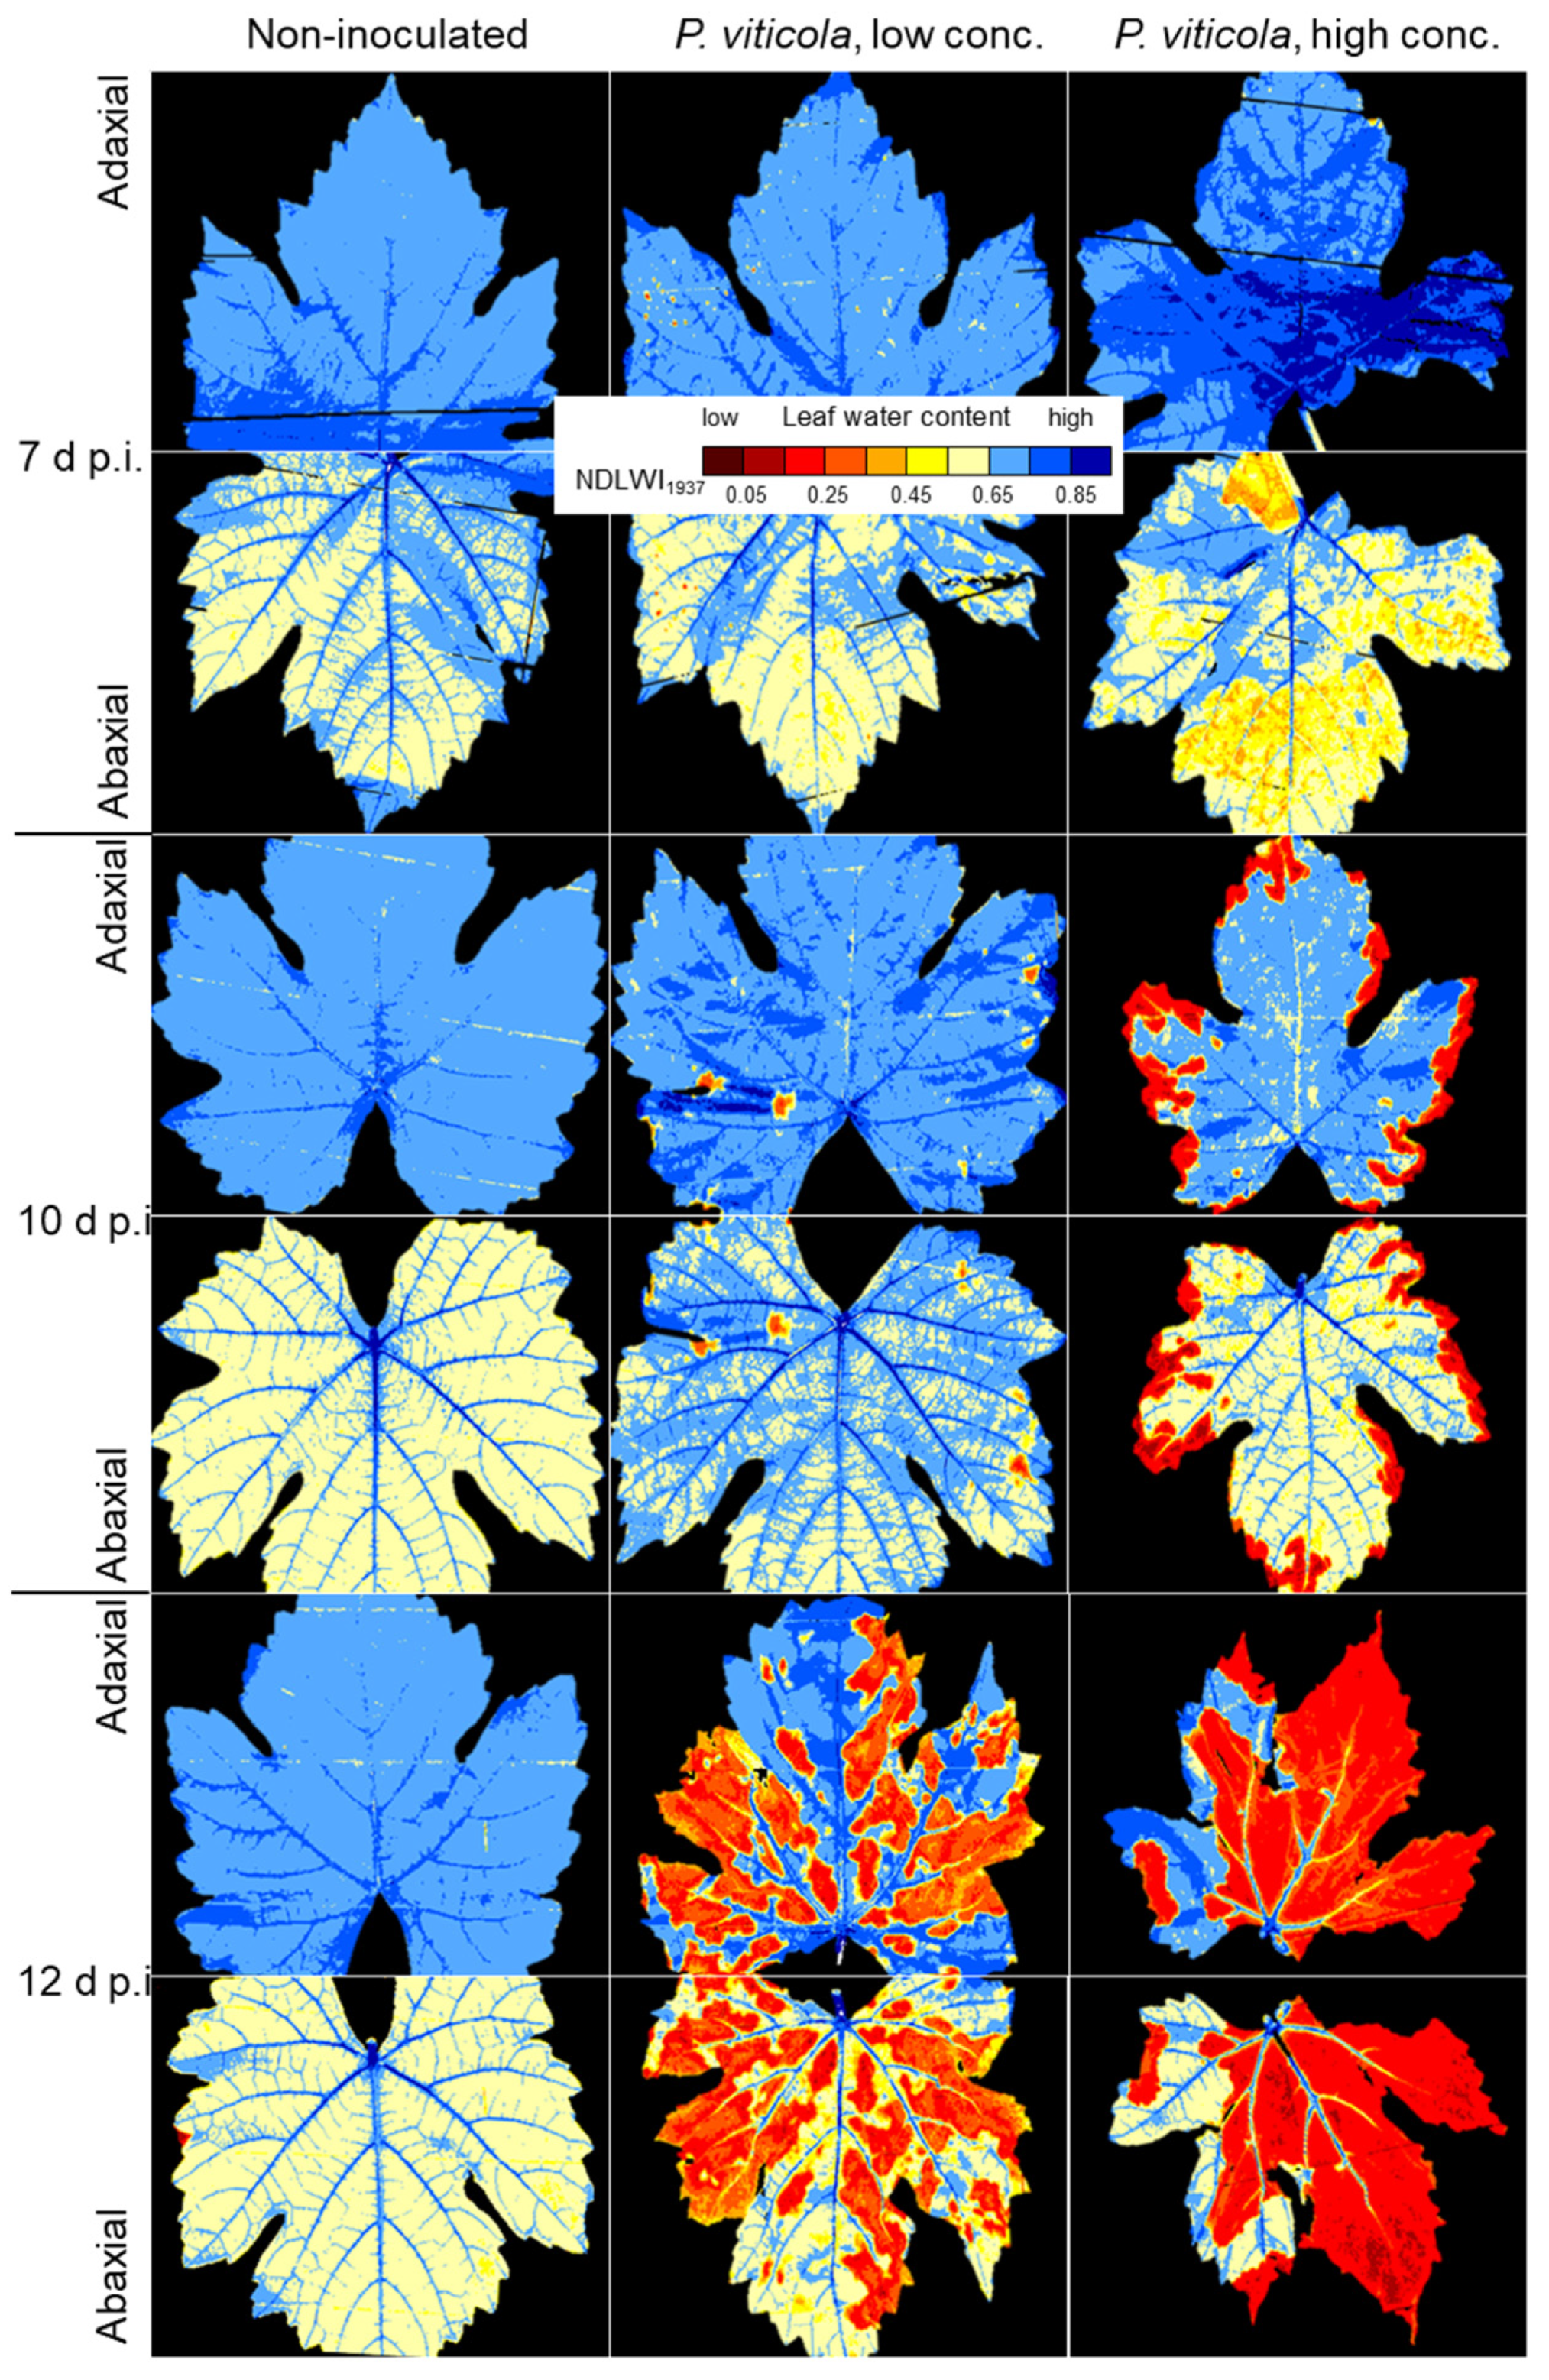
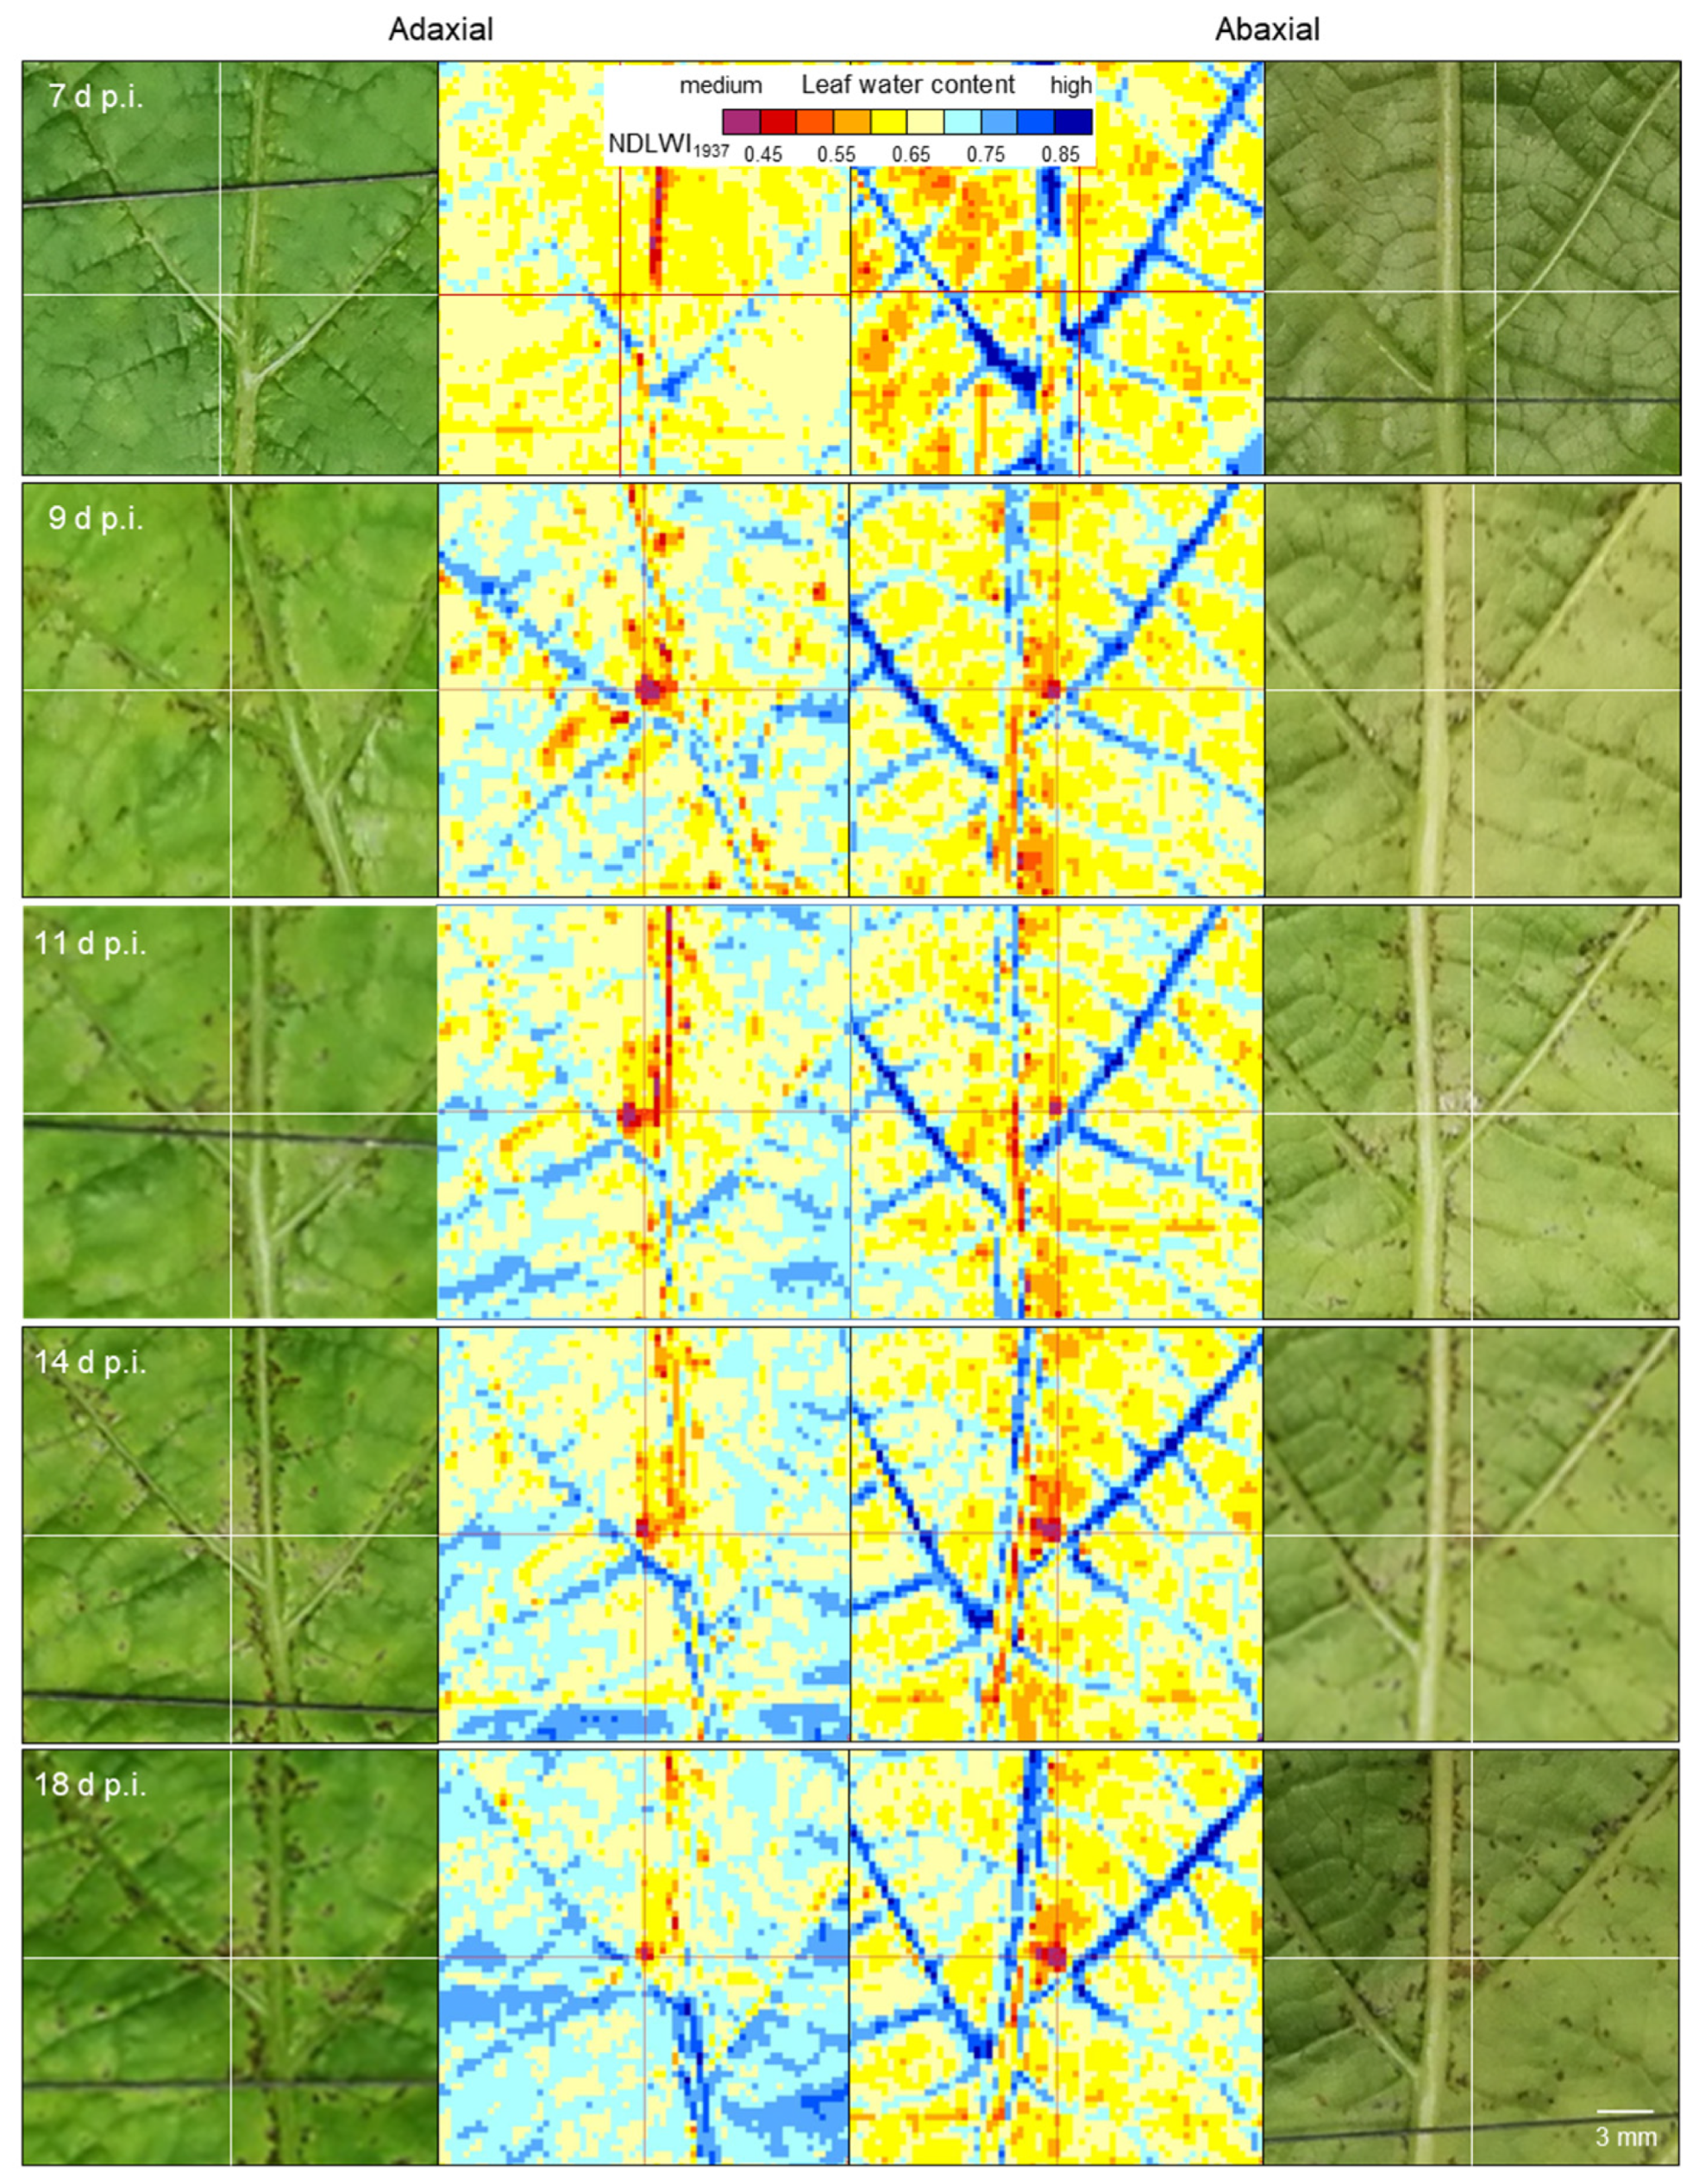
In the compatible interaction, the first effects of P. viticola on the LWC pattern of leaves coincided with first sporangia formation or, without the induction of sporulation by high RH, with strong colonization (and production of pathogen biomass) of leaf tissue. The effect on leaf water status, initially limited to sites of primary sporangia, increased with the density of sporulation and caused large-scale LWC reduction of colonized leaf tissue and ultimately resulting in tissue collapse. Although necrotic tissue had NDLWI values of 0.2 and lower, xylem and phloem retained their functionality as long as possible.
The reduced LWC of leaf tissue with abundant sporangia formation revealed a rather uniform and large-scale effect of P. viticola on the water status of the susceptible cv. Mueller-Thurgau. Although non-diseased intercostal areas of infected leaves were not affected, the high number of sporangiophores with sporangia protruding through stomata had a wicking activity on apoplastic leaf water and resulted in LWC values 10 to 20% lower than those of non-diseased leaves. As sporangiophores prevented diurnal closure of stomata, the slow but continuing loss of water led to a dehydration of intercostal areas, which started at leaf margins and expanded to central leaf parts in later stages of pathogenesis; leaf veins remained functional for longer periods of time. The pathogen biomass withdraws water (and nutrients) from the apoplast and (via haustoria) from the plant symplast and transfers it to ambient air, to the plant’s disadvantage. Without another spell of high RH of ambient air, P. viticola sporangia dried within 24 h, but preserved pathogenicity for several days. The large surface of sporangia and sporangiophores protruding into the relatively dry ambient air explains the severe effect of downy mildew on leaf vitality observed in vineyards, which may be even aggravated by insufficient water supply from the soil.

5. Conclusions

Non-destructive and contactless measurement of the leaf water status of grapevine leaves infected by P. viticola demonstrated a high sensitivity of spectral imaging of SWIR water absorption bands to small-scale differences and enabled longitudinal assessment of water status patterns related to downy mildew symptoms. Difficulties in the assessment of tiny spots of brownish tissue associated with resistance reactions in incompatible interactions disclosed that better spatial resolution is desirable for SWIR applications in investigations of early effects of pathogens on the leaf water status of plants.
Proximal sensing offers an unprecedented spatial resolution of leaf water content assessment, enabling studies to track effects of pathogens on the plant water balance in host–pathogen interactions. Beyond proximal sensing, NDLWI1937 may be applied in phenotyping for genotypes resilient to drought stress caused by biotic and abiotic factors (climate change). The use of hyperspectral SWIR imaging in the field is limited by the interferences of water vapor in the air and crop geometry.

Supplementary Materials

The following supporting information can be downloaded at: https://www.mdpi.com/article/10.3390/rs17101788/s1, Figure S1: Calibration curves for the relationship between water content of grapevine leaves and Normalized Difference Leaf Water Indices—effect of leaf side and ontogenetic stage of leaves; Figure S2: Variability of tissue thickness within grapevine leaves; Figure S3a–e: Effect of P. viticola on the water status of leaves of compatible grapevine (cv. Mueller-Thurgau) over time, 5, 7, 9, 12 and 14 d p.i., respectively; Figure S4: Effect of resistance reactions of grapevine cultivars Regent and Solaris to infection by P. viticola on leaf water status of leaves.

Author Contributions

Conceptualization, E.-C.O. and U.S.; methodology, E.-C.O. and U.S.; investigation, E.-C.O. and U.S.; validation, E.-C.O. and U.S.; data curation, E.-C.O.; writing—original draft preparation, E.-C.O. and U.S.; writing—review and editing, E.-C.O. and U.S. All authors have read and agreed to the published version of the manuscript.

Funding

This research received no external funding.

Data Availability Statement

The raw data supporting the conclusions of this article will be made available by the authors on request.

Acknowledgments

The authors thank Alaa Al Hlwany for experimental support.

Conflicts of Interest

The authors declare no conflicts of interest.

References

  1. Salgado-Pirata, M.; Marques da Silva, J.R. An overview on vine water status assessment. Ciência E Técnica Vitivinic. 2024, 39, 93–102. [Google Scholar] [CrossRef]
  2. Gutiérrez, S.; Diago, M.P.; Fernández-Novales, J.; Tardaguila, J. Vineyard water status assessment using on-the-go thermal imaging and machine learning. PLoS ONE 2018, 13, e0192037. [Google Scholar] [CrossRef]
  3. Giovos, R.; Tassopoulos, D.; Kalivas, D.; Lougkos, N.; Priovolou, A. Remote sensing vegetation indices in viticulture: A critical review. Agriculture 2021, 11, 457. [Google Scholar] [CrossRef]
  4. Mirás-Avalos, J.M.; Araujo, E.S. Optimization of vineyard water management: Challenges, strategies, and perspectives. Water 2021, 13, 746. [Google Scholar] [CrossRef]
  5. Cogato, A.; Jewan, S.Y.Y.; Wu, L.; Marinello, F.; Meggio, F.; Sivilotti, P.; Sozzi, M.; Pagay, V. Water stress impacts on grapevines (Vitis vinifera L.) in hot environments: Physiological and spectral responses. Agronomy 2022, 12, 1819. [Google Scholar] [CrossRef]
  6. Araújo-Paredes, C.; Portela, F.; Mendes, S.; Valín, M.I. Using aerial thermal imagery to evaluate water status in Vitis vinifera cv. Loureiro. Sensors 2022, 22, 8056. [Google Scholar] [CrossRef]
  7. Atencia Payares, L.K.; Gomez-del-Campo, M.; Tarquis, A.M.; García, M. Thermal imaging from UAS for estimating crop water status in a Merlot vineyard in semi-arid conditions. Irrig. Sci. 2025, 43, 87–103. [Google Scholar] [CrossRef]
  8. Buunk, T.; Vélez, S.; Ariza-Sentís, M.; Valente, J. Comparing nadir and oblique thermal imagery in UAV-based 3D crop water stress index applications for precision viticulture with LiDAR validation. Sensors 2023, 23, 8625. [Google Scholar] [CrossRef]
  9. Mertens, S.; Verbraeken, L.; Sprenger, H.; De Meyer, S.; Demuynck, K.; Cannoot, B.; Merchie, J.; De Block, J.; Vogel, J.T.; Bruce, W.; et al. Monitoring of drought stress and transpiration rate using proximal thermal and hyperspectral imaging in an indoor automated plant phenotyping platform. Plant Methods 2023, 19, 132. [Google Scholar] [CrossRef]
  10. Nowack, J.C.; Atencia-Payares, L.K.; Tarquis, A.M.; Gomez-del-Campo, M. Application of unmanned aerial vehicle (UAV) sensing for water status estimation in vineyards under different pruning strategies. Plants 2024, 13, 1350. [Google Scholar] [CrossRef]
  11. Kang, C.C.; Diverres, G.; Paudel, A.; Karkee, M.; Zhang, Q.; Keller, M. Estimating soil and grapevine water status using ground based hyperspectral imaging under diffused lighting conditions: Addressing the effect of lighting variability in vineyards. Comput. Electron. Agr. 2023, 212, 108175. [Google Scholar] [CrossRef]
  12. Carter, G.A. Primary and secondary effects of water content of the spectral reflectance of leaves. Amer. J. Bot. 1991, 78, 916–924. [Google Scholar] [CrossRef]
  13. Filella, I.; Peñuelas, J. The red edge position and shape as indicators of plant chlorophyll content, biomass and hydric status. Int. J. Remote Sens. 1994, 15, 1459–1470. [Google Scholar] [CrossRef]
  14. Ustin, S.L.; Roberts, D.A.; Gamon, J.A.; Asner, G.P.; Green, R.O. Using imaging spectroscopy to study ecosystem processes and properties. BioScience 2004, 54, 523–553. [Google Scholar] [CrossRef]
  15. Ustin, S.L.; Jacquemoud, S. How the optical properties of leaves modify the absorption and scattering of energy and enhance leaf functionality. In Remote Sensing of Plant Diversity; Cavender-Bares, J., Gamon., J.A., Townsend, P.A., Eds.; Springer Open: Cham, Switzerland, 2020; pp. 349–384. [Google Scholar]
  16. Gao, B. NDWI-a normalized difference water index for remote sensing of vegetation liquid water from space. Remote Sens. Environ. 1996, 58, 257–266. [Google Scholar] [CrossRef]
  17. Peñuelas, J.; Piñol, J.; Ogaya, R.; Filella, I. Estimation of plant water concentration by the reflectance Water Index WI (R900/R970). Int. J. Remote Sens. 1997, 18, 2869–2875. [Google Scholar] [CrossRef]
  18. Kandylakis, Z.; Falagas, A.; Karakizi, C.; Karantzalos, K. Water stress estimation in vineyards from aerial SWIR and multispectral UAV data. Remote Sens. 2020, 12, 2499. [Google Scholar] [CrossRef]
  19. Laroche-Pinel, E.; Duthoit, S.; Albughdadi, M.; Costard, A.D.; Rousseau, J.; Chéret, V.; Clenet, H. Towards vine water status monitoring on a large-scale using Sentinel-2 images. Remote Sens. 2021, 13, 1837. [Google Scholar] [CrossRef]
  20. Laroche-Pinel, E.; Vasquez, K.R.; Brillante, L. Assessing grapevine water status in a variably irrigated vineyard with NIR/SWIR hyperspectral imaging from UAV. Prec. Agric. 2024, 25, 2356–2374. [Google Scholar] [CrossRef]
  21. Zhao, T.J.; Nakano, A.; Iwaski, Y.; Umeda, H. Application of hyperspectral imaging for assessment of tomato leaf water status in plant factories. Appl. Sci. 2020, 10, 4665. [Google Scholar] [CrossRef]
  22. Sanaeifar, A.; Yang, C.; de la Guardia, M.; Zhang, W.K.; Li, X.; He, Y. Proximal hyperspectral sensing of abiotic stresses in plants. Sci. Total Environ. 2023, 861, 160652. [Google Scholar] [CrossRef] [PubMed]
  23. Zovko, M.; Žibrat, U.; Knapič, M.; Bubalo Kovačić, M.; Romić, D. Hyperspectral remote sensing of grapevine drought stress. Prec. Agric. 2019, 20, 335–347. [Google Scholar] [CrossRef]
  24. Mazis, A.; Choudhury, S.D.; Morgan, P.B.; Stoerger, V.; Hiller, J.; Ged, Y.; Awada, T. Application of high-throughput plant phenotyping for assessing biophysical traits and drought response in two oak species under controlled environment. For. Ecol. Manag. 2020, 465, 118101. [Google Scholar] [CrossRef]
  25. Oerke, E.C.; Steiner, U. Hyperspectral imaging reveals small-scale water gradients in apple leaves due to minimal cuticle perforation by Venturia inaequalis conidiophores. J. Exp. Bot. 2024, 75, 3125–3140. [Google Scholar] [CrossRef]
  26. Grimmer, M.K.; Foulkes, M.J.; Pavely, N.D. Foliar pathogenesis and plant water relations: A review. J. Exp. Bot. 2012, 63, 4321–4331. [Google Scholar] [CrossRef]
  27. Ayres, P.G. Growth responses induced by pathogens and other stresses. In Response of Plants to Multiple Stresses; Mooney, J.A., Winner, W.E., Pell, E.J., Eds.; Academic Press: London, UK, 1991; pp. 227–249. [Google Scholar]
  28. Wilcox, W.F.; Gubler, W.D.; Uyemoto, J.K. Compendium of Grape Diseases, Disorders, and Pests, 2nd ed.; APS Press: St. Paul, MN, USA, 2015. [Google Scholar]
  29. Toffolatti, S.L.; Russo, G.; Campia, P.; Bianco, P.A.; Borsa, P.; Coatti, M.; Torriani, S.F.F.; Sierotzki, H. A time-course investigation of resistance to the carboxylic acid amide mandipropamid in field populations of Plasmopara viticola treated with anti-resistance strategies. Pest. Manag. Sci. 2018, 74, 2822–2834. [Google Scholar] [CrossRef]
  30. Campbell, S.E.; Brannen, P.M.; Scherm, H.; Eason, N.; MacAllister, C. Efficacy of fungicide treatments for Plasmopara viticola control and occurrence of strobilurin field resistance in vineyards in Georgia, USA. Crop Prot. 2021, 139, 105371. [Google Scholar] [CrossRef]
  31. Massi, F.; Torriani, S.F.F.; Borghi, L.; Toffolatti, S.L. Fungicide resistance evolution and detection in plant pathogens: Plasmopara viticola as a case study. Microorganisms 2021, 9, 119. [Google Scholar] [CrossRef]
  32. Possamai, T.; Wiedemann-Merdinoglu, S. Phenotyping for QTL identification: A case study of resistance to Plasmopara viticola and Erysiphe necator in grapevine. Front. Plant Sci. 2022, 13, 930954. [Google Scholar] [CrossRef]
  33. Velasquez-Camacho, L.; Otero, M.; Basile, B.; Pijuan, J.; Corrado, G. Current trends and perspectives on predictive models for mildew diseases in vineyards. Microorganisms 2023, 11, 73. [Google Scholar] [CrossRef]
  34. Glazebrook, J. Contrasting mechanisms of defense against biotrophic and necrotrophic pathogens. Annu. Rev. Phytopathol. 2005, 43, 205–227. [Google Scholar] [CrossRef] [PubMed]
  35. Boso, S.; Kassemeyer, H.H. Different susceptibility of European grapevine cultivars for downy mildew. Vitis 2008, 47, 39–49. [Google Scholar]
  36. Boso, S.; Alonso-Villaverde, V.; Gago, P.; Santiago, J.L.; Martínez, M.C. Susceptibility to downy mildew (Plasmopara viticola) of different Vitis varieties. Crop Prot. 2014, 63, 26–35. [Google Scholar] [CrossRef]
  37. Oerke, E.C.; Juraschek, L.; Steiner, U. Hyperspectral mapping of the response of grapevine cultivars to Plasmopara viticola infection at the tissue scale. J. Exp. Bot. 2023, 74, 377–395. [Google Scholar] [CrossRef]
  38. Lindenthal, M.; Steiner, U.; Dehne, H.W.; Oerke, E.C. Effect of downy mildew development on transpiration of cucumber leaves visualized by digital infrared thermography. Phytopathology 2005, 95, 233–240. [Google Scholar] [CrossRef]
  39. Oerke, E.C.; Steiner, U.; Dehne, H.W.; Lindenthal, M. Thermal imaging of cucumber leaves affected by downy mildew and environmental conditions. J. Exp. Bot. 2006, 57, 2121–2132. [Google Scholar] [CrossRef]
  40. Stoll, M.; Schultz, H.R.; Berkelmann-Loehnertz, B. Exploring the sensitivity of thermal imaging for Plasmopara viticola pathogen detection in grapevines under different water status. Funct. Plant Biol. 2008, 35, 281–288. [Google Scholar] [CrossRef]
  41. Kuska, M.; Wahabzada, M.; Leucker, M.; Dehne, H.W.; Kersting, K.; Oerke, E.C.; Steiner, U.; Mahlein, A.K. Hyperspectral phenotyping on the microscopic scale: Towards automated characterization of plant-pathogen interactions. Plant Methods 2015, 11, 28. [Google Scholar] [CrossRef]
  42. Gold, K.M.; Townsend, P.A.; Herrmann, I.; Gevens, A.J. Investigating potato late blight physiological differences across potato cultivars with spectroscopy and machine learning. Plant Sci. 2020, 295, 110316. [Google Scholar] [CrossRef]
  43. Maina, A.W.; Oerke, E.C. Characterization of rice-Magnaporthe oryzae interactions by hyperspectral imaging. Plant Dis. 2023, 107, 3139–3147. [Google Scholar] [CrossRef]
  44. Anonymous. Beschreibende Sortenliste. Reben [Descriptive List of Cultivars. Grapevine]; Bundessortenamt: Hannover, Germany, 2015. [Google Scholar]
  45. Eisenmann, B.; Czemmel, S.; Ziegler, T.; Buchholz, G.; Kortekamp, A.; Trapp, O.; Rausch, T.; Dry, I.; Bogs, J. Rpv-mediated resistance to grapevine downy mildew is associated with specific host transcriptional responses and the accumulation of stilbenes. Plant Biol. 2019, 19, 343. [Google Scholar]
  46. Juerges, G.; Kassemeyer, H.H.; Durrenberger, M.; Duggelin, M.; Nick, P. The mode of interaction between Vitis and Plasmopara viticola Berk. and Curt. Ex de Bary depends on the host species. Plant Biol. 2009, 11, 886–898. [Google Scholar] [CrossRef]
  47. Juraschek, L.; Matera, C.; Steiner, U.; Oerke, E.C. Pathogenesis of Plasmopara viticola depending on resistance mediated by Rpv3_1 and Rpv10 and Rpv3_3 and by the vitality of leaf tissue. Phytopathology 2022, 112, 1486–1499. [Google Scholar] [CrossRef]
  48. Gindro, K.; Pezet, R.; Viret, O. Histological study of the responses of two Vitis vinifera cultivars (resistant and susceptible) to Plasmopara viticola infections. Plant Physiol. Biochem. 2003, 41, 846–853. [Google Scholar] [CrossRef]
Figure 1. Relationship between water content of grapevine (cv. Mueller-Thurgau) leaves and Normalized Difference Leaf Water Index calculated using the water absorption bands at 1453 nm and 1937 nm, respectively. Hyperspectral imaging of adaxial and abaxial leaf sides in two independent experiments (n = 88).
Remotesensing 17 01788 g001
Figure 2. Effects of background (color) and stacking of dried and naturally hydrated grapevine (cv. Mueller-Thurgau) leaves on the assessment of leaf water content by NDLWI1937 (NADIR images). (a) Grapevine leaves with adaxial and abaxial side up were recorded with black and white paperboard underneath—the center of leaves (marked by white outline on the left) was without paper background on the stage of black fibers; (b) effect of stacking of naturally hydrated (LWC 78%) and dried grapevine leaves on NDLWI1937 values from hyperspectral imaging.
Remotesensing 17 01788 g002
Figure 3. Effect of P. viticola development on the spatial pattern of leaf water content of grapevine (cv. Mueller-Thurgau) leaves as visualized by Normalized Difference Leaf Water Index (NDLWI1937) for the period 5 to 14 d p.i. Assessment of abaxial NDLWI1937 of non-inoculated leaves (left) and inoculated leaves without induction of sporulation (second left), with sporangia (second right), and with sporangia mechanically removed (right).
Remotesensing 17 01788 g003
Figure 4. Effect of P. viticola on leaf water content of grapevine (cv. Mueller-Thurgau) leaves, 7 d p.i. (a) RGB images (center) and NDLWI1937 images of adaxial (top) and abaxial (middle) sides of leaf after induction of sporangia formation by 100% RH for 14 h. NDLWI1937 levels displayed for the range 0.05–0.85 (left) and 0.45–0.85 (right), respectively. Bottom row with details of sporangia formation and the highly localized decrease in leaf water content at the sites of sporangia formation: Note higher NDLWI values at the site of tissue overlap; (b) NDLWI1937 profiles (range 0.45–0.85) of two infection sites with sporangia formation.
Remotesensing 17 01788 g004
Figure 5. Effect of downy mildew on spatial pattern of leaf water content of grapevine (cv. Mueller-Thurgau) leaves, 9 d p.i. (a) RGB images; (be) NDLWI1937 images of abaxial leaf side of (b) non-inoculated control; (c) inoculated leaf without induction of sporangia formation; (d) leaf with sporangia formation induced by 100% RH for 14 h; (e) leaf after mechanical removal of sporangia.
Remotesensing 17 01788 g005
Figure 6. Effect of downy mildew disease severity and time on spatial patterns of water content of grapevine (cv. Mueller-Thurgau) leaves. NDLWI1937 images of adaxial and abaxial leaf side of non-inoculated control (left), leaves inoculated with low (center) and high (right) P. viticola inoculum density. Sporangia formation on abaxial side of leaves was induced before each measurement time by 100% RH for 14 h.
Remotesensing 17 01788 g006
Figure 7. Detection of the effect of resistance reactions of grapevine cvs. Regent and Solaris to infection by P. viticola—i.e., spots of brownish tissue—on the water status of the abaxial leaf side 9 d p.i. (a) Non-successful attempt because of insufficient spatial sensor resolution; RGB images clearly showed brown spots; (be) detection and characterization of the effect on water status of leaves of cv. Regent (b,c) and Solaris (d,e) with improved spatial resolution.
Remotesensing 17 01788 g007
Figure 8. Longitudinal study of the effect of the development of brownish spots due to the resistance reaction of grapevine cv. Regent to infection by P. viticola on leaf water status of adaxial (top rows) and abaxial (bottom rows) leaf sides. The number and size of spots visible in RGB and NDLWI1937 images increased with time.
Remotesensing 17 01788 g008
Figure 9. Longitudinal study of the effect of the development of brownish spots due to the resistance reaction of grapevine cv. Solaris to P. viticola infection on leaf water status of adaxial (left) and abaxial (right) leaf sides. The number of spots visible in RGB and NDLWI1937 images increased with time. The size and effect on leaf water content, however, varied between leaf sides—a decrease and an increase for the adaxial and abaxial sides, respectively.
Remotesensing 17 01788 g009
Figure 10. Effect of individual P. viticola infections on the leaf water content of grapevine cultivars Regent (left) and Solaris (right) during the appearance and development of brown tissue spots. Profiles of NDLWI1937 values of transects through brown leaf spots for adaxial and abaxial leaf sides 9, 11, 14, and 18 d p.i., respectively.
Remotesensing 17 01788 g010
Figure 11. Effects of cultivar, leaf side, and infection by P. viticola on spectral characteristics of grapevine leaves, highlighting the spectral ranges used to calculate the NDLWI1937 (inserts). (a) Effect of grapevine genotype and leaf side; (b) effect of leaf side and downy mildew on reflectance of cv. Mueller-Thurgau, 8 d p.i.; (c) effect of leaf side and tiny spots of brown tissue on reflectance of cv. Regent, 8 d p.i.; (d) effect of leaf side and tiny spots of brown tissue on reflectance of cv. Solaris, 8 d p.i. Mean spectra of >6500 pixels per leaf (n = 4). ab(ax)., abaxial leaf side; ad(ax)., adaxial leaf side; NDLWI1937 values followed by the same letter were not significantly different (Tukey–Kramer test, p ≤ 0.05).
Remotesensing 17 01788 g011
Figure 12. Effect of leaf side and tissue type—veins and intercostal areas, respectively—on NDLWI1937 values of three grapevine genotypes under greenhouse conditions. For all genotypes, leaf water values were significantly higher for the adaxial than for the abaxial leaf side (n = 6). Leaf veins had higher leaf water content than intercostal areas, and the difference between adaxial and abaxial leaf sides was positive and negative for intercostal areas and leaf veins, respectively (*** highly significant according to t-test). Thickness of intercostal areas and leaf veins (2nd order) of grapevine leaves differed among genotypes as indicated by the size of these structures.
Remotesensing 17 01788 g012
Figure 13. Effect of spatial resolution on the sensitivity of hyperspectral assessment of LWC of grapevine (cv. Solaris) 9 d p.i. with spots of brown issue in response to P. viticola infection by applying NDLWI1937. (a) RGB image; (b) original spatial resolution of hyperspectral sensor with 0.34 mm pixel size (27 × 27 pixels); (c) spatial resolution reduced by 1:2; (d) spatial resolution reduced by 1:3; (e) spatial resolution reduced by 1:5; (f) NDLWI1937 profile of column #14 at different spatial resolutions demonstrating the reduction in sensitivity.
Remotesensing 17 01788 g013
Disclaimer/Publisher’s Note: The statements, opinions and data contained in all publications are solely those of the individual author(s) and contributor(s) and not of MDPI and/or the editor(s). MDPI and/or the editor(s) disclaim responsibility for any injury to people or property resulting from any ideas, methods, instructions or products referred to in the content.

