Abstract
Deep learning-based methods for real-time small target detection are critical for applications such as traffic monitoring, land management, and marine transportation. However, achieving high-precision detection of small objects against complex backgrounds remains challenging due to insufficient feature representation and background interference. Existing methods often struggle to balance multi-scale feature enhancement and computational efficiency, particularly in scenarios with low target-to-background contrast. To address this challenge, this study proposes an efficient detection method called hierarchical feature enhancement and feature fusion YOLO (HFEF2-YOLO), which is based on the hierarchical dynamic attention. Firstly, a Hierarchical Filtering Feature Pyramid Network (HF-FPN) is introduced, which employs a dynamic gating mechanism to achieve differentiated screening and fusion of cross-scale features. This design addresses the feature redundancy caused by fixed fusion strategies in conventional FPN architectures, preserving edge details of tiny targets. Secondly, we propose a Dynamic Spatial–Spectral Attention Module (DSAM), which adaptively fuses channel-wise and spatial–dimensional responses through learnable weight allocation, generating dedicated spatial modulation factors for individual channels and significantly enhancing the saliency representation of dim small targets. Extensive experiments on four benchmark datasets (VEDAI, AI-TOD, DOTA, NWPU VHR-10) demonstrate the superiority of HFEF2-YOLO; the proposed method can reach an accuracy of 0.761, 0.621, 0.737, and 0.969 (in terms of mAP@0.5), outperforming state-of-the-art methods by 3.5–8.1%. Furthermore, a lightweight version (L-HFEF2-YOLO) is developed via dynamic convolution, reducing parameters by 42% while maintaining >95% accuracy, demonstrating real-time applicability on edge devices. Robustness tests under simulated degradation (e.g., noise, blur) validate its practicality for satellite-based tasks.
1. Introduction
Remote sensing target detection has become a pivotal technology across diverse domains including agricultural monitoring, environmental surveillance, traffic management, geological exploration, and oceanographic studies [1,2,3,4,5]. The evolution of remote sensing platforms and analytical techniques has led to modern remote sensing images exhibiting three distinctive characteristics: complex background interference, multi-scale object presentations, and the exponential increase of spatial resolution with enriched information content. These advancements pose significant challenges for conventional target detection approaches. Recent years have witnessed remarkable progress in deep learning-based detection methods through the development of architectures, such as the R-CNN [1], Faster R-CNN [2], FPN [3], Mask R-CNN [4], SSD [5], Distillation Network [6,7,8], and YOLO [9,10,11]. For instance, Cheng et al. [12] optimized the target detection performance of multi-category remote sensing images by using a rotation-invariant convolutional neural network (RICNN), which is based on the R-CNN model. Li et al. [13] introduced multi-angle anchor frames based on the Faster R-CNN model, which can solve the problem of rotational changes of target objects in remote sensing images. Hao Han et al. [14] proposed an improved YOLOv5 model by using the channel attention mechanism and the STDL to solve the problems of small target detection in remote sensing images, such as complex background, dense distribution of small targets, multi-scale targets, and susceptibility to environmental factors in target detection. Jiaqing Zhang et al. [15] proposed the Super-YOLO model that can effectively improve the detection accuracy of small targets in remote sensing images through its innovative pixel-level multimodal fusion and SR-assisted techniques while maintaining a low computational cost. This represents a significant advantage of the Super-YOLO model in real-time processing and resource-constrained application environments.
Despite these advancements, three fundamental challenges persist in remote sensing small target detection: (1) Inadequate feature representation due to limited pixel occupancy and insufficient semantic information in small targets; (2) Severe background interference from complex terrestrial patterns that obscure target signatures; (3) Computational inefficiency when processing large-scale imagery using multi-scale learning architectures. Effective solutions require innovative approaches to integrate multi-scale contextual information while balancing detection accuracy and processing speed.
The research goal of this study is to design a lightweight and high-precision detection framework with the main objective of multi-scale feature representation enhancement and background information suppression. To this end, this study proposes an efficient detection method consisting of three modules, namely a Global Information Feature Extraction Module (GFEM), a Dynamic Spatial–Channel Attention Module (DSAM), and a hierarchical filtering-based feature pyramid network (HF-FPN) module. The GFEM is introduced to help the network acquire a global view while mitigating the effects of different scale sizes. On this basis, the DSAM is employed to suppress background information and enhance foreground features, and the HF-FPN module is used to obtain a clear representation of multi-scale targets. The three modules are added to the YOLO model to develop an improved model named hierarchical feature enhancement and feature fusion YOLO (HFEF2-YOLO). Finally, to reduce the consumption of computational resources while ensuring efficiency, the backbone of HFEF2-YOLO is optimized using dynamic convolution, and a lightweight version of HFEF2-YOLO (L-HFEF2-YOLO) is obtained.
The main contributions of this paper can be summarized as follows:
- (1)
- To enhance the multi-scale feature expression and mitigate the effects of different scale sizes, the GFEM and HF-FPN are introduced. By filtering the effective features before feature fusion, the multi-scale expression ability of the proposed detection model is enhanced to obtain richer and more effective semantic and spatial information;
- (2)
- To enhance the detection ability of the proposed model under the condition of a complex background, this study proposes using the DSAM to adaptively fuse channel and spatial attention through dynamic weights and assign unique spatial attention weights to each channel, emphasizing more useful information encoded in the image features, which can effectively enhance the detection ability for images with complex backgrounds.
- (3)
- To develop extensive experiments on four benchmark datasets (VEDAI, AI-TOD, DOTA, NWPU VHR-10) to demonstrate the superiority of HFEF2-YOLO. A test dataset containing different degradation conditions is established and used to verify the robustness of the proposed detection method. Furthermore, a lightweight version (L-HFEF2-YOLO) is developed via dynamic convolution, reducing parameters by 42% while maintaining >95% accuracy.
The rest of the paper is organized as follows. Recent studies on small target detection are reviewed in Section 2. The frameworks of the proposed HFEF2-YOLO and L-HFEF2-YOLO models and brief experimental details are introduced in Section 3. The experimental and analysis results, as well as the comparison of the proposed method with the benchmark model and several state-of-the-art algorithms on different datasets, which verify the robustness and lightness of the proposed method, are presented in Section 4. Finally, in Section 5, the main conclusions are drawn, and future development directions in the field of remote sensing small target detection are presented.
2. Related Work
This section briefly reviews the recent literature relevant to the problem considered in this work, including the applications of the YOLO model in the field of remote sensing detection, multi-scale target feature enhancement methods of small objects, and background information suppression methods.
2.1. YOLO Model Application in Remote Sensing
From the perspective of the algorithmic process, deep learning-based target recognition algorithms can be roughly divided into two categories: two-stage approaches based on region proposal [2,4,16,17] and single-stage approaches based on regression [5,18,19,20,21,22]. In general, single-stage approaches usually achieve higher accuracy than two-stage approaches, whereas the former ones have a significant advantage in detection efficiency over the latter ones. The OverFaet [23] was the first deep learning-based single-stage target detection method. Since the OverFaet was introduced, a series of regression-based methods have been proposed, including the YOLO series [18,19,20], the Single Shot Multibox Detector (SSD) series [5,24,25], Retina Net [21], and Corner Net [26]. Among them, the YOLO model has the advantages of being lightweight and having a high potential for real-time detection tasks, but its detection accuracy requires further improvement. Therefore, much research has been devoted to the development of high-precision YOLO-based models to expand their application scope to remote sensing detection [15,27,28,29,30]. For instance, the FFCA-YOLO model introduces the Spatial Context Awareness Module (SCAM), which can enhance a weak feature representation of small targets and suppress confusing backgrounds by reconstructing the correlation between pixels to obtain global context information across channels and space [9]. The DCEF2-YOLO model incorporates a deformable convolution module into the backbone network, which allows for capturing rich internal features of targets and achieving efficient detection of small objects [10]. The SPH-YOLO integrates the self-attention mechanism (SPH) and the attention module (NAMs) into the neck part of the network, which enhances detection accuracy while reducing the computational load [31].
In summary, the YOLO models have the advantages of scalability and high efficiency, making them suitable for remote sensing applications. Therefore, this study uses the YOLO model as a fundamental framework and adds specially designed modules for the representation and extraction of features specific to small targets to the original YOLO model.
2.2. Multi-Scale Target Feature Enhancement Methods
In the computer vision field, feature enhancement represents one of the key techniques for improving the performance of object detection algorithms. With the rapid development of deep learning technology, multi-scale feature fusion has become an important means to enhance the perception capability of detection models for targets of different sizes. Most traditional object detection algorithms use single-scale features, which limit their detection ability for small targets and targets with complex backgrounds. To overcome this limitation, Lin et al. proposed the feature pyramid network (FPN), which can aggregate low-level, high-resolution features with high-level, low-resolution features [3]. However, since the FPN is ambiguous for high-level target information, the PANet employs bi-directional feature fusion, adding a bottom-up feature fusion module to the top of the FPN to enhance the localization effect [32]. Building upon these methods, the BiFPN introduces a more streamlined bi-directional feature fusion [33], and the balanced FPN integrates and refines features of all scales before merging them with the original scale features [34]. Further, the CE-FPN model can improve the integration and refinement effects by using high-level semantic features and an attention mechanism for selective feature fusion [35]. The FaPN also employs the feature-selection and feature-alignment modules to improve fusion accuracy in response to the potential feature misalignment in the FPN [36]. Although the aforementioned methods have improved a model’s detection performance for multi-scale targets to a certain extent, they might lose some useful information when fusing features at different levels and do not consider the relationships between features.
To address these limitations, this study proposes the GFEM to enhance the multi-scale feature expression before fusion and designs a feature enhancement method based on the HF-FPN. This approach combines deep and shallow features to obtain rich semantic and detailed information and further enhances the expressiveness of features by introducing feature cross-connections and channel attention mechanisms.
2.3. Background Information Suppression Methods
In the field of target detection and recognition, images are inevitably affected by complex backgrounds, including haze, dust, and non-uniform illumination, making the suppression of background information and the enhancement of foreground information crucial to achieving good performance. Attention mechanisms can significantly improve the accuracy of target localization by enhancing a model’s ability to focus on key regions in an image. Currently, common traditional attention methods include the CA [37], ECA [38], CBAM [39], and GAM [40] methods. For instance, the CA collects statistical information on each channel through global average pooling (GAP) or global maximum pooling and then uses it to generate a scaling factor to weight the response of each channel; this approach is computationally efficient but results in a partial loss of spatial information. The ECA dynamically adjusts the weights for each channel through parameters that can improve accuracy but increase the computational burden. The CBAM uses a combination of spatial information and channel attention to capture features more comprehensively, but the number of parameters and computational complexity of a model increase fast with the network depth. The GAM generates the attention weights by calculating global statistical information about the entire feature map, which is then used to augment specific parts of the feature graph. The ability to capture long-range dependencies and emphasize global contextual information can be applied to different stages of deep networks, but global pooling might result in a loss of important detailed information.
To address the aforementioned shortcomings, this study introduces the DSAM, which differs from traditional attention mechanisms that simply superimpose spatial attention weights and channel attention weights. In contrast, the proposed method considers the semantic information and spatial layout of an image to assign unique spatial attention weights to each channel. Moreover, based on this method, a detection model that can accurately localize a target and effectively handle complex background interference, thus significantly improving a model’s target detection performance in various scenes, is designed.
2.4. Lightweight Model Design
Recent years have witnessed growing attention to lightweight model design in remote sensing object detection, aiming to balance computational efficiency and detection accuracy. Classical approaches include model compression (e.g., GhostNet [41], which generates redundant features through linear operations), dynamic convolution (e.g., adaptively fusing convolutional kernels via attention mechanisms [42]), and efficient attention modules (e.g., ECA-Net [38], which reduces computational costs via lightweight channel attention). However, existing methods still face two critical challenges in small target detection: (1) Contradiction between detail preservation and computational cost: Most lightweight designs (e.g., MobileNetV2’s inverted residual structure [43]) reduce computational load by downsampling feature resolution but sacrifice edge details of small targets. (2) Lack of dynamic adaptation: Static compression strategies (e.g., channel pruning [44]) struggle to handle dynamic variations in target scales and background complexity in remote sensing scenarios.
To address these limitations, we propose L-HFEF2-YOLO, which integrates dynamic convolution with Ghost Module to preserve multi-scale details while reducing parameters. Specifically, Ghost Module generates redundant features via linear transformations, minimizing redundant computations. Dynamic convolution adaptively adjusts kernel weights based on input features, enhancing robustness to complex scenes. Experimental results demonstrate that L-HFEF2-YOLO achieves >95% detection accuracy with a 42% reduction in parameters, outperforming existing lightweight methods.
3. Proposed Method
3.1. Overview
The previous work introduced an innovative feature pyramid based on hierarchical filtering and a content-guided attention module, which can effectively enhance the information expression capability of a model for multi-scale small targets. Motivated by related research, this study proposes a remote sensing small target detection method based on hierarchical feature enhancement and feature fusion YOLO named HFEF2-YOLO. In the HFEF2-YOLO method, the YOLOv5 model is used as a benchmark framework due to its fewer parameters compared to the latest YOLO models, such as the YOLOv8 and YOLOv9 models, but it can still maintain a relatively high level of accuracy in small target detection tasks. The overall architecture of the HFEF2-YOLO model is shown in Figure 1. First, an input image is processed by the GFEM, which mainly optimizes the SPPF layer by introducing the global average pooling layers and global maximum pooling layers and incorporates global background and edge information to help a network make better judgments. This is achieved by using global perspective information and mitigating the impact of different scales. Second, the HF-FPN module is added to the neck part of the YOLOv5 model to enhance semantic information on multi-scale features. Finally, after the feature pyramid network completes the multi-scale image fusion, a fused image is enhanced again by the DSAM, which further helps the model focus on the target information and eliminate the influence of a complex background.
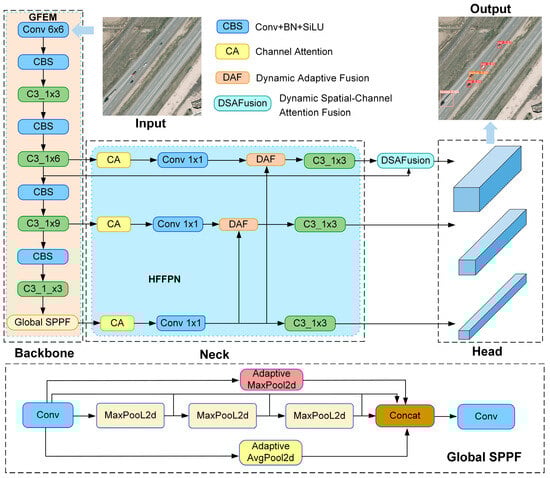
Figure 1.
The HFEF2-YOLO network structure.
3.2. HF-FPN Structure
In the neck of the framework, a multi-scale feature fusion method based on the HF-FPN is introduced, which enables the model to capture more comprehensive target feature information. The HF-FPN structure is presented in Figure 2, where it can be seen that the HF-FPN consists of two main parts: a hierarchical feature selector (HFS) and a dynamic adaptive fusion module (DAF). The dynamic gating mechanism in the HF-FPN’s Hierarchical Feature Selector (HFS) module generates channel-wise gating weights through a Channel Attention (CA) mechanism. Specifically, input feature maps undergo Global Average Pooling (GAP) and Global Max Pooling (GMP) to extract channel-level global statistics. These pooled results are concatenated, compressed via a convolutional layer, and normalized through a Sigmoid function to produce channel-specific weights, which dynamically filter input features through channel-wise multiplication, preserving critical channels while suppressing redundant ones. In the Dynamic Adaptive Fusion (DAF) module, cross-scale fusion weights adaptively adjust by aligning high-level features to low-level resolutions via transposed convolution (T-Conv) and bilinear interpolation, followed by CA-generated spatial attention weights, Ws, which gate low-level features through element-wise multiplication. These weights are optimized end-to-end via backpropagation, automatically learning to emphasize semantically strong regions (e.g., small target edges).
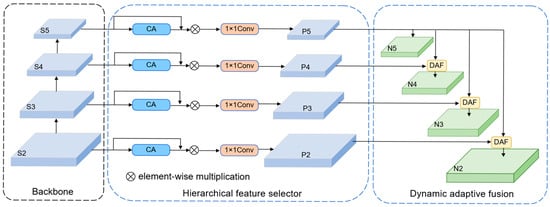
Figure 2.
The HF-FPN structure.
The DAF structure is displayed in Figure 3. Currently, common feature fusion methods sum the up-sampled high-level features with the low-level features on a pixel-by-pixel basis to achieve a trade-off between the hierarchical features and semantic information. However, the proposed DAF module can more effectively fuse features by using high-level features as weights to filter important semantic information embedded into low-level features. The specific fusion process is as follows. For an input high-level feature Fhigh and a low-level feature Flow, first, the high-level feature is expanded using a transposed convolution (T-Conv). Next, bilinear interpolation is performed to up- or down-sample the high-level feature to unify the dimensions of the high- and low-level features. Then, the CA module is introduced to convert the high-level features into the corresponding attention weights. After obtaining features of consistent dimensions, the low-level features are filtered. Finally, the filtered low-level features are fused with the high-level features by the BiFPN to enhance the model’s feature expression capability. The BiFPN is used in this study instead of the traditional add operation to simplify the network structure while realizing more efficient multi-scale feature fusion. Unlike traditional FPNs that use fixed fusion strategies (e.g., addition or concatenation), HF-FPN’s “dynamic” nature stems from data-driven weight adaptation: the weights are entirely determined by the content of the input features and adaptively adjusted across different samples and scenarios, enabling context-aware suppression of background interference and enhanced preservation of multi-scale target details. Overall, the mechanism integrates channel attention and adaptive fusion to optimize cross-scale feature representation, significantly improving detection accuracy for small targets in complex remote sensing scenarios.
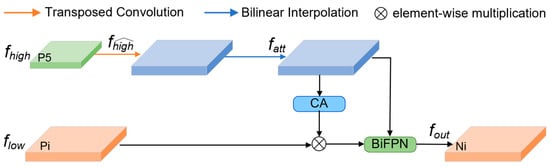
Figure 3.
The DAF structure in the HF-FPN module.
3.3. DSAM Design
Aiming at the enhancement of multi-scale feature representation capabilities, this study introduces the DSAM to improve a model’s ability to detect small targets. The DSAM structure is shown in Figure 4, the core innovation of the DSAM lies in its dynamic fusion mechanism, where the learnable parameter α adaptively balances channel attention (Wc) and spatial attention (Ws). Unlike traditional methods (e.g., CBAM or ECA) that rigidly combine these components, the DSAM optimizes α during training to prioritize channel attention in low-contrast scenarios (e.g., dim targets) and spatial attention in complex backgrounds (e.g., thin cloud cover). This dynamic adjustment enables context-aware suppression of redundant regions while preserving high-frequency details of small targets. Additionally, the DSAM assigns channel-specific spatial weights, allowing each channel to focus on distinct regions. For example, high-frequency channels (e.g., edge features) amplify localized target areas, while low-frequency channels suppress irrelevant backgrounds. This design overcomes the limitation of traditional mechanisms that generate a single spatial weight map for all channels
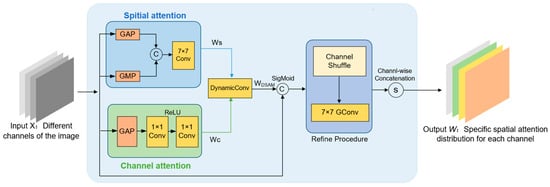
Figure 4.
The DSAM structure.
First, an attention feature vector (Wc) in the channel dimension and an importance distribution vector (Ws) in the spatial dimension of input features are respectively obtained by
where max(0, x) represents the ReLU activation function, and Ck×k indicates a convolutional layer with a k × k kernel size; indexes GAP and GMP refer to the global average pooling and global max pooling operations, respectively. Then, Wc and Ws are fused through a learnable parameter α and dynamic convolution to generate the final attention mask WDSAM:
where α is optimized during training to adaptively suppress redundant backgrounds while preserving high-frequency details of small targets. Finally, each channel of WDSAM is adjusted according to the corresponding input features and refined again, yielding a spatial attention distribution specific to each channel.
The DSAM assigns unique spatial attention weights to each channel, thus enabling the network to focus on features of different regions in each channel. Suppose we have an input feature map XC×H×W, which contains a target region Xt and a background region Xb. The Xt is the part we wish to focus on, while the Xb is the part that may generate interference. The proposed DSAM can generate a spatial importance map (SIM) for each channel of the input feature map, SC×H×W, which is a two-dimensional matrix where the values denote the degree of importance of each pixel location. The SC×H×W is then applied to the input feature map by element-by-element multiplication to obtain a new weighted feature map, YC×H×W. In this weighted feature map, the pixel values of the target region are enlarged, while the pixel values of the background region are reduced or left as they are, thus highlighting the target region more while suppressing the interference of the background region. This approach is more refined and effective than traditional attention mechanisms, such as global average attention and single spatial attention. It considers the interaction of channel attention and spatial attention when generating the SIM, which helps to understand and handle the impact of non-uniform backgrounds in images in a better way and is very effective for target detection with complex background interference. More importantly, despite the introduction of an additional attention mechanism, the DSAM design ensures that it does not introduce additional parameters and computational costs. By using the reparameterization techniques, the DSAM can be seamlessly integrated with the existing convolutional layers without affecting model efficiency.
Therefore, combining the attention module with the previously mentioned multi-scale feature pyramid and leveraging the excellent multi-scale feature expression capability of the HF-FPN and efficient attention distribution of the DSAM can help further improve the detection capability of a model for small targets. To this end, this study proposes a feature fusion method based on the HF-FPN and DSAM called HF-DSAFusion, whose structure is shown in Figure 5. The fused features generated by the HF-FPN are combined with the low-level features obtained from the backbone and input into the DSAM to calculate the weights. Afterward, they are combined using a weighted summation method. By calculating the channel-specific spatial attention distribution in the DSAM, different features are fused again, which enhances the model’s detection capability. The main difference between the proposed feature fusion approach and the feature fusion method used in the feature pyramid is that the former aims to provide richer semantic features, while the latter aims to make the model more efficiently focus on important parts, directly affecting the final detection process.
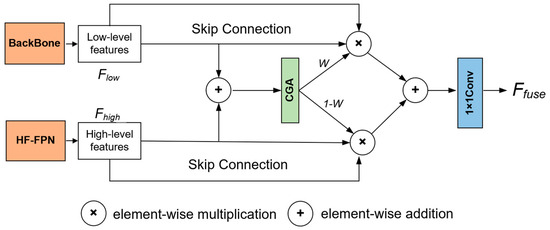
Figure 5.
The structure of HF-DSA fusion module.
3.4. L-HFEF2-YOLO Design
The proposed HFEF2-YOLO model is optimized for the purpose of lightweighting. Generally, a qualified lightweight model needs to achieve a balance between the number of parameters, speed, and accuracy of a detection model. The Ghost Module is a classic model compression method that reduces the number of network parameters and computational load of a model while ensuring network accuracy, thus improving computational speed and reducing latency. However, the reduction in model computational load often leads to a situation where it cannot benefit from a large amount of pre-training, having the opposite effect. To address this shortcoming, this study introduced dynamic convolution technology (Dynamic Conv) to the model, aiming to increase the number of network parameters without increasing the GFLOPS. In addition, a new generation of lightweight modules based on dynamic convolution, denoted by GhostModule, is proposed, and the C3 module in the HFEF2-YOLO model is replaced with it, thus ultimately yielding the lightweight version L-HFEF2-YOLO, as shown in Figure 6.
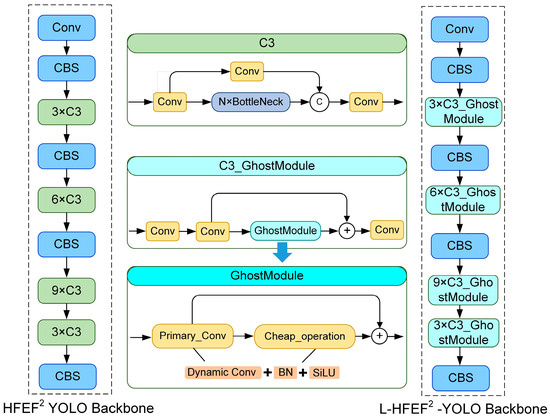
Figure 6.
The lightweight HFEF2-YOLO network structure.
4. Experimental Results
The ability of the proposed model to detect small targets in remote sensing images was verified on two public datasets, namely the VEDAI and AI-TOD datasets, which specifically focus on small objects. In addition, the scalability of the network was examined on the DOTA and NWPU VHR-10 public dataset. The selection of comparison methods in our experiments was carefully designed to align with the characteristics of each dataset and the research focus of the existing literature. For example, VEDAI & AI-TOD: These datasets emphasize small objects, so we prioritized methods specifically optimized for small targets (e.g., Super-YOLO, FFCA-YOLO). DOTA: We compared this multi-scale dataset against models with strong multi-scale fusion capabilities (e.g., SPH-YOLO, STDL-YOLO).
NWPU VHR-10: This dataset contains both small and large objects, so we included general-purpose SOTA detectors (e.g., MSF-SNET, KCFS-YOLO). This approach followed a common practice in remote sensing detection studies, where dataset-specific SOTA methods are selected to highlight domain-specific improvements and all the experimental data are divided into a training set and a testing set by 4:1. The proposed models were constructed using the PyTorch 2.1.1 and deployed on a workstation equipped with an NVIDIA 4060Ti GPU. The Stochastic Gradient Descent (SGD) optimizer was used in model training, with an initial learning rate of 0.01, momentum of 0.937, and weight decay of 0.0005; the batch size during model training was set to 16; the models utilized in all experiments were trained on the training set for 300 epochs. To evaluate the detection performance and lightweight effect of the proposed model, the mean average precision at 0.5 (mAP@0.5) was used as an evaluation metric to assess detection accuracy, and the computational floating-point operations (GFLOPs), number of parameters (Params), and inference speed (FPS) were used to evaluate the lightweight effect.
4.1. Comparisons with Existing Methods
The proposed model’s detection results obtained on the VEDAI dataset are shown in Table 1. The proposed model was compared with lightweight CNNs, the basic YOLOv5 model, higher versions YOLO (YOLOv8, YOLOv9), different models based on the YOLO, refs. [2,9,10,15,45,46,47], and other representative detection methods [2,48,49,50]. The comparison results show that compared to the basic YOLOv5 model, the HFEF2-YOLO improved the mAP@0.5 by nearly 0.06 and mAP@0.5:0.95 by nearly 0.02. In addition, there were certain improvements in detection accuracy (precision) and detection success rate (recall), indicating that the proposed HFEF2-YOLO had a significant advantage over the benchmark network in remote sensing small target detection. In addition, compared to the higher version of the YOLO basic model or other YOLO-based network structures, the HFEF2-YOLO achieved better performance. Due to the lightweight design concept of the HF-FPN and DSAM, the computational floating-point operations (GFLOPs) of the HFEF2-YOLO were slightly reduced compared to the base YOLOv5 model. After the introduction of the GhostModule, the GFLOPs of the L-HFEF2-YOLO were reduced to 23.6, showing an excellent lightweight effect. The detection accuracy was slightly reduced but still higher than most of the other models. Further, the detection was conducted on different target categories in the VEDIA dataset, as shown in Table 2. The HFEF2-YOLO achieved improvements in mAP@0.5, precision, and recall. Figure 7 shows the visualization comparison of the HFEF2-YOLO and the basic YOLOv5 model. The YOLOv5 model often leads to undetected and misclassified objects in complex images, while the proposed network could achieve more appropriate detection results. In addition, the overall score of the YOLOv5 model for each detected object was lower than that of the proposed network, demonstrating that the proposed network could be more suitable for small target detection tasks than the YOLOv5 model.

Table 1.
Performance Comparison of Different Methods on the VEDAI Dataset.
Table 2.
Performance Comparison of Different Methods on the VEDAI Dataset (All Categories).
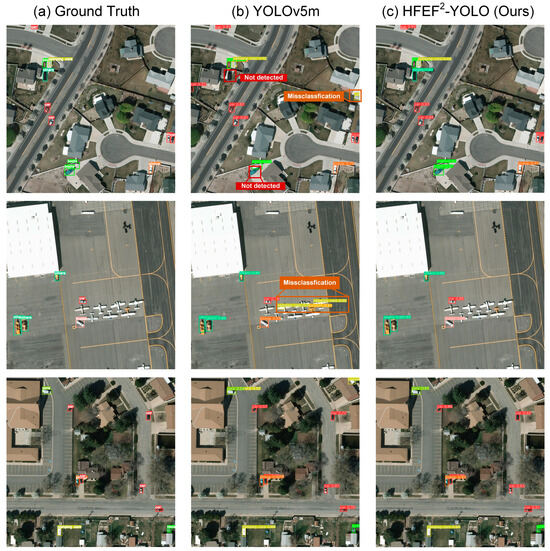
Figure 7.
The visual analysis results of the HFEF2-YOLO on the VEDAI dataset.
It is worth noting that the VEDAI dataset has a class imbalance (e.g., more “cars” than “boats”). While HFEF2-YOLO does not explicitly introduce class-balancing techniques (e.g., resampling or class-weighted loss), its architecture inherently mitigates class imbalance through three mechanisms: (1) The hierarchical dynamic gating mechanism adaptively enhances discriminative features of underrepresented classes (e.g., “boats”). By generating channel-specific weights, Wc, and spatial attention Ws, the model prioritizes minority-class regions (e.g., small boat edges) during feature fusion, reducing bias toward dominant classes like “cars”. (2) The Dynamic Spatial–Spectral Attention Module (DSAM) assigns unique spatial weights per channel, suppressing background noise (e.g., water surfaces) that often obscures minority classes. This context-aware filtering amplifies subtle features of rare targets, compensating for their limited training samples. (3) The Global Feature Enhancement Module (GFEM) integrates global statistical priors (e.g., edge and texture patterns) through GAP/GMP, ensuring stable feature extraction even for low-frequency classes.
In addition to the VEDIA dataset, the HFEF2-YOLO also performed excellently on the AI-TOD datasets, which was another small target dataset. Table 3 shows that compared with the SOTA methods [9,51,52,53,54], HFEF2-YOLO achieve the best performance. In the test set, the mAP@0.5 reaches 0.621. The mAP@0.5:0.95, mAPvt, mAPt, and mAPs reach 0.280, 0.130, 0.251, and 0.319, respectively. The results demonstrate the excellent performance of HFEF2-YOLO for small object detection in remote sensing. Figure 8 shows the visualization comparison of the HFEF2-YOLO and the basic YOLOv5 model. The YOLOv5 model often leads to low precision and misclassified objects in complex images, while the proposed network could achieve more appropriate detection results.
Table 3.
Performance Comparison Results of Different Methods on the AI-TOD Dataset.
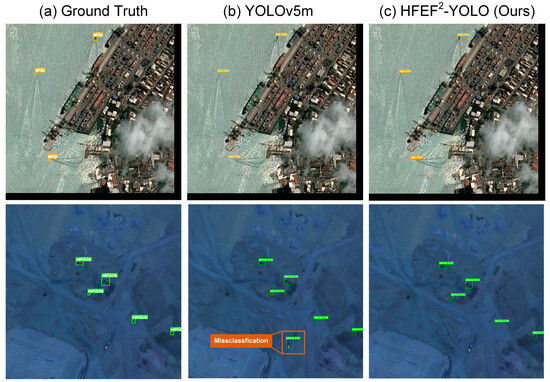
Figure 8.
The visual analysis results of the HFEF2-YOLO on the AI-TOD dataset.
Furthermore, the HFEF2-YOLO also performed excellently on the DOTA, which was a small-medium target dataset. All experiments on the DOTA dataset were conducted using the DOTA-v1.5 version, which includes enhanced annotations for small targets and an additional ‘container crane’ class. This version is widely recognized for benchmarking multi-scale detection tasks in remote sensing. Table 4 presents the comparison results of the proposed HFEF2-YOLO model with the YOLOv5 base model, YOLOv8, YOLOv9, Fast-R-CNN [2], RetinaNet [21], SSD [5], and other related YOLO-based models [11,14,31]. The results show that compared to the YOLOv5 base model, the HFEF2-YOLO improved the mAP@0.5 value by nearly 0.012 and the F1 score by approximately 0.01. The detection results of the HFEF2-YOLO are presented in Figure 9. Compared to the small target objects annotated in the ground truth, the HFEF2-YOLO achieved effective identification and detection. At the same time, it could also accurately identify small targets not annotated in the ground truth, which proved its capability in small target detection.
Table 4.
Performance Comparison Results of Different Methods on the DOTA Dataset.
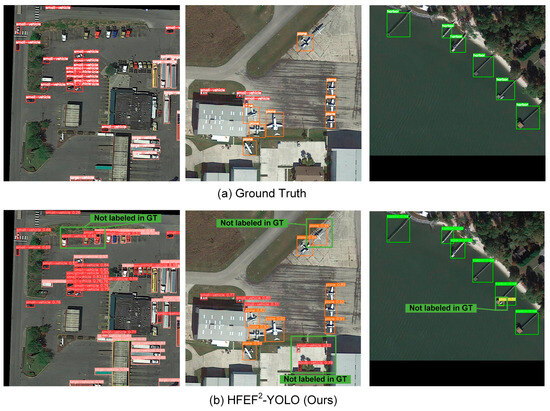
Figure 9.
Visual analysis results of the HFEF2-YOLO model on the DOTA dataset.
The proposed HFEF2-YOLO model could also perform excellently in the detection of larger targets due to the multi-scale feature expression capability of the HF-FPN and the efficient attention mechanism of the HF-DSA. Table 5 shows the comparison results of the HFEF2-YOLO model with the YOLOv5 base model and YOLOv8, YOLOv9, MSF-SNET [55], CBFF-SSD [56], and other YOLO-based model frameworks on the NWPU VHR-10 dataset [10,15,27,28,29,30,57,58]. The results show that compared to the YOLOv5 base model, the HFEF2-YOLO improved the mAP@0.5 value by nearly 0.008 and also achieved improvements compared to the other models. The results presented in Table 5 show that HFEF2-YOLO achieved only a 0.008 improvement over the baseline model (YOLOv5) on the NWPU VHR-10 dataset, which may appear insignificant. To address this concern, we conducted a statistical significance validation with the following steps: We randomly selected 100 images from the test set of the NWPU VHR-10 dataset and performed multiple repeated inferences (n = 10) using both the baseline model (YOLOv5m) and the improved model (HFEF2-YOLO), recording the mAP@0.5 values for each run, as shown in Table 6. The results show that HFEF2-YOLO achieves a mean mAP@0.5 of 0.969 (std = 0.0018), significantly outperforming YOLOv5m (mean = 0.961, std = 0.0025) with p = 0.012 (independent t-test). The 95% confidence interval of the mean difference (0.003–0.013) further confirms the stability of the improvement. It is worth noting that the improvement of HFEF2-YOLO on the NWPU VHR-10 dataset is relatively small, which may be attributed to the high baseline performance of the dataset (YOLOv5m already achieves an mAP@0.5 of 0.961), approaching the upper limit of detection tasks. In this context, an absolute improvement of 0.8% holds practical significance. For example, in the case of critical targets in remote sensing images (e.g., ships, vehicles), this improvement could reduce the risk of missed detections.
Table 5.
Performance Comparison of Different Methods on the NWPU VHR-10 Dataset.
Table 6.
The mAP@0.5 of YOLOv5 and HFEF2-YOLO under multiple repeated inferences.
Figure 10 presents the comparison results of the ground truth and the model’s detection values. The results indicate that many objects that were not annotated in the ground truth were detected by the model, which meant that even if only a part of an object was visible, it could be detected, which proved the proposed network’s effective use of internal object information. Moreover, it was also observed that for some categories, the bounding boxes produced by the proposed network were generally more suitable for an object compared to the ground truth bounding boxes, which was due to the limitations of manually labeled datasets. Thus, the results demonstrated the ability of the proposed network to detect objects accurately, even in the absence of feature information.
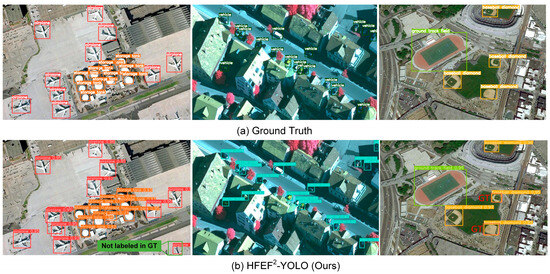
Figure 10.
Visual analysis results of the HFEF2-YOLO on the NWPU VHR-10 dataset.
4.2. Ablation Experiments
To analyze the importance of each module in the proposed HFEF2-YOLO, this study added the HF-FPN, DSAM, and Global-SPPF modules to the YOLOv5 base model one by one to verify their effectiveness and effect on the model’s performance by ablation experiments on the VEDIA dataset. The effect of adding or removing each module of the proposed model on the evaluation metrics is presented in Table 7, where √ indicates the presence of a specific module, and x indicates its absence. The results show that the addition of the DSAM alone had the most significant effect, indicating that the unique spatial attention weights assigned to each channel were crucial for detecting small targets. The addition of the HF-FPN module alone improved the base model from 0.703 to 0.718. The improvement effect of adding the Global-SPPF module alone was the lowest, indicating that the optimization strategy of the SPPF had limited performance in enhancing the small target detection effect. In addition, it is worth noting that the addition of any of the modules did not significantly increase the parameter volume of the base model. Particularly, after adding the HF-FPN module, the model’s parameter volume was significantly reduced, which was due to the lightweight design of the HF-FPN.
Table 7.
Results of the Ablation Experiment.
4.2.1. HF-FPN
Several sets of remote sensing images with multi-scale small target features were selected and processed by the HF-FPN, and the results were compared with the results of traditional feature pyramid methods, as shown in Figure 11, where brighter areas indicate that the model paid more attention to that part. After traditional feature pyramid processing, the multi-scale small targets in the original image were slightly distinguished from the background information, with many background areas that were too bright, which implied that the model was still overly focused on the background features, affecting the accuracy of target detection. In stark contrast, when the image was processed by the HF-FPN, the feature representation of small objects was enhanced, and the background information was effectively suppressed. At the same time, objects with different feature sizes had different brightness due to the effective expression of multi-scale features of the HF-FPN.
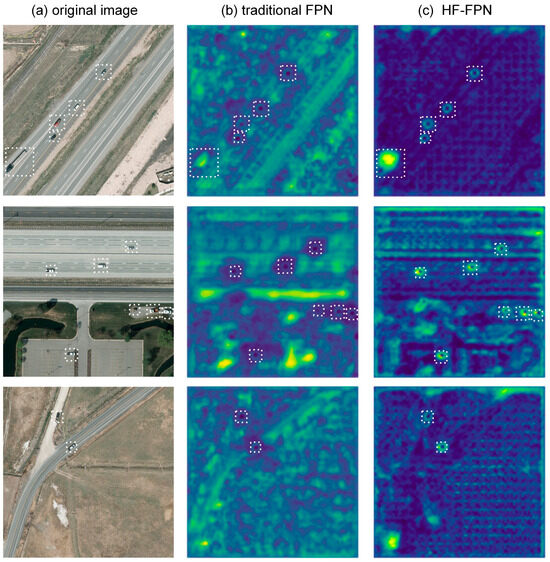
Figure 11.
Visual comparison results of feature representations between the HF-FPN and traditional feature pyramid.
Next, the detection capabilities of the commonly used feature pyramid models were compared with the proposed HF-FPN model. The specific steps involved integrating a feature pyramid into the neck part of the YOLO model and using the VEDI dataset to evaluate the detection results of the models. The comparison results are shown in Table 8, where it can be seen that compared to traditional feature pyramids, such as AFPN [59], ASFF [60], and BiFPN [33], the proposed HF-FPN had advantages in both detection accuracy and computational cost. To facilitate subsequent module integration, this study introduced the BiFPN framework into the feature fusion part of the HF-FPN model, developing the HBFPN architecture, which further reduced the GFLOPS and improved detection accuracy.
Table 8.
Comparison of Detection Effects of the HSFPN and Three Feature Pyramid Methods on the VEDAI Dataset.
4.2.2. DSAM
This study combined the currently popular spatial attention and channel attention mechanisms, including theCA [37], ECA [38], CBAM [39], and GAM [40], with the HF-FPN and compared them with the HF-DSAFusion. The specific modules were also integrated into the neck part of the YOLO model, and the detection results of different models were evaluated on the VEDI dataset, as shown in Table 9. The comparison results indicate that compared to the traditional attention mechanisms, the proposed DSA method has advantages in both detection accuracy and computational load. In addition, this study modified the different kernel sizes in the DSA module, and the results show that an increase in the kernel size decreases detection accuracy. In fact, a 1 × 1 kernel minimizes background noise introduced by larger kernels while compensating for limited receptive fields through dynamic weight allocation, which achieves cross-channel contextual correlation. In addition, the 1 × 1 convolution inherently functions as a channel attention mechanism, enhancing cross-channel features via dynamic weights without relying on spatially redundant computations. This aligns with the DSAM’s design goal of assigning channel-specific spatial weights. While larger kernels theoretically expand receptive fields, experimental results demonstrate that kernel_size = 1 achieves superior balance between precision and efficiency for small target detection tasks.
Table 9.
Comparison Results of Detection Effects of the DSA Fusion Module and Several Attention Mechanisms on the VEDAI Dataset.
Typical small target images were processed by the DSA module, and the obtained thermal imaging visualization results are shown in Figure 12. The parts of the image that the attention mechanism was focused on had higher heat and were closer to red in color. As presented in Figure 12, without the attention module, the heat distribution in the image did not show a strong regularity, and the small target objects that needed to be recognized were not given great attention. However, after processing by the DSA module, the small target objects exhibited a clear red color, indicating that the model focused on these objects, which was beneficial for subsequent target detection.
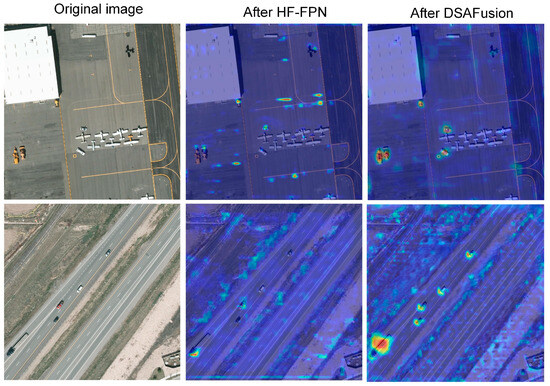
Figure 12.
Visual analysis results of the small target detection by the DSAM module.
In order to analyze how the learnable parameters in the DSAM change, we recorded the values of α at 50-epoch intervals during the 300-epoch training, as shown in Table 10. Here, L24–L26 correspond to P3/8 (small objects) for Layer 24, P4/16 (medium objects) for Layer 25, and P5/32 (large objects) for Layer 26. The learnable parameter α in Equation (3) is initialized to 0.5 across all layers and datasets to ensure an unbiased balance between channel and spatial attention at the start of training. During training, α dynamically adapts within an empirical range of 0.436–0.668, with convergence trends reflecting task-specific and layer-wise requirements. For instance, in the VEDAI dataset (complex backgrounds), α stabilizes at lower values (e.g., Layer 25: 0.436) to prioritize spatial attention for suppressing interference, while in DOTA (rotation-sensitive targets), α trends higher (e.g., Layer 26: 0.6228) to enhance channel attention for semantic discrimination. Layer-wise variations reveal deeper layers (e.g., Layer 26) favoring spatial alignment (α ≈ 0.45–0.63), whereas shallower layers (e.g., Layer 24) retain higher α values (≈0.45–0.53) to preserve channel-specific details for small targets. Cross-dataset analysis shows α adapting to dataset characteristics: VEDAI (mean α ≈ 0.441) emphasizes spatial filtering, DOTA (mean α ≈ 0.554) prioritizes channel refinement, AITOD (mean α ≈ 0.528) balances both for dense small targets, and NWPU (mean α ≈ 0.468) is due to balanced target scales. The dynamic adaptation of α, driven by backpropagation and dataset-specific demands, ensures optimal feature fusion across scales and scenarios, underscoring HFEF2-YOLO’s robustness in complex remote sensing tasks.
Table 10.
The values of α at 50-epoch intervals during the 300-epoch training in different datasets.
4.3. Robustness Experiments
In the actual imaging process, remote sensing data are often subject to various degradations, such as noise effects and different variations, which can cause the target objects to be mixed with a background, especially for small objects. To verify the robustness of the proposed HFEF2-YOLO model under the condition of image degradation, this study generated a series of test sets by simulating remote sensing image degradation based on our research. All test sets had the same original image but different degradation conditions. The degradations included image blurring, Gaussian noise, and low-light conditions. The results obtained for different image degradation types are displayed in Figure 13, where it can be seen that the degradation of images significantly impacted the features of small objects. The Peak Signal-to-Noise Ratio (PSNR) was selected to evaluate the quality of the degraded images. As shown in Table 8, the image quality after low-light processing was the worst. The YOLOv5 base model and the proposed HFEF2-YOLO model were compared on the degraded datasets, as shown in Table 11. The results indicated that both models showed a significant decline in the mAP@0.5 metric on the degraded datasets, with the most noticeable decline for blurring and noise degradation types. Subsequently, the degraded datasets were added to the training set; the models were retrained and then tested again. The test results showed that the detection effects of both models improved, but the performance of the HFEF2-YOLO was consistently better than that of the YOLO base version.
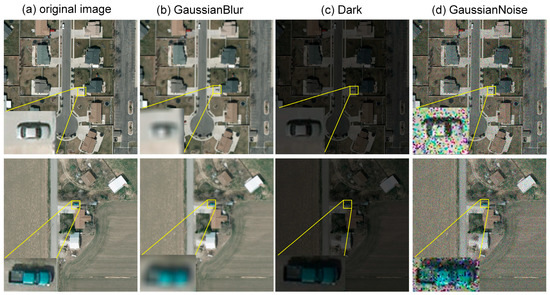
Figure 13.
Description of the degraded dataset.
Table 11.
Performance of the Model on the Degraded Dataset.
To further validate the model’s generalization ability on real-world hazy datasets, we conducted additional experiments on the RTSS (Real-world Task-Driven Testing Set) Dataset, which is a specialized test set designed for image dehazing and object detection. It is part of the RESIDE dataset and comprises 4322 real-world foggy images. We have manually annotated these images for testing YOLO models. The performance of YOLO and HFEF2-YOLO on the RTSS dataset is shown in Table 12 and Figure 14. The results show that HFEF2-YOLO improves the mAP@0.5 by 8% compared to the baseline model and does not exhibit any missed detections. For example, YOLOv5 missed detecting some cars and people in hazy conditions.
Table 12.
Performance of the Model on the real-world degraded dataset.
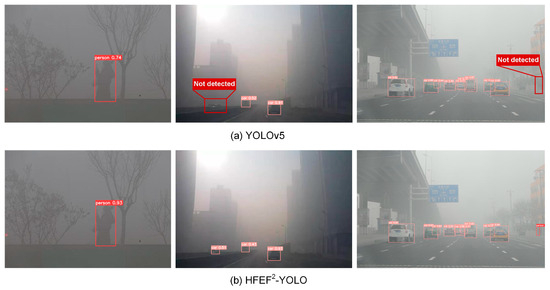
Figure 14.
The visual analysis results of the HFEF2-YOLO on the RTSS dataset.
4.4. Lightweight Model Comparison Experiments
To verify the lightweight effect of the L-HFEF2-YOLO model, this study compared the Ghost Module with several other lightweight modules, including the FasterBlock [61], HetConv [62], StaeNet [63], and PartialConv [61]. The comparison results obtained on the VEDIA dataset are presented in Table 13, and to make it more visually intuitive, we have plotted a scatter diagram of FPS-MAP (Figure 15). As can be seen from the scatter plot, FasterBlock achieved the best performance in terms of the mAP@0.5 metric, but it was not the best-performing model in terms of the GFLOPS, parameter volume, and inference speed. The PartialConv could effectively reduce the computational load and parameter volume, but its detection accuracy decreased significantly. With similar GFLOPs, the proposed Ghost Module based on dynamic convolution technology had an outstanding balance effect, showing significant advantages in detection accuracy, parameter volume, and inference speed compared to the other methods.
Table 13.
Comparison Results of Different Lightweight Methods.
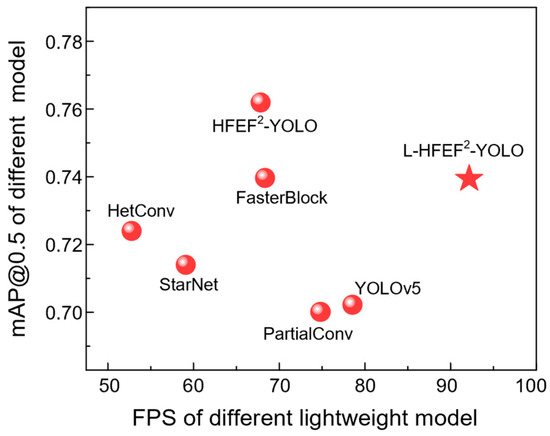
Figure 15.
The scatter plot of FPS-mAP.
5. Discussion
HFEF2-YOLO achieves mAP@0.5 scores of 0.761, 0.621, 0.737, and 0.969 on the VEDAI, AI-TOD, DOTA, and NWPU VHR-10 datasets, respectively (Table 1, Table 2, Table 3, Table 4 and Table 5). These improvements stem from the following design innovations: (1) Effectiveness of the Dynamic Gating Mechanism: The HF-FPN enhances cross-scale feature fusion through dynamic filtering, improving mAP@0.5 on different datasets compared by benchmark model, significantly outperforming traditional FPN methods. (2) Robustness of the DSAM: By leveraging channel-specific spatial weights (Equation (3)), the HFEF2-YOLO enhances weak feature representations of small targets and suppresses background confusion by considering the interplay of channel attention and spatial attention. 3) Balance in Lightweight Design: The L-HFEF2-YOLO reduces parameters by 42% (15.1 M→9.54 M) while maintaining >95% accuracy (0.761→0.737 mAP@0.5), surpassing PartialConv (0.701 mAP@0.5) and HetConv (0.724 mAP@0.5) (Table 10). In addition, under simulated degradation, HFEF2-YOLO exhibits a 12.7% average decline in mAP@0.5, significantly lower than YOLO v5m (23.5%), validating the DSAM’s robustness to noise and blur. Generally speaking, HFEF2-YOLO sets a new benchmark for accuracy, while L-HFEF2-YOLO bridges the gap between high precision and practical deployment in resource-constrained scenarios.
The high accuracy and lightweight design of HFEF2-YOLO make it suitable for the following scenarios: (1) Satellite Real-Time Monitoring: Deploying the lightweight L-HFEF2-YOLO on edge devices enables real-time monitoring of maritime vessels and traffic vehicles. (2) Disaster Emergency Response: Leveraging degradation robustness under low-light conditions, the model detects damaged structures or trapped individuals in smoke-obscured, earthquake debris, or flood-affected areas; (3) Urban Smart Management: Through multi-scale feature fusion and dynamic attention, the model accurately identifies traffic signs and micro-drones in dense urban areas. Additionally, existing research on remote sensing detection methods typically compares performance across different datasets using varied methodologies, with few studies evaluating the same method across all four datasets mentioned above. This is primarily because state-of-the-art (SOTA) methods are often tailored to specific tasks (e.g., Super-YOLO focuses on small objects, while SPH-YOLO integrates self-attention mechanisms for multi-scale fusion) and are validated only on relevant datasets in their original papers. Many of these methods lack open-source code or pre-trained models, requiring significant additional engineering effort to reproduce. In future work, we will prioritize reproducing methods like SPH-YOLO (DOTA), FFCA-YOLO (VEDAI), and KCFS-YOLO (NWPU VHR-10) across all four datasets, despite current challenges (e.g., lack of open-source code). We will also develop a standardized evaluation protocol where all compared methods are tested on the same datasets, even if their original papers focused on specific tasks.
6. Conclusions
This study proposes HFEF2-YOLO, a hierarchical dynamic attention-based framework for high-precision small target detection in remote sensing. The HFEF2-YOLO consists of the GFEM, DSAM, and HF-FPN modules. The feature enhancement of a multi-scale target is realized by the GFEM, which mainly optimizes the SPPF layer by using global average pooling layers and global maximum pooling layers and incorporates global background and edge information to help the network make better judgments. In addition, multi-scale feature fusion enhancement is realized by the HF-FPN, which improves the detector’s ability to capture target features through hierarchical screening and feature selection. Moreover, the DSAM assigns unique spatial attention weights to each channel, enhances weak feature representations of small targets, and suppresses background confusion by considering the interplay of channel attention and spatial attention. Extensive experiments demonstrate HFEF2-YOLO’s superiority across datasets and degradation scenarios. Future work will explore dynamic kernel strategies and adaptive degradation augmentation to further enhance practicality and generalization.
Author Contributions
Y.L. was the main contributor to this work. Y.H. and C.Z. mainly contributed to modify the algorithm. B.Z. and Y.W. participated in the preparation of the article structure as communicated authors. C.Z. gave guidance for this article. All authors have read and agreed to the published version of the manuscript.
Funding
This work was supported by the Major International (Regional) Joint Research Project of the National Natural Science Foundation of China (Grant No. 42020104008), the Key Program of the National Natural Science Foundation of China (Grant No. 41530422), the Shaanxi Fundamental Science Research Project for Mathematics and Physics (Grant No. 22JSZ007), and the National High Technology Research and Development Program of China (863 Program) (Grant No. 2012AA121101).
Data Availability Statement
In this work, the open remote sensing datasets that support the findings of this study are available from https://github.com/ The DOTA dataset is available at https://captain-whu.github.io/DOTA. The vehicle detection in aerial imagery (VEDAI) dataset is available at https://downloads.greyc.fr/vedai/, and the NWPU VHR-10 dataset is available at https://github.com/Gaoshuaikun/NWPU-VHR-10, accessed on 17 March 2024.
Conflicts of Interest
Author Biyun Zhang was employed by the company BA Trading (Guangzhou) Co., Ltd. The remaining authors declare that the research was conducted in the absence of any commercial or financial relationships that could be construed as a potential conflict of interest.
References
- Girshick, R.; Donahue, J.; Darrell, T.; Malik, J. Rich Feature Hierarchies for Accurate Object Detection and Semantic Segmentation. In Proceedings of the 2014 IEEE Conference on Computer Vision and Pattern Recognition, Columbus, OH, USA, 23–28 June 2014; pp. 580–587. [Google Scholar]
- Ren, S.; He, K.; Girshick, R.; Sun, J. Faster R-CNN: Towards Real-Time Object Detection with Region Proposal Networks. IEEE Trans. Pattern Anal. Mach. Intell. 2017, 39, 1137–1149. [Google Scholar] [CrossRef] [PubMed]
- Lin, T.-Y.; Dollar, P.; Girshick, R.; He, K.; Hariharan, B.; Belongie, S. Feature Pyramid Networks for Object Detection. In Proceedings of the 2017 IEEE Conference on Computer Vision and Pattern Recognition (CVPR), Honolulu, HI, USA, 21–26 July 2017; pp. 936–944. [Google Scholar]
- He, K.; Gkioxari, G.; Dollár, P.; Girshick, R. Mask R-CNN. In Proceedings of the IEEE International Conference on Computer Vision (ICCV), Venice, Italy, 22–29 October 2017; pp. 2980–2988. [Google Scholar]
- Liu, W.; Anguelov, D.; Erhan, D.; Szegedy, C.; Reed, S.; Fu, C.-Y.; Berg, A.C. SSD: Single Shot MultiBox Detector. In Proceedings of the European Conference on Computer Vision (ECCV), Amsterdam, Netherlands, 11–14 October 2016; pp. 21–37. [Google Scholar]
- Zhang, X.; Feng, Y.; Zhang, S.; Wang, N.; Lu, G.; Mei, S. Robust Aerial Person Detection with Lightweight Distillation Network for Edge Deployment. IEEE Trans. Geosci. Remote Sens. 2024, 62, 5630616. [Google Scholar] [CrossRef]
- Zhang, Z.; Mei, S.; Ma, M.; Han, Z. Adaptive Composite Feature Generation for Object Detection in Remote Sensing Images. IEEE Trans. Geosci. Remote Sens. 2024, 62, 5631716. [Google Scholar] [CrossRef]
- Mei, S.; Lian, J.; Wang, X.; Su, Y.; Ma, M.; Chau, L.-P. A Comprehensive Study on the Robustness of Deep Learning-Based Image Classification and Object Detection in Remote Sensing: Surveying and Benchmarking. J. Remote Sens. 2024, 4, 0219. [Google Scholar] [CrossRef]
- Zhang, Y.; Ye, M.; Zhu, G.; Liu, Y.; Guo, P.; Yan, J. FFCA-YOLO for Small Object Detection in Remote Sensing Images. IEEE Trans. Geosci. Remote Sens. 2024, 62, 1–15. [Google Scholar] [CrossRef]
- Shin, Y.; Shin, H.; Ok, J.; Back, M.; Youn, J.; Kim, S. DCEF2-YOLO: Aerial Detection YOLO with Deformable Convolution–Efficient Feature Fusion for Small Target Detection. Remote Sens. 2024, 16, 1071. [Google Scholar] [CrossRef]
- Zhao, H.; Chu, K.; Zhang, J.; Feng, C. YOLO-FSD: An Improved Target Detection Algorithm on Remote-Sensing Images. IEEE Sens. J. 2023, 23, 30751–30764. [Google Scholar] [CrossRef]
- Zhang, Z.; Jiang, R.; Mei, S.; Zhang, S.; Zhang, Y. Rotation-Invariant Feature Learning for Object Detection in VHR Optical Remote Sensing Images by Double-Net. IEEE Access 2020, 8, 20818–20827. [Google Scholar] [CrossRef]
- Li, K.; Cheng, G.; Bu, S.; You, X. Rotation-Insensitive and Context-Augmented Object Detection in Remote Sensing Images. IEEE Trans. Geosci. Remote Sens. 2018, 56, 2337–2348. [Google Scholar] [CrossRef]
- Han, H.; Zhu, F.; Zhu, B.; Wu, H. Target Detection of Remote Sensing Image Based on an Improved YOLOv5. IEEE Geosci. Remote Sens. Lett. 2023, 20, 1–5. [Google Scholar] [CrossRef]
- Zhang, J.; Lei, J.; Xie, W.; Fang, Z.; Li, Y.; Du, Q. SuperYOLO: Super Resolution Assisted Object Detection in Multimodal Remote Sensing Imagery. IEEE Trans. Geosci. Remote Sens. 2023, 61, 1–15. [Google Scholar] [CrossRef]
- Cai, Z.; Fan, Q.; Feris, R.S.; Vasconcelos, N. A Unified Multi-scale Deep Convolutional Neural Network for Fast Object Detection. 2016. Available online: https://ui.adsabs.harvard.edu/abs/2016arXiv160707155C (accessed on 17 September 2016).
- Dai, J.; Li, Y.; He, K.; Sun, J. R-FCN: Object Detection via Region-based Fully Convolutional Network. In Proceedings of the 30th International Conference on Neural Information Processing Systems (Neur IPS), Barcelona, Spain, 5–10 December 2016; pp. 379–387. [Google Scholar]
- Redmon, J.; Farhadi, A. YOLOv3: An Incremental Improvement. 2018. Available online: https://ui.adsabs.harvard.edu/abs/2018arXiv180402767R (accessed on 8 April 2018).
- Redmon, J.; Divvala, S.; Girshick, R.; Farhadi, A. You Only Look Once: Unified, Real-Time Object Detection. In Proceedings of the IEEE Conference on Computer Vision and Pattern Recognition (CVPR), Las Vegas, NE, USA, 27–30 June 2016; pp. 779–788. [Google Scholar]
- Redmon, J.; Farhadi, A. YOLO9000:Better, Faster, Stronger. In Proceedings of the IEEE Conference on Computer Vision and Pattern Recognition (CVPR), Honolulu, HI, USA, 21–26 July 2017; pp. 6517–6525. [Google Scholar]
- Lin, T.-Y.; Goyal, P.; Girshick, R.; He, K.; Dollar, P. Focal Loss for Dense Object Detection. In Proceedings of the 2017 IEEE International Conference on Computer Vision (ICCV), Venice, Italy, 22–29 October 2017; pp. 2999–3007. [Google Scholar]
- Zhang, S.; Wen, L.; Bian, X.; Lei, Z.; Li, S.Z. Single-Shot Refinement Neural Network for Object Detection. In Proceedings of the IEEE Conference on Computer Vision and Pattern Recognition (CVPR), Salt Lake City, UT, USA, 18–22 June 2018; pp. 4203–4212. [Google Scholar]
- Sermanet, P.; Eigen, D.; Zhang, X.; Mathieu, M.; Fergus, R.; LeCun, Y. OverFeat: Integrated Recognition, Localization and Detection Using Convolutional Networks. 2013. Available online: https://ui.adsabs.harvard.edu/abs/2013arXiv1312.6229S (accessed on 24 February 2014).
- Li, Z.; Yang, L.; Zhou, F. FSSD: Feature Fusion Single Shot Multibox Detector. 2017. Available online: https://ui.adsabs.harvard.edu/abs/2017arXiv171200960L (accessed on 4 December 2017).
- Shen, Z.; Liu, Z.; Li, J.; Jiang, Y.-G.; Chen, Y.; Xue, X. DSOD: Learning Deeply Supervised Object Detectors from Scratch. In Proceedings of the 2017 IEEE International Conference on Computer Vision (ICCV), Venice, Italy, 22–29 October 2017; pp. 1937–1945. [Google Scholar]
- Law, H.; Deng, J. CornerNet: Detecting Objects as Paired Keypoints. In Proceedings of the European Conference on Computer Vision (ECCV), Munich, Germany, 8–14 September 2018; pp. 734–750. [Google Scholar]
- Tian, Z.; Huang, J.; Yang, Y.; Nie, W. KCFS-YOLOv5: A High-Precision Detection Method for Object Detection in Aerial Remote Sensing Images. Appl. Sci. 2023, 13, 649. [Google Scholar] [CrossRef]
- Shen, L.; Lang, B.; Song, Z. DS-YOLOv8-Based Object Detection Method for Remote Sensing Images. IEEE Access 2023, 11, 125122–125137. [Google Scholar] [CrossRef]
- Gu, Q.; Huang, H.; Han, Z.; Fan, Q.; Li, Y. GLFE-YOLOX: Global and Local Feature Enhanced YOLOX for Remote Sensing Images. IEEE Trans. Instrum. Meas. 2024, 73, 2516112. [Google Scholar] [CrossRef]
- Min, L.; Fan, Z.; Lv, Q.; Reda, M.; Shen, L.; Wang, B. YOLO-DCTI: Small Object Detection in Remote Sensing Base on Contextual Transformer Enhancement. Remote Sens. 2023, 15, 3970. [Google Scholar] [CrossRef]
- Gong, H.; Mu, T.; Li, Q.; Dai, H.; Li, C.; He, Z.; Wang, W.; Han, F.; Tuniyazi, A.; Li, H.; et al. Swin-Transformer-Enabled YOLOv5 with Attention Mechanism for Small Object Detection on Satellite Images. Remote Sens. 2022, 14, 2861. [Google Scholar] [CrossRef]
- Liu, S.; Qi, L.; Qin, H.; Shi, J.; Jia, J. Path aggregation network for instance segmentation. In Proceedings of the IEEE Conference on Computer Vision and Pattern Recognition, Salt Lake City, UT, USA, 18–22 June 2018; pp. 8759–8768. [Google Scholar]
- Tan, M.; Pang, R.; Le, Q.V. EfficientDet: Scalable and Efficient Object Detection. In Proceedings of the 2020 IEEE/CVF Conference on Computer Vision and Pattern Recognition (CVPR), Seattle, WA, USA, 14–19 June 2020; pp. 10778–10787. [Google Scholar]
- Pang, J.; Chen, K.; Shi, J.; Feng, H.; Ouyang, W.; Lin, D. Libra r-cnn: Towards balanced learning for object detection. In Proceedings of the IEEE/CVF Conference on Computer Vision and Pattern Recognition, Long Beach, CA, USA, 15–20 June 2019; pp. 821–830. [Google Scholar]
- Luo, Y.; Cao, X.; Zhang, J.; Guo, J.; Shen, H.; Wang, T.; Feng, Q. CE-FPN: Enhancing channel information for object detection. Multimed. Tools Appl. 2022, 81, 30685–30704. [Google Scholar] [CrossRef]
- Huang, S.; Lu, Z.; Cheng, R.; He, C. Fapn: Feature-aligned pyramid network for dense image prediction. In Proceedings of the IEEE/CVF International Conference on Computer Vision, Montreal, QC, Canada, 10–17 October 2021; pp. 864–873. [Google Scholar]
- Hou, Q.; Zhou, D.; Feng, J. Coordinate Attention for Efficient Mobile Network Design. In Proceedings of the 2021 IEEE/CVF Conference on Computer Vision and Pattern Recognition (CVPR), Nashville, TN, USA, 19–25 June 2021; pp. 13708–13717. [Google Scholar]
- Wang, Q.; Wu, B.; Zhu, P.; Li, P.; Zuo, W.; Hu, Q. ECA-Net: Efficient Channel Attention for Deep Convolutional Neural Networks. In Proceedings of the 2020 IEEE/CVF Conference on Computer Vision and Pattern Recognition (CVPR), Seattle, WA, USA, 14–19 June 2020; pp. 11531–11539. [Google Scholar]
- Woo, S.; Park, J.; Lee, J.-Y.; Kweon, I.S. CBAM: Convolutional Block Attention Module. 2018. Available online: https://ui.adsabs.harvard.edu/abs/2018arXiv180706521W (accessed on 6 October 2018).
- Liu, Y.; Shao, Z.; Hoffmann, N. Global Attention Mechanism: Retain Information to Enhance Channel-Spatial Interactions. 2021. Available online: https://ui.adsabs.harvard.edu/abs/2021arXiv211205561L (accessed on 10 December 2021).
- Han, K.; Wang, Y.; Tian, Q.; Guo, J.; Xu, C.; Xu, C. GhostNet: More Features from Cheap Operations. 2019. Available online: https://ui.adsabs.harvard.edu/abs/2019arXiv191111907H (accessed on 1 June 2020).
- Chen, Y.; Dai, X.; Liu, M.; Chen, D.; Yuan, L.; Liu, Z. Dynamic Convolution: Attention over Convolution Kernels. 2019. Available online: https://ui.adsabs.harvard.edu/abs/2019arXiv191203458C (accessed on 5 December 2019).
- Sandler, M.; Howard, A.; Zhu, M.; Zhmoginov, A.; Chen, L.-C. MobileNetV2: Inverted Residuals and Linear Bottlenecks. 2018. Available online: https://ui.adsabs.harvard.edu/abs/2018arXiv180104381S (accessed on 8 January 2018).
- Li, H.; Kadav, A.; Durdanovic, I.; Samet, H.; Graf, H.P. Pruning Filters for Efficient ConvNets. 2016. Available online: https://ui.adsabs.harvard.edu/abs/2016arXiv160808710L (accessed on 31 August 2016).
- Momin, M.A.; Junos, M.H.; Mohd Khairuddin, A.S.; Abu Talip, M.S. Lightweight CNN model: Automated vehicle detection in aerial images. Signal Image Video Process. 2022, 17, 1209–1217. [Google Scholar] [CrossRef]
- Pham, M.-T.; Courtrai, L.; Friguet, C.; Lefèvre, S.; Baussard, A. YOLO-Fine: One-Stage Detector of Small Objects Under Various Backgrounds in Remote Sensing Images. Remote Sens. 2020, 12, 2501. [Google Scholar] [CrossRef]
- Fang, Q.; Wang, Z. Cross-Modality Attentive Feature Fusion for Object Detection in Multispectral Remote Sensing Imagery. 2021. Available online: https://ui.adsabs.harvard.edu/abs/2021arXiv211202991F (accessed on 10 May 2022).
- Zhao, Y.; Lv, W.; Xu, S.; Wei, J.; Wang, G.; Dang, Q.; Liu, Y.; Chen, J. DETRs Beat YOLOs on Real-Time Object Detection. 2023. Available online: https://ui.adsabs.harvard.edu/abs/2023arXiv230408069Z (accessed on 12 April 2023).
- Li, C.; Li, Y.; Chen, X.; Zhang, Y. Concerning Imbalance and Bounding Box Loss to Detect Small Targets in Remote Sensing. IEEE Sens. J. 2024, 24, 27631–27639. [Google Scholar] [CrossRef]
- Cao, Y.; Guo, L.; Xiong, F.; Kuang, L.; Han, X. Physical-Simulation-Based Dynamic Template Matching Method for Remote Sensing Small Object Detection. IEEE Trans. Geosci. Remote Sens. 2024, 62, 1–14. [Google Scholar] [CrossRef]
- Wang, J.; Yang, W.; Guo, H.; Zhang, R.; Xia, G.-S. Tiny Object Detection in Aerial Images. In Proceedings of the 2020 25th International Conference on Pattern Recognition (ICPR), Milan, Italy, 10–15 January 2021; pp. 3791–3798. [Google Scholar]
- Qiao, S.; Chen, L.-C.; Yuille, A. DetectoRS: Detecting Objects with Recursive Feature Pyramid and Switchable Atrous Convolution. In Proceedings of the 2021 IEEE/CVF Conference on Computer Vision and Pattern Recognition (CVPR), Nashville, TN, USA, 19–25 June 2021; pp. 10208–10219. [Google Scholar]
- Ma, M.; Pang, H. SP-YOLOv8s: An Improved YOLOv8s Model for Remote Sensing Image Tiny Object Detection. Appl. Sci. 2023, 13, 8161. [Google Scholar] [CrossRef]
- Guo, G.; Chen, P.; Yu, X.; Han, Z.; Ye, Q.; Gao, S. Save the Tiny, Save the All: Hierarchical Activation Network for Tiny Object Detection. IEEE Trans. Circuits Syst. Video Technol. 2024, 34, 221–234. [Google Scholar] [CrossRef]
- Huyan, L.; Bai, Y.; Li, Y.; Jiang, D.; Zhang, Y.; Zhou, Q.; Wei, J.; Liu, J.; Zhang, Y.; Cui, T. A Lightweight Object Detection Framework for Remote Sensing Images. Remote Sens. 2021, 13, 683. [Google Scholar] [CrossRef]
- Li, L.; Zhang, S.; Wu, J. Efficient Object Detection Framework and Hardware Architecture for Remote Sensing Images. Remote Sens. 2019, 11, 2376. [Google Scholar] [CrossRef]
- Zhu, S.; Miao, M. SCNet: A Lightweight and Efficient Object Detection Network for Remote Sensing. IEEE Geosci. Remote Sens. Lett. 2024, 21, 1–5. [Google Scholar] [CrossRef]
- Ran, Q.; Wang, Q.; Zhao, B.; Wu, Y.; Pu, S.; Li, Z. Lightweight Oriented Object Detection Using Multiscale Context and Enhanced Channel Attention in Remote Sensing Images. IEEE J. Sel. Top. Appl. Earth Obs. Remote Sens. 2021, 14, 5786–5795. [Google Scholar] [CrossRef]
- Yang, G.; Lei, J.; Zhu, Z.; Cheng, S.; Feng, Z.; Liang, R. AFPN: Asymptotic Feature Pyramid Network for Object Detection. 2023. Available online: https://ui.adsabs.harvard.edu/abs/2023arXiv230615988Y (accessed on 28 June 2023).
- Liu, S.; Huang, D.; Wang, Y. Learning Spatial Fusion for Single-Shot Object Detection. 2019. Available online: https://ui.adsabs.harvard.edu/abs/2019arXiv191109516L (accessed on 12 November 2019).
- Chen, J.; Kao, S.-h.; He, H.; Zhuo, W.; Wen, S.; Lee, C.-H.; Chan, S.H.G. Run, Don’t Walk: Chasing Higher FLOPS for Faster Neural Networks. In Proceedings of the 2023 IEEE/CVF Conference on Computer Vision and Pattern Recognition (CVPR), Vancouver, BC, Canada, 18–22 June 2023; pp. 12021–12031. [Google Scholar]
- Singh, P.; Verma, V.K.; Rai, P.; Namboodiri, V.P. HetConv: Heterogeneous Kernel-Based Convolutions for Deep CNNs. In Proceedings of the 2019 IEEE/CVF Conference on Computer Vision and Pattern Recognition (CVPR), Long Beach, CA, USA, 15–20 June 2019; pp. 4830–4839. [Google Scholar]
- Ma, X.; Dai, X.; Bai, Y.; Wang, Y.; Fu, Y. Rewrite the Stars. 2024. Available online: https://ui.adsabs.harvard.edu/abs/2024arXiv240319967M (accessed on 12 March 2024).
Disclaimer/Publisher’s Note: The statements, opinions and data contained in all publications are solely those of the individual author(s) and contributor(s) and not of MDPI and/or the editor(s). MDPI and/or the editor(s) disclaim responsibility for any injury to people or property resulting from any ideas, methods, instructions or products referred to in the content. |
© 2025 by the authors. Licensee MDPI, Basel, Switzerland. This article is an open access article distributed under the terms and conditions of the Creative Commons Attribution (CC BY) license (https://creativecommons.org/licenses/by/4.0/).