Article

The Spatiotemporal Evolution and Driving Factors of Surface Urban Heat Islands: A Comparative Study of Beijing and Dalian (2003–2023)

1
National Engineering Laboratory for Satellite Remote Sensing Applications, Aerospace Information Research Institute, Chinese Academy of Sciences, Beijing 100094, China
2
School of Electronic, Electrical and Communication Engineering, University of Chinese Academy of Sciences, Beijing 100049, China
3
School of Geographical Sciences, Southwest University, Chongqing 400715, China
4
College of Information Science and Technology, Dalian Maritime University, Dalian 116026, China
5
China Centre for Resources Satellite Data and Application, Beijing 100094, China
*
Author to whom correspondence should be addressed.
Remote Sens. 2025, 17(10), 1793; https://doi.org/10.3390/rs17101793
Submission received: 26 February 2025 / Revised: 15 April 2025 / Accepted: 15 May 2025 / Published: 21 May 2025

Abstract

:
The urban heat island (UHI) effect significantly impacts urban environments and quality of life, yet research comparing coastal and inland cities is relatively lacking. This study, using the MYD11A2 dataset, analyzes the spatiotemporal evolution of land surface temperature (LST) and the surface urban heat island intensity index (SUHIII) in Beijing (inland) and Dalian (coastal) from 2003 to 2023, exploring the driving factors from 2003 to 2018 and proposing mitigation strategies for similar cities. Key findings: (1) Beijing’s SUHIII is 0.45 °C higher than Dalian’s during summer days, while Dalian’s SUHIII is 0.24 °C stronger than Beijing’s during winter nights, likely due to Dalian’s maritime climate, which raises nighttime LSTs and intensifies the winter SUHIII. (2) Both cities show similar trends in LST and SUHIII, with fluctuations until 2010, an increase after 2011, and a peak in 2023, with the expansion of heat island areas occurring mainly in suburban regions. (3) From 2003 to 2018, TEMP is the primary factor promoting SUHIII, followed by ET and POP, with EVI as the main mitigating factor. Beijing’s PREP weakens SUHI, while Dalian’s PREP promotes it. Coastal cities should focus on water bodies and wetland planning to mitigate heat islands, especially in areas like Dalian which are affected by PREP.

1. Introduction

The urban heat island (UHI) effect, first identified by Manley [1] and later quantified by Oke [2,3], describes the phenomenon where urban centers experience higher temperatures compared to rural areas due to alterations in energy exchange between the urban surface and atmosphere. With over 70% of the global population expected to live in cities by 2050, including 255 million new urban residents in China [4,5], the UHI effect is becoming an increasingly critical environmental challenge. Urbanization exacerbates this effect through concentrated heat emissions from human activities [6] and the expansion of impervious surfaces, which restrict moisture evaporation and alter airflow, thereby intensifying heat loads [7]. This has led to increased energy demand, declining air quality [8,9], and significant public health risks [10,11,12,13]. In response, China has adopted proactive policies to mitigate the UHI effect, designating Dalian as a pilot city for climate adaptation, demonstrating its commitment to building climate resilience at the urban level [14,15]. These actions align with the broader goal of expanding climate-adaptive cities by 2030 [16], further underscoring the importance of UHI research.
Recent advances in remote sensing technology have significantly enhanced the methodologies and understanding of UHI studies [17]. Unlike early studies, which relied on unevenly distributed ground meteorological stations [18], satellite remote sensing offers broader coverage and higher spatiotemporal resolution [19], allowing for the more accurate detection of surface urban heat island (SUHI) phenomena. For instance, Cao et al. used Landsat 8 remote sensing images from the 2018–2019 growing season to compare the SUHI during heatwave and non-heatwave periods in Dalian City, finding that the SUHI intensity significantly increased during heatwaves, revealing the changing characteristics of the SUHI effect under extreme climate conditions [20]. Liu et al. systematically studied the spatiotemporal characteristics of the SUHIs in the Beijing–Tianjin–Hebei, Yangtze River Delta, and Pearl River Delta regions by analyzing MODIS surface temperature data from 2003 to 2014 and NOAA data from 1994. The results showed that the urbanization process significantly exacerbated the SUHI effect [21]. Similarly, Wang and Xu selected three Landsat images from 1990, 2000, and 2015 to analyze the changes in the SUHI effect in six mega-cities: Beijing, Shanghai, Guangzhou, London, New York, and Tokyo. They found that urban expansion and the increase in impervious surfaces led to an intensification of the SUHI effect [22]. Furthermore, Duan used Landsat series satellite imagery to perform surface temperature inversion and compared the SUHI effect between two inland cities, Xi’an and Nanjing, from 2002 to 2022. The study revealed similar increases in SUHI intensity in both cities, with Xi’an showing a more distinct spatial boundary between urban heat islands and cold islands compared to Nanjing [23].
While previous studies have enriched our understanding of the SUHI effect, most research has concentrated on individual cities or specific regions. Systematic research on the differences in the SUHI effect between coastal and inland cities, and how these differences are influenced by their distinct climates, remains limited and lacks comprehensive studies [24]. This study analyzes the SUHIII and its driving factors in Beijing (an inland city) and Dalian (a coastal city) to summarize the temporal and spatial variations in SUHIII and their driving factors in inland and coastal cities. The aim is to reveal the spatiotemporal changes in SUHIII and the associated driving factors between inland and coastal cities, providing a theoretical foundation for developing targeted heat island mitigation strategies for coastal and inland cities. Additionally, the study offers valuable insights for climate adaptation strategies and sustainable urban planning in similar cities in the future, while also serving as a valuable reference for SUHI research in other rapidly urbanizing regions, particularly in developing countries.

2. Study Area

Beijing and Dalian were selected for this study due to their geographical similarities in latitude and temperate climate, allowing for a comparative analysis of urban heat island effects. Despite both cities experiencing similar seasonal variations, they differ in geographical settings, with Beijing being an inland city and Dalian a coastal city, leading to distinct urban heat island dynamics. Additionally, their differences in urban development and planning, along with the availability of rich data, make them ideal subjects for this study.
Beijing is located at 39°26′N to 41°03′N and 115°25′E to 117°30′E, with an average elevation of 43.5 m. It exhibits the characteristics of a typical temperate monsoon climate zone, with hot summers and cold, dry winters. To illustrate the state of urban development, an average annual night light map of Beijing in 2023 is presented in Figure 1a. This map is derived from the VNP46A2 dataset, which provides nighttime visible and near-infrared light measurements from the day/night band (DNB), corrected for moonlight and atmospheric effects and refined using the Bidirectional Reflectance Distribution Function (BRDF) model. Figure 1a clearly shows a higher light intensity in the central area of Beijing, a feature closely related to the intensity of economic activity in the city’s commercial and administrative centers. The light intensity is particularly prominent in Chaoyang District, Haidian District, Xicheng District, and Dongcheng District. This aligns with their roles as core areas of urban functions and management, as well as centers of population and commercial agglomeration. In contrast, the map shows lower light intensity in areas far from the city center, such as Changping District and Shunyi District, showing a lower level of urban development compared to the central area, a lower density of economic activity, and a larger distribution of residential and industrial areas. In addition, the distribution of light intensity in Fangshan District and Tongzhou District shows a trend of gradually thinning from the center to the periphery, reflecting the transitional nature of urban development from the inside out [25]. Overall, the distribution of night lights in Beijing reveals the concentrated development of the central area, the transitional characteristics of the peripheral areas, and the spatial distribution characteristics of economic activity accompanying urban expansion.
Dalian is located on the Liaodong Peninsula at the southern end of Liaoning Province, with geographical coordinates of 38°43′N to 40°10′N and 120°58′E to 123°31′E, and an average elevation of approximately 50 m. Due to its unique geographical location, Dalian enjoys a temperate monsoon climate, with cool summers and mild winters. From the night light distribution map of Dalian in 2023 (Figure 1b), it can be observed that the highest light intensity is in Zhongshan District, which is consistent with its role as a commercial and administrative center, indicating a high degree of urbanization and the concentration of economic activity. Xigang District and Shahekou District also show higher light intensity, indicating that these areas are densely populated and commercial activity areas. The light in Lvshunkou District is relatively dispersed, reflecting the spread of urbanization and residential areas in this district. Jinzhou District, as a peripheral area, exhibits lower light intensity, showing a wider distribution of residential and industrial areas. Ganjingzi District shows concentrated bright spots, indicating that these are the gathering places for emerging technology companies and residential areas in Dalian [26]. Overall, the distribution of night lights in Dalian reflects a trend of gradually decreasing economic activity and urbanization levels from the city center to the periphery.

3. Data and Methods

3.1. Dataset

This study employed the Google Earth Engine version 0.1.388 (GEE V0.1.388) platform [27] to retrieve and preprocess rural background data, which included elevation, the Normalized Difference Vegetation Index (NDVI), land cover, and nighttime light data (Table 1). Elevation data were sourced from the Shuttle Radar Topography Mission (SRTM) dataset, providing global coverage with processed voids. NDVI values were extracted from the MOD13A2 V6.1 product, with scaling adjustments for accurate measurements. Land cover classifications came from the MCD12Q1_v06 product, which offers 17 land cover types based on IGBP guidelines. Nighttime light data were obtained from the DMSP-OLS v4 and VNP46A2 datasets, capturing visible and near-infrared emissions and offering an enhanced spatial and illumination resolution for precise Earth system analysis.
Based on extensive experience and a comprehensive review of the relevant literature [28,29,30,31], five key driver datasets were strategically selected to analyze their impact on SUHIs. These datasets included evapotranspiration (ET), population density (POP), the Enhanced Vegetation Index (EVI), average annual maximum daily temperature (TEMP), and precipitation (PREP), with detailed information provided in Table 1. Each of these factors was selected based on its direct relevance to understanding the formation and intensity of SUHI effects. Specifically, EVI focuses on vegetation cover and its role in cooling, while POP captures human activity’s influence on heat generation. ET is crucial for understanding the cooling potential of evapotranspiration, PREP highlights the effect of precipitation on surface moisture and heat dynamics, and TEMP provides a direct link to the spatial and temporal variations in SUHIs. The ET data were sourced from the Penman–Monteith–Leuning Evapotranspiration V2 (PML_V2) product, which divides ET into four categories: plant transpiration (Ec), soil evaporation (Es), water/ice evaporation (ET_water), and intercepted rainfall evaporation (Ei) [32,33]. In this study, the sum of these components represents the ET data. The LandScan Global dataset provides POP data, capturing 24 h environmental averages using spatial data and machine learning. EVI was derived from NOAA’s AVHRR MOD13A2 V6.1 product, showing heightened sensitivity in high-biomass areas. TEMP and PREP data were drawn from the HRLT dataset (1961–2019), offering high-resolution climate data for China with superior accuracy compared to alternatives [34]. Additionally, we used the China Land Cover Dataset (CLCD) to extract impermeable surfaces, which were incorporated as an auxiliary explanatory driving factor (Table 1). This dataset is based on Landsat imagery and has an overall accuracy of 79.31%, surpassing other datasets such as GlobeLand30 [35].

3.2. Methods

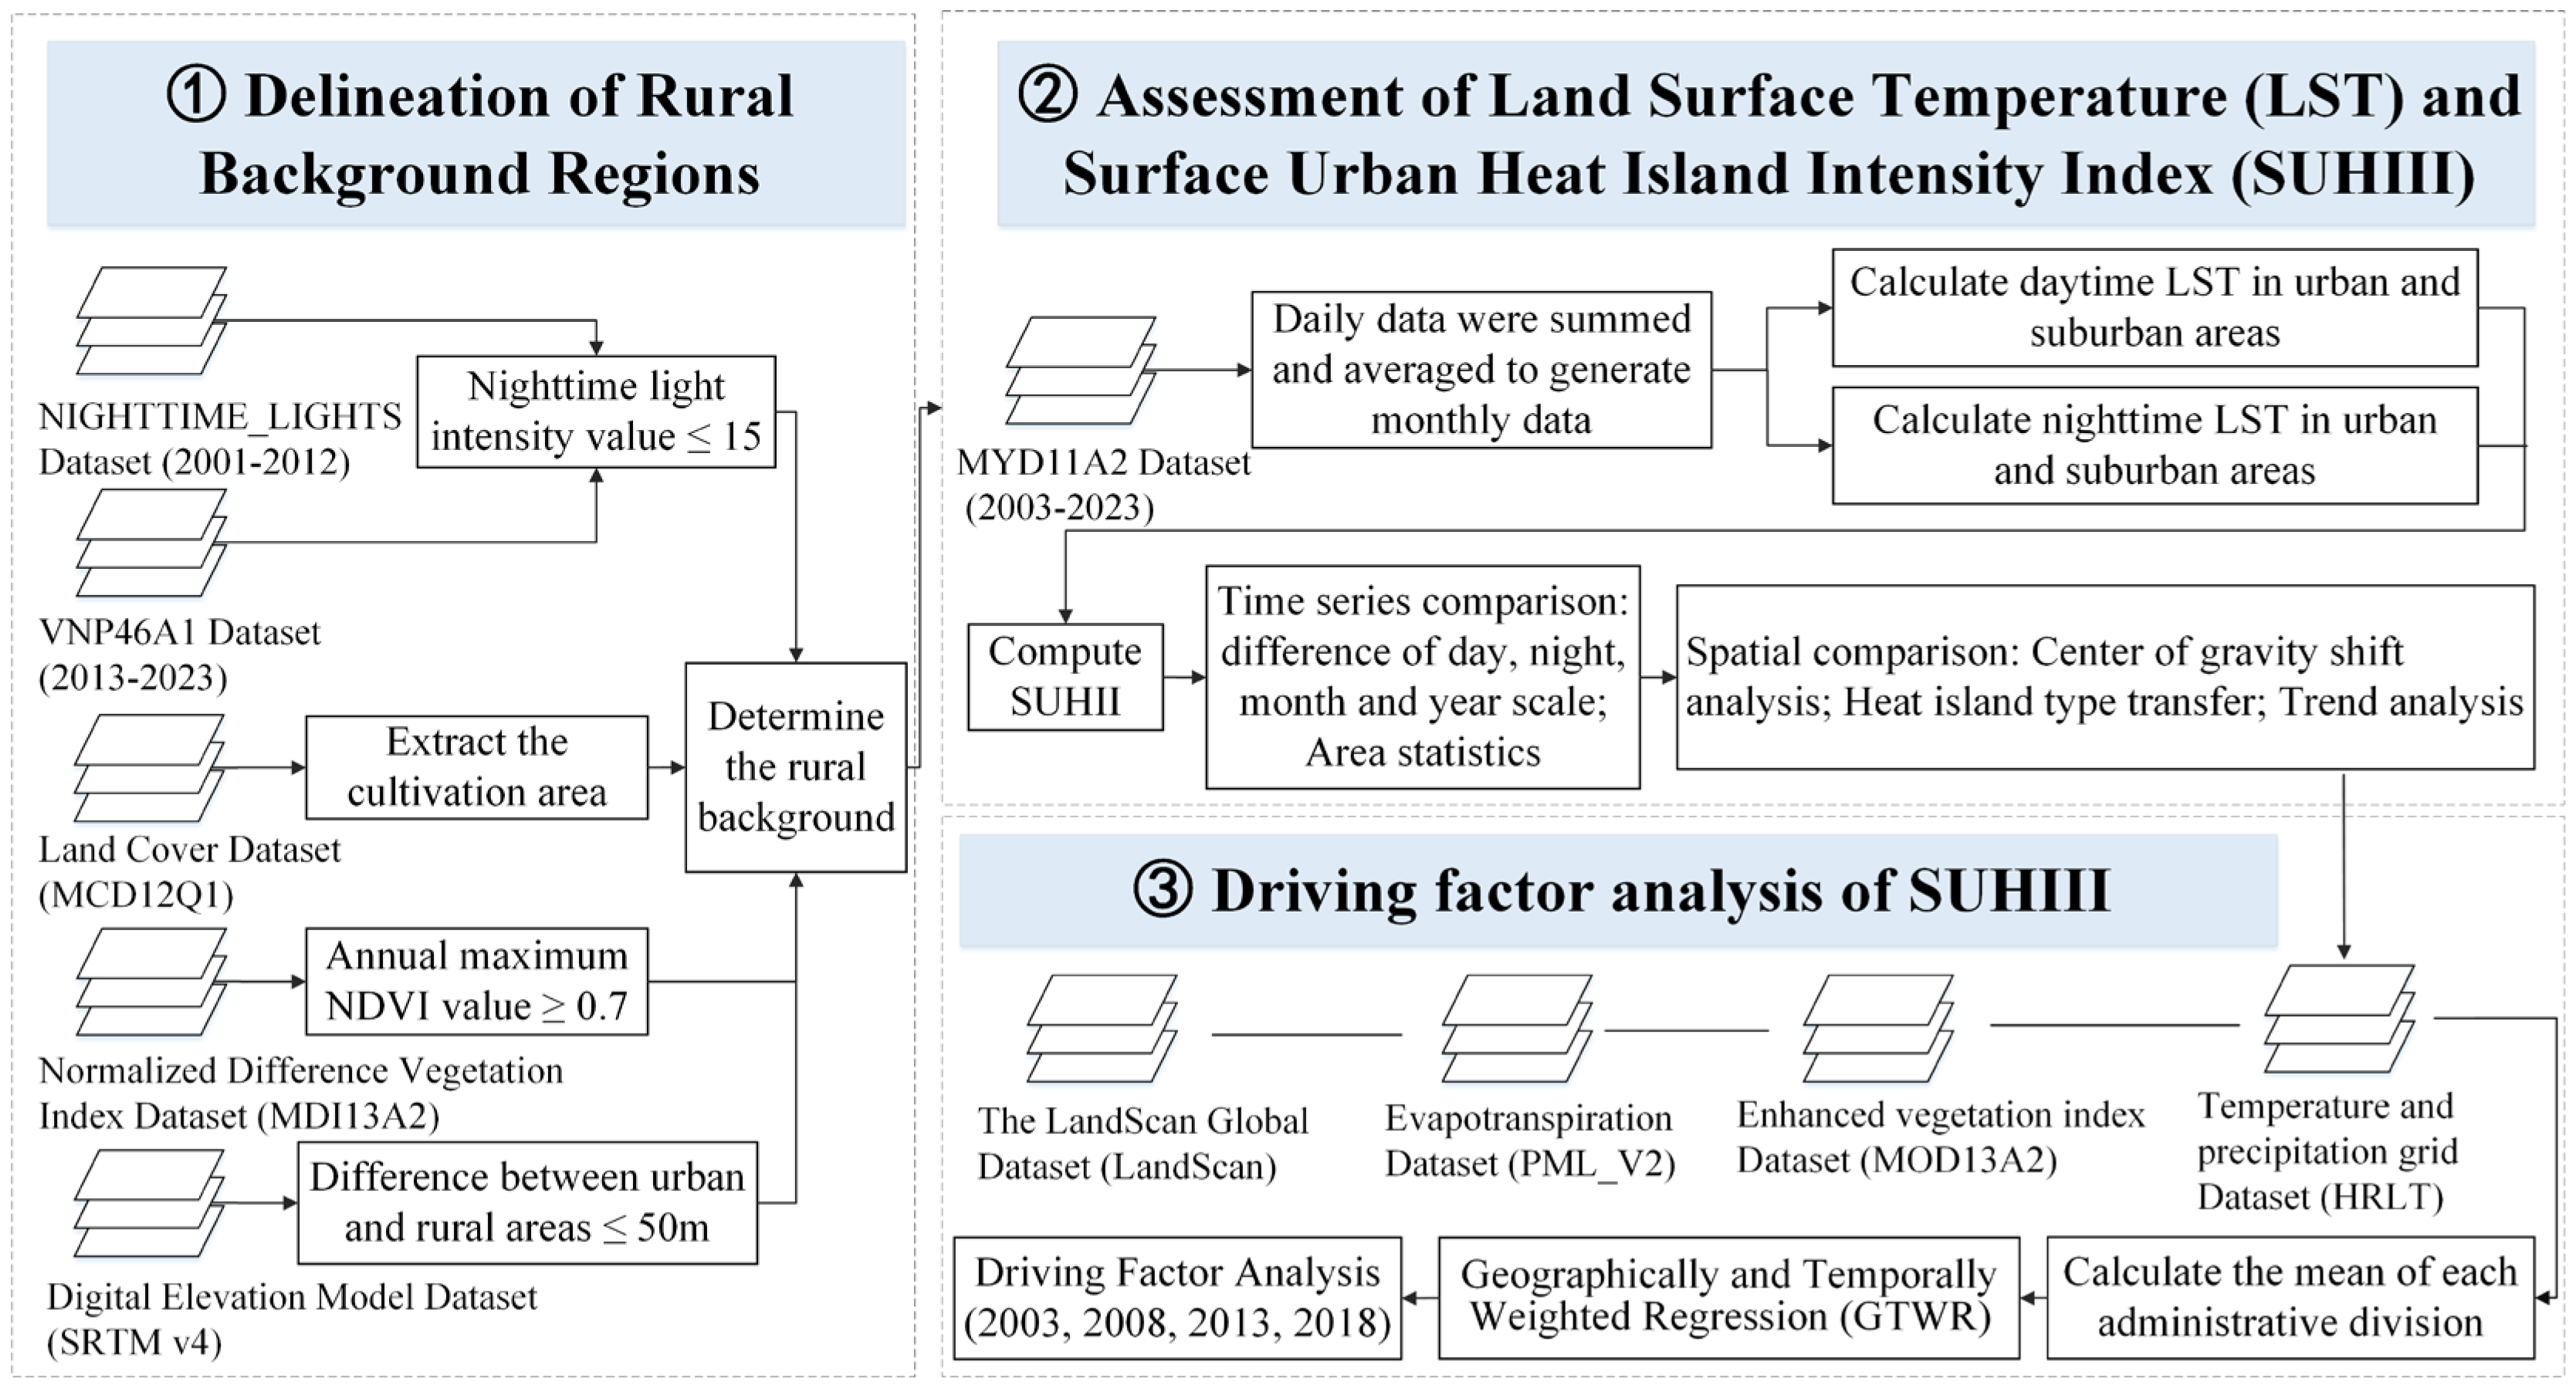
The methodology employed in this study integrates multiple datasets and analytical methods to delineate rural background regions, assess the Surface Urban Heat Island Intensity Index (SUHIII), and analyze its driving factors. The SUHIII refers to the temperature difference between urban areas and the surrounding rural or suburban regions. The flowchart in Figure 2 provides an overview of the data extraction process and analytical steps applied across the study.
The process begins with the delineation of rural background regions, where datasets such as the Nighttime Lights dataset (2001–2012) and the VNP46A1 dataset (2013–2023) are used to identify areas with minimal nighttime light intensity (≤15). Additionally, the Land Cover Dataset (MCD12Q1) and Normalized Difference Vegetation Index (NDVI ≥ 0.7) are employed to ensure that cultivated regions are excluded from the rural background, further distinguishing urban and rural areas based on a 50 m spatial threshold. The second phase focuses on the assessment of land surface temperature (LST) and the SUHIII. The MYD11A2 dataset (2003–2023) is used to calculate both daytime and nighttime LSTs in urban and suburban areas. Monthly averages of daily data are computed, and a series of time series comparisons are made across various temporal scales (day, night, month, and year) to understand the fluctuations in LSTs. Additionally, spatial comparisons are performed to examine the shift in the center of gravity of urban heat islands, the transfer of heat island types, and trends over time, which all contribute to the calculation of the SUHIII. Finally, the study proceeds with the driving factor analysis of the SUHIII. This stage uses datasets such as LandScan, PML_V2, MOD13A2, and HRLT. The driving factors are analyzed using Geographically and Temporally Weighted Regression (GTWR), which calculates the mean of each administrative division, providing insights into the local-scale variability of factors influencing the SUHIII across regions.
The following is a detailed description of the methodology employed in this study:

3.2.1. Delineation of Rural Background Regions

For delineating rural or suburban backgrounds, commonly employed methods include the buffer method, the scale method, and the urban–rural dichotomy approach [36]. Notably, Haashemi et al. [37] and Tang et al. [38] defined suburban areas as extending 1 to 50 km from urban boundaries using the buffer approach, whereas Liu et al. [39] and Meng et al. [40] applied the scale method, designating suburban backgrounds as 1.5 to 2 times the urban built-up areas. Despite the prevalence of these techniques, Li et al. [41] indicated potential inaccuracies in urban heat island intensity monitoring due to the simplistic application of fixed buffers or areas. This study, adopting the urban–rural dichotomy approach suggested by Liu et al. [42], integrates multi-source data to minimize the errors associated with fixed-area delineations, a practice widely validated in SUHI research [43,44,45]. The thresholds for delineation are shown in Figure 2, with data details in Table 1.

3.2.2. Assessment of LST and SUHIII

The MODIS MYD11A2 V6.1 product was used in this study to extract daytime and nighttime LST data from 2003 to 2023, corresponding to satellite overpasses at approximately 1:30 PM for daytime and 1:30 AM for nighttime. Only LST data with an error lower than 2K were selected to ensure high data quality. The LST data were then aggregated into annual, seasonal, and monthly averages, with seasons defined as spring (March–May), summer (June–August), autumn (September–November), and winter (December–February). To ensure consistency between Beijing and Dalian, the data were normalized using min–max normalization and classified into six temperature categories based on a mean–standard deviation method [46], allowing for detailed thermal analysis over time. To account for potential discrepancies arising from different imaging times, this normalization approach was applied to both the monthly and annual data, scaling values to a range of [−1, 1] to enhance comparability between the two cities. The normalization was computed as per Equation (1):
N i = L S T i L S T min L S T max L S T min
Equation (1) denotes N i as the normalized land surface temperature for the i-th pixel, with L S T i indicating the temperature of the i-th pixel, and L S T min and L S T max representing the respective minimum and maximum values of the L S T observed.
The SUHIII was calculated by comparing LST differences between urban and surrounding rural areas. Using the stratification method described by Ye [47], the SUHIII was categorized into seven levels, from a strong cold island (SUHIII ≤ −5) to a strong heat island (SUHIII > 5), allowing for a detailed analysis of the SUHI effect’s magnitude and spatial dynamics. The SUHIII was computed using the following equation:
S U H I I i = T i 1 N i N T r
Equation (2) explains that S U H I I i is the urban heat island intensity (°C) for the i-th pixel, T i is the LST of the i-th pixel, N denotes the total number of pixels within the rural background, and T r is the L S T observed in the rural background.
This methodology supports a detailed understanding of the spatial distribution and intensity of the SUHI effect, contributing to the study’s investigation of its environmental impact.
The dynamics of SUHI were analyzed by tracking annual centroid shifts in weak, moderate, and strong heat island zones from 2003 to 2023, revealing spatial shifts in their geographic centers. To calculate the centroid of the amalgamated heat island zones, we used Equation (3) [48]. This method allowed us to examine the evolution of the urban heat island zones over time, providing valuable insights into their shifting spatial patterns and the changing dynamics of the SUHI effect in both cities [49,50,51].
X t = i = 1 n ( C t i × X i ) i = 1 n C t i , Y t = i = 1 n ( C t i × Y i ) i = 1 n C t i
Equation (3) defines X t and Y t as the longitudinal and latitudinal coordinates, respectively, of the urban heat island distribution’s centroid for year t . C t i quantifies the area covered by the urban heat island type in the i-th segment during year t . In contrast, X i and Y i indicate the longitudinal and latitudinal coordinates of the geometric center of the i-th segment of the urban heat island area.
To capture area changes among heat island types, a transition matrix and Sankey diagram were used to depict shifts in land cover and heat island distribution, based on the method described by Mao et al. [52].

3.2.3. Driving Factor Analysis of SUHIII

This study examined natural and anthropogenic driving factors of the SUHIII using five datasets: ET, POP, EVI, TEMP, and PREP (Table 1). The GTWR model, adapted from Huang et al. [53], was applied to reveal spatial and temporal variations, showing how these factors influenced the SUHIII over time and across regions [54,55]. The GTWR model was calculated as follows (Equation (4)):
Y i = β 0 ( u i , v i , t i ) + k = 1 m X i k β k ( u i , v i , t i ) + ε i
Equation (4) specifies that ( u i , v i ) represent the longitude and latitude of the spatial unit i t h , and t i denotes the corresponding observation time. Y i refers to the SUHII value at this location; X i k refers to the k t h explanatory variable at spatial unit i t h ; ε i represents the model’s residual error; β 0 ( u i , v i , t i ) is the baseline regression constant; and β k ( u i , v i , t i ) corresponds to the regression coefficients for each explanatory variable.

4. Results

In this section, the results of the analysis are presented, organized into three main parts. Section 4.1 examines the spatial and temporal distribution of LSTs, with separate analyses at the monthly, seasonal, and annual scales. Section 4.2 explores the spatial and temporal distribution of SUHIII, including both monthly and annual analyses, as well as the shifts and transfers of centroids. Section 4.3 addresses the driving factors influencing SUHIII, with a detailed examination of TEMP, PREP, POP, EVI, and ET.

4.1. Analysis of the Spatial and Temporal Distribution of LSTs

4.1.1. Analysis of LSTs at the Monthly Scale

A comprehensive analysis of the monthly spatiotemporal distribution of LSTs from 2003 to 2023 reveals that Beijing and Dalian exhibit similar trends in LST variations. Both cities experience a rise in LSTs from January to July, followed by a decline from July to December (Figure 3). Beijing generally shows higher LSTs than Dalian, except in September, when the reverse occurs. The temperature difference between the two cities is most pronounced from January to July, with an average gap of 1.86 °C, but narrows to 0.26 °C from August to December. Overall, the monthly LST averages are 12.44 °C for Beijing and 11.25 °C for Dalian. Both cities reach their peak LST in July (26.18 °C for Beijing and 24.74 °C for Dalian) and their lowest in January (−4.18 °C for Beijing and −5.55 °C for Dalian). The spatial distribution, shown in Figure 4, highlights that April, May, and September in both cities exhibit widespread high-temperature zones, with temperatures generally lower than the peak summer levels of July and August.

4.1.2. Analysis of LSTs at the Seasonal Scale

From a seasonal variation perspective, Beijing exhibits a higher standard deviation, indicating greater seasonal temperature fluctuations. This could be attributed to its inland location and exposure to more extreme weather patterns, while Dalian, influenced by its coastal environment, tends to have milder seasonal variations (Table 2). In summer, Beijing’s LST (25.12 °C) is higher than Dalian’s (23.90 °C), suggesting that Beijing experiences more intense heat during the warmer months. In winter, the two cities show only a slight difference, with Beijing’s LST at 0.54 °C, slightly lower than Dalian’s 0.77 °C. This may be due to the moderating effect of Dalian’s coastal influence, which helps alleviate cold temperatures during winter.
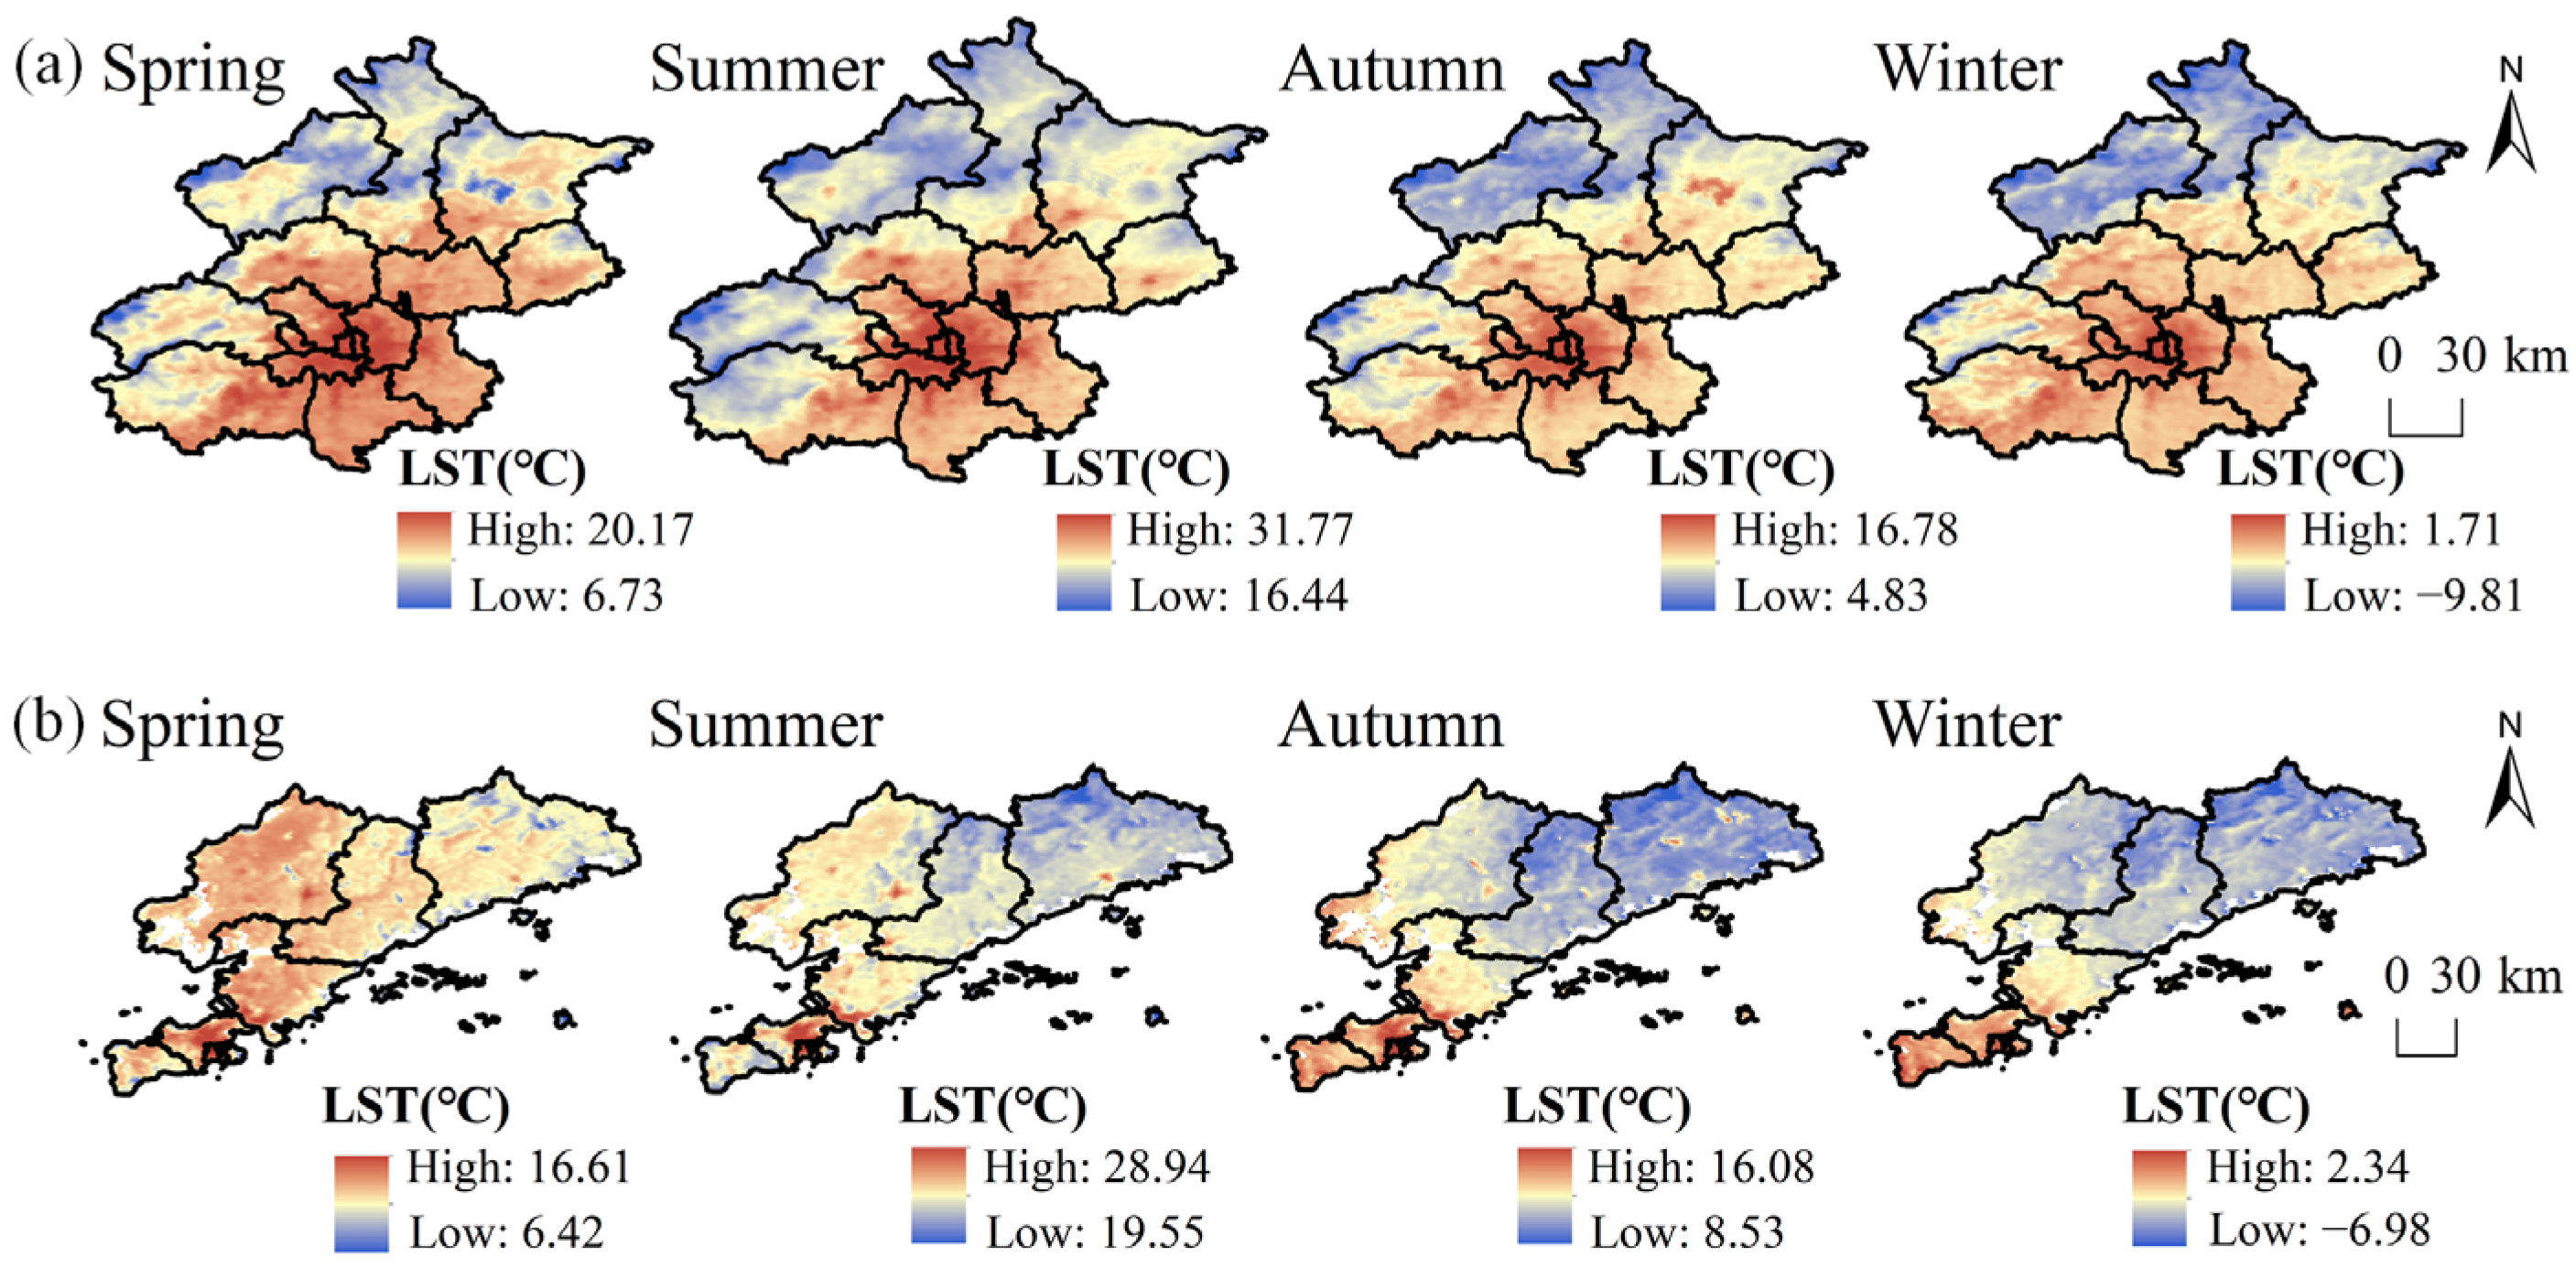
In both cities, the LSTs in the central urban areas are generally higher, while the LSTs in the peripheral regions are lower (Figure 5). Additionally, Beijing experiences greater seasonal temperature fluctuations. Particularly in the summer, the central area of Beijing shows a significantly higher LST of 31.77 °C, indicating that the urban heat island effect likely contributes to stronger heat accumulation in the city center, while the surrounding areas remain noticeably cooler. In winter, the lowest LST in the peripheral areas of Beijing drops to −9.81 °C, while the city center remains relatively warmer with a highest LST of 1.71 °C, highlighting the temperature difference between the inland areas and the urban center. In contrast, Dalian’s LSTs are generally lower than Beijing’s, but there is still a temperature difference between the central and peripheral areas, with the seasonal variation being smaller. Dalian experiences milder winter temperatures, with the lowest LST in the peripheral areas at −6.98 °C, which suggests that the city’s coastal climate helps moderate the cold winter temperatures. Overall, Beijing exhibits more pronounced seasonal temperature fluctuations, especially in summer and winter, while Dalian’s coastal influence results in more moderate temperature differences, with warmer winters and cooler summers balancing out the seasonal variation.

4.1.3. Analysis of LSTs at the Annual Scale

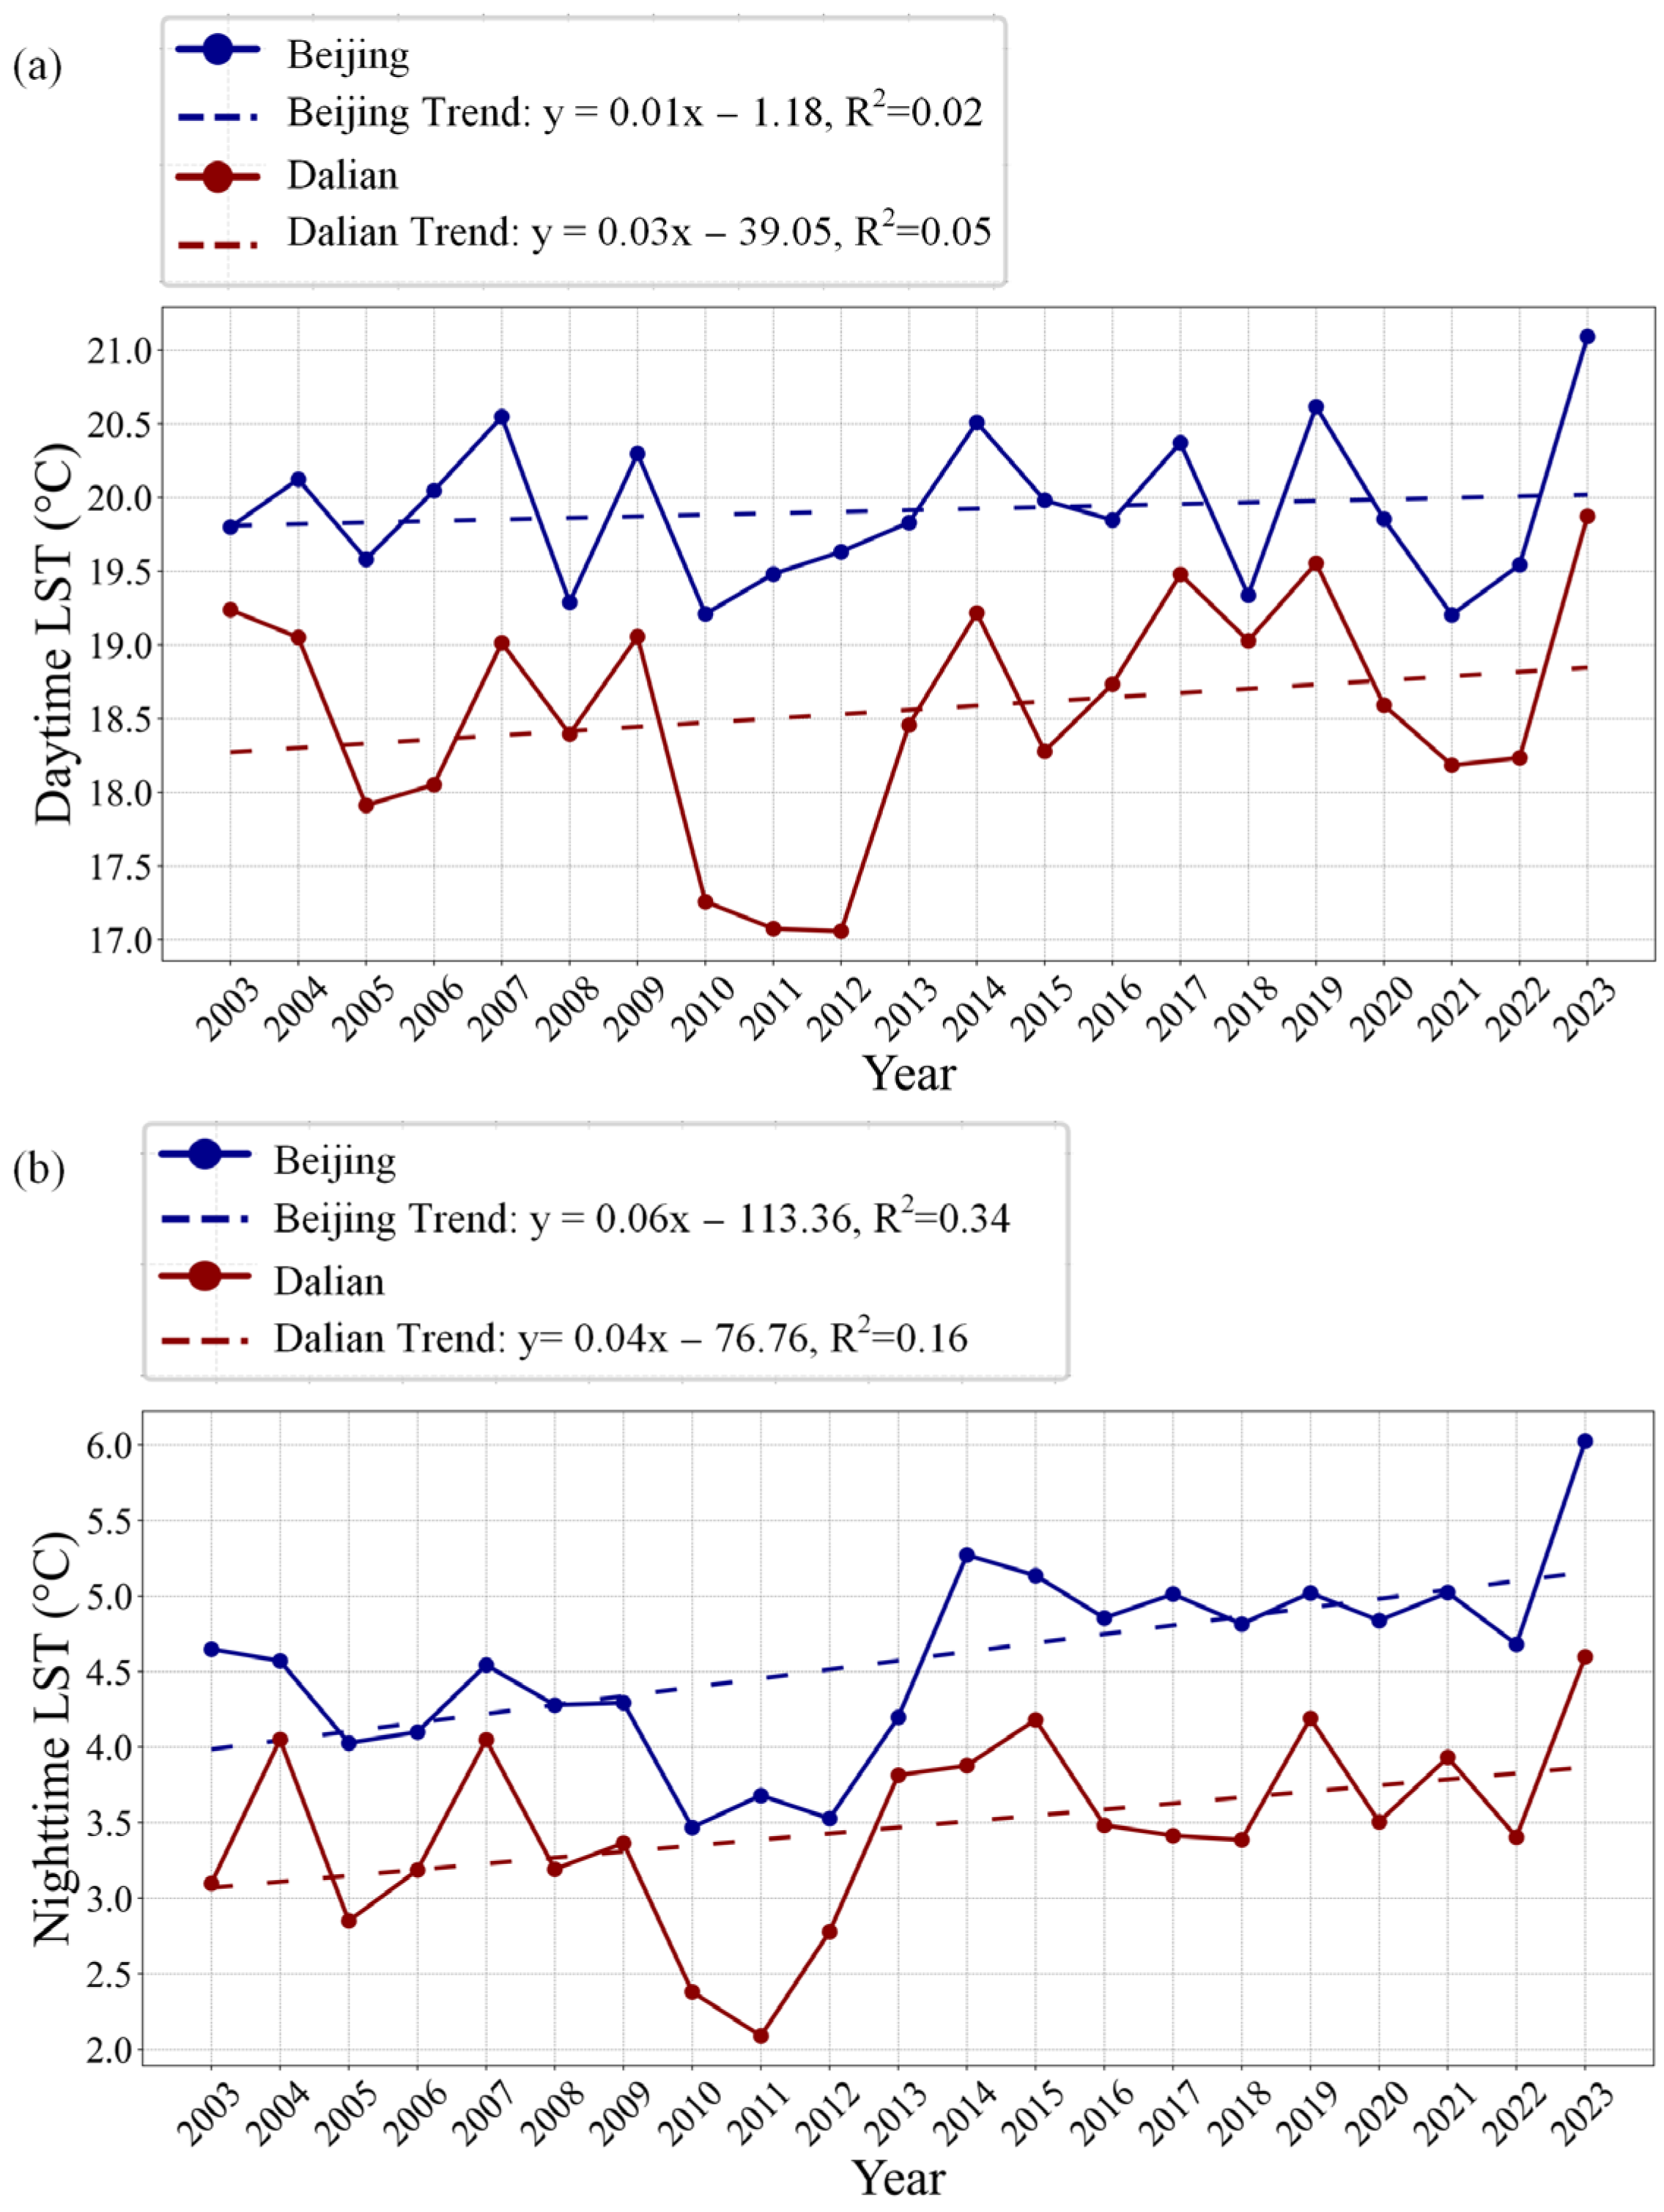
The annual LST time series for Beijing and Dalian from 2003 to 2023 were analyzed by plotting the annual average LST statistics for daytime, nighttime, and diurnal average LSTs (Figure 6a–c). Both cities show similar trends in LSTs, with fluctuations until 2010, an increase after 2011, and a peak in 2023. Both cities exhibit increasing trends in daytime, nighttime, and annual LSTs. Dalian shows a stronger upward trend in daytime LSTs compared to Beijing, with a regression coefficient of 0.03 for Dalian and 0.01 for Beijing, respectively. Conversely, Beijing experiences a greater increase in nighttime LSTs than Dalian, with regression coefficients of 0.06 and 0.04, respectively. The annual LST trends for both cities are generally consistent, each with a regression coefficient of 0.04. During the period from 2003 to 2009, fluctuations are observed, but overall temperatures increase. A notable decrease occurs from 2009 to 2011, consistent with the observation made by Si [56], who suggested it may be related to the El Niño phenomenon, followed by an upward trend from 2011 to 2023. In Beijing, the average daytime, nighttime, and annual LSTs are 19.91 °C, 4.57 °C, and 12.19 °C, respectively, while in Dalian, these temperatures are 18.56 °C, 3.47 °C, and 10.98 °C. Generally, Beijing records higher average temperatures than Dalian in the daytime and nighttime and annually.
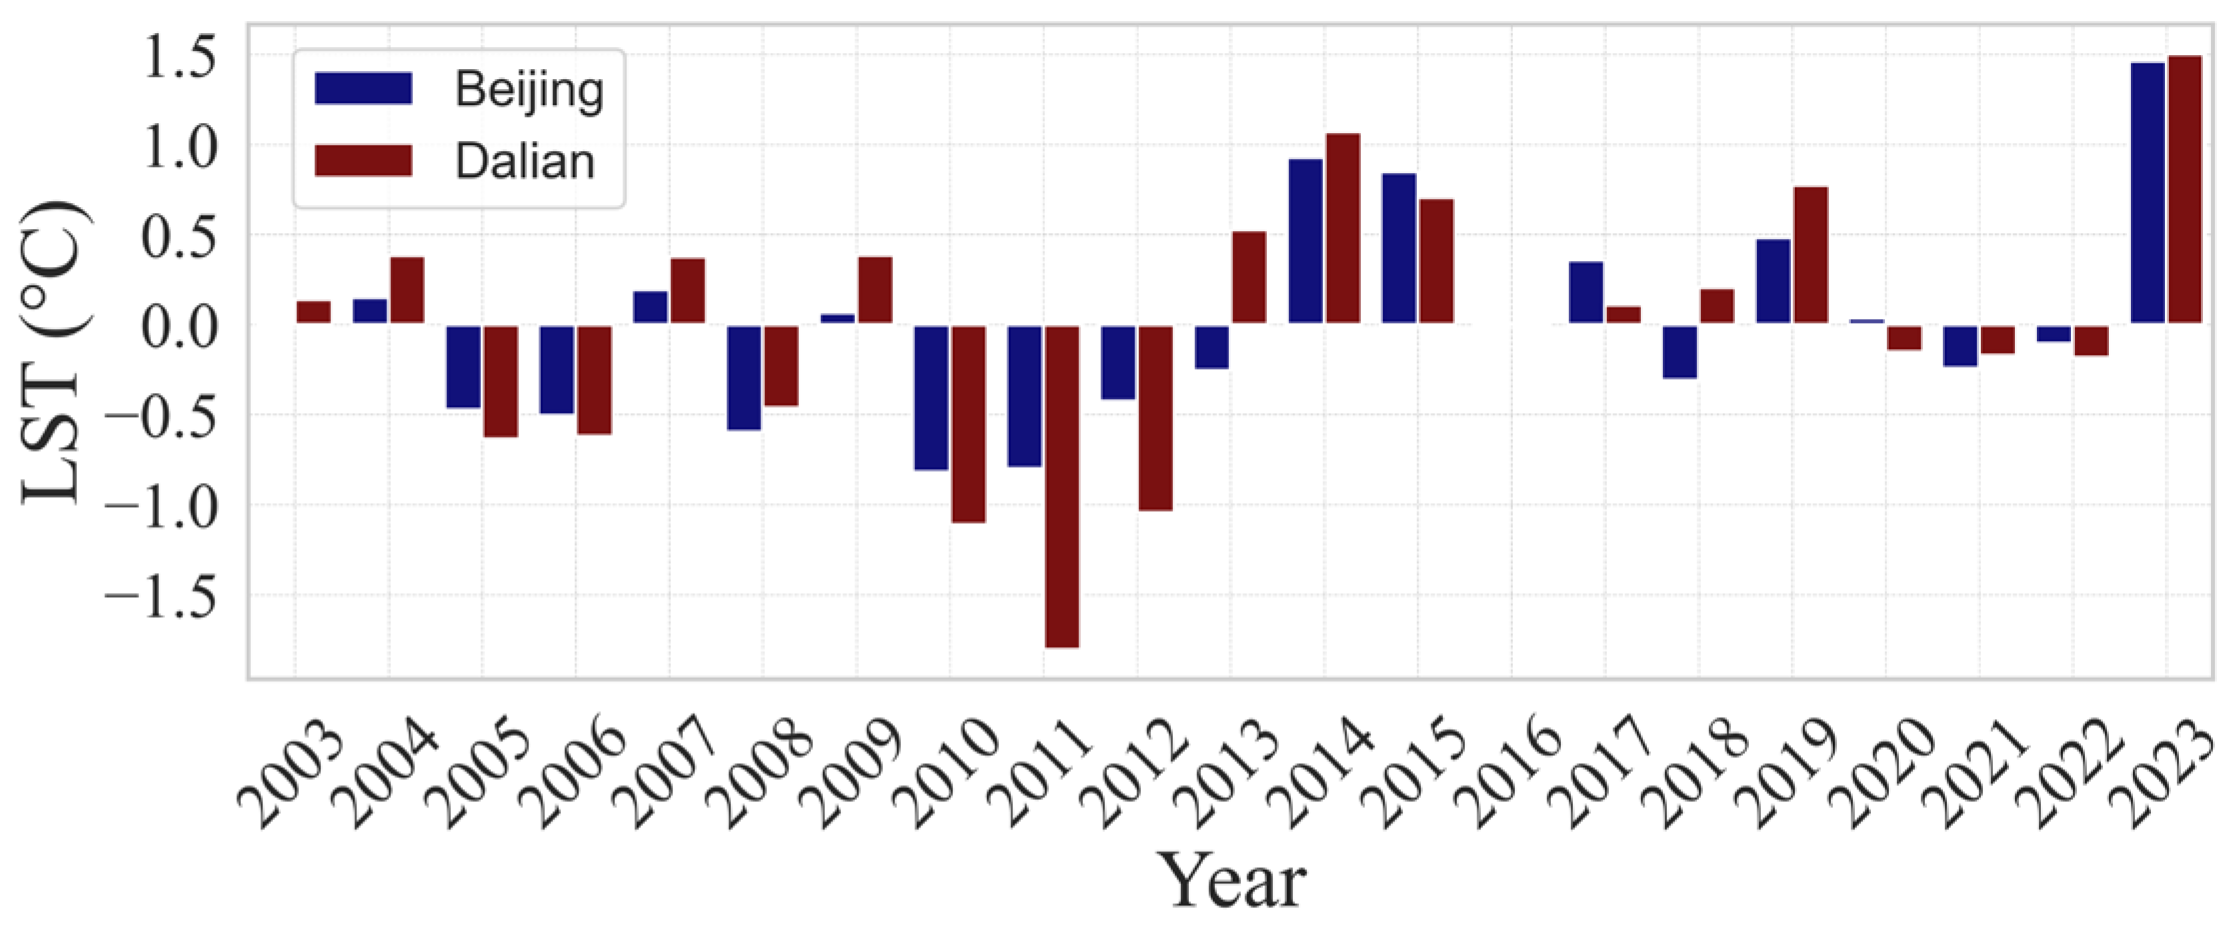
The annual LST anomalies for Beijing and Dalian are plotted in this study and are presented in Figure 7. The anomalies represent the difference between the average LST of a specific year and the overall average LST from 2003 to 2023; positive anomalies indicate that the LST for a given year is higher than the long-term average, while negative anomalies suggest that the LST is lower than the average. The magnitude of these anomalies provides insight into the degree of variation or deviation from the baseline LST over the years. The values predominantly range between −2 °C and −1.5 °C, with the lowest value observed in 2011 and the highest in 2023. Generally, both Beijing and Dalian exhibit consistent trends in temperature anomalies. Before 2013, most years record negative anomalies with frequent fluctuations, indicating that the LST is generally lower than the 2003–2023 average. After 2013, most years show positive anomalies, with values exceeding −0.5 °C, suggesting an overall increase in temperature anomalies compared to the 2003–2023 average. Notably, in 2013 and 2018, Beijing records negative anomalies, while Dalian records positive ones. In 2023, both cities experience significant increases in LSTs, with Beijing rising from −0.10 °C in 2022 to 1.46 °C, and Dalian from −0.18 °C in 2022 to 1.50 °C.
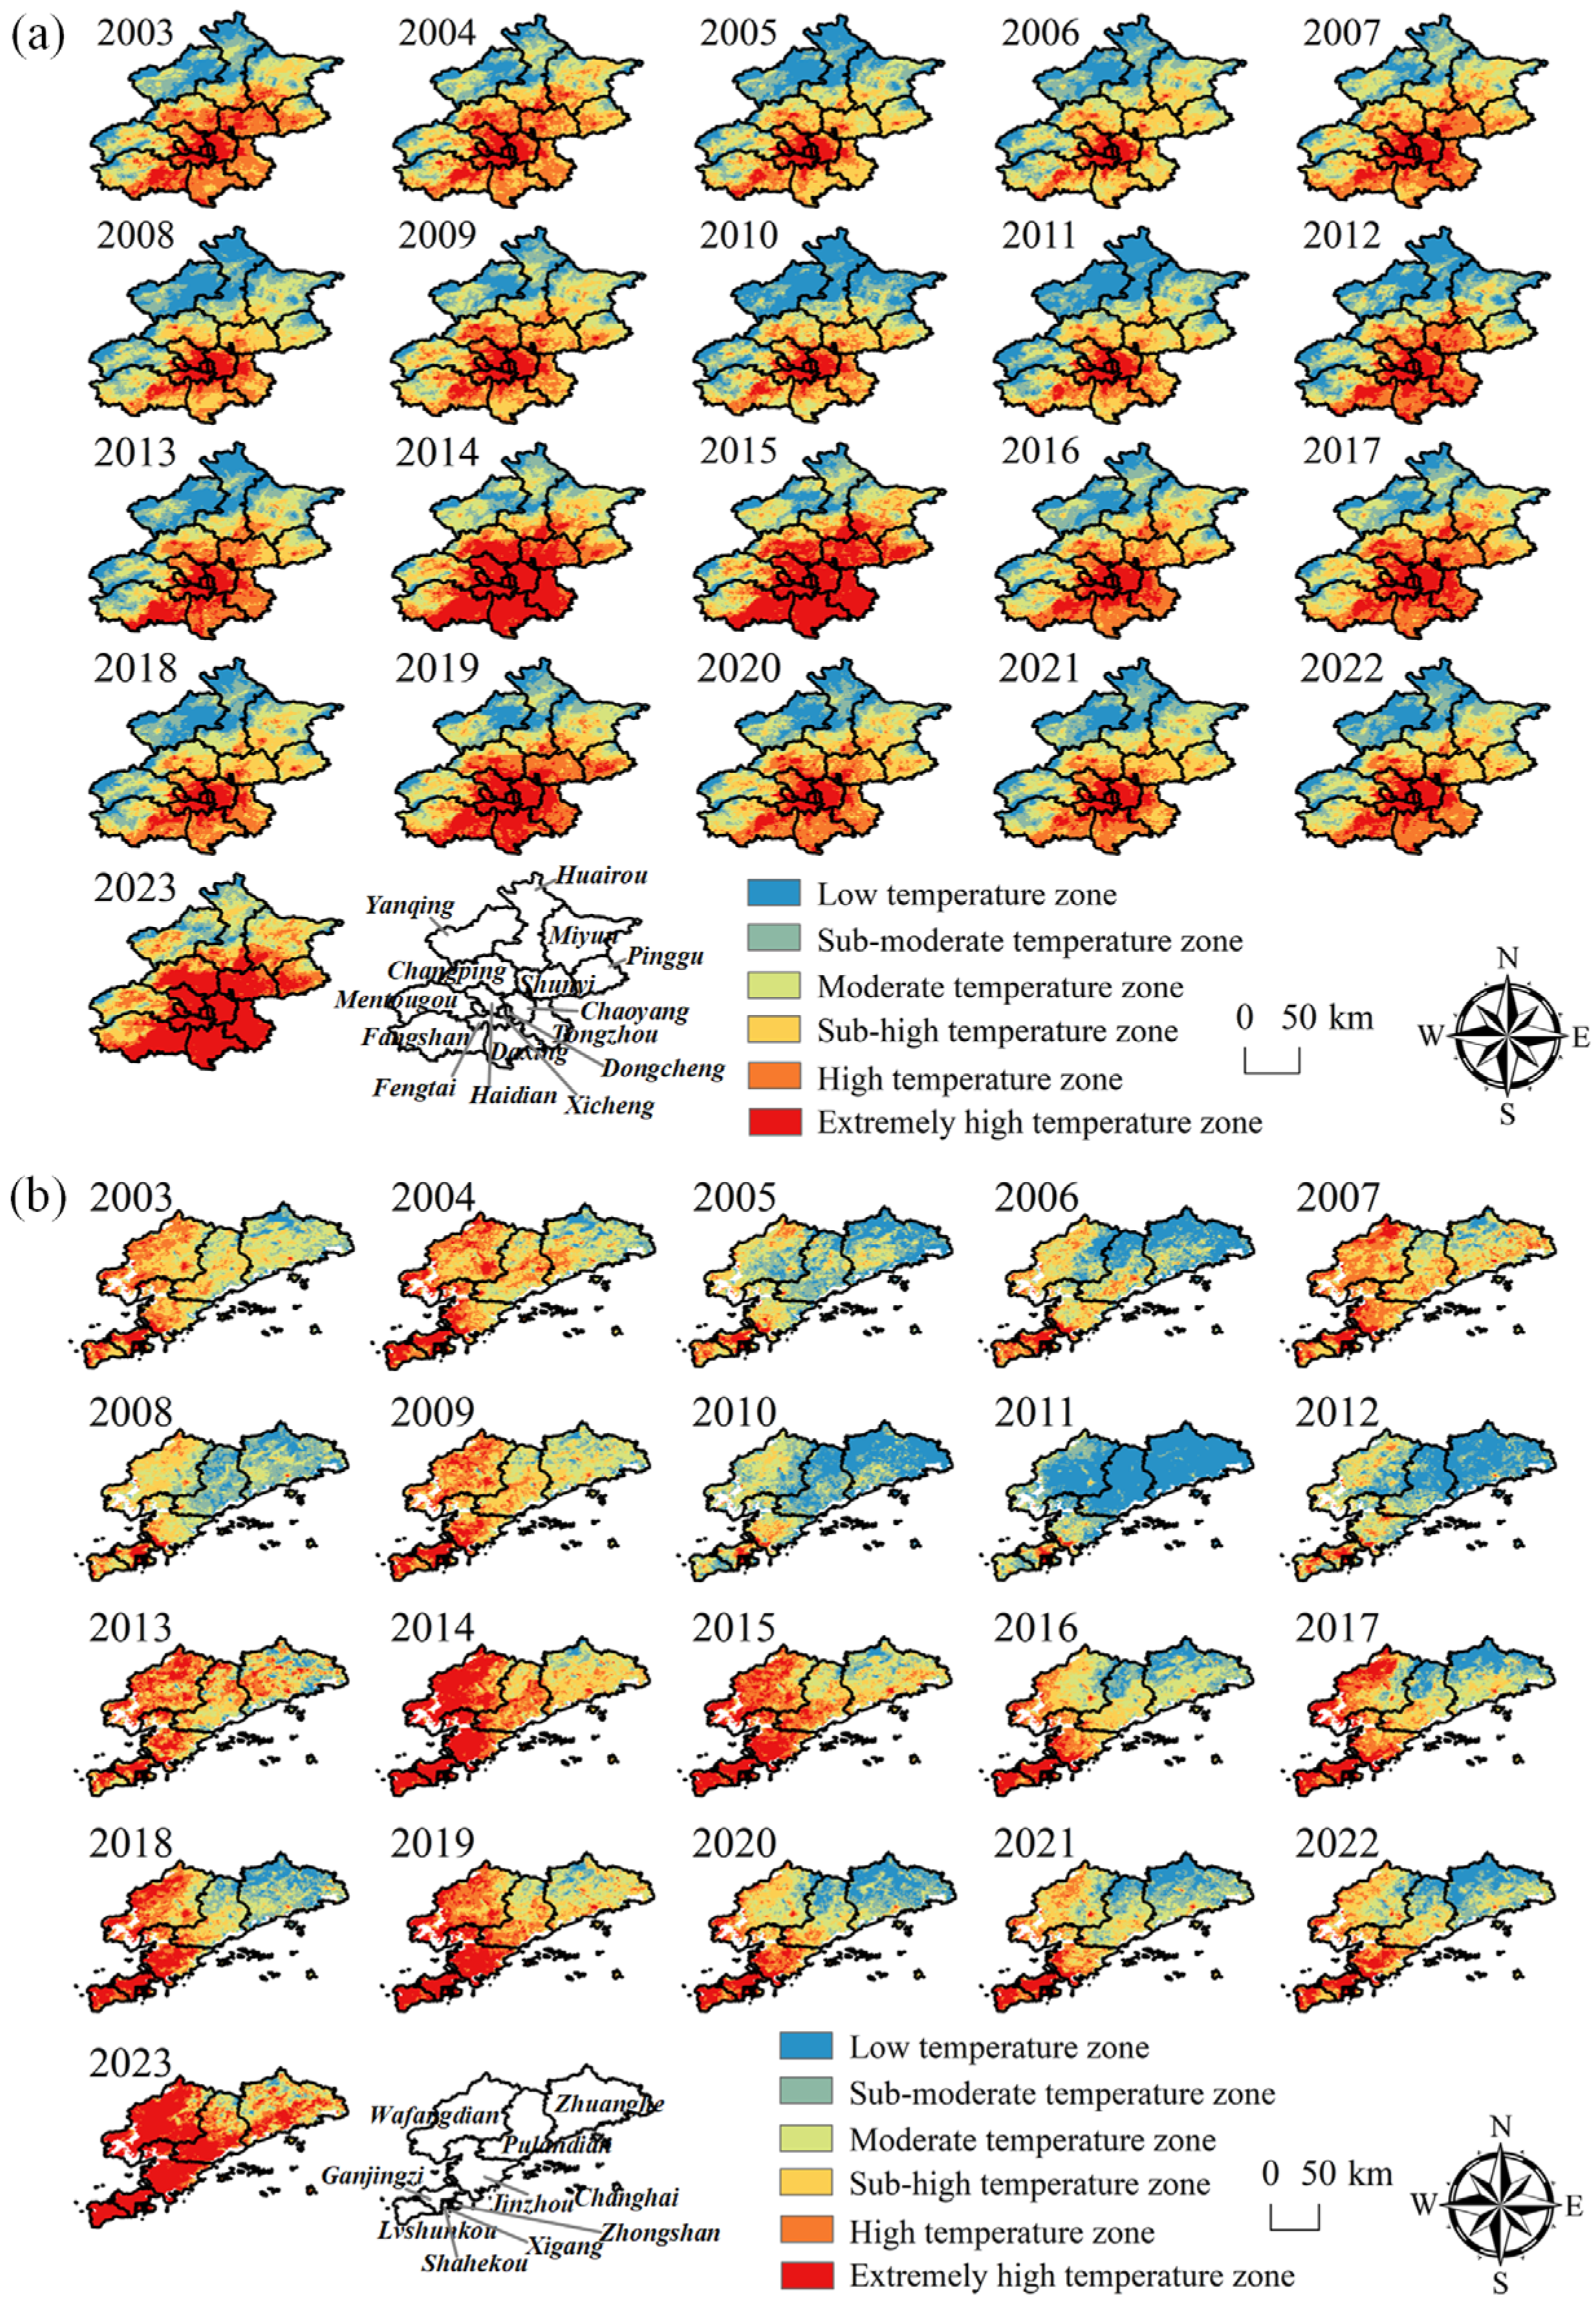
Spatially, as shown in Figure 8a, over the years in Beijing, the high-temperature zones (orange and red areas) have expanded, particularly in the southern and central parts of the city, such as Xicheng, Dongcheng, and Haidian. Meanwhile, the low-temperature zones (green and blue areas) have diminished. By 2023, a substantial portion of Beijing has entered high- and extremely high-temperature zones, reflecting a noticeable increase in temperature. Similarly, as depicted in Figure 8b, the temperature zones have shifted in Dalian, with the high- and extremely high-temperature zones growing over time. The low-temperature zones in the northern and coastal areas, such as Pulandian and Zhuanghe, have gradually reduced, and warmer zones have spread, particularly in the southern part of the city, which consists of flatter terrain. By 2023, a clear transition to higher temperature zones is evident in Dalian, mirroring the trend seen in Beijing. Overall, both cities show an upward trend in temperature, with an expansion of higher temperature zones.

4.2. Analysis of the Spatial and Temporal Distribution of SUHIII

4.2.1. Analysis of SUHIII at the Monthly Scale

To investigate the SUHIII, the monthly mean SUHIII values for daytime, nighttime, and diurnal averages across all months from 2003 to 2023 are plotted, as shown in Figure 9. Overall, Beijing and Dalian exhibit distinct seasonal variations in SUHIII, with higher values in summer and lower values in winter. Specifically, Beijing shows significantly higher SUHIII values in summer and lower values in winter compared to Dalian. This difference is likely due to Dalian’s coastal climate and urban layout, which differ from Beijing’s inland conditions, influencing their respective SUHI effects (Figure 9c). As depicted in Figure 9a,b, the daytime SUHIII in Beijing ranges from −0.2 °C to 1.2 °C, while in Dalian, it ranges from −0.2 °C to 0.6 °C. Overall, Beijing exhibits larger monthly variations in SUHIII compared to Dalian. The nighttime SUHIII in Beijing ranges from −0.4 °C to 0.7 °C, whereas in Dalian, it ranges from −0.3 °C to 0.3 °C. Notably, nighttime SUHIII values in January, November, and December are markedly lower in Beijing than in Dalian.

4.2.2. Analysis of SUHIII at the Annual Scale

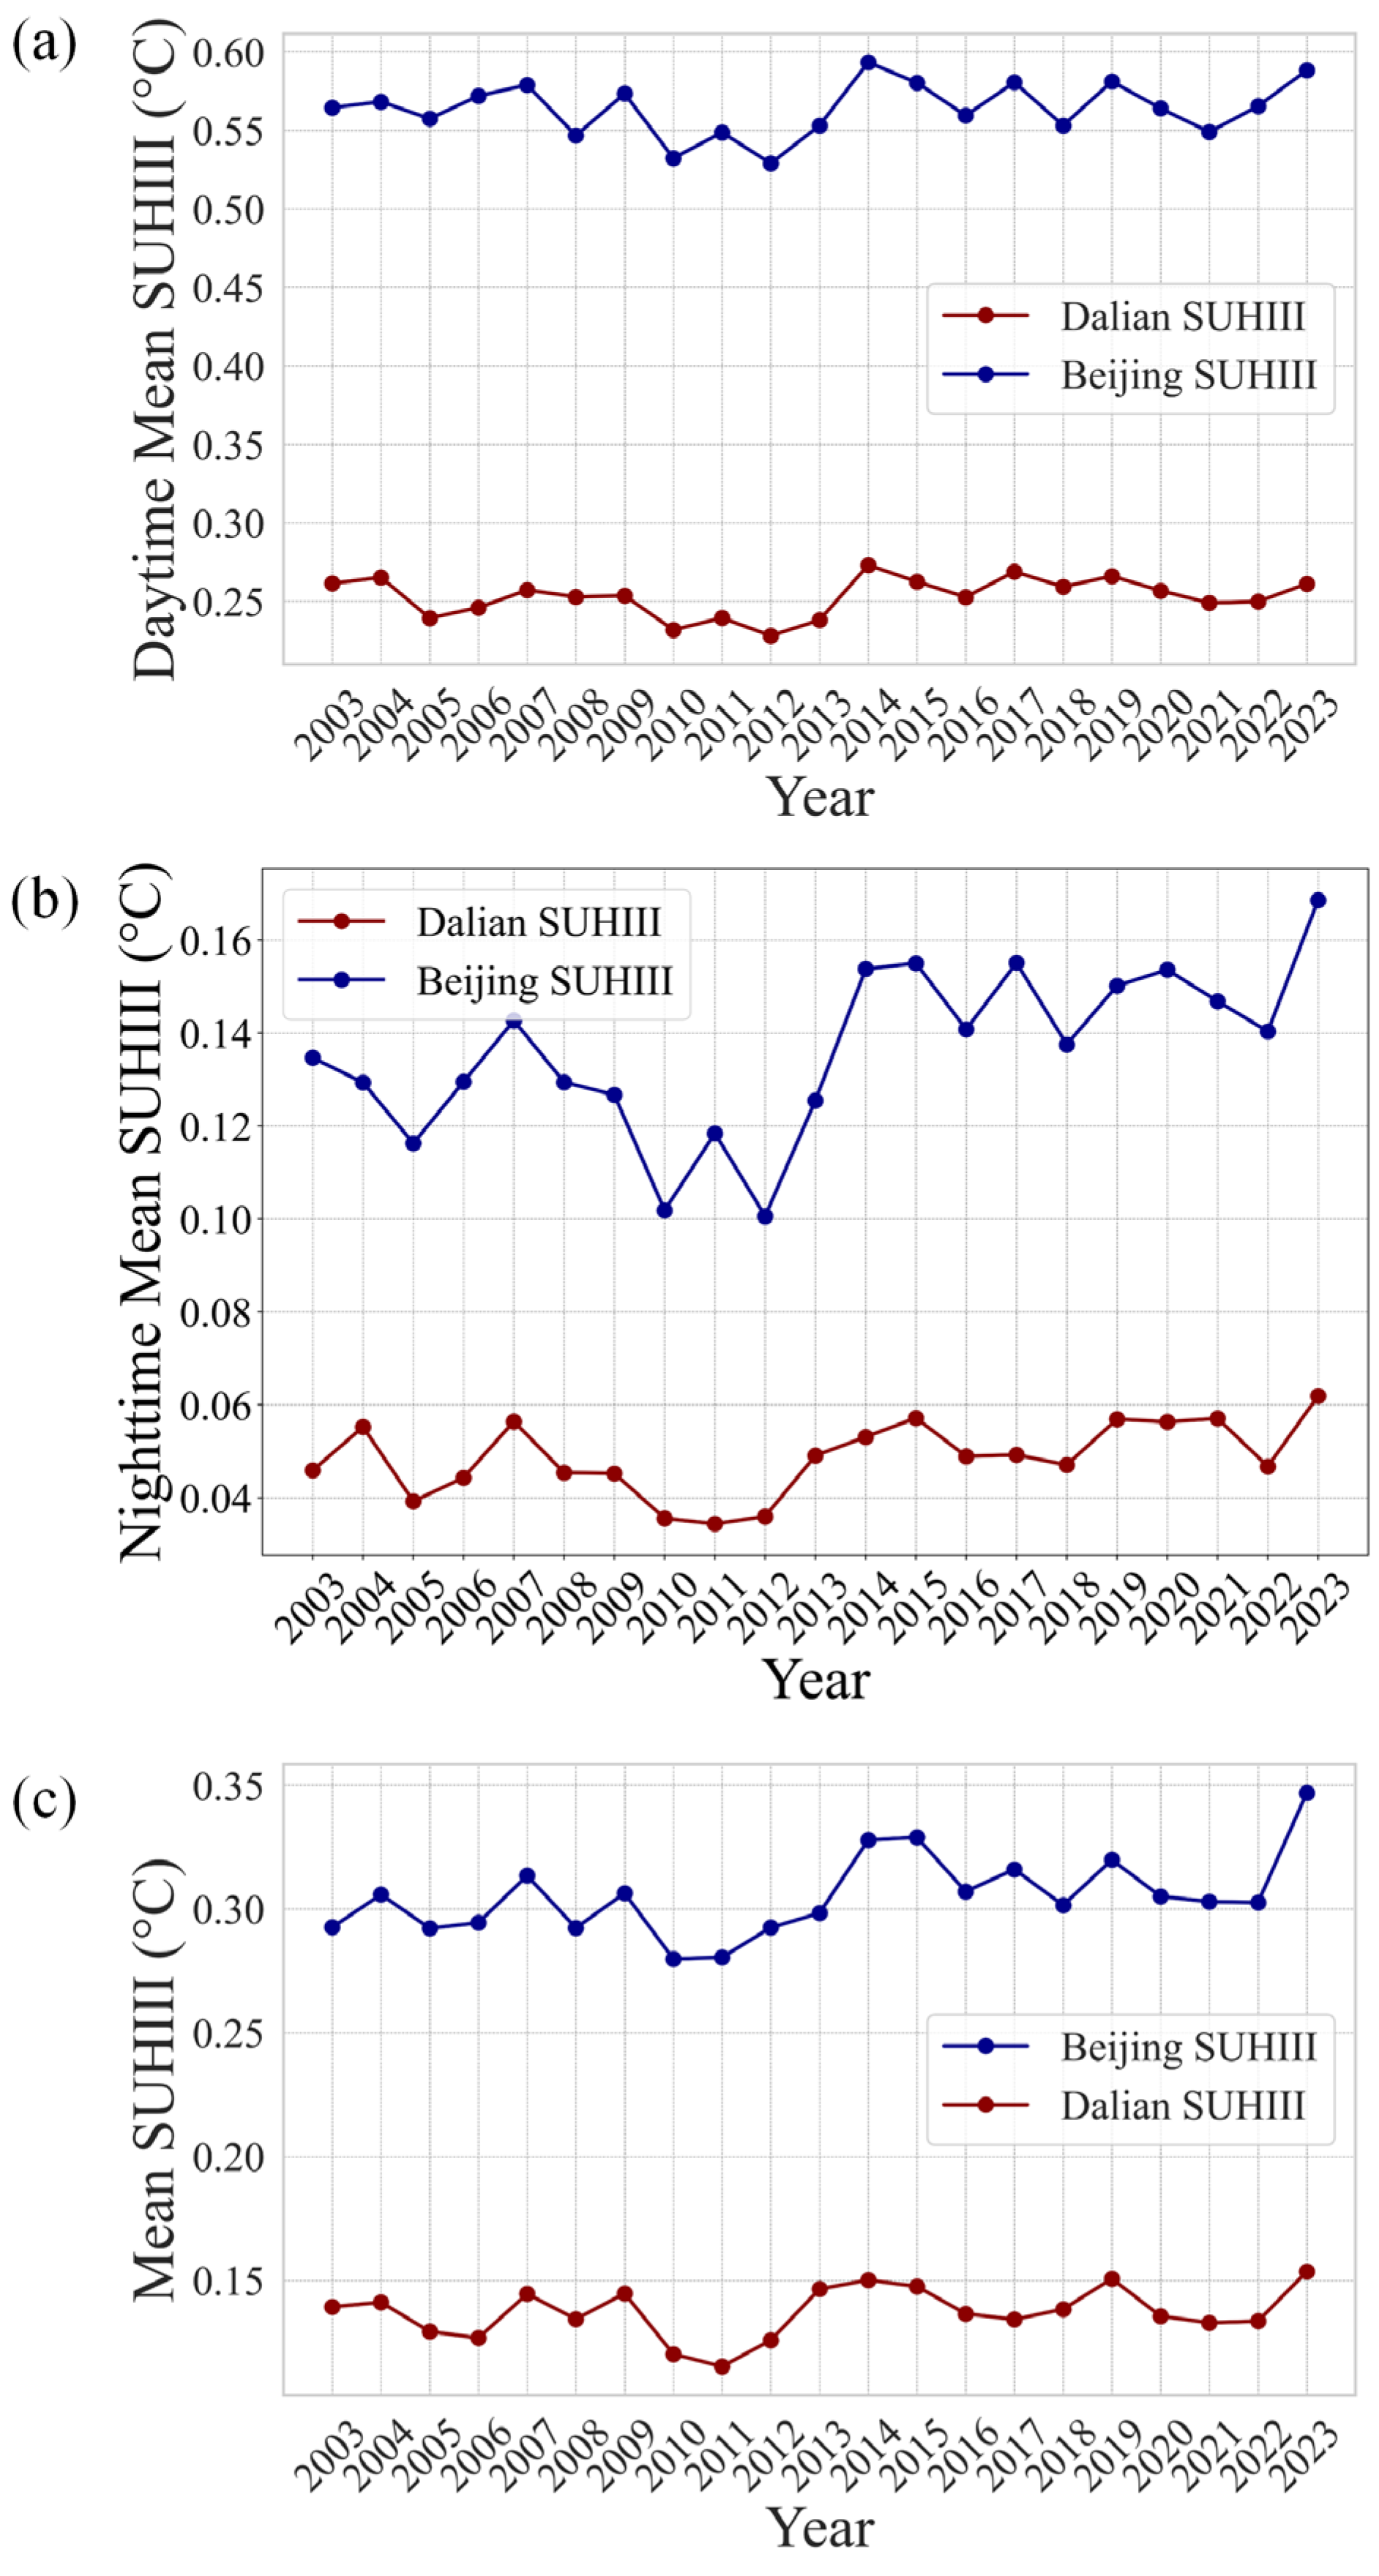
To understand the interannual variations in the SUHIII, the annual mean SUHIII values for daytime, nighttime, and diurnal averages are statistically analyzed, as depicted in Figure 9. Both cities show similar trends in SUHIII, with fluctuations until 2010, an increase after 2011, and a peak in 2023. The peak reached in 2023 is consistent with observations by Min [57], and is likely linked to the strengthening of El Niño, the eruption of the Hunga Tonga volcano, and the increase in atmospheric greenhouse gas concentrations [58]. The SUHIII values are higher in Beijing than in Dalian, with average values of 0.31 °C and 0.14 °C, respectively. The maximum SUHIII values for both cities occur in 2023 at 0.35 °C and 0.15 °C, while the minimum values are observed in 2010 at 0.28 °C for Beijing and in 2011 at 0.12 °C for Dalian (Figure 10c).
The average daytime SUHIII values in Beijing and Dalian are 0.56 °C and 0.25 °C, respectively, with peak values in 2014 at 0.59 °C and 0.27 °C, and minimum values in 2012 at 0.53 °C and 0.23 °C (Figure 10a). For the nighttime SUHIII, the average values for Beijing and Dalian are 0.14 °C and 0.05 °C, respectively, reaching maximum values in 2023 at 0.17 °C and 0.06 °C. The lowest nighttime SUHIII values are recorded in 2012 at 0.10 °C for Beijing and in 2011 at 0.03 °C for Dalian (Figure 10b).
From 2003 to 2023, the heat island areas in Beijing, including weak, moderate, and strong heat islands, are predominantly located in the southeast. Conversely, cold island areas (weak, moderate, and strong) are distributed in the northwest, northern parts of the northeast, and western parts of the southwest, with no heat islands situated between the cold and heat island regions. During 2010–2013, no heat island areas in Beijing significantly decrease compared to 2003–2009, while cold island and heat island areas both increase. Notably, weak heat islands expand in the Pinggu, Tongzhou, Daxing, and Shunyi districts, aligning with Beijing’s rising average LST trends. From 2013 to 2023, heat island areas steadily increase, while cold island areas, especially in the Huairou and Yanqing districts, decrease. In 2022–2023, strong heat islands notably increase, concentrated in Daxing, Tongzhou, and Fangshan (Figure 11a). From 2003 to 2023, the heat island area in Beijing exhibits an initial decline, followed by an increase and then another decline, decreasing from 7011.16 km2 to 6728.97 km2. The proportion of total area covered by heat islands decreases from 41.49% to 39.82%, with the lowest area recorded in 2006 at 6341.89 km2 and the highest in 2015 at 7503.89 km2. Over the same period, the cold island area in Beijing initially increases, decreases, and then increases again, growing from 4129.43 km2 to 5026.97 km2, covering 24.44% to 29.75% of the total area. The lowest cold island area occurs in 2007 at 3955.83 km2, and the highest in 2012 at 5173.24 km2. Additionally, the area with no heat islands in Beijing shows an initial increase followed by a decrease, falling from 5756.82 km2 to 5141.47 km2, with the proportion dropping from 34.07% to 30.42%. The lowest area with no heat islands is in 2015 at 4503.22 km2, and the highest in 2006 at 6560.55 km2.
Compared to Beijing, as shown in Figure 11b, Dalian from 2003 to 2023 has fewer areas characterized by strong cold and strong heat islands, with a greater prevalence of weak heat islands, no heat islands, and weak cold islands. The primary areas of heat island area expansion in both cities are concentrated in the suburban regions near the cities. The heat island areas in Dalian are primarily located in the southwest, while the cold island areas are concentrated in the northeast, especially in the mountainous regions of Zhuanghe and Pulandian districts. During 2010–2013, no heat island areas in Dalian significantly decrease compared to 2003–2009, while cold and heat island areas increase, notably with an expansion of weak heat islands in Wafangdian and Jinzhou districts. From 2013 to 2023, the heat island areas in Dalian show a generally stable increase, while cold island areas, especially in Zhuanghe City, decrease. In 2022–2023, weak heat island areas notably increase, concentrated in the districts of Wafangdian and Jinzhou. From 2003 to 2023, the heat island area in Dalian initially increases, decreases, and then increases again, expanding from 1904.50 km2 to 3447.61 km2, representing 15.25% to 27.61% of the total area. The smallest heat island area is recorded in 2007 at 1560.65 km2, while the largest is in 2018 at 3554.98 km2. Similarly, the cold island area in Dalian follows a similar trend, increasing from 1058.21 km2 to 2625.18 km2, accounting for 8.48% to 21.02% of the total area, with the smallest area in 2008 at 876.26 km2 and the largest in 2018 at 2688.34 km2. The area with no heat island in Dalian shows a declining trend from 2003 to 2023, decreasing from 9523.21 km2 to 6413.84 km2, comprising 76.27% to 51.37% of the total area. The smallest area with no heat island is recorded in 2018 at 6241.92 km2, while the largest is in 2008 at 9735.84 km2.

4.2.3. Analysis of SUHIII Centroid Shifts and Transfers

To analyze and predict the centroid shifts in heat island areas, Figure 12 is plotted. From 2003 to 2023, the centroids of both Beijing and Dalian have shifted southeastward. However, the extent and pattern of this shift vary across different stages. As shown in Figure 12a, from 2003 to 2008, Beijing’s urban development centroid shifts significantly southeast by approximately 16.00°. Subsequently, from 2008 to 2013, the centroid continues moving southward with an increased angle of 65.83°, reflecting dynamic changes in urban development. From 2013 to 2018, the centroid direction adjusts northeastward at an angle of 55.63°. Finally, from 2018 to 2023, the centroid shifts southwest with an angle of 38.03°.
As shown in Figure 12b, Dalian’s centroid of heat island areas shifts southwest at an angle of 30.20° from 2003 to 2008. Over the next five years (2008 to 2013), the centroid moves southeast, increasing the angle to 54.61°. From 2013 to 2018, it shifts again towards the southwest at 40.37°. In the most recent period, from 2018 to 2023, the centroid shifts southeast at an angle of 41.30°.
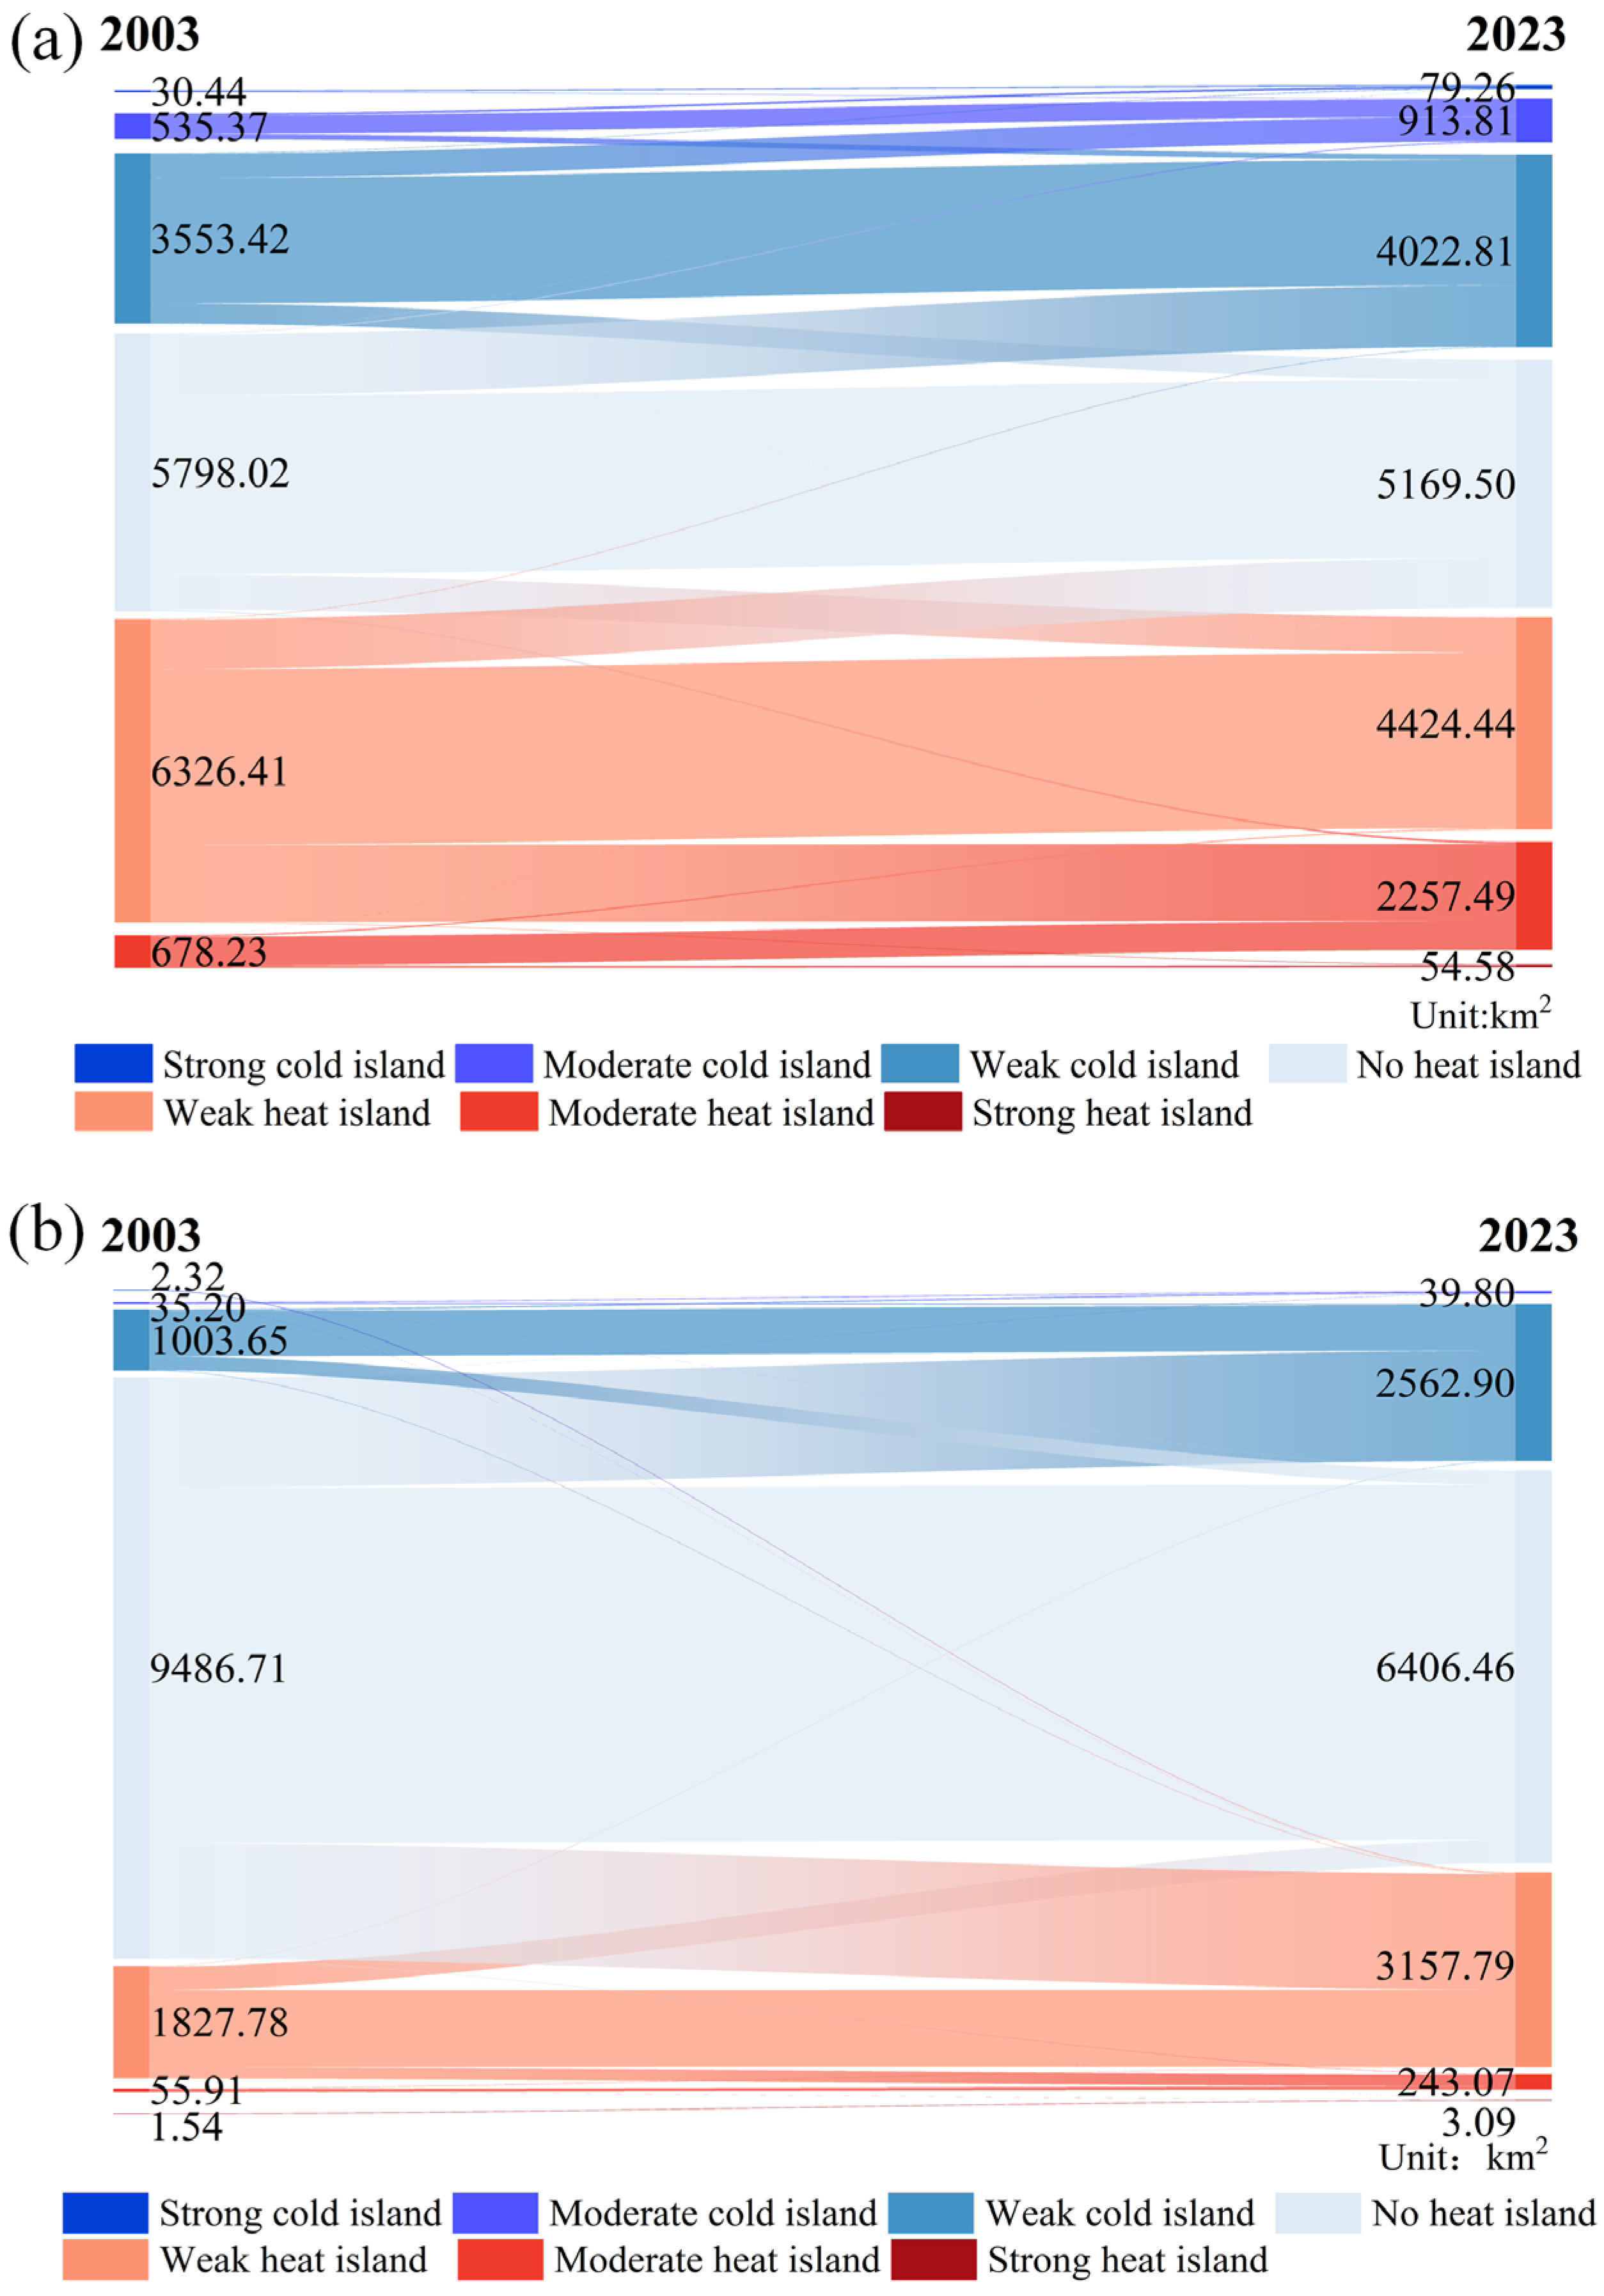
To analyze the transitions between different types of urban heat islands and provide insights into future changes, Figure 13 is plotted. The analysis highlights that while both Beijing and Dalian have experienced shifts in their heat island categories, Beijing sees an increase in stronger heat islands and a decrease in areas with no heat islands, whereas Dalian primarily sees a reduction in areas with no heat island and an expansion in weak heat islands and cold islands. As depicted in Figure 13a, from 2003 to 2023, Beijing shows a reduction in areas with no heat islands and moderate heat islands, while the other categories increase overall. Notably, weak heat island areas decrease by 1901.97 km2, primarily transitioning to moderate heat island (82.99%) and no heat island (15.68%) areas. Strong heat island areas expand by 54.58 km2, mainly from the transitions of moderate and weak heat islands. Moderate heat island areas grow by 1579.26 km2, largely from weak heat island and no heat island areas. Weak cold island areas increase by 469.36 km2, mainly transitioning from no heat island and moderate cold island areas. Moderate cold islands grow by 378.44 km2, primarily from weak cold island and no heat island areas, and strong cold islands expand by 48.82 km2, mostly from moderate cold islands.
According to Figure 13b, from 2003 to 2023, Dalian experiences a decrease in areas with no heat islands and strong cold islands, while the other categories expand. The area with no heat islands declines significantly by 3080.25 km2, shifting predominantly to weak cold island (50.77%) and weak heat island (48.83%) areas. Strong heat island areas expand by 1.55 km2, mostly from moderate heat island and no heat island areas. Moderate heat islands increase by 187.16 km2, primarily from weak heat island and no heat island areas, while weak heat island areas grow by 1330.01 km2, largely from no heat island areas. Weak cold island areas expand by 1559.25 km2, mainly from no heat island and moderate heat island areas, and moderate cold island areas increase by 4.6 km2, primarily from weak cold islands.

4.3. Driving Factors

Five driving factors are selected and the GTWR model is employed to analyze the SUHIII in Beijing and Dalian. The adjusted regression coefficients for GTWR are 0.99 for Beijing and 0.93 for Dalian, indicating strong regression performance. The primary factor driving the SUHIII in Beijing is TEMP, although its influence has slightly diminished over time, with the regression coefficient decreasing from 0.85 in 2003 to 0.75 in 2018 (Table 3). The primary factor mitigating the SUHIII is EVI, with its mitigating effect becoming increasingly pronounced, with the regression coefficient dropping from −11.46 in 2003 to −17.98 in 2018 (Table 3). This suggests that an increase in vegetation effectively alleviates the heat island effect. Additionally, PREP has shown a slight mitigating effect in recent years. ET has shifted from a mitigating factor to a promoter of SUHIII, likely due to increased PREP and reduced ET in the urban center, particularly in the Dongcheng and Xicheng districts. This has led to an increase in water bodies in the inner-city areas, resulting in a phenomenon similar to coastal cities, where nighttime water heat release contributes to an elevation in the SUHIII. The impact of POP on the SUHIII is relatively minor.
In contrast, TEMP remains the main factor promoting the SUHIII effect in Dalian. Its regression coefficient steadily increases from 2.15 in 2003 to 2.48 in 2018 (Table 3). Unlike in Beijing, ET in Dalian has consistently shown a positive correlation, and PREP has also exhibited a positive correlation in recent years. This can primarily be attributed to reduced ET and PREP in suburban areas, such as Wafangdian, Pulandian, and Zhuanghe City, where the SUHIII has been decreasing. The effect of POP on SUHIII is less significant compared to Beijing. Similarly to Beijing, the primary factor mitigating the SUHIII in Dalian is EVI, which has partially alleviated the SUHIII.
To gain a more comprehensive understanding of the temporal and spatial changes in the driving factors at the county-level administrative scale, we analyze the variations in the regression coefficients of each driving factor relative to the SUHIII.

4.3.1. Annual Mean Maximum Temperature (TEMP)

The relationship between TEMP and SUHIII shows a significant positive correlation in both Beijing and Dalian, although the strength of the correlation differs significantly. In Dalian, the regression coefficients are generally higher, reaching up to 3.92, while the maximum value in Beijing is only 1.13. This suggests that the relationship between TEMP and SUHIII is more pronounced in Dalian compared to Beijing (Figure 14).
In Beijing, the relationship between TEMP and SUHIII exhibits significant temporal and spatial variability. For instance, in Miyun, the correlation is weak in 2003 but gradually strengthens by 2018. In contrast, the correlation in southeastern regions such as Fangshan, Huairou, Pinggu, Shunyi, Tongzhou, and Chaoyang shows a declining trend. In Dalian, except for Zhuanghe, the relationship between TEMP and SUHIII has been progressively strengthening. The relatively small temperature variation in coastal areas, due to the moderating effect of the ocean, may enhance the driving force of TEMP on SUHIII. At the same time, industrialization and urban expansion may lead to higher temperatures, thereby exacerbating the urban heat island effect. This is particularly evident in Pulandian, an industrial area, where the correlation between temperature and SUHIII is especially significant.

4.3.2. Precipitation (PREP)

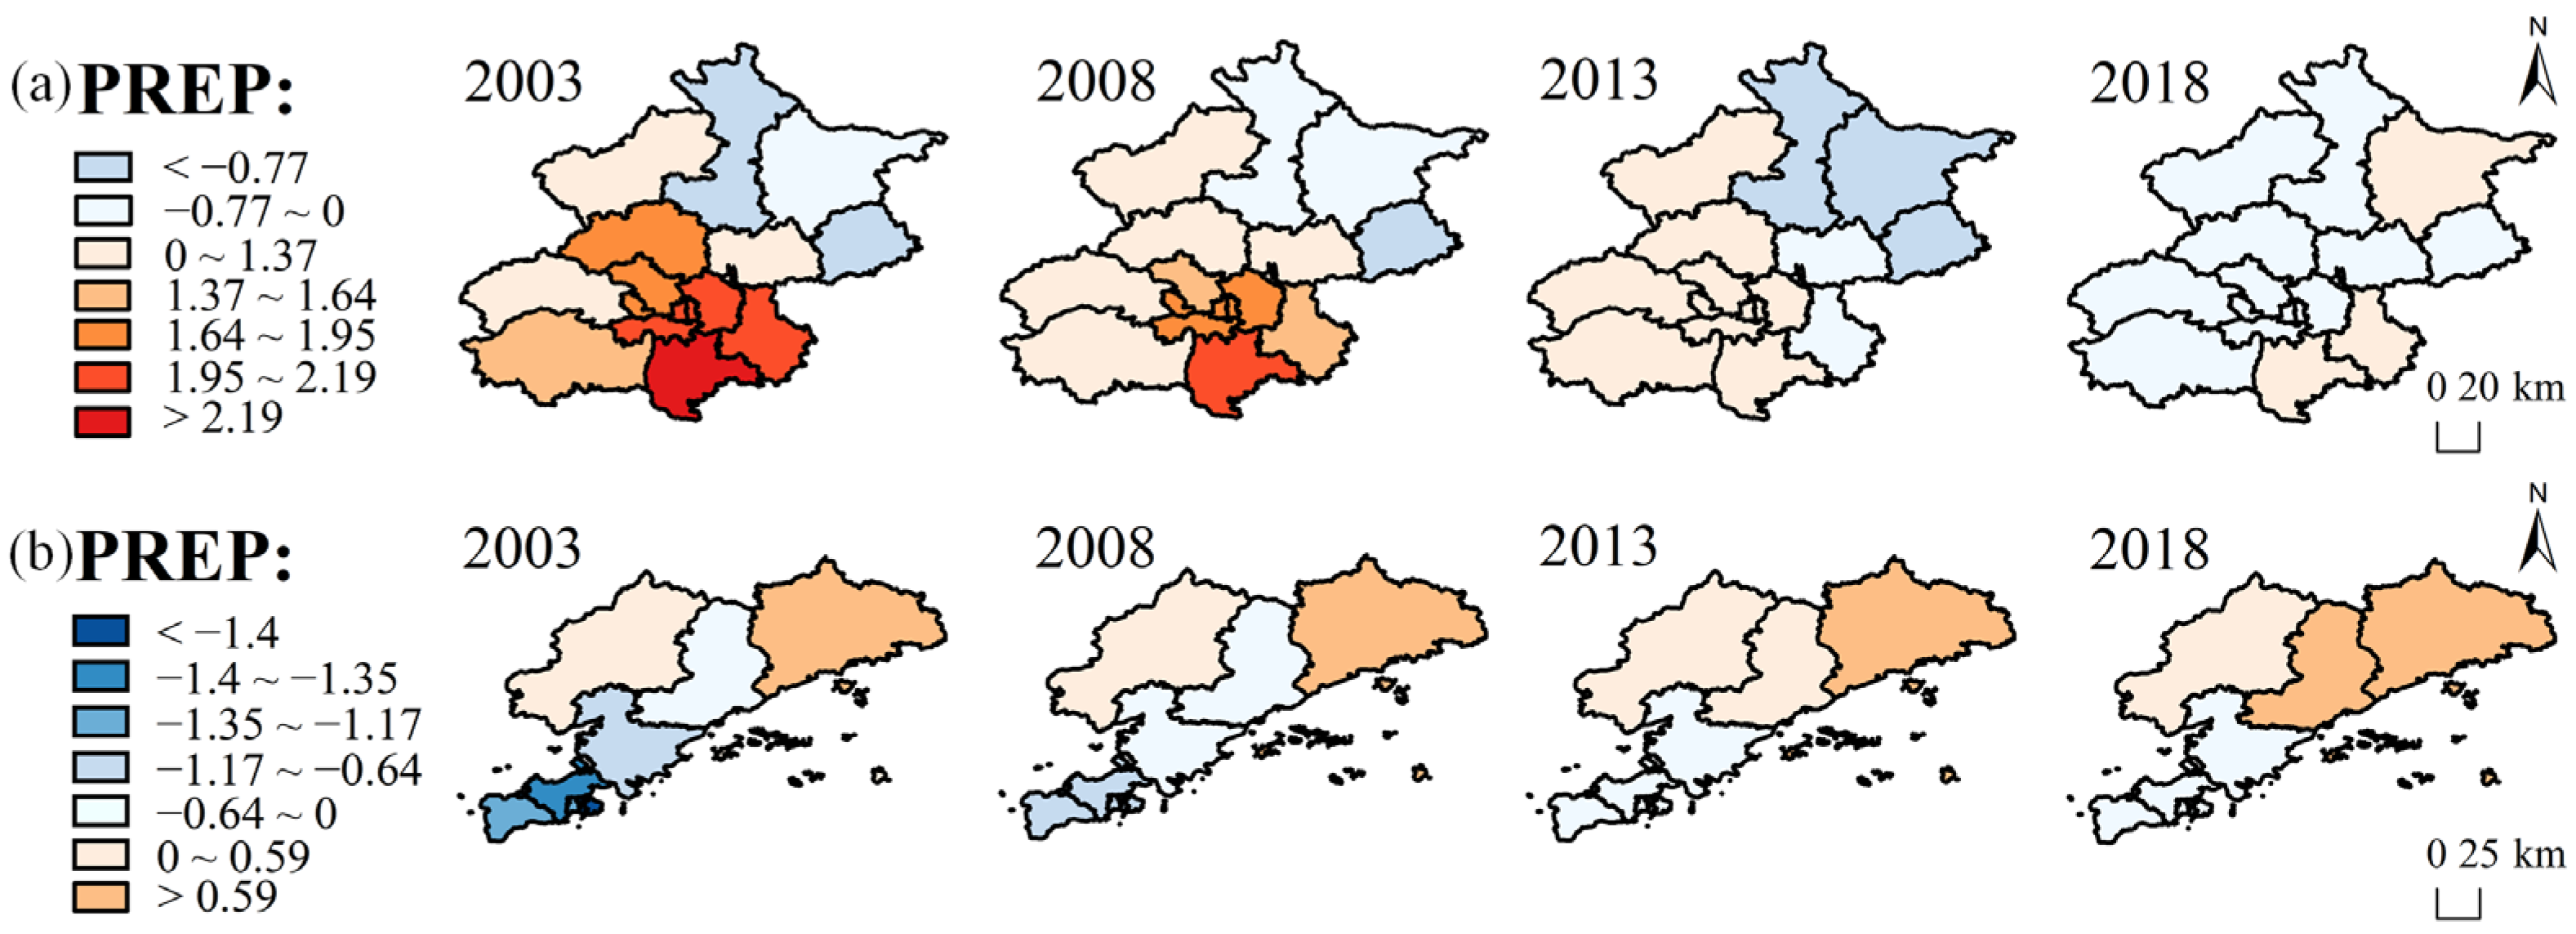
The correlation coefficients between PREP and SUHIII exhibit both positive and negative correlations in the two cities. In Beijing, the area showing a negative correlation has increased, while in Dalian, the area with a positive correlation has expanded (Figure 15). This indicates that PREP may have a mitigating effect on SUHIII in the inland city of Beijing, while it appears to have a promoting effect on SUHIII in the coastal city of Dalian.
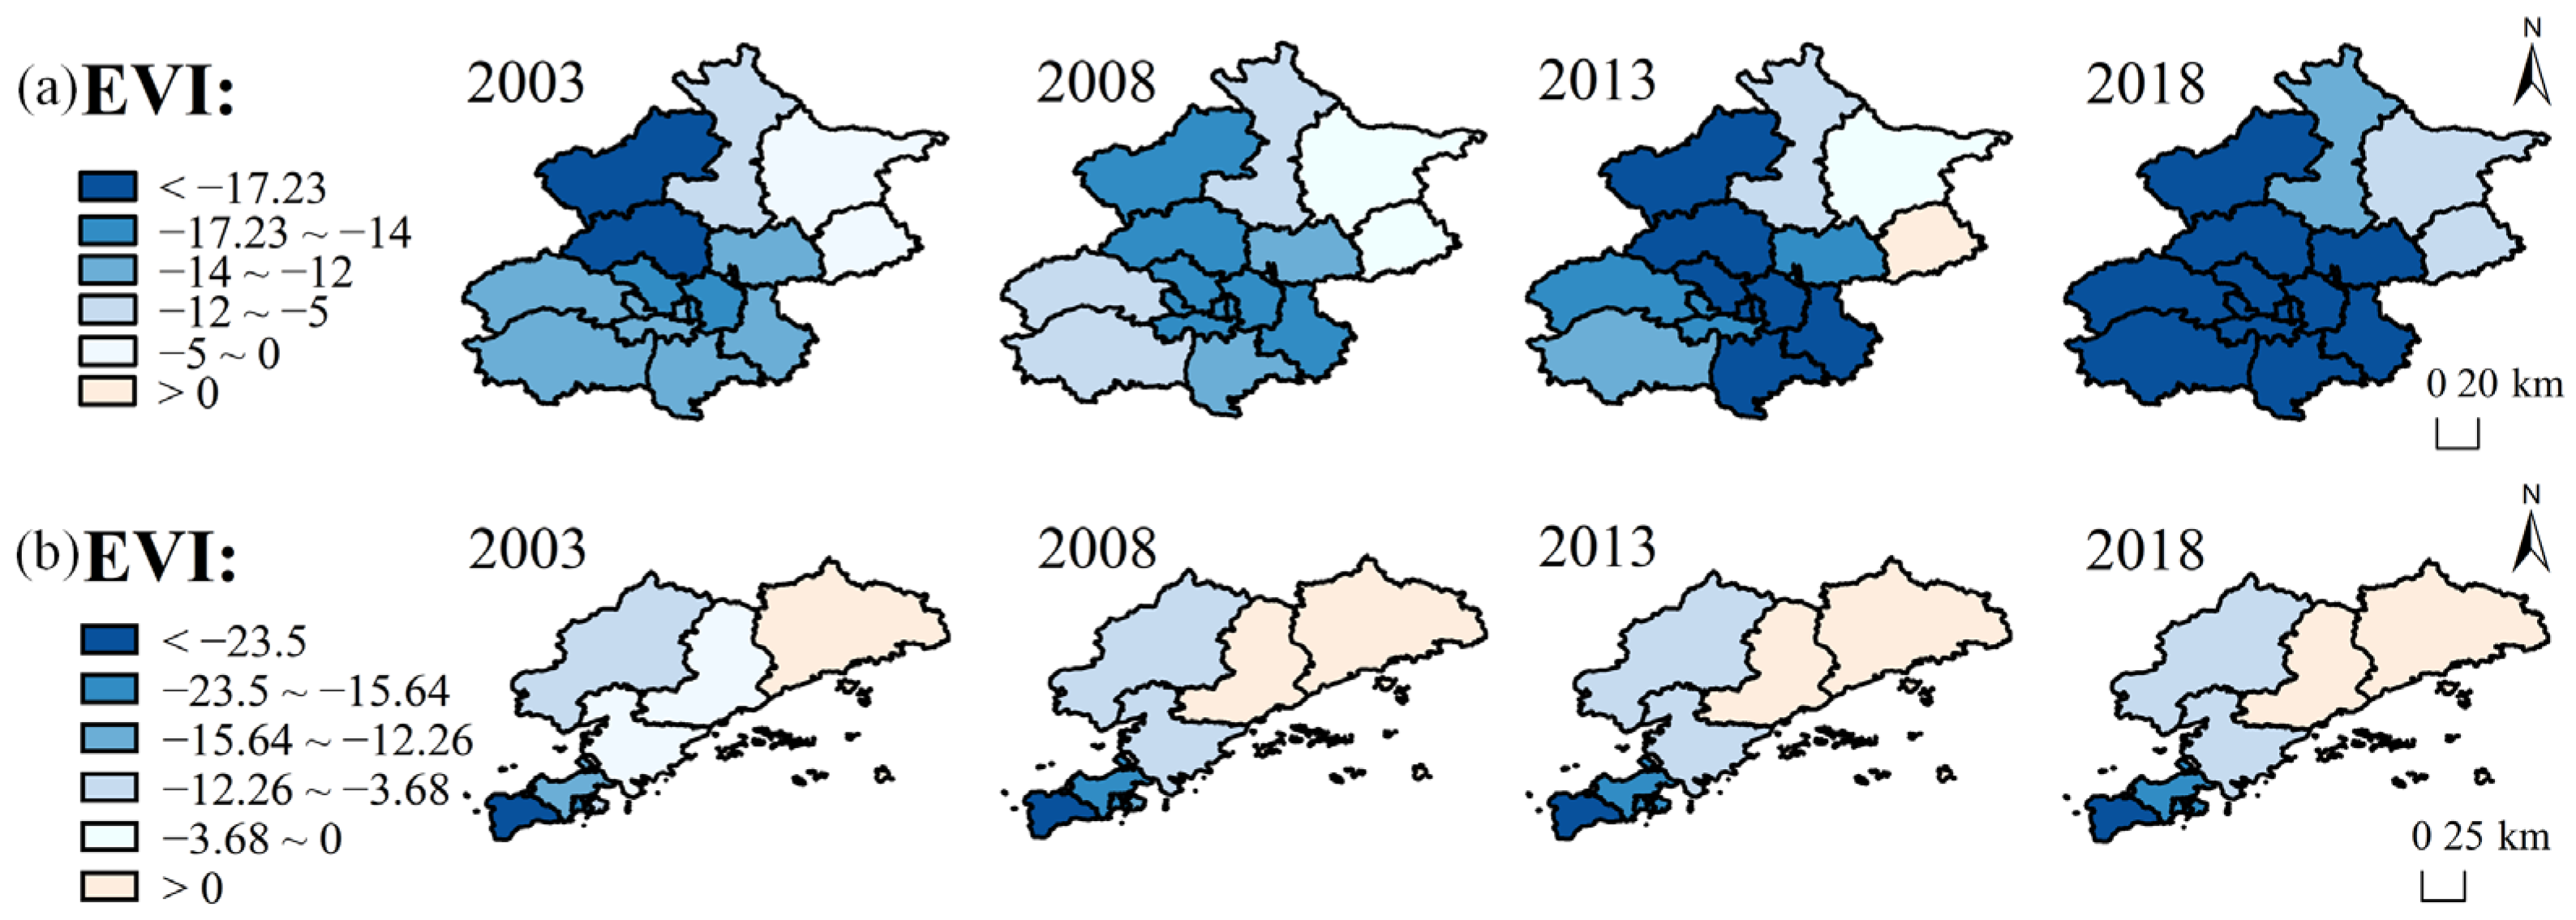
In Beijing, southern urban areas initially show a positive correlation between PREP and the SUHIII in 2003. Over time, areas such as Dongcheng, Xicheng, and Chaoyang transition to negative correlations. This shift is part of our preliminary exploration, which focuses on the potential role of impermeable surfaces in mediating the relationship between precipitation and SUHIII. This can be explained by changes in urban land use, particularly the increase in impervious surfaces, which hinder the absorption and infiltration of rainwater (Figure 16). In these densely built-up areas, PREP does not provide the expected cooling effects; instead, it may enhance heat retention through increased surface water runoff and heat release from urban infrastructure. Urbanization further compounds this issue, as latent heat from surfaces with higher water content can exacerbate the nighttime heat island effect. While vegetation increases in some regions, these measures may mitigate the heat island effect, but they do not fully offset the impacts of urbanization and changes in land cover. Conversely, in the northern regions of Beijing, such as Miyun District, the correlation shifts from negative to positive, with Miyun’s coefficient notably rising to 0.038 in recent years. The positive correlation in Miyun can be attributed to the relatively lower degree of urbanization, which allows PREP to effectively cool the area. As urbanization increases in suburban areas, this trend may reflect a complex interaction between increasing vegetation and expanding urban infrastructure. In areas with growing vegetation and enhanced water absorption and storage capabilities, the cooling effect of PREP may further strengthen the positive correlation with the SUHIII, as latent heat fluxes from vegetated surfaces increase.
In Dalian, southwestern urban areas show an upward trend in regression coefficients with the SUHIII, although they remain negatively correlated. This suggests that while PREP may initially have a cooling effect, it is overshadowed by other factors, such as higher anthropogenic heat emissions and urban heat storage in more densely urbanized areas. In these regions, PREP may contribute less to reducing the SUHIII due to the presence of impervious surfaces and the urban heat retention associated with them (Figure 16). Northeastern suburban areas, particularly Pulandian District, display an increasing trend, with coefficients rising from −0.64 in 2003 to 0.76 in 2018. This shift indicates a growing positive correlation between PREP and the SUHIII in suburban regions. A possible explanation for this trend is that, despite the increase in PREP, urbanization has led to higher water retention in the form of urban water bodies or green spaces. These areas absorb heat during the day and release it at night, contributing to higher nighttime temperatures. Additionally, changes in land use and the development of urban infrastructure in Pulandian may have created conditions that favor positive correlations between PREP and the SUHIII.

4.3.3. Population Density (POP)

In the relationship between POP and SUHIII, both Beijing and Dalian show a positive correlation, although the regression coefficients are relatively small, indicating that POP has a limited impact on SUHIII. This relationship has also weakened in recent years (Figure 17). Specifically, the most noticeable decrease in Beijing is in Miyun District, where the coefficient declines from 1.32 in 2003 to −0.58 in 2018, indicating a shift from a positive to a negative correlation. In Dalian, the southwest regions, particularly Ganjingzi District, show the most pronounced decrease, with the coefficient changing from 0.0004 in 2003 to −0.0019 in 2018. This suggests a weakening impact of population density on urban heat islands, with negative correlations observed in the Ganjingzi and Lvshunkou Districts, while other areas maintain positive correlations.

4.3.4. Enhanced Vegetation Index (EVI)

In both Beijing and Dalian, EVI generally shows a negative correlation with SUHIII, indicating that an increase in vegetation typically helps mitigate the urban heat island effect. However, in certain specific areas and time periods, a positive correlation is observed (Figure 18). In Beijing, there is a decreasing trend in the regression coefficients between the EVI and the SUHIII, which is particularly noticeable in the southwest urban areas, Yanqing, and Changping. The coefficient for Pinggu District turns positive in 2013, but reverts to negative by 2018. In Dalian, there is an increasing trend in the regression coefficients between the EVI and the SUHIII, especially in Pulandian District, where the coefficient changes from −1.37 in 2003 to 4.37 in 2018, indicating a shift from negative to positive correlation. This shift in Pulandian District can be attributed to the dynamic trends of the SUHIII and the EVI between 2003 and 2018, with both exhibiting similar increasing patterns. The temporal consistency between the trends of the SUHIII and the EVI during these periods likely contributes to the positive correlation observed in the later years.

4.3.5. Evapotranspiration (ET)

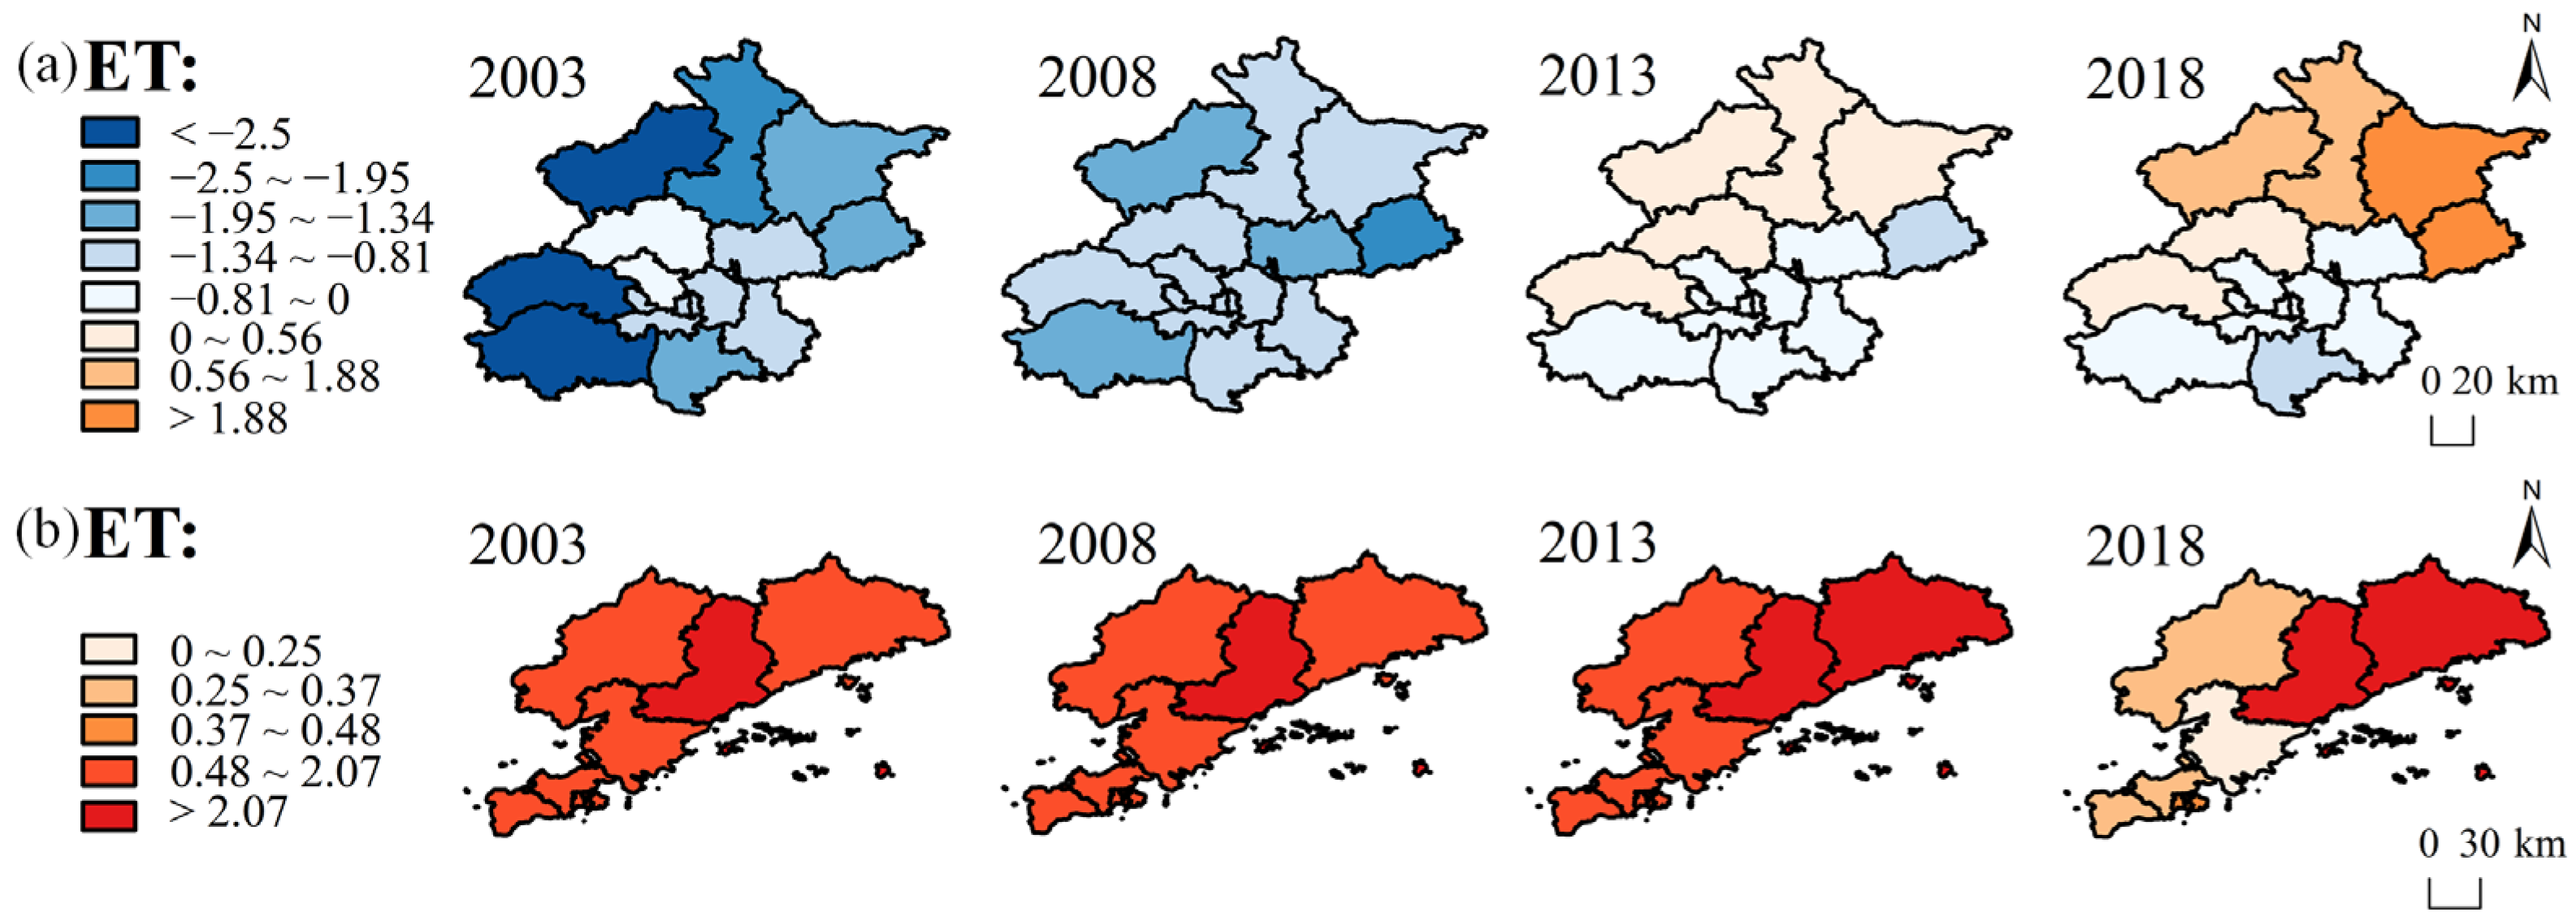
The spatial distribution of regression coefficients between ET and the SUHIII is illustrated in Figure 19. There are significant differences in the correlation between ET and the SUHIII in Beijing. In 2003, Beijing shows a negative correlation, but there is an upward trend over time, with some areas transitioning to a positive correlation. In contrast, Dalian exhibits a positive correlation between 2003 and 2018, though with a declining trend.
In Beijing, all districts show an increasing trend in the regression coefficients between ET and the SUHIII. The northern suburban areas, particularly the Miyun and Pinggu districts, show increased positive correlations between 2013 and 2018. In Dalian, significant changes are observed in the western urban areas, where the correlation between ET and the SUHIII decreases but remains positive.
To further explore these patterns in Beijing and Dalian, Table 4 is presented. In Beijing, the shift from a negative correlation in 2003 to partial positive correlations in some areas indicates the changing dynamics of urbanization. Early negative correlations may suggest that, during initial urbanization, green spaces and water bodies—corresponding to ET values of 1.38 mm/day in 2003 and 1.48 mm/day in 2008—help reduce temperatures and thus weaken the SUHIII. However, as the city expands, green spaces and water bodies are likely converted to impermeable surfaces, leading to the decrease in ET to 1.41 mm/day in 2013 and 1.31 mm/day in 2018. This contributes to rising temperatures and a strengthened SUHIII. Additionally, increased heat emissions from sources such as traffic and industry may elevate the SUHIII, even in areas with higher ET.
In contrast, Dalian maintains a consistent positive correlation between ET and the SUHIII from 2003 to 2018, though this correlation shows a declining trend. This sustained positive correlation may result from the interaction between urban development and natural geography. As a coastal city, Dalian’s climate and sea breezes likely enhance evaporation, boosting ET. However, urbanization may reduce green spaces, limiting ET potential. By 2018, Dalian’s ET is 1.26 mm/day, with increased built-up areas likely intensifying the SUHIII, reaching a SUHIII value of 1.21 °C in the same year. Nonetheless, urban greening and ecological conservation policies may help mitigate the SUHI effect in Dalian to some extent.
From a theoretical perspective, Beijing’s TEMP is positively correlated with SUHIII, indicating a connection between the rise in TEMP and the intensification of the SUHI effect. In recent years, PREP has shown a negative correlation with SUHIII in most areas of Beijing, particularly in highly urbanized regions, suggesting that PREP has the potential for mitigating the SUHI effect. Furthermore, Beijing’s EVI is negatively correlated with SUHIII, further demonstrating the important role of EVI in alleviating the SUHI effect. However, with urban expansion, green spaces and water bodies are gradually being replaced by impervious surfaces, leading to a decline in ET levels and, consequently, exacerbating the SUHI effect. In Dalian, TEMP is also positively correlated with SUHIII, with a more significant influence of TEMP on SUHIII compared to Beijing. In Dalian’s southern regions, PREP shows a negative correlation with SUHIII, while in the northeastern suburbs, the correlation is positive, and the area with this positive correlation is relatively larger. Despite Dalian’s relatively high ET levels, which theoretically help alleviate the SUHI effect, the reduction in green space due to urbanization has prevented this advantage from fully offsetting the intensification of the SUHI effect. In both cities, POP has a weak direct effect on the SUHI, with a declining trend. However, as the population grows, other changes in the urbanization process, such as increased impervious surfaces and stronger building heat effects, may indirectly intensify the SUHI effect.
From a practical perspective, managing the SUHI effect in coastal and inland areas requires region-specific strategies based on their unique spatial and temporal characteristics. For both Beijing and Dalian, increasing green space and reducing the expansion of impervious surfaces are key shared strategies. By developing more urban parks, greenways, and green roofs, vegetation coverage can be increased to effectively alleviate the SUHI effect. Additionally, using smart city technologies for precise environmental monitoring and management, raising public environmental awareness, and encouraging residents and businesses to participate in greening projects, water conservation efforts, and environmental actions are all effective measures for mitigating the SUHI effect. For Beijing, the focus should be on optimizing water resource management, enhancing green infrastructure, and fully using water bodies to further enhance the cooling effect of PREP, as well as increasing EVI and ET levels to slow the rising trend of SUHIII. Particularly in the less urbanized northern regions, increasing green space and water coverage can improve ET and humidity, thereby more effectively using PREP to mitigate the SUHI effect. As the city expands, Beijing should place more emphasis on limiting the expansion of impervious surfaces, promoting permeable paving, and designing green buildings to reduce heat accumulation. Moreover, optimizing stormwater management systems through green roofs and rain gardens would further enhance PREP’s potential in alleviating the SUHI. For Dalian, given the strong correlation between TEMP and SUHIII, policies should prioritize optimizing urban design and improving building materials to reduce heat accumulation and mitigate the negative effects of the SUHI. Expanding green space is equally crucial, as increasing green area can enhance the ability of EVI to alleviate the SUHI effect. Particularly in the northeastern regions of Dalian, such as Pulandian and Zhuanghe, proper vegetation management and urban greening are key to preventing vegetation degradation and the intensification of the SUHI effect due to overdevelopment or improper management. Considering that Dalian’s PREP has not fully played a cooling role, special attention should be given to protecting and restoring coastal wetland ecosystems to enhance their natural cooling function, thereby reducing the negative impacts of human-induced heat emissions and urban heat retention.

5. Discussion

5.1. Trend Analysis

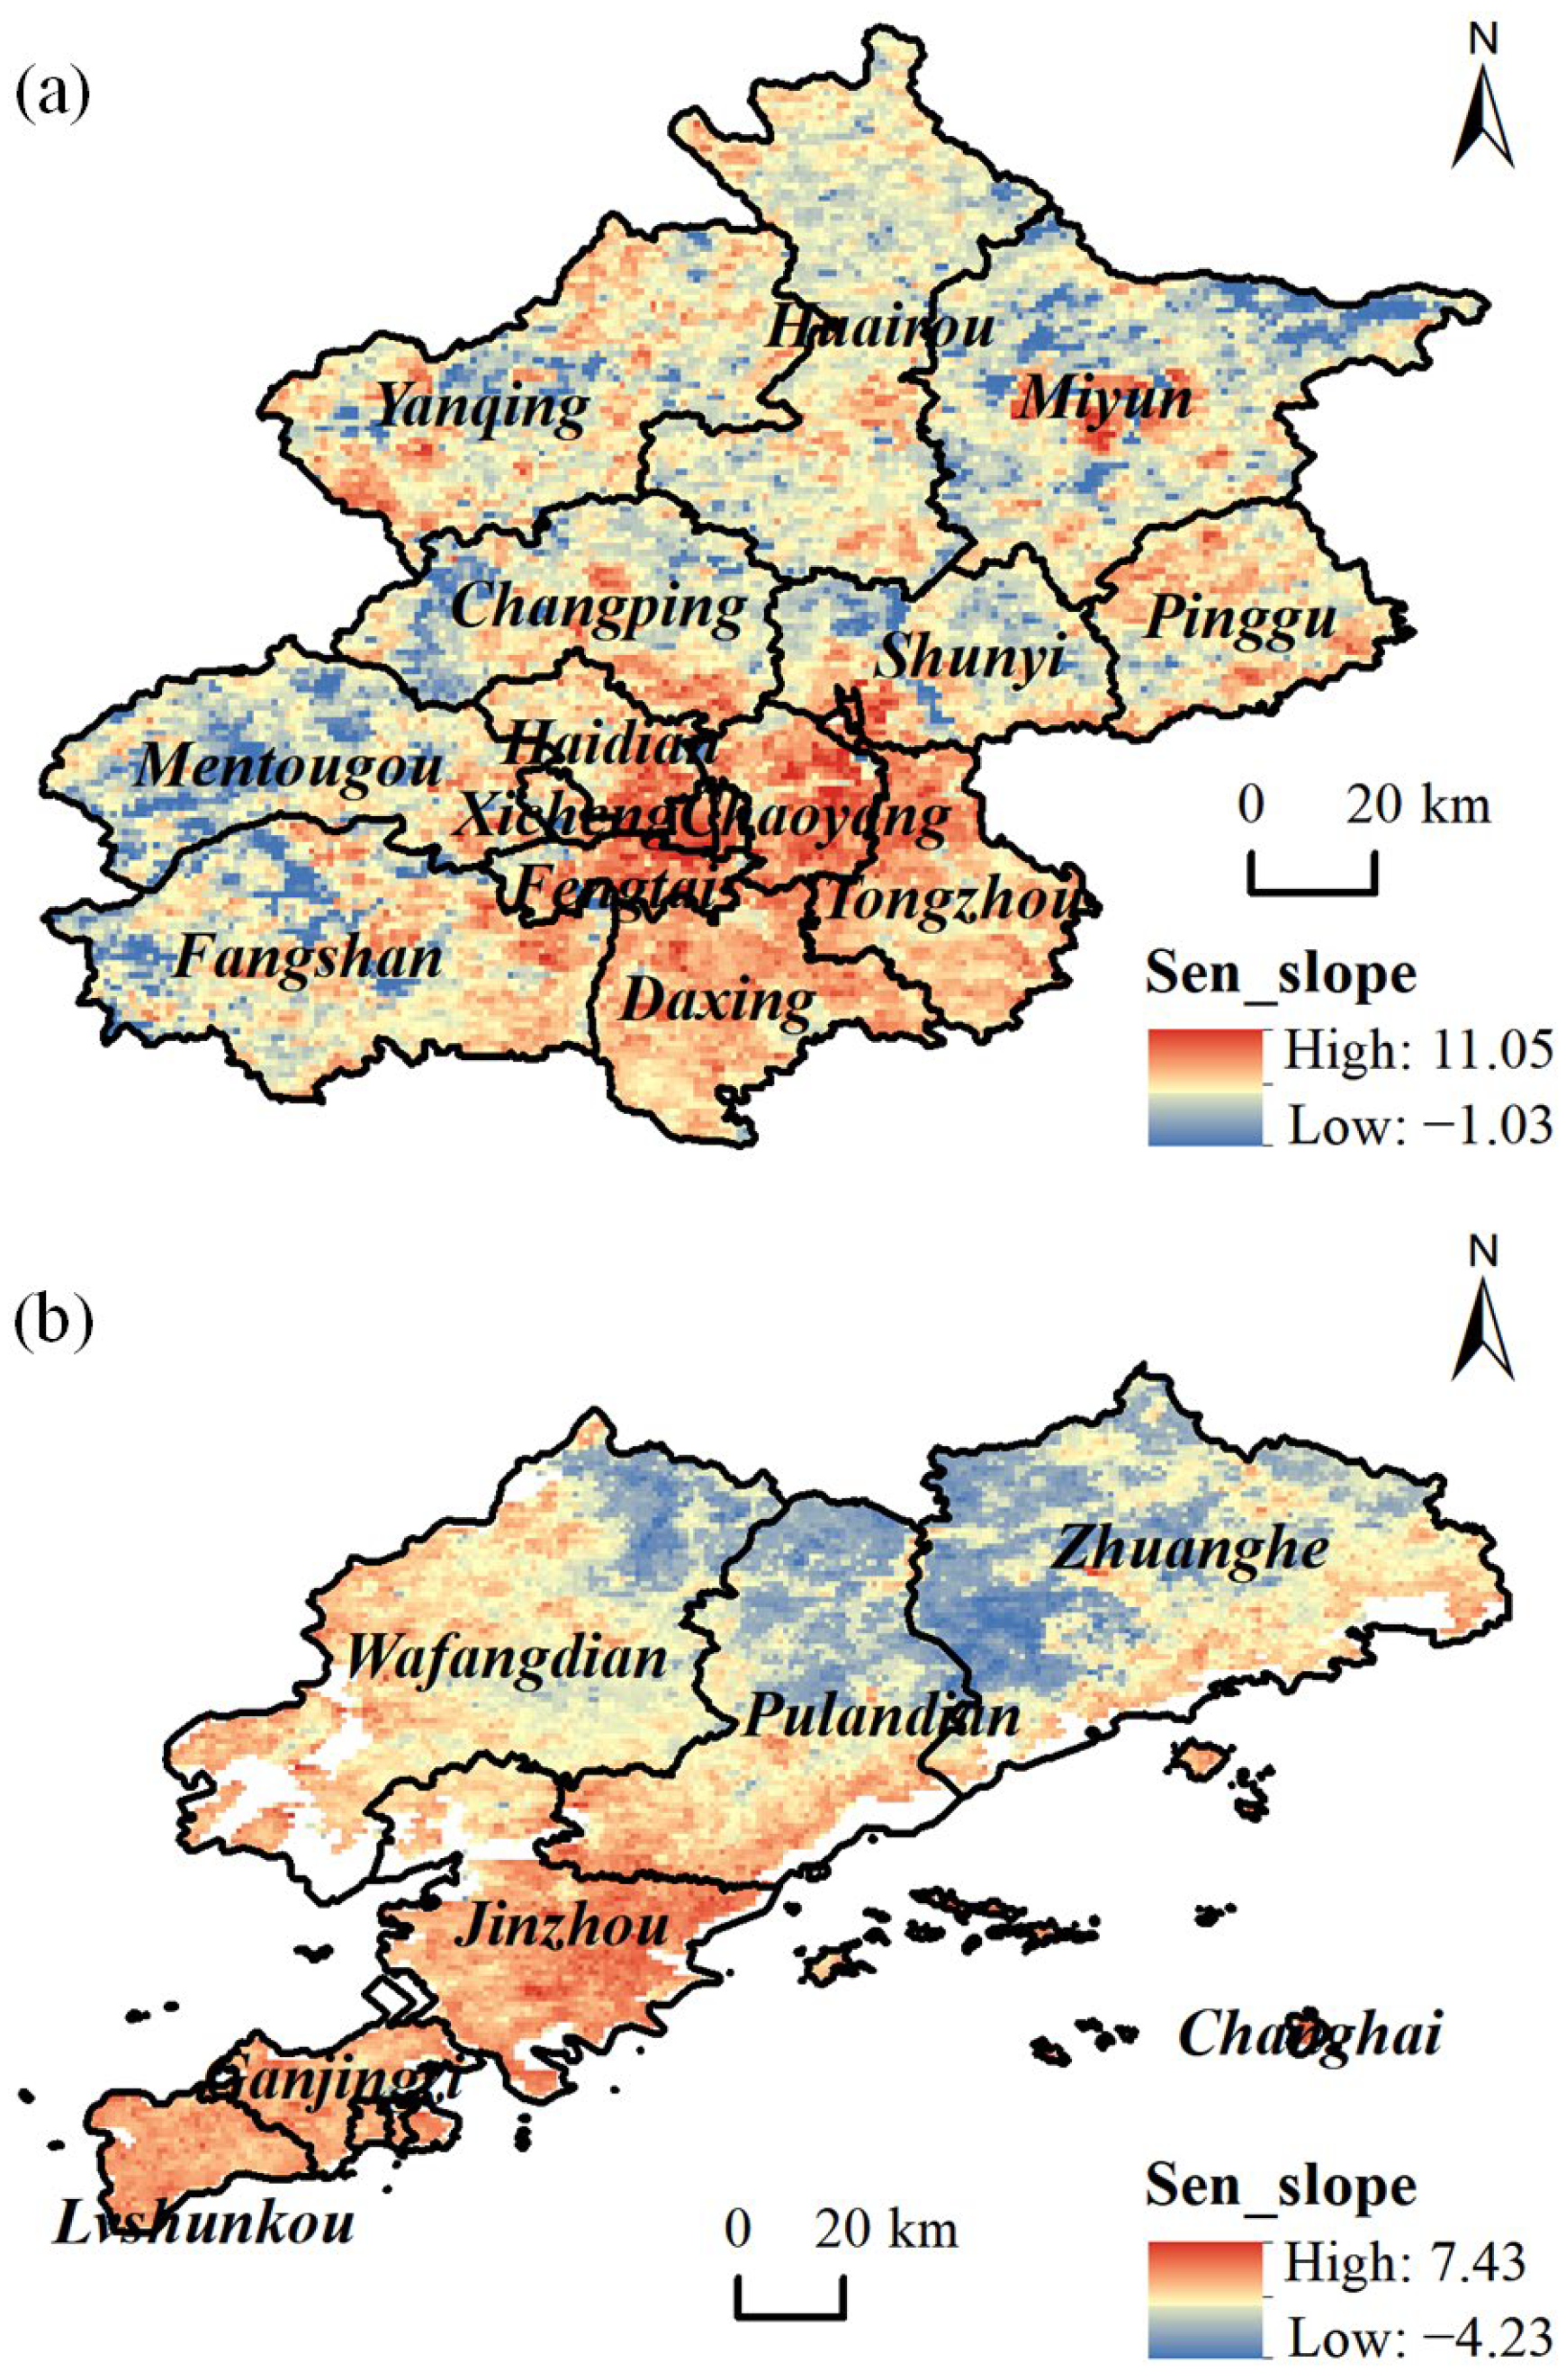
The Theil–Sen slope trend analysis method [59] was applied to analyze the temporal trends of LSTs across Beijing and Dalian from 2003 to 2023 at the pixel level. This non-parametric method, which calculates the median of slopes between all data point pairs, effectively identifies monotonic trends in environmental data. Positive values indicate increasing trends, while negative values signify decreasing trends, enabling a detailed understanding of spatiotemporal variations in land surface temperatures (Figure 20).
In Beijing, southwestern districts such as Daxing and Fengtai experienced notable increases in SUHIII, likely attributed to urban expansion and the proliferation of impervious surfaces. In contrast, northeastern districts such as Huairou and Miyun exhibited declining trends, likely due to effective vegetation conservation measures and slower urban development. Similarly, in Dalian, southwestern districts, including Jinzhou and Ganjingzi, showed rising SUHIII values, whereas northeastern regions such as Zhuanghe experienced declines, likely resulting from the cooling effects of mountainous terrain and vegetation cover. These findings align with previous research indicating that urbanization exacerbates SUHI effects, while vegetation mitigates them [58,59].

5.2. Recommendations for Urban Heat Island Mitigation

Mitigating the SUHI effect requires a comprehensive approach that incorporates green infrastructure, reflective materials, optimized urban layouts, and sustainable transportation systems. Enhancing urban greenery, such as parks, green roofs, and vertical gardens, has proven to be an effective strategy for reducing surface temperatures through shading and evapotranspiration. For instance, implementing these initiatives in Beijing’s southwestern districts and along Dalian’s coastal areas could counteract rising SUHIII levels. Research underscores the fact that green infrastructure not only lowers temperatures, but also improves urban albedo and evapotranspiration rates, making it a key component of SUHI mitigation [60].
In addition to green infrastructure, the use of reflective materials for pavements and rooftops can significantly reduce heat absorption and improve thermal comfort. Retrofitting existing structures in high-SUHIII areas with cool roofs and pavements has been shown to effectively lower surface temperatures, demonstrating the potential of this strategy for large-scale urban implementation [61]. Furthermore, optimizing urban layouts to preserve ventilation corridors and incorporate green belts can enhance heat dispersion and airflow. In coastal cities such as Dalian, urban designs that leverage sea breezes could offer natural cooling benefits. Studies have consistently highlighted the importance of strategic urban planning in managing SUHI effects, particularly when it integrates vegetation and airflow considerations [62].
Finally, promoting sustainable transportation systems is critical for reducing anthropogenic heat emissions. Expanding public transportation networks and cycling infrastructure not only reduces vehicle emissions, but also contributes to lower urban temperatures and improved air quality. Evidence from previous studies demonstrates that such measures can have a substantial impact on mitigating SUHI effects while simultaneously advancing broader environmental and public health goals [63,64,65].

5.3. Outlook

The limitations of the available data, such as the lack of high-resolution thermal data beyond 2019, have constrained a comprehensive analysis of SUHI drivers in recent years. Future research should prioritize the integration of updated, high-resolution datasets to better analyze SUHI dynamics from 2018 to 2023. While MODIS data provide valuable insights into large-scale surface temperature changes, their spatial resolution limits fine-scale analyses of urban heat island structures. Incorporating higher resolution data is essential to better understand the effects of urban form, green space, and socioeconomic activities.
As urbanization intensifies amid climate change, adopting sustainable urban development practices becomes increasingly critical. Advanced technologies, such as IoT-enabled climate monitoring systems, can provide real-time data to proactively manage urban heat islands. Additionally, future research should explore a wider range of driving factors influencing the SUHI, including urban planning policies, energy use patterns, and social behaviors. Understanding the interactions among these factors will offer deeper insights into SUHI mechanisms and support the development of more effective and targeted mitigation strategies for urban sustainability.

6. Conclusions

This study analyzes the SUHIII in Beijing and Dalian from 2003 to 2023, uncovering significant temporal and spatial trends. Through a comparative approach, the research elucidates differences in SUHI effects between coastal and inland cities and identifies key driving factors.
Beijing and Dalian, being located at similar latitudes, both exhibit an overall increasing trend in the SUHIII, reaching their peaks in 2023. However, significant differences exist between the cities in terms of seasonal variations and driving factors of the SUHI effect, reflecting the distinct responses of inland and coastal cities to climate and environmental factors. As a typical inland city, Beijing’s strong heat island area increases by 54.58 km2 from 2003 to 2023. The SUHIII during summer days in Beijing is notably higher than in Dalian, with the average SUHIII being approximately 0.45 °C higher than Dalian. In recent years, the main driving factors behind the SUHI effect in Beijing have been TEMP and ET, while the key factors mitigating the heat island effect are EVI, followed by PREP. This indicates that, in inland cities, an increase in vegetation plays a significant role in mitigating the heat island effect, with increased PREP also effectively reducing its intensity.
In contrast, Dalian, as a coastal city, experiences an increase in the heat island area from 1885.23 km2 in 2003 to 3403.95 km2 in 2023, showing a much greater rise than in Beijing, suggesting a recent intensification of the SUHI effect in this region. During winter nights, Dalian exhibits a stronger SUHI effect compared to Beijing, with the nighttime SUHIII being approximately 0.24 °C higher, which is closely related to its maritime climate. The characteristics of the maritime climate result in a slower temperature response in Dalian, and the relatively higher nighttime LST contributes to the enhancement of the winter nighttime heat island effect. In recent years, the primary driving factor for the intensified heat island effect in Dalian has been TEMP. The main mitigating factor remains the EVI, but its correlation is weaker than in Beijing, indicating that while vegetation in coastal cities can still help reduce the SUHI effect, its impact is less pronounced compared to inland cities. PREP and ET are positively correlated with the SUHIII, particularly the reduction in PREP and ET in suburban areas, which has led to a weakening of the SUHI effect in these regions.
Inland cities, due to their distance from the ocean, face more intense urbanization processes and increased impervious surfaces, leading to a more severe urban heat island effect. Therefore, it is essential to prioritize the expansion of green spaces and water bodies, strengthen vegetation cover, and leverage plant evapotranspiration to effectively lower temperatures. Additionally, the proportion of impervious surfaces should be strictly controlled during urban expansion. In contrast, coastal cities like Dalian, benefiting from the moderating effects of the marine climate, experience relatively smaller temperature fluctuations. However, due to urbanization-induced increases in building density and reductions in green spaces, significant heat island effects still persist. Therefore, coastal cities need to not only strengthen urban greening but also focus more on the rational planning of water bodies and wetland protection, using the natural regulating capacity of sea breezes and wetlands to mitigate the heat island effect and avoid the negative impacts of overdevelopment.
Through a comprehensive analysis supported by multiple data sources, this study not only advances our understanding of SUHI effects, but also provides practical guidance for urban planners and policymakers to formulate and implement effective strategies for mitigating these effects, thereby promoting urban development towards greater sustainability and livability. Future research should continue to deepen the exploration of SUHI effects and their driving factors to more accurately assess the effectiveness of different mitigation measures, thereby providing a more solid scientific basis for addressing SUHI issues amidst global climate change.

Author Contributions

Conceptualization, Y.M. and C.G.; methodology, Y.M. and W.Y.; software, Y.M. and E.Z.; formal analysis Y.Z. and R.W.; writing—original draft preparation, Y.M. and W.L.; writing—review and editing, H.Z. and C.G.; supervision, J.Z. All authors have read and agreed to the published version of the manuscript.

Funding

This work was supported by the General Program of the National Natural Science Foundation of China under Grant 42271395, and by the Ministry of Science and Technology of China, the National Quality Infrastructure System under Grant 2022YFF0610802.

Data Availability Statement

The data presented in this study are available on request from the corresponding author, the data are not publicly available due to privacy.

Acknowledgments

The authors acknowledge the use of the MODIS MYD11A2 V6.1 product from NASA, accessed via the Google Earth Engine platform V0.1.388. We thank the teams at NASA/MODIS for their support and for providing the data that have been essential to our study.

Conflicts of Interest

The authors declare no conflicts of interest.

References

  1. Manley, G. On the Frequency of Snowfall in Metropolitan England. Q. J. R. Meteorol. Soc. 1958, 84, 70–72. [Google Scholar] [CrossRef]
  2. Oke, T.R. The Energetic Basis of the Urban Heat Island. Q. J. R. Meteorol. Soc. 1982, 108, 1–24. [Google Scholar] [CrossRef]
  3. Oke, T.R. City Size and the Urban Heat Island. Atmos. Environ. (1967) 1973, 7, 769–779. [Google Scholar] [CrossRef]
  4. Sarif, M.O.; Rimal, B.; Stork, N.E. Assessment of Changes in Land Use/Land Cover and Land Surface Temperatures and Their Impact on Surface Urban Heat Island Phenomena in the Kathmandu Valley (1988–2018). ISPRS Int. J. Geo-Inf. 2020, 9, 726. [Google Scholar] [CrossRef]
  5. Un-Habitat. World Cities Report 2020: The Value of Sustainable Urbanization; United Nations Human Settlements Programme: Nairobi, Kenya, 2020. [Google Scholar]
  6. Vujovic, S.; Haddad, B.; Karaky, H.; Sebaibi, N.; Boutouil, M. Urban Heat Island: Causes, Consequences, and Mitigation Measures with Emphasis on Reflective and Permeable Pavements. CivilEng 2021, 2, 459–484. [Google Scholar] [CrossRef]
  7. Morabito, M.; Crisci, A.; Guerri, G.; Messeri, A.; Congedo, L.; Munafò, M. Surface Urban Heat Islands in Italian Metropolitan Cities: Tree Cover and Impervious Surface Influences. Sci. Total Environ. 2021, 751, 142334. [Google Scholar] [CrossRef]
  8. Gonzalez-Trevizo, M.E.; Martinez-Torres, K.E.; Armendariz-Lopez, J.F.; Santamouris, M.; Bojorquez-Morales, G.; Luna-Leon, A. Research Trends on Environmental, Energy and Vulnerability Impacts of Urban Heat Islands: An Overview. Energy Build. 2021, 246, 111051. [Google Scholar] [CrossRef]
  9. Liu, H.; Ma, Z.; Li, M.; He, B. Examination and Evaluation of Urban Heat Island Effect Based on Satellite Remote Sensing: Taking Wuhan as an Example. J. Hum. Settl. West China 2023, 38, 38–45. [Google Scholar] [CrossRef]
  10. Wong, K.V.; Paddon, A.; Jimenez, A. Review of World Urban Heat Islands: Many Linked to Increased Mortality. J. Energy Resour. Technol. 2013, 135, 022101. [Google Scholar] [CrossRef]
  11. Yang, G.; Ren, G.; Zhang, P.; Xue, X.; Tysa, S.K.; Jia, W.; Qin, Y.; Zheng, X.; Zhang, S. PM2.5 Influence on Urban Heat Island (UHI) Effect in Beijing and the Possible Mechanisms. J. Geophys. Res. Atmos. 2021, 126, e2021JD035227. [Google Scholar] [CrossRef]
  12. Yin, Y.; Zhang, H.; An, H.; Lei, J.; Li, M.; Song, J.; Han, W. Heat Island Characteristics and Influencing Factors of Urban Ag- Glomerations in the Yangtze River Economic Zone Based on GEE. Chin. J. Ecol. 2023, 42, 160–169. [Google Scholar] [CrossRef]
  13. Qiao, Z.; He, T.; Lu, Y.; Sun, Z.; Xu, X.; Yang, J. Quantifying the Contribution of Land Use Change Based on the Effects of Global Climate Change and Human Activities on Urban Thermal Environment in the Beijing-Tianjin-Hebei Urban Agglomeration. Geogr. Res. 2022, 41, 1932–1947. [Google Scholar] [CrossRef]
  14. Mo, N. Positive Discourse Analysis under the Appraisal Theory—A Case Study of the White Paper “China ’s Policies and Actions on Climate Change”. Overseas Engl. 2023, 9, 82–85. [Google Scholar]
  15. Zhang, J. 8 Departments Issued the Notice on Deepening the Pilot Construction of Climate-Resilient Cities. Urban Rural Dev. 2023, 17, 11–12. [Google Scholar]
  16. Wu, J. We Should Practice the Important Concept of “People ’s City” and Promote the Construction of Climate-Adaptive Cities. Explor. Free Views 2022, 12, 5–8. [Google Scholar]
  17. Li, Y.; Li, Y.; Zhao, J. A Comparative Study of Atmospheric and Surface Urban Heat Island Effects in China’s Major Cities. Clim. Chang. Res. 2023, 19, 605–615. [Google Scholar]
  18. Zhou, D.; Xiao, J.; Bonafoni, S.; Berger, C.; Deilami, K.; Zhou, Y.; Frolking, S.; Yao, R.; Qiao, Z.; Sobrino, J.A. Sobrino Satellite Remote Sensing of Surface Urban Heat Islands: Progress, Challenges, and Perspectives. Remote Sens. 2018, 11, 48. [Google Scholar] [CrossRef]
  19. Ma, M.; Cheng, Y.; Chen, C. Study on Urbanization and Urban Heat Island of TypicalUrban Agglomerations in China Based on Remote Sensing. J. Gansu Sci. 2021, 33, 86–91. [Google Scholar] [CrossRef]
  20. Cao, G.; Jin, C.; Zhang, Z.; Hou, M. Analysis of the Impact of High Temperature Heat Wave on Thecharacteristics of Urban Heat Island Change in Dalian City. J. Hebei Acad. Sci. 2024, 41, 11–20. [Google Scholar] [CrossRef]
  21. Liu, Y.; Fang, X.; Xu, Y.; Zhang, S.; Luan, Q. Assessment of Surface Urban Heat Island across China’s Three Main Urban Agglomerations. Theor. Appl. Climatol. 2018, 133, 473–488. [Google Scholar] [CrossRef]
  22. Wang, M.; Xu, H. A Comparative Study on the Changes in Heat Island Effect in Chinese and Foreign Megacities. Remote Sens. Nat. Resour. 2021, 33, 200–208. [Google Scholar] [CrossRef]
  23. Duan, J. Analysis of SUHI Spatial Differences and Urban Planning Response in Xi’an and Nanjing Based on LCZ. Master’s Thesis, Northwest A&F University, Xi’an, China, 2024. [Google Scholar]
  24. Cheval, S.; Amihăesei, V.-A.; Chitu, Z.; Dumitrescu, A.; Falcescu, V.; Irașoc, A.; Micu, D.M.; Mihulet, E.; Ontel, I.; Paraschiv, M.-G.; et al. A Systematic Review of Urban Heat Island and Heat Waves Research (1991–2022). Clim. Risk Manag. 2024, 44, 100603. [Google Scholar] [CrossRef]
  25. Jiang, T.; Yang, C.; Liao, W.; Hu, L.; Liu, H.; Ren, B.; Li, X. Path Analysis of the Urban Greenspace Landscape Pattern Impacts on Land Surface Temperature: A Case Study in Changsha. Ecol. Environ. Sci. 2023, 32, 18–25. [Google Scholar] [CrossRef]
  26. Liu, M.; Liu, X.; Zhang, B.; Li, Y.; Luo, T.; Liu, Q. Analysis of the Evolution of Urban Nighttime Light Environment Based on Time Series. Sustain. Cities Soc. 2022, 78, 103660. [Google Scholar] [CrossRef]
  27. Gorelick, N.; Hancher, M.; Dixon, M.; Ilyushchenko, S.; Thau, D.; Moore, R. Google Earth Engine: Planetary-Scale Geospatial Analysis for Everyone. Remote Sens. Environ. 2017, 202, 18–27. [Google Scholar] [CrossRef]
  28. Benedetti, Y.; Callaghan, C.T.; Ulbrichová, I.; Galanaki, A.; Kominos, T.; Abou Zeid, F.; Ibáñez-Álamo, J.D.; Suhonen, J.; Díaz, M.; Markó, G.; et al. EVI and NDVI as Proxies for Multifaceted Avian Diversity in Urban Areas. Ecol. Appl. 2023, 33, e2808. [Google Scholar] [CrossRef]
  29. He, Z.; Zhang, D.; Ye, Q.; Chen, Z.; Yang, S.; Gao, Y. Characteristics of Urban Heat Island in Chongqing in Recent 40 Years and Its Association with Weather Conditions. J. Arid Meteorol. 2022, 40, 683–689. [Google Scholar] [CrossRef]
  30. Hu, L.; Xie, Y.; Cui, S.; Zhou, P.; Li, Y.; Sun, S. The Characteristics and Driving Forces of Summer Urban Heat Island in Guanzhong Plain Urban Agglomeration. China Environ. Sci. 2021, 41, 3842–3852. [Google Scholar] [CrossRef]
  31. Zhao, A.; Pei, T.; Cao, S.; Zhang, A.; Fan, Q.; Wang, J. Impacts of Urbanization on Vegetation Growth and Surface Urban Heat Island Intensity in the Beijing-Tianjin-Hebei. China Environ. Sci. 2020, 40, 1825–1833. [Google Scholar] [CrossRef]
  32. Gan, R.; Zhang, Y.; Shi, H.; Yang, Y.; Eamus, D.; Cheng, L.; Chiew, F.H.S.; Yu, Q. Use of Satellite Leaf Area Index Estimating Evapotranspiration and Gross Assimilation for Australian Ecosystems. Ecohydrology 2018, 11, e1974. [Google Scholar] [CrossRef]
  33. Zhang, Y.; Kong, D.; Gan, R.; Chiew, F.H.S.; McVicar, T.R.; Zhang, Q.; Yang, Y. Coupled Estimation of 500 m and 8-Day Resolution Global Evapotranspiration and Gross Primary Production in 2002–2017. Remote Sens. Environ. 2019, 222, 165–182. [Google Scholar] [CrossRef]
  34. Qin, R.; Zhao, Z.; Xu, J.; Ye, J.-S.; Li, F.-M.; Zhang, F. HRLT: A High-Resolution (1 d, 1 Km) and Long-Term (1961–2019) Gridded Dataset for Surface Temperature and Precipitation across China. Earth Syst. Sci. Data 2022, 14, 4793–4810. [Google Scholar] [CrossRef]
  35. Yang, J.; Huang, X. The 30 m Annual Land Cover Dataset and Its Dynamics in China from 1990 to 2019. Earth Syst. Sci. Data 2021, 13, 3907–3925. [Google Scholar] [CrossRef]
  36. Martin, P.; Baudouin, Y.; Gachon, P. An Alternative Method to Characterize the Surface Urban Heat Island. Int. J. Biometeorol. 2015, 59, 849–861. [Google Scholar] [CrossRef] [PubMed]
  37. Haashemi, S.; Weng, Q.; Darvishi, A.; Alavipanah, S. Seasonal Variations of the Surface Urban Heat Island in a Semi-Arid City. Remote Sens. 2016, 8, 352. [Google Scholar] [CrossRef]
  38. Tang, G.; Ren, G.; Zhou, J. Change of Urban Heat Island Intensity and Its Effect on Surface MeanAir Temperature Records in Southwest China. J. Appl. Meteorol. Sci. 2008, 19, 722–730. [Google Scholar]
  39. Liu, Y.; Luan, Q.; Quan, W.; Zhang, S. Research on Heat Environment of Beijing-Tianjin-Tangshan Urban GroupBased on Multisource Satellite Data. Ecol. Environ. Sci. 2015, 24, 1150–1158. [Google Scholar] [CrossRef]
  40. Meng, F.; Ren, G.; Guo, J.; Zhang, L.; Zhang, R. Impact of Urban Heat Island Effect on the Heating and Cooling Loads of Residential Buildings in Tianjin City, China. Prog. Geogr. 2020, 39, 1296–1307. [Google Scholar] [CrossRef]
  41. Li, K.; Chen, Y.; Wang, M.; Gong, A. Spatial-Temporal Variations of Surface Urban Heat Island Intensity Induced by Different Definitions of Rural Extents in China. Sci. Total Environ. 2019, 669, 229–247. [Google Scholar] [CrossRef]
  42. Liu, Y.; Fang, X.; Shuo, S.; Luan, Q.; Quan, W. Research on Quantitative Evaluations of Heat Islands for the Beijing-Tianjin-Hebei Urban Agglomeration. Acta Ecol. Sin. 2017, 37, 5818–5835. [Google Scholar] [CrossRef]
  43. Liao, S.; Cai, H.; Tian, P.; Zhang, B.; Li, Y. Combined Impacts of the Abnormal and Urban Heat Island Effect in Guiyang, a Typical Karst Mountain City in China. Urban Clim. 2022, 41, 101014. [Google Scholar] [CrossRef]
  44. Qiao, Z.; Huang, N.; Xu, X.; Sun, Z.; Wu, C.; Yang, J. Spatio-Temporal Pattern and Evolution of the Urban Thermallandscape in Metropolitan Beijing between 2003 and 2017. Acta Geogr. Sin. 2019, 74, 475–489. [Google Scholar]
  45. Wang, Y.; Ren, Y.; Song, L.; Xiang, Y. Responses of Extreme High Temperatures to Urbanization in the Beijing–Tianjin–Hebei Urban Agglomeration in the Context of a Changing Climate. Meteorol. Appl. 2021, 28, e2024. [Google Scholar] [CrossRef]
  46. Chen, S.; Wang, T. Comparision Analyses of Equal Interval Method and Mean-Standard Deviation Method Used to Dalian Itate Urban Heat Island. J. Geo-Inf. Sci. 2009, 11, 145–150. [Google Scholar]
  47. Ye, C.; Liu, Y.; Liu, W.; Liu, C.; Quan, W. Research on Urban Surface Heat Envronnent Monitoring Indexes and Its Application. Meteorol. Sci. Technol. 2011, 39, 95–101. [Google Scholar] [CrossRef]
  48. Yang, Y.; Liu, Y.; Li, Y.; Du, G. Quantifying Spatio-Temporal Patterns of Urban Expansion in Beijing during 1985–2013 with Rural-Urban Development Transformation. Land Use Policy 2018, 74, 220–230. [Google Scholar] [CrossRef]
  49. Su, M.; Zou, W.; Zhao, B.; Fan, W. The Impact of High-Speed Railways on Urban Spatial Evolution: A Case Study of China’s Coastal Areas. Appl. Geogr. 2025, 175, 103504. [Google Scholar] [CrossRef]
  50. Sun, L.; Hou, X.; Yang, L. Study on the Dynamic Evolution and Driving Forces of High-Quality Development of Coal Cities in China. Sustainability 2025, 17, 1707. [Google Scholar] [CrossRef]
  51. Li, Z.; Luan, W.; Zhang, Z.; Su, M. Relationship between Urban Construction Land Expansion and Population/Economic Growth in Liaoning Province, China. Land Use Policy 2020, 99, 105022. [Google Scholar] [CrossRef]
  52. Mao, H.; Jia, K.; Gao, X.; Zhang, J. Spatiotemporal Pattern of Land Use Change in Yinchuan Plain from 1980 to 2018. Sci. Technol. Eng. 2020, 20, 8008–8018. [Google Scholar]
  53. Huang, B.; Wu, B.; Barry, M. Geographically and Temporally Weighted Regression for Modeling Spatio-Temporal Variation in House Prices. Int. J. Geogr. Inf. Sci. 2010, 24, 383–401. [Google Scholar] [CrossRef]
  54. Ge, L.; Zhao, Y.; Sheng, Z.; Wang, N.; Zhou, K.; Mu, X.; Guo, L.; Wang, T.; Yang, Z.; Huo, X. Construction of a Seasonal Difference-Geographically and Temporally Weighted Regression (SD-GTWR) Model and Comparative Analysis with GWR-Based Models for Hemorrhagic Fever with Renal Syndrome (HFRS) in Hubei Province (China). Int. J. Environ. Res. Public. Health 2016, 13, 1062. [Google Scholar] [CrossRef] [PubMed]
  55. Hu, J.; Zhang, J.; Li, Y. Exploring the Spatial and Temporal Driving Mechanisms of Landscape Patterns on Habitat Quality in a City Undergoing Rapid Urbanization Based on GTWR and MGWR: The Case of Nanjing, China. Ecol. Indic. 2022, 143, 109333. [Google Scholar] [CrossRef]
  56. Si, P.; Wang, M.; Li, M.; Wang, Y.; Guo, Y.; Yang, Y.; Wang, J. The Observed Features and Some Possible Reasons of Annual Temperature Extremes over Beijing-Tianjin-Hebei Region for a Century Long-term Based on Newly Constructed Daily Observations. Int. J. Climatol. 2023, 43, 4248–4268. [Google Scholar] [CrossRef]
  57. Min, S.-K. Human Influence Can Explain the Widespread Exceptional Warmth in 2023. Commun. Earth Environ. 2024, 5, 215. [Google Scholar] [CrossRef]
  58. Esper, J.; Torbenson, M.; Büntgen, U. 2023 Summer Warmth Unparalleled over the Past 2,000 Years. Nature 2024, 631, 94–97. [Google Scholar] [CrossRef]
  59. Fernandes, R.G.; Leblanc, S. Parametric (Modified Least Squares) and Non-Parametric (Theil–Sen) Linear Regressions for Predicting Biophysical Parameters in the Presence of Measurement Errors. Remote Sens. Environ. 2005, 95, 303–316. [Google Scholar] [CrossRef]
  60. Peng, S.; Piao, S.; Ciais, P.; Friedlingstein, P.; Ottle, C.; Bréon, F.-M.; Nan, H.; Zhou, L.; Myneni, R.B. Surface Urban Heat Island Across 419 Global Big Cities. Environ. Sci. Technol. 2012, 46, 696–703. [Google Scholar] [CrossRef]
  61. Sheng, L.; Hao, L.; Cui, Y.; Li, P.; Xu, Y.; Liao, C. Influence of Urban Development on Surface Heat Island Effect and Its Relationship: A Case of Hefei and Nanchang. J. Atmos. Environ. 2023, 18, 602–616. [Google Scholar]
  62. Xu, H.; Zhao, G. Assessing the Value of Urban Green Infrastructure Ecosystem Services for High-Density Urban Management and Development: Case from the Capital Core Area of Beijing, China. Sustainability 2021, 13, 12115. [Google Scholar] [CrossRef]
  63. Costanzini, S.; Despini, F.; Beltrami, L.; Fabbi, S.; Muscio, A.; Teggi, S. Identification of SUHI in Urban Areas by Remote Sensing Data and Mitigation Hypothesis through Solar Reflective Materials. Atmosphere 2022, 13, 70. [Google Scholar] [CrossRef]
  64. Wong, M.S.; Nichol, J.E.; To, P.H.; Wang, J. A Simple Method for Designation of Urban Ventilation Corridors and Its Application to Urban Heat Island Analysis. Build. Environ. 2010, 45, 1880–1889. [Google Scholar] [CrossRef]
  65. Iungman Bensignor, T. Urban Heat Islands and Nature-Based Solutions: Insights into Health Impacts and Urban Planning Determinants. Ph.D. Thesis, Universitat Pompeu Fabra: Barcelona, Catalonia, Spain, 2024. [Google Scholar]
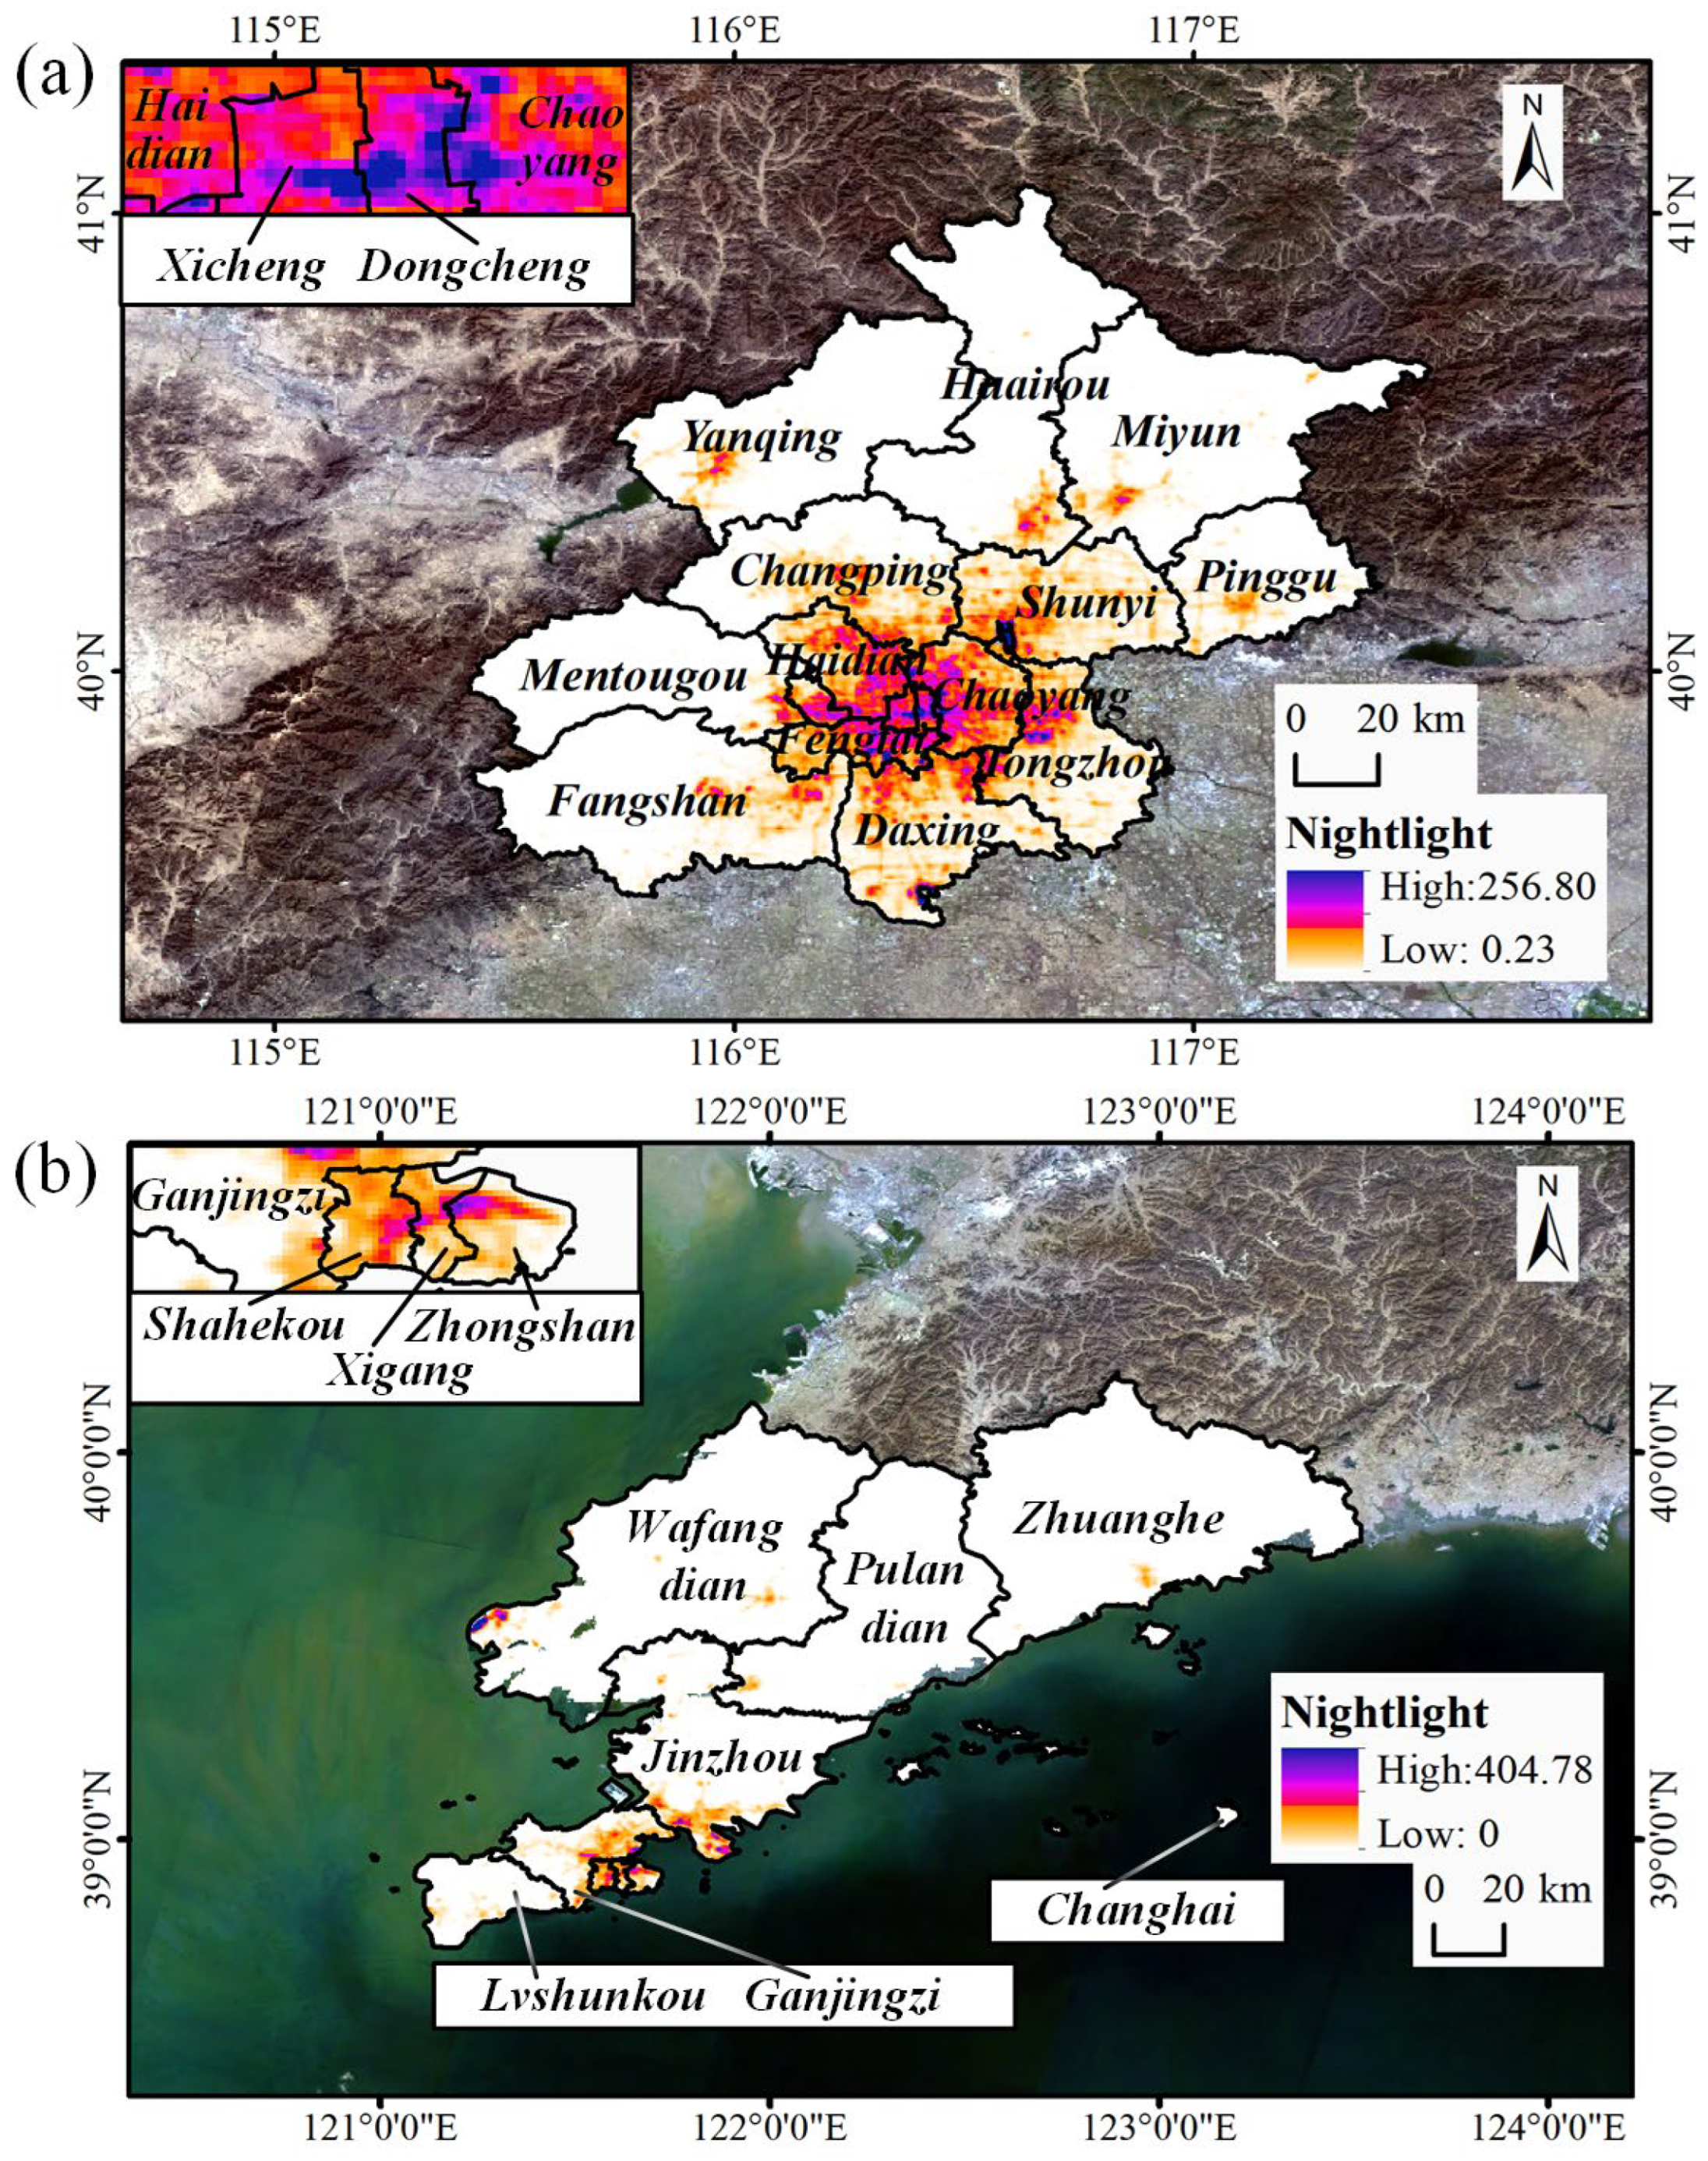
Figure 1. Map of night light in 2023: (a) Beijing, (b) Dalian.
Remotesensing 17 01793 g001
Figure 2. Methodological framework.
Remotesensing 17 01793 g002
Figure 3. Line chart of monthly LSTs in Beijing and Dalian.
Remotesensing 17 01793 g003
Figure 4. Normalized distribution map of monthly LSTs: (a) Beijing, (b) Dalian.
Remotesensing 17 01793 g004
Figure 5. Spatial distribution map of seasonal mean LSTs: (a) Beijing, (b) Dalian.
Remotesensing 17 01793 g005
Figure 6. Annual LST line charts for Beijing and Dalian: (a) daytime, (b) nighttime, (c) average daytime and nighttime.
Remotesensing 17 01793 g006aRemotesensing 17 01793 g006b
Figure 7. Annual LST anomalies in Beijing and Dalian.
Remotesensing 17 01793 g007
Figure 8. Spatial distribution map of annual LSTs: (a) Beijing, (b) Dalian.
Remotesensing 17 01793 g008
Figure 9. SUHIII line statistics for Beijing and Dalian: (a) daytime, (b) nighttime, (c) daytime and nighttime average.
Remotesensing 17 01793 g009
Figure 10. Annual SUHIII line charts for Beijing and Dalian: (a) daytime, (b) nighttime, (c) daytime and nighttime average.
Remotesensing 17 01793 g010
Figure 11. Distribution map of heat island types: (a) Beijing, (b) Dalian.
Remotesensing 17 01793 g011
Figure 12. Shift in center of gravity in heat island regions from 2003 to 2023: (a) Beijing, (b) Dalian.
Remotesensing 17 01793 g012
Figure 13. Sankey map of the transfer of heat island types from 2003 to 2023: (a) Beijing, (b) Dalian.
Remotesensing 17 01793 g013
Figure 14. Spatial distribution map of TEMP and SUHIII regression coefficients: (a) Beijing, (b) Dalian.
Remotesensing 17 01793 g014
Figure 15. Spatial distribution map of PREP and SUHIII regression coefficients: (a) Beijing, (b) Dalian.
Remotesensing 17 01793 g015
Figure 16. Spatial distribution map of impervious surfaces: (a) Beijing, (b) Dalian.
Remotesensing 17 01793 g016
Figure 17. Spatial distribution map of POP and SUHIII regression coefficients: (a) Beijing, (b) Dalian.
Remotesensing 17 01793 g017
Figure 18. Spatial distribution map of EVI and SUHIII regression coefficients: (a) Beijing; (b) Dalian.
Remotesensing 17 01793 g018
Figure 19. Spatial distribution map of ET and SUHIII regression coefficients: (a) Beijing; (b) Dalian.
Remotesensing 17 01793 g019
Figure 20. Analysis of LST trends from 2003 to 2023: (a) Beijing; (b) Dalian.
Remotesensing 17 01793 g020
Table 1. Dataset description of delineation of rural background regions and driving factor analysis of SUHIII.
Corresponding VariableDataResolutionBandYear
ElevationCGIAR/SRTM90_V490 mElevation2000
NDVIMODIS/061/MOD13A21000 mNDVI, Detailed QA2003–2023 year by year
Cultivation areaMODIS/006/MCD12Q1500 mLC_Type1, QC2003–2020 year by year
NightlightNOAA/DMSP-OLS/NIGHTTIME_LIGHTS927.67 mstable_lights2003–2012 year by year
NightlightNOAA/VIIRS/001/VNP46A2500 mGap_Filled_DNB_BRDF_Corrected_NTL2013–2023 year by year
ETCAS/IGSNRR/PML500 mEc, Es, Ei, ET_water2003, 2008, 2013, 2018
POPLandScan Global1000 m/2003, 2008, 2013, 2018
EVIMODIS/061/MOD13A21000 mEVI2003, 2008, 2013, 2018
TEMP and PREPHRLT1000 mMaxtmp, prep2003, 2008, 2013, 2018
Impervious surfaceCLCD30 mImpervious surface2003, 2008, 2013, 2018
Table 2. Seasonal LSTs in Beijing and Dalian.
Beijing LSTs (°C)Dalian LSTs (°C)
Spring 15.28 13.05
Summer25.12 23.90
Autumn11.77 11.67
Winter0.54 0.77
Mean13.18 12.35
Standard Deviation10.15 9.46
Table 3. Mean regression coefficients of each driving factor and SUHIII.
2003200820132018
Beijing TEMP0.850.890.860.75
Dalian TEMP2.152.282.382.48
Beijing PREP1.341.07−0.06−0.23
Dalian PREP−0.62−0.270.000.20
Beijing POP0.080.03−0.01−0.04
Dalian POP0.010.010.010.01
Beijing EVI−11.46−12.38−14.33−17.89
Dalian EVI−7.74−9.15−10.04−10.56
Beijing ET−1.41−1.25−0.150.40
Dalian ET1.891.691.341.05
Table 4. Table of ET and SUHIII values for Beijing and Dalian.
YearBeijing ET
(mm/d)
Beijing SUHIII
(°C)
Dalian ET
(mm/d)
Dalian SUHIII
(°C)
20031.381.341.460.70
20081.481.591.400.93
20131.411.501.470.45
20181.311.561.261.21
Disclaimer/Publisher’s Note: The statements, opinions and data contained in all publications are solely those of the individual author(s) and contributor(s) and not of MDPI and/or the editor(s). MDPI and/or the editor(s) disclaim responsibility for any injury to people or property resulting from any ideas, methods, instructions or products referred to in the content.