Article

Research on the Response Mechanism of Vegetation to Drought Stress in the West Liao River Basin, China

1
State Key Laboratory of Earth Surface Processes and Hazards Risk Governance, Faculty of Geographical Science, Beijing Normal University, Beijing 100875, China
2
Hohhot Natural Resources Bureau, Hohhot 010000, China
*
Author to whom correspondence should be addressed.
Remote Sens. 2025, 17(10), 1780; https://doi.org/10.3390/rs17101780
Submission received: 22 March 2025 / Revised: 16 May 2025 / Accepted: 16 May 2025 / Published: 20 May 2025

Abstract

:
Understanding vegetation’s drought response helps predict ecosystem adaptations to climate change and offers scientific insights for managing extreme climate events. Using RS technology, this study systematically investigates the response mechanisms of vegetation to drought and their spatiotemporal variations in the ecologically sensitive semi-arid area and the national grain security zone—West Liao River Basin, China. The findings reveal that (1) from 2000 to 2018, NDVI exhibited a fluctuating upward trend, and drought trends remained pronounced in certain areas and seasons; (2) growing-season droughts impaired productivity, while winter droughts reduced soil moisture, with arid-zone vegetation being most vulnerable; (3) grasslands responded rapidly to drought, forests slowly via deep roots, and croplands suffered most during critical growth phases; and (4) drought-adapted western forests/shrubs recovered best, while eastern croplands required targeted measures like resilient crops and water management. The results of this study not only provide a scientific basis for ecological management in the West Liao River Basin but also offer valuable insights for vegetation and water resource management in other arid and semi-arid regions globally. This research holds significant importance for addressing climate change and achieving regional sustainable development.

1. Introduction

Drought, a frequent global disaster with prolonged duration and extensive impacts, arises primarily from uneven precipitation distribution and imbalances between precipitation and evaporation [1]. Its extreme effects profoundly influence terrestrial ecosystems, with vegetation serving as a key indicator of environmental changes and a critical link in studying ecosystem–climate interactions. Recent studies emphasize vegetation’s adaptive strategies (e.g., hydraulic regulation, phenological shifts) under drought stress, which are critical for predicting ecosystem stability under climate change [2,3].
Drought is categorized into meteorological, agricultural, hydrological, and socioeconomic types, each affecting different systems [4]. Meteorological drought, caused by a prolonged precipitation–evaporation imbalance, can last months or years. Agricultural drought affects plant functionality due to water imbalance, while hydrological drought involves water bodies failing to meet demand. Socioeconomic drought impacts industrial, agricultural, and domestic activities, disrupting water supply and demand. These drought types are interrelated, with meteorological drought often preceding others [5]. Recent work highlights compound droughts (e.g., concurrent meteorological and agricultural droughts), which exacerbate vegetation vulnerability. For example, Liu et al. [6] indicated that concurrent soil and atmospheric droughts amplify vegetation stress globally.
Drought significantly impacts vegetation by reducing photosynthesis, altering coverage, and decreasing productivity, which, in turn, affects hydrological cycles, carbon balance, and ecosystem structure [7,8,9]. Vegetation’s stability under drought is assessed by resistance and resilience [10]. Vegetation resistance measures a plant community’s ability to maintain function during drought. Vegetation resilience determines how quickly vegetation recovers after drought ends [11]. Vegetation resistance is influenced by various adaptive mechanisms, such as deep-rooting systems in temperate oak forests (Quercus spp.) and stomatal regulation to minimize water loss [12]. In contrast, resilience is shaped by drought legacy effects—repeated droughts can weaken recovery capacity, though grasslands generally rebound faster than forests due to their shorter life cycles and simpler structure [13].
Drought’s impact varies by vegetation type, climate zone, timing, intensity, and duration [14]. For instance, arid-zone vegetation is more sensitive to short-term drought than humid-zone vegetation, while semi-arid and semi-humid vegetation shows greater resistance and adaptability [15]. Forests in temperate regions exhibit high resistance, whereas those in arid regions have higher resilience but inconsistent resistance patterns [16]. Grasslands recover quickly post-drought due to their simple structure and lower productivity [17]. Drought timing and duration also significantly affect vegetation, with growing season droughts being particularly impactful [18].
Most studies focus on single time scales (e.g., monthly or seasonal drought impacts), lacking long-term (20-year) spatiotemporal trend analysis of vegetation responses to drought across different time scales (short-term, medium-term, long-term, seasonal, and one-year-lagged effects), particularly continuous monitoring in ecologically sensitive semi-arid agro-pastoral transition zones. Furthermore, most studies assess either vegetation resistance (drought tolerance) or resilience (recovery capacity) separately, without integrating both to evaluate ecosystem stability under prolonged drought stress. To address these gaps, this study investigates vegetation responses to short-term (1 month), medium-term (6 months), long-term (one year), seasonal (spring, summer, autumn, and winter) and one-year-lagged drought in the ecologically vulnerable West Liao River Basin, specifically examining the resistance and resilience of vegetation under varying drought conditions.
The West Liao River system is mainly distributed in a semi-arid area of northeastern Inner Mongolia, with the Xar Moron River being the largest tributary and a vital water source for the Liao River. Different from other arid and semi-arid areas, this basin encompasses diverse landscapes, including mountains, rivers, forests, farmlands, and grasslands, and holds strategic significance in establishing northern China’s ecological security barrier. Over the past half-century, accelerated urbanization and agricultural development have led to frequent land reclamation and overgrazing, causing forest degradation and wetland shrinkage. The Horqin Sandy Land in the basin’s core, historically a lush wooded grassland, has become one of northern China’s largest dust sources due to combined climate change and human pressures. These negatively impacted local agriculture and pastoral production and made the basin one of the most ecologically fragile regions and a critical national grain security stabilization zone in Northeast China [19]. In this context, vegetation is highly sensitive to drought stress, significantly affecting its ecological functions and stability [20]. How the vegetation in such a specific area responds to seasonal and interannual droughts is still unclear. Understanding this problem supports sustainable vegetation management and provides scientific and policy insights for drought mitigation.

2. Materials and Methods
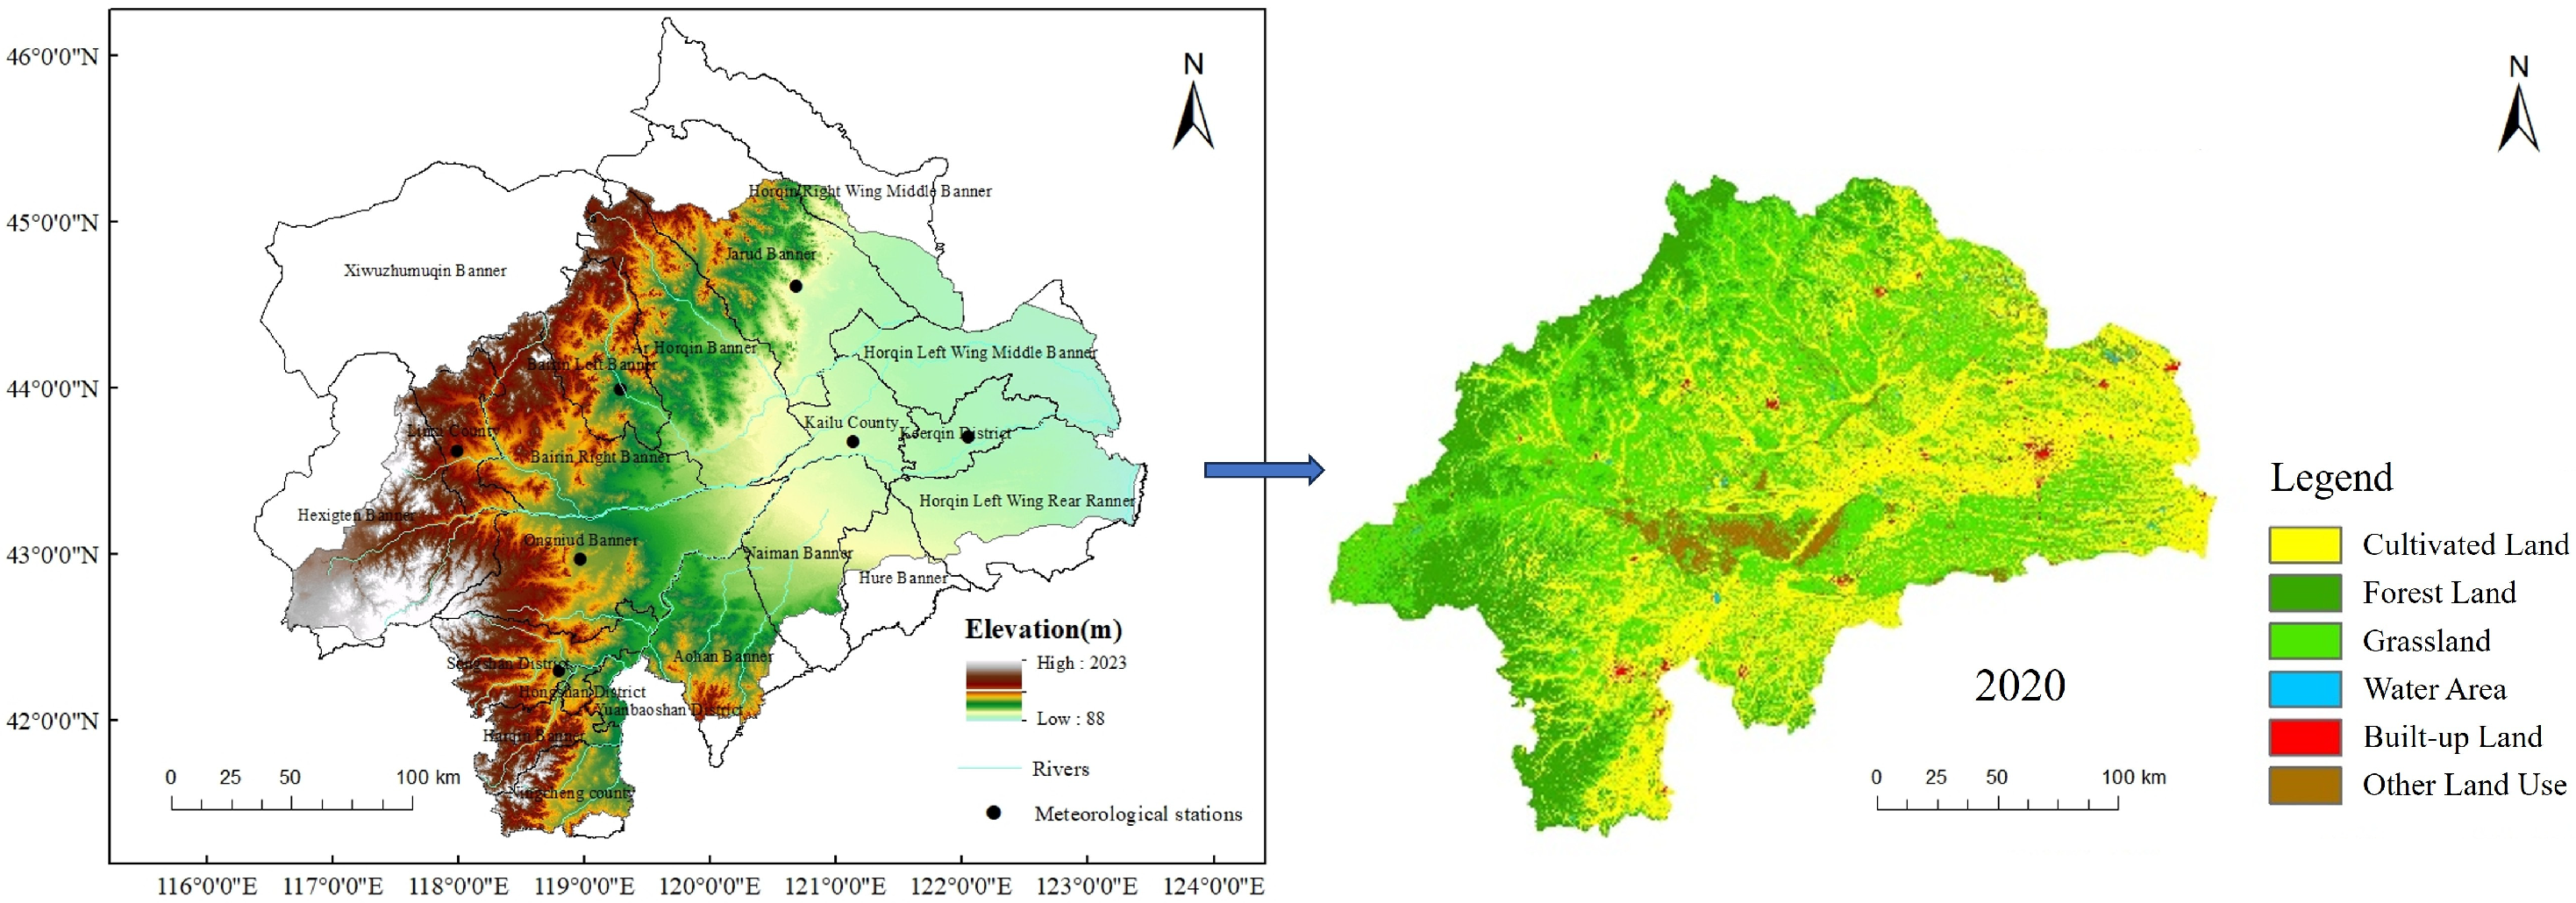
2.1. Study Area

The West Liao River Basin (Figure 1) is located in the eastern part of the farming–pastoral ecotone in northern China, spanning the borders of Inner Mongolia, Liaoning, Hebei, and Jilin provinces. Its geographical coordinates range from 116°36′ to 123°40′E and 41°18′ to 45°13′N, and it is situated in an arid to semi-arid region [21]. The area experiences a temperate continental monsoon climate with distinct seasons influenced by the Mongolian Plateau airflow, resulting in low annual precipitation, averaging 376 mm. The mean annual temperature ranges from 5.0 to 6.5 °C, with a notable drought intensity gradient [19]. During the growing season, the highest temperatures range from 22.1 to 28.3 °C, with average, maximum, and minimum temperatures and relative humidity showing a unimodal pattern from May to September [22]. The primary land cover types include cropland, forest, and grassland. Forests are concentrated in western/northwestern marginal areas; croplands are dominant in eastern, central-western, and southern regions; and grasslands are widely distributed across all zones, representing the largest area. The land cover area ranking (descending order) is as follows: grassland > cropland > forest > other land uses > built-up land > water bodies. Due to climatic constraints, the region practices single cropping, primarily cultivating soybeans, wheat, and corn [23].

2.2. Data Sources and Processing

This study utilized monthly vegetation index (NDVI) data derived from SPOT/VEGETATION NDVI satellite remote sensing data provided by the Resource and Environment Science Data Center of the Chinese Academy of Sciences. The dataset, generated using the Maximum Value Composite (MVC) method from 10-day composite data, offers 1 km resolution monthly NDVI data from 1998 to 2020 [24]. Additionally, annual NDVI raster data from 2000 to 2018, also at 1 km resolution, were obtained by calculating the mean of monthly NDVI values, representing the overall NDVI situation for the entire year. In order to avoid noise, particularly in arid or urbanized regions that have low NDVI values, an NDVI ≥ 0.1 mask was applied to filter out non-vegetation surfaces before analyses. To isolate true vegetation trends, land cover classification data were obtained from the Resource and Environment Science and Data Center of the Chinese Academy of Sciences (http://www.resdc.cn/, accessed on 18 May 2025) with a spatial resolution of 30 m. They were used to mask areas with significant underlying surface changes, which were then removed from the NDVI data. The land-use data were obtained from the 30 m resolution grid dataset publicly released by the Resource and Environment Science and Data Center (RESDC), Chinese Academy of Sciences (http://www.resdc.cn/, accessed on 18 May 2025).
SPEI data were obtained from the Figshare platform (https://doi.org/10.6084/m9.figshare.c.5823533, accessed on 18 May 2025), providing a high spatial resolution (0.1° × 0.1°) SPEI dataset for China from 1979 to 2018. To align with the NDVI data resolution, the SPEI data were resampled to 1 km resolution using ArcGIS10.8 software and classified into five types (Table 1). The data were processed as follows [25]: (1) the original geographic coordinate system WGS84 was projected into UTM zone to eliminate longitudinal distance distortion; (2) the value of each interpolated pixel was computed using a bilinear weighting scheme based on its four nearest neighboring pixels; and (3) the resampling factor was defined as the ratio of the original pixel size to the target pixel size. County-level administrative boundaries and river system data for the West Liao River Basin were sourced from the Resource and Environment Science Data Center, while DEM data were obtained from the Geospatial Data Cloud platform. These datasets provided essential geospatial information for the study.

2.3. Maximum Value Composite (MVC)

To minimize interference from atmospheric conditions, clouds, and solar zenith angle, this study employed the internationally recognized Maximum Value Composite (MVC) method [24], selecting the maximum NDVI value within each month as the monthly NDVI value. Additionally, the annual maximum NDVI values were calculated by the mean values of all the monthly NDVI data in a year.

2.4. Sen’s Trend Analysis and Mann–Kendall Test

Sen’s trend analysis, a robust non-parametric statistical method, is well suited for calculating trends in long-term time series data [26]. It is insensitive to measurement errors and outliers and does not require data to follow a normal distribution, making it advantageous for analyzing long-term vegetation trends [27]. Compared to linear regression, Sen’s method estimates trends by calculating the median of the series, providing a more accurate reflection of long-term vegetation changes. It is often combined with the Mann–Kendall test to assess the statistical significance of trends.
The Mann–Kendall test is a non-parametric trend analysis method that is widely used to detect long-term trends in environmental data (e.g., climate, hydrology, and SPEI drought index trend analysis). We chose to use the Mann–Kendall Test for the following reasons [28]: (1) it is directly based on data ranks, avoiding issues caused by skewed distributions common in environmental data (e.g., precipitation, SPEI), it is robust to outliers, and it does not assume normality; (2) it can mitigate the impact of serial autocorrelation on significance testing using the Hamed–Rao pre-whitening method (or similar corrections); and (3) the Mann–Kendall test determines the statistical significance of a trend. Sen′s slope estimates the magnitude and direction of the trend. It provides a comprehensive quantification of trends (significance, direction, and rate). The method was calculated in the pymannkendall module of Python 3.12.x. A statistical value of |Z| ≥ 1.96 indicates significance at the 95% confidence level.
This study applied Sen’s trend analysis to calculate NDVI trends in the West Liao River Basin from 2000 to 2018 and used the Mann–Kendall test to assess trend significance. The relevant formulas are as follows:
β = M e d i a n x j x i j i , 1 < i < j < n
In the formula, β represents the slope of NDVI changes over the years. A value of β > 0 indicates an upward trend in vegetation coverage, while β < 0 indicates a downward trend. Here, x j and x i denote the time series data, representing the NDVI values for the j-th and i-th years, respectively, and n represents the length of the time series.
p-value was used to assess the significance level [29,30]:
Hypotheses:
Null hypothesis (H0): Slope = 0 (no trend).
Alternative hypothesis (H1): Slope ≠ 0 (trend exists).
Decision Rule:
If p < significance level (e.g., 0.05), reject H0 and conclude the trend is statistically significant.
If p ≥ significance level (e.g., 0.05), fail to reject H0 and conclude no significant trend. The formula for calculating the statistical measure S in the Mann–Kendall trend test is as follows:
S = i = 1 n 1 j = i + 1 n s g n ( x j x i )
where s g n ( x j x i ) is the sign function, defined as
s g n x j x i = 1 , x j x i > 0 0 , x j x i = 0 1 , x j x i < 0
The test statistic S is calculated using Formula (2). The Trend Determination Criteria are as follows [31]:
When n < 10:
If S > 0, the sequence is considered to exhibit an upward trend.
If S = 0, there is no significant trend.
If S < 0, the sequence is considered to exhibit a downward trend.
When n ≥ 10:
The statistic S approximately follows a normal distribution.
Var(S) is the variance of the statistic S, calculated using Formula (4). The test statistic Z is calculated using Formula (5). In this study, the time series length is 19 years (2000–2018), and the test statistic Z is used for trend testing.
V a r S = n n 1 2 n + 5 i = 1 n t ( i 1 ) ( 2 i + 5 ) 18
The formula for calculating the standardized statistic Z is as follows:
Z = S 1 V a r ( S ) , S > 0   0                             , S = 0 S + 1 V a r ( S ) , S < 0
At a given significance level α, if ∣Z∣ > z(1 − α/2), the null hypothesis (no trend) is rejected, indicating a statistically significant trend. Here, z(1 − α/2) is the critical value from the standard normal distribution at confidence level α. The critical values for significance are as follows:
Z∣ ≥ 1.65: Trend passes the significance test at 90% confidence (α = 0.10).
Z∣ ≥ 1.96: Trend passes the significance test at 95% confidence (α = 0.05).
Z∣ ≥ 2.58: Trend passes the significance test at 99% confidence (α = 0.01).

2.5. Pearson Correlation Analysis

To quantitatively analyze the pixel-by-pixel correlation between NDVI and SPEI in the West Liao River Basin, this study employed Pearson correlation analysis to reflect the sensitivity of NDVI changes to drought. The Pearson correlation coefficient ranges from [−1, 1], where −1 indicates a perfect negative correlation, 1 indicates a perfect positive correlation, and 0 indicates no correlation. A significance level of α = 0.05 was used to assess the statistical significance of the correlations.
To further analyze the seasonal response characteristics of NDVI to SPEI, the study divided the time period into four seasons: spring (March–May), summer (June–August), autumn (September–November), and winter (December–February). Seasonal NDVIs were correlated with seasonal SPEIs (for example, spring NDVI—spring SPEI) to reveal seasonal differences in vegetation responses to drought. We also analyzed the correlation coefficients between NDVI and SPEI at time scales of one month and six months. To examine vegetation′s lagged response to drought, we analyzed correlations between NDVI (2001–2018) and one-year-lagged SPEI (2000–2017), where SPEI(t1) corresponds to NDVI(t). The formula for the Pearson correlation coefficient is as follows:
p x y = c o v ( x , y ) σ x σ y
In the formula, the numerator represents the covariance of the two variables, and the denominator represents the product of the standard deviations of the two variables.

2.6. Vegetation Resistance and Resilience

The formulas for assessing vegetation resistance and resilience are as follows [32,33]:
R = Y N D V I D N D V I Y N D V I
Q = M N D V I N D V I ¯
where R is the resistance index; Y N D V I is the mean NDVI of non-drought years; D N D V I is the NDVI of drought years; Q is the resilience index; M N D V I is the NDVI of the most severe drought year; and N D V I ¯ is the mean NDVI of all years.

3. Results

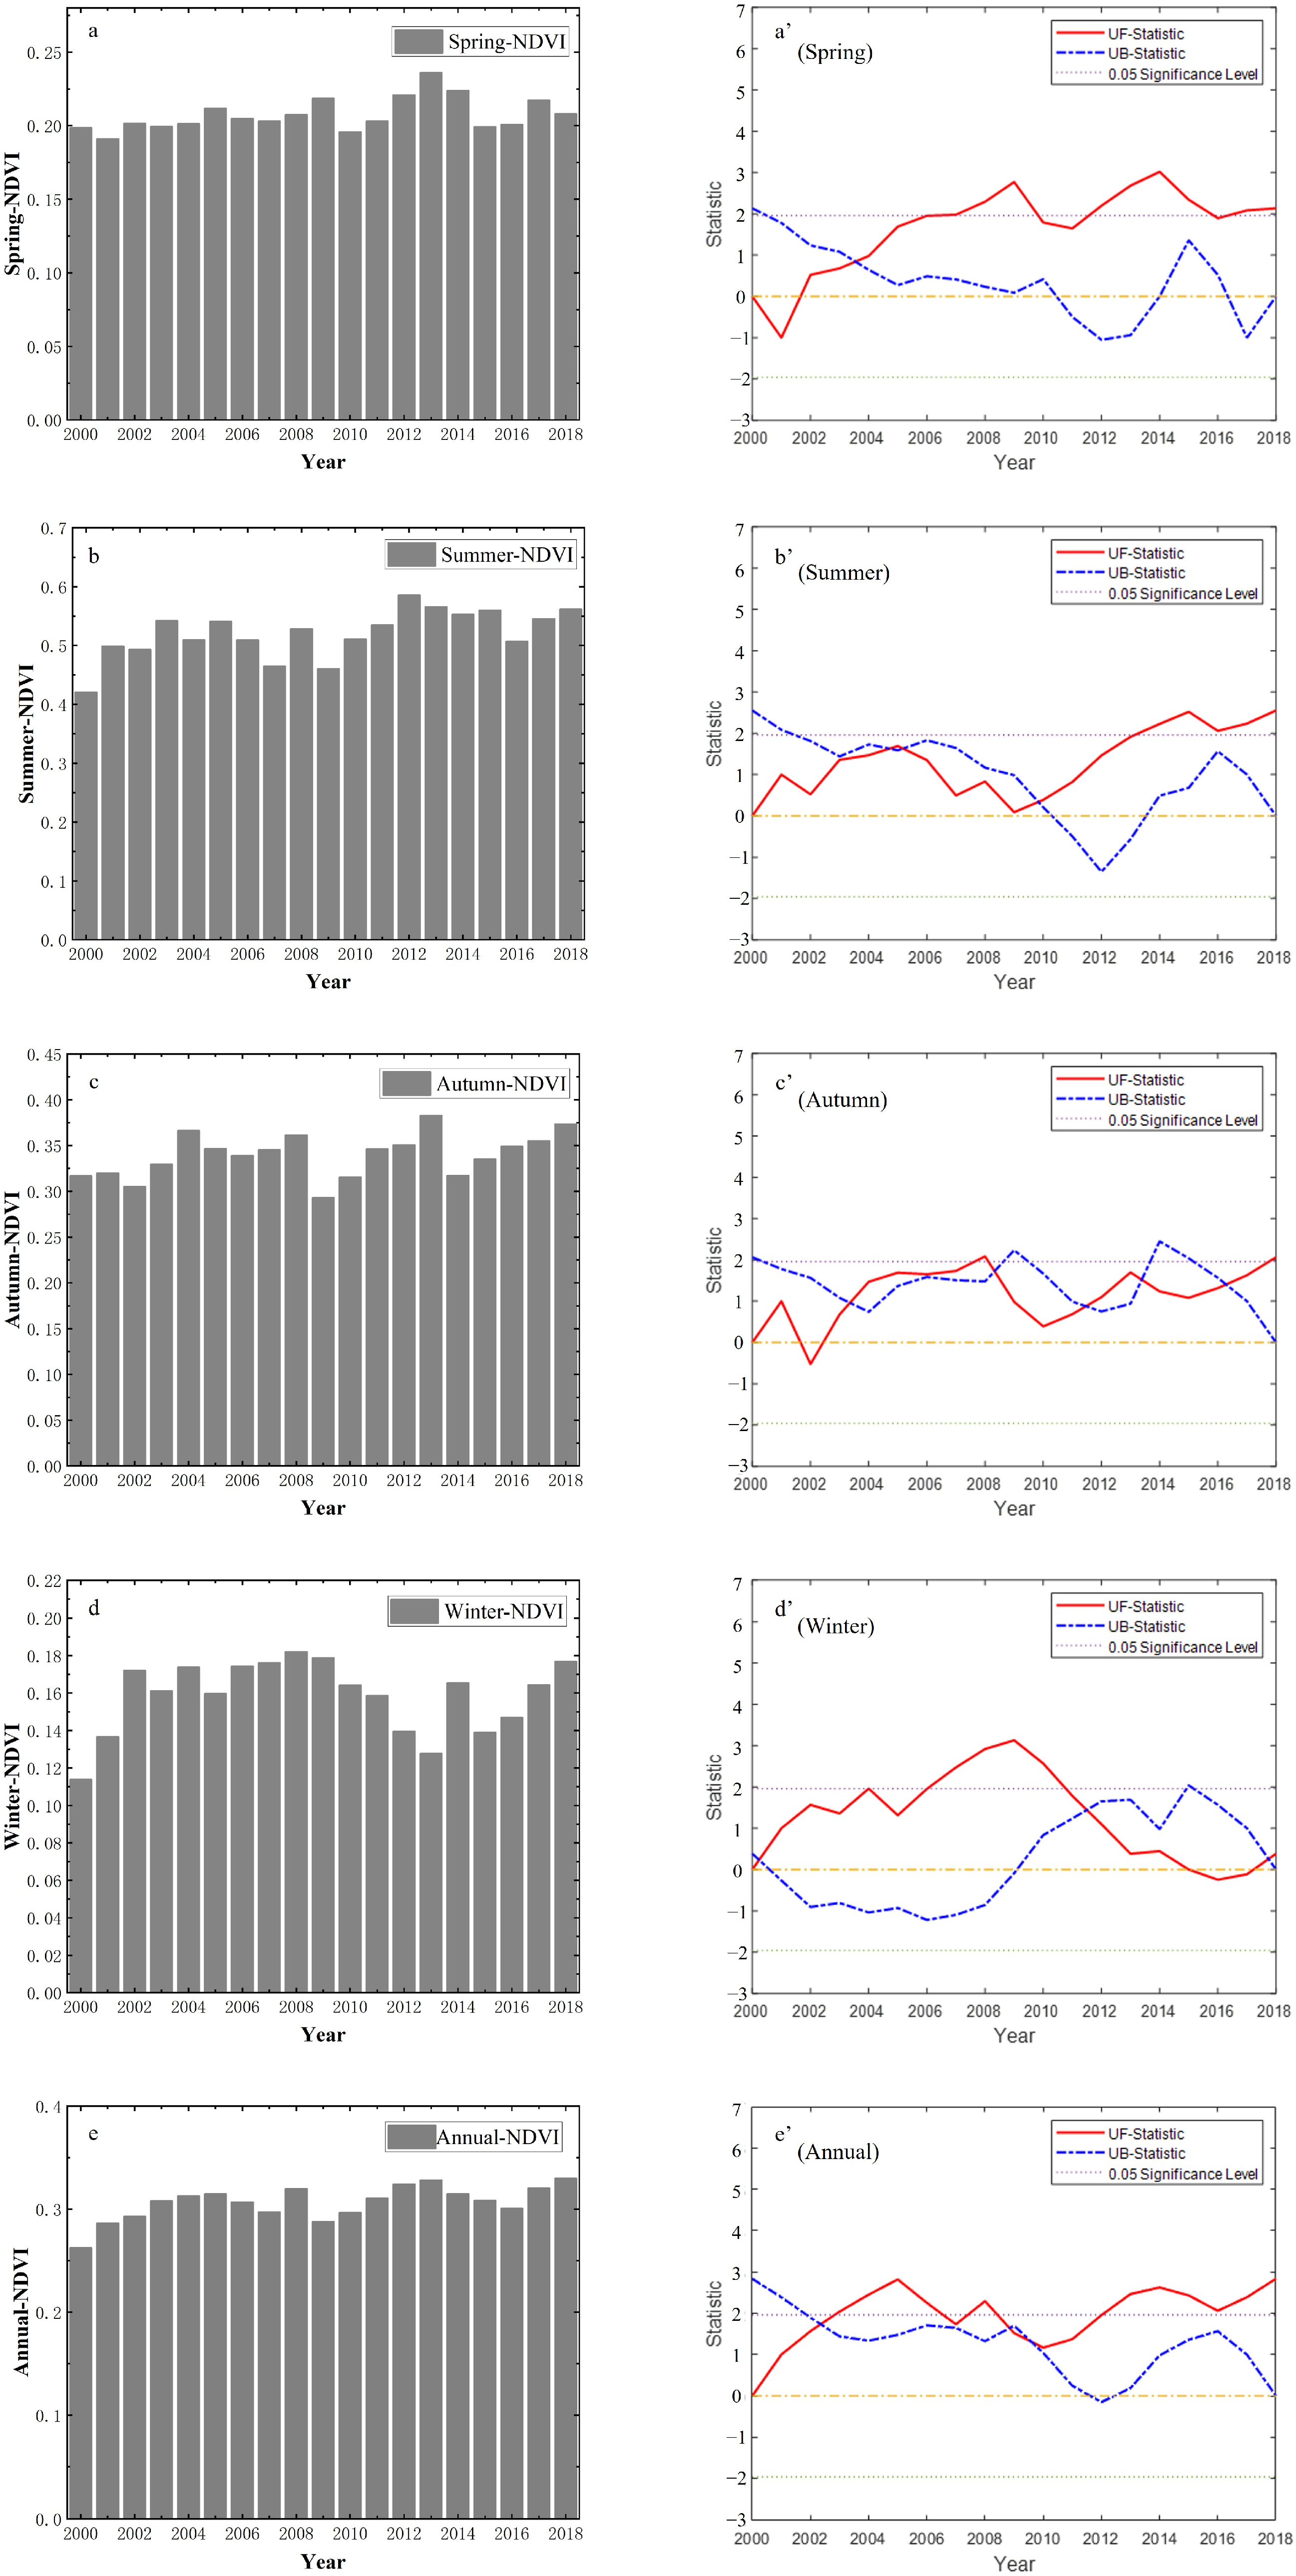
3.1. Temporal Variation Trends of NDVI

Figure 2 and Table 2 illustrate the interannual and seasonal variations of NDVI from 2000 to 2018, alongside results from Sen′s trend analysis and Mann–Kendall tests. Overall, NDVI exhibited a fluctuating upward trend, with a Sen slope of 0.00179/year, insignificant at p < 0.05, ranging between 0.26 and 0.33, peaking in 2018, and bottoming in 2000. Seasonally, spring, summer, and autumn NDVI showed fluctuating increases, with Sen slopes of 0.00998, 0.00420, and 0.00208 per year, respectively, all significant except for winter (Figure 2a–d). Winter NDVI remained stable, with a slope of 0.00022/year. Specific ranges and peak years varied by season, highlighting distinct seasonal vegetation responses.
Mann–Kendall tests revealed multiple intersection points within confidence intervals, indicating significant trend shifts across seasons and years. Notably, spring NDVI shifted positively in 2004 (Figure 2a’), summer trends showed significant changes around 2005 and 2010 (Figure 2b’), autumn experienced shifts in multiple years (Figure 2c’), and winter transitioned from a declining to an increasing trend post-2009 (Figure 2d’). Annual NDVI trends also demonstrated significant upward shifts in several years (Figure 2e’).
In summary, the West Liao River Basin′s NDVI displayed an overall upward trend from 2000 to 2018 with distinct seasonal vegetation dynamics, underscoring the complex interplay between vegetation and climatic changes.

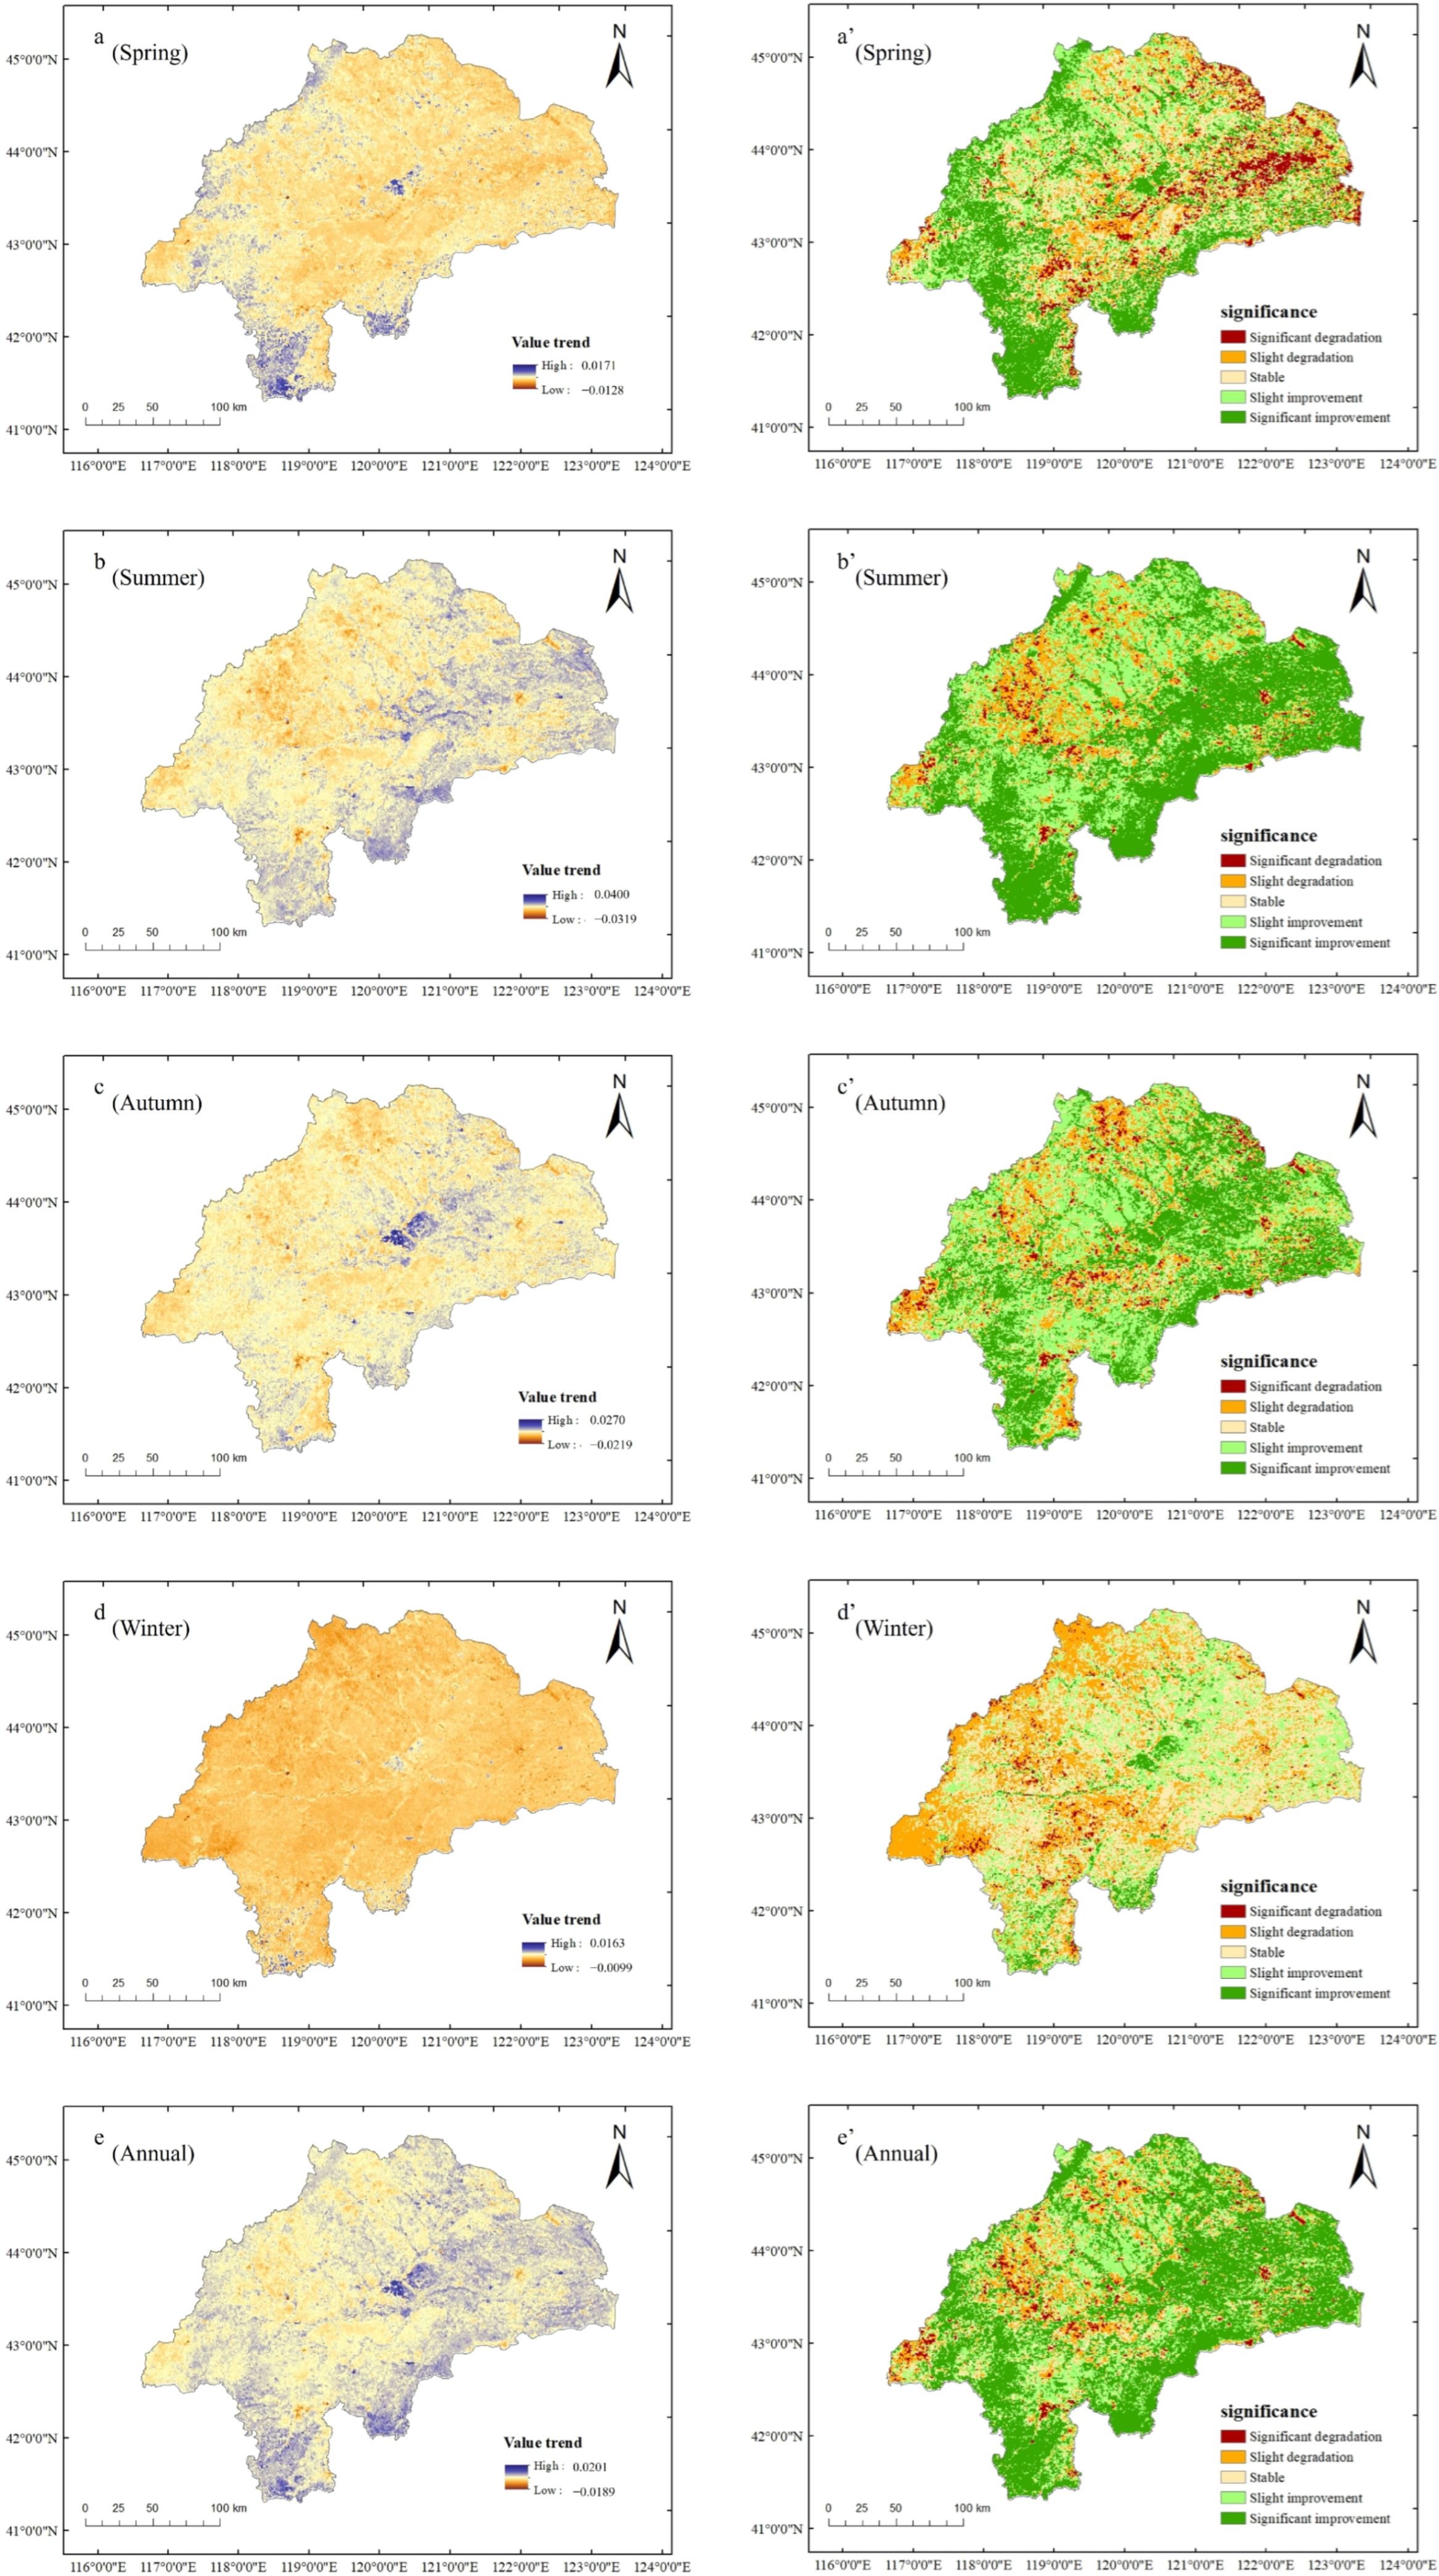
3.2. Spatial Variation Trends of NDVI

The spatial distribution of annual and seasonal NDVI trends from 2000 to 2018 is depicted in Figure 3. Spring NDVI trends exhibited significant regional differences, with vegetation improvement in the southwest and degradation in parts of the central and eastern areas (Figure 3a,a’). Improvement zones covered 51% of the area, including 29% with significant and 22% with slight improvement.
Summer trends showed widespread vegetation improvement, particularly in the east and south, with some central areas degrading (Figure 3b,b’). Improvement zones accounted for 74% of the area, with 43% significant and 31% slight improvement. Autumn trends mirrored summer, with broad improvement but scattered degradation in the north and central regions (Figure 3c,c’). Improvement zones covered 69% of the area, including 31% significant and 38% slight improvement. Winter trends diverged, showing extensive degradation, especially in the west. Degradation zones covered 31% of the area, with 29% slight degradation, while 43% showed no significant change (Figure 3d,d’).
Overall, annual NDVI trends indicated widespread vegetation improvement, particularly in the east and south, with some degradation in the west, north, and central areas (Figure 3e,e’). Improvement zones accounted for 72% of the area, including 47% significant and 25% slight improvement. From 2000 to 2018, vegetation coverage in the West Liao River Basin primarily improved, though trends varied significantly by season and region.

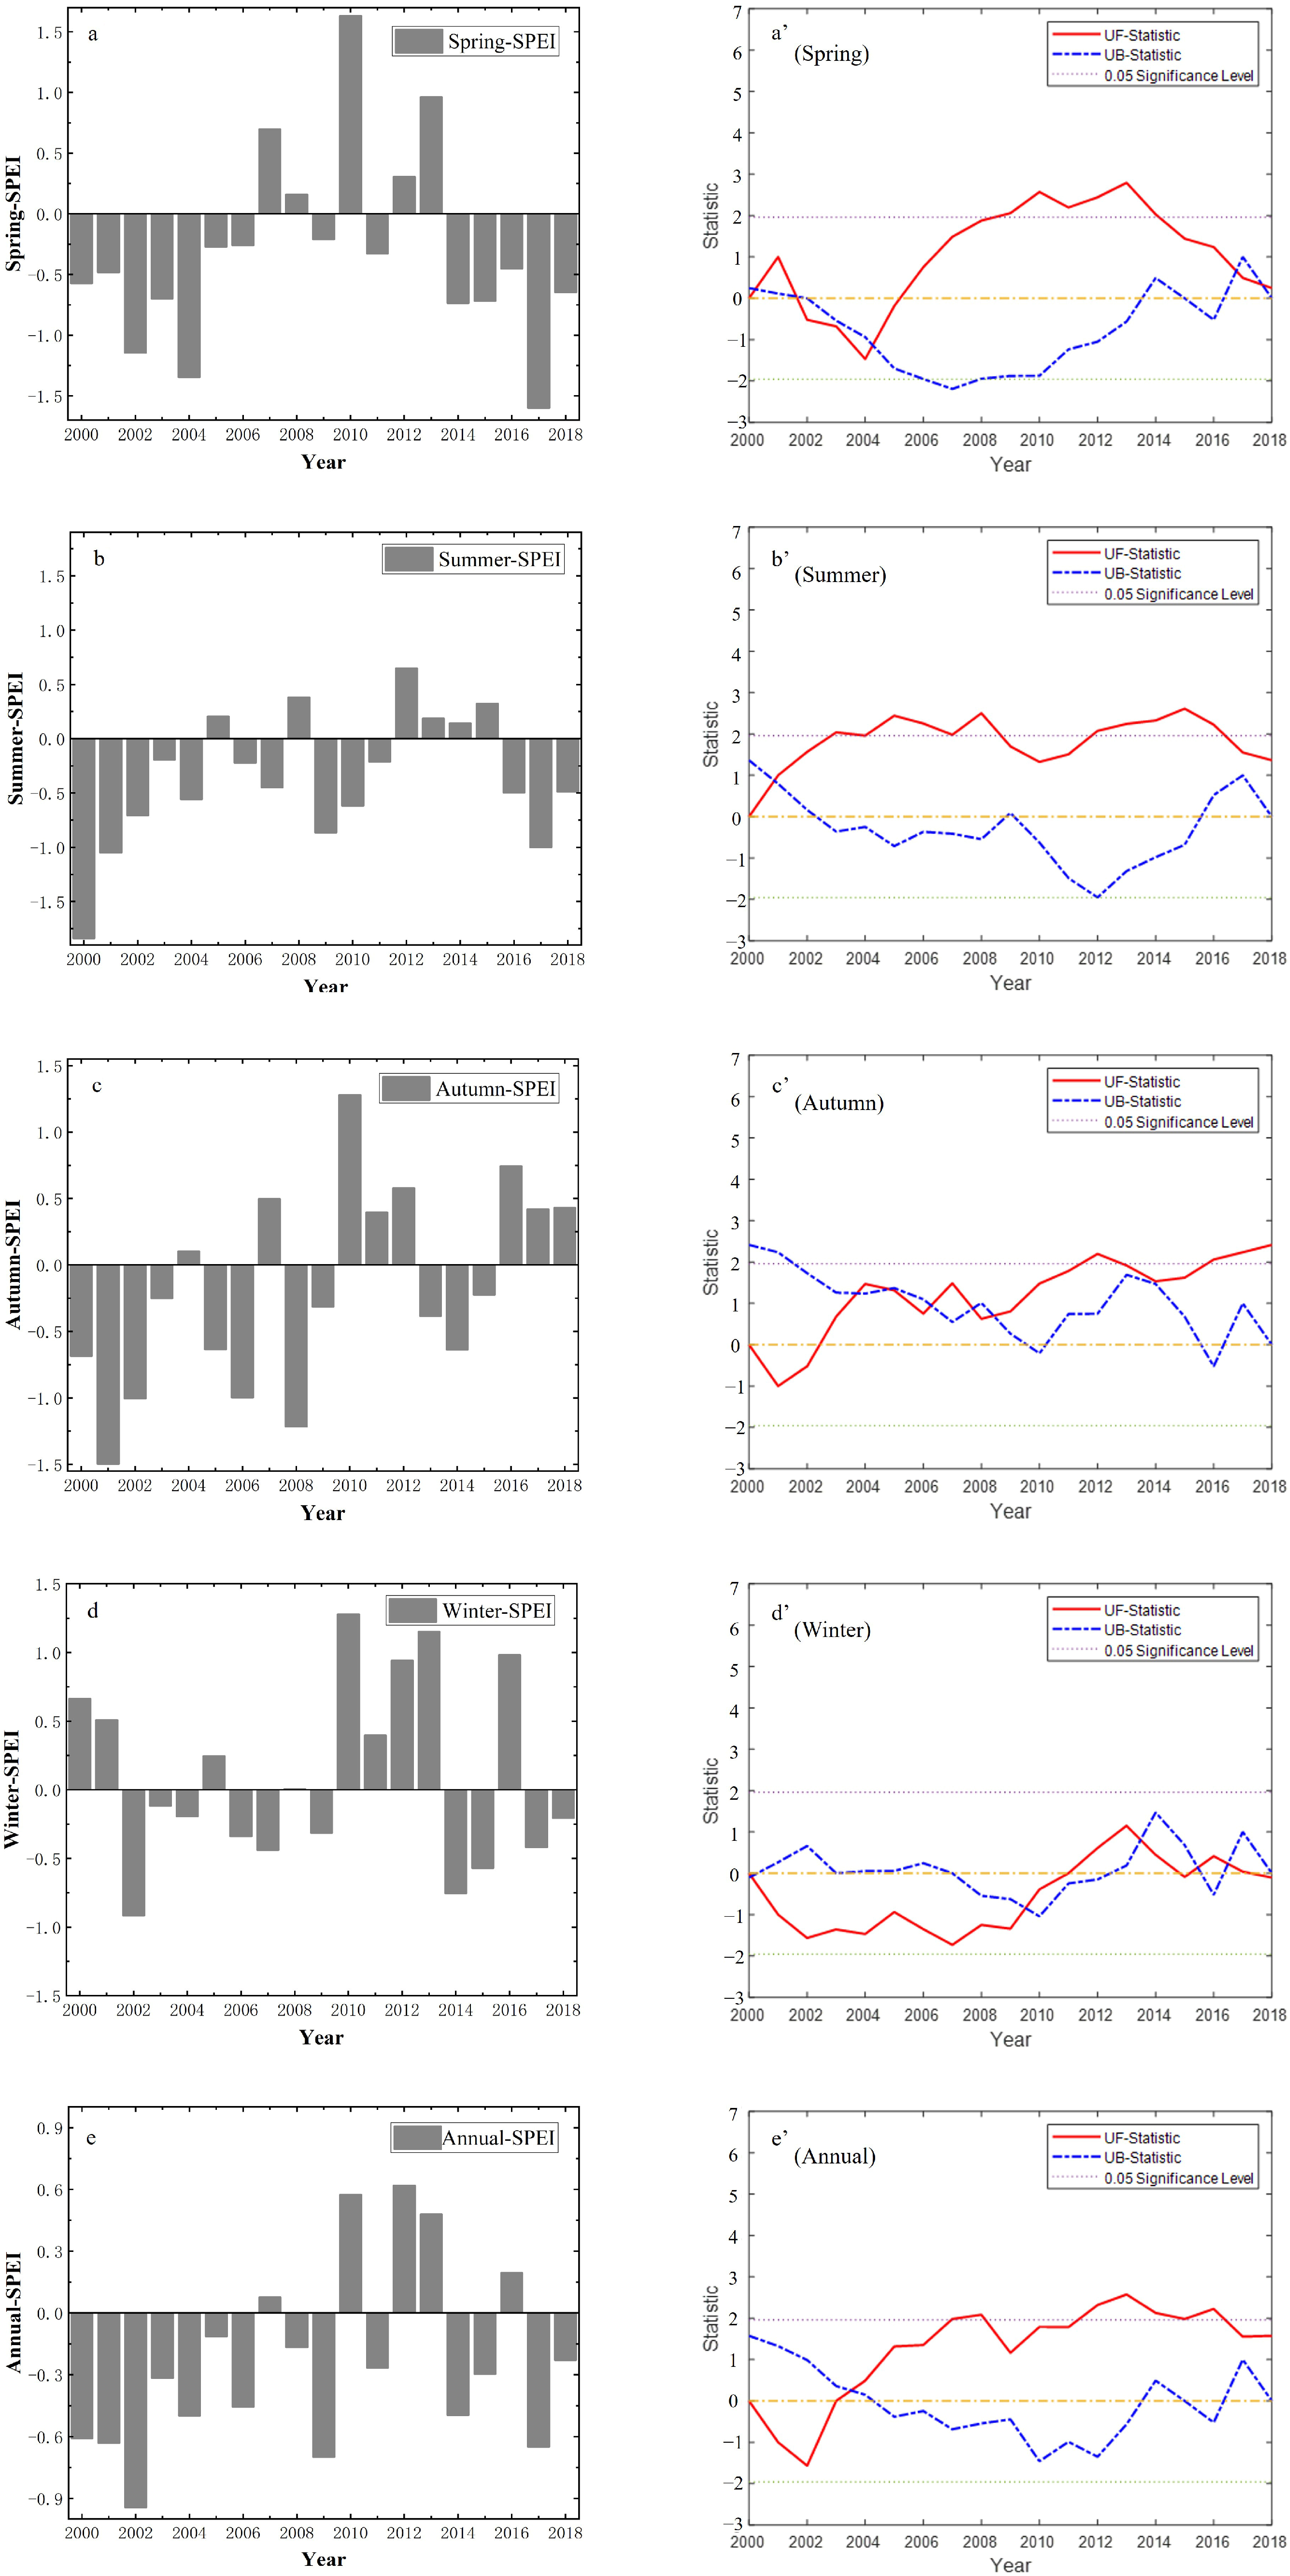
3.3. Temporal Variation Trends of SPEI

Figure 4 and Table 3 depict the interannual and seasonal variations of SPEI from 2000 to 2018, along with results from Sen′s trend analysis and Mann–Kendall tests. Overall, SPEI exhibited a fluctuating upward trend, though not statistically significant, with a Sen slope of 0.02742/year. Annual SPEI values ranged from −0.94 (2002, the driest year) to 0.62 (2012, the wettest year) (Figure 4e).
Seasonally, spring, summer, and autumn SPEIs showed fluctuating wetting trends, with autumn being significant. Winter exhibited a drying trend, though insignificant. Sen slopes were 0.01344 (spring, Figure 4a), 0.04575 (summer, Figure 4b), 0.07995 (autumn, Figure 4c), and −0.00591 (winter, Figure 4d) per year. Specific ranges and extreme years varied by season, highlighting distinct seasonal wet–dry dynamics. Mann–Kendall tests revealed multiple intersection points within confidence intervals, indicating significant trend shifts across seasons and years. Notably, spring SPEI shifted negatively in 2002, then positively after 2005 (Figure 4a’). Summer trends showed a significant wetting shift around 2001 (Figure 4b’). Autumn exhibited wetting shifts in multiple years post-2003 (Figure 4c’). Winter transitioned from drying to wetting post-2011 (Figure 4d’). The annual SPEI showed a significant wetting shift in 2004 (Figure 4e’).
In summary, the West Liao River Basin′s SPEI displayed a fluctuating upward trend from 2000 to 2018, though not statistically significant. Seasonal wet–dry variations were pronounced, reflecting the complexity and seasonality of climatic changes in the region.

3.4. Spatial Variation Trends of SPEI

The spatial distribution of annual and seasonal SPEI trends from 2000 to 2018 is illustrated in Figure 5. In spring (Figure 5a,a’), the eastern regions predominantly exhibited a wetting trend, while the western areas mainly showed drying. Slightly drying zones covered 52% of the area, with slightly wetting zones accounting for 45%.
During summer (Figure 5b,b’), most regions, except for parts of the west, displayed a wetting trend, particularly pronounced in the east. Drying zones comprised 21% of the area, whereas slight wetting zones dominated at 58%. Autumn saw a significant increase in SPEI across most areas, with drying zones covering less than 1% (Figure 5c,c’). Slightly wetting zones made up 44% of the area, and significant wetting zones accounted for 56%. Winter trends contrasted with this (Figure 5d,d’), with most regions experiencing drying, especially in the southwest and southeast, while the central areas showed slight wetting. Drying zones covered 49% of the area, with slight wetting zones at 48%. Overall, the annual SPEI trends indicated a predominant wetting trend across the basin (Figure 5e,e’), most notably in the eastern regions, with minor drying trends in the west. Wetting zones covered 90% of the area, including 64% slight wetting and 26% significant wetting zones.
In summary, the SPEI trends in the West Liao River Basin from 2000 to 2018 exhibited significant seasonal and regional variations, with an overall wetting trend, though drying persisted in western regions and during winter.

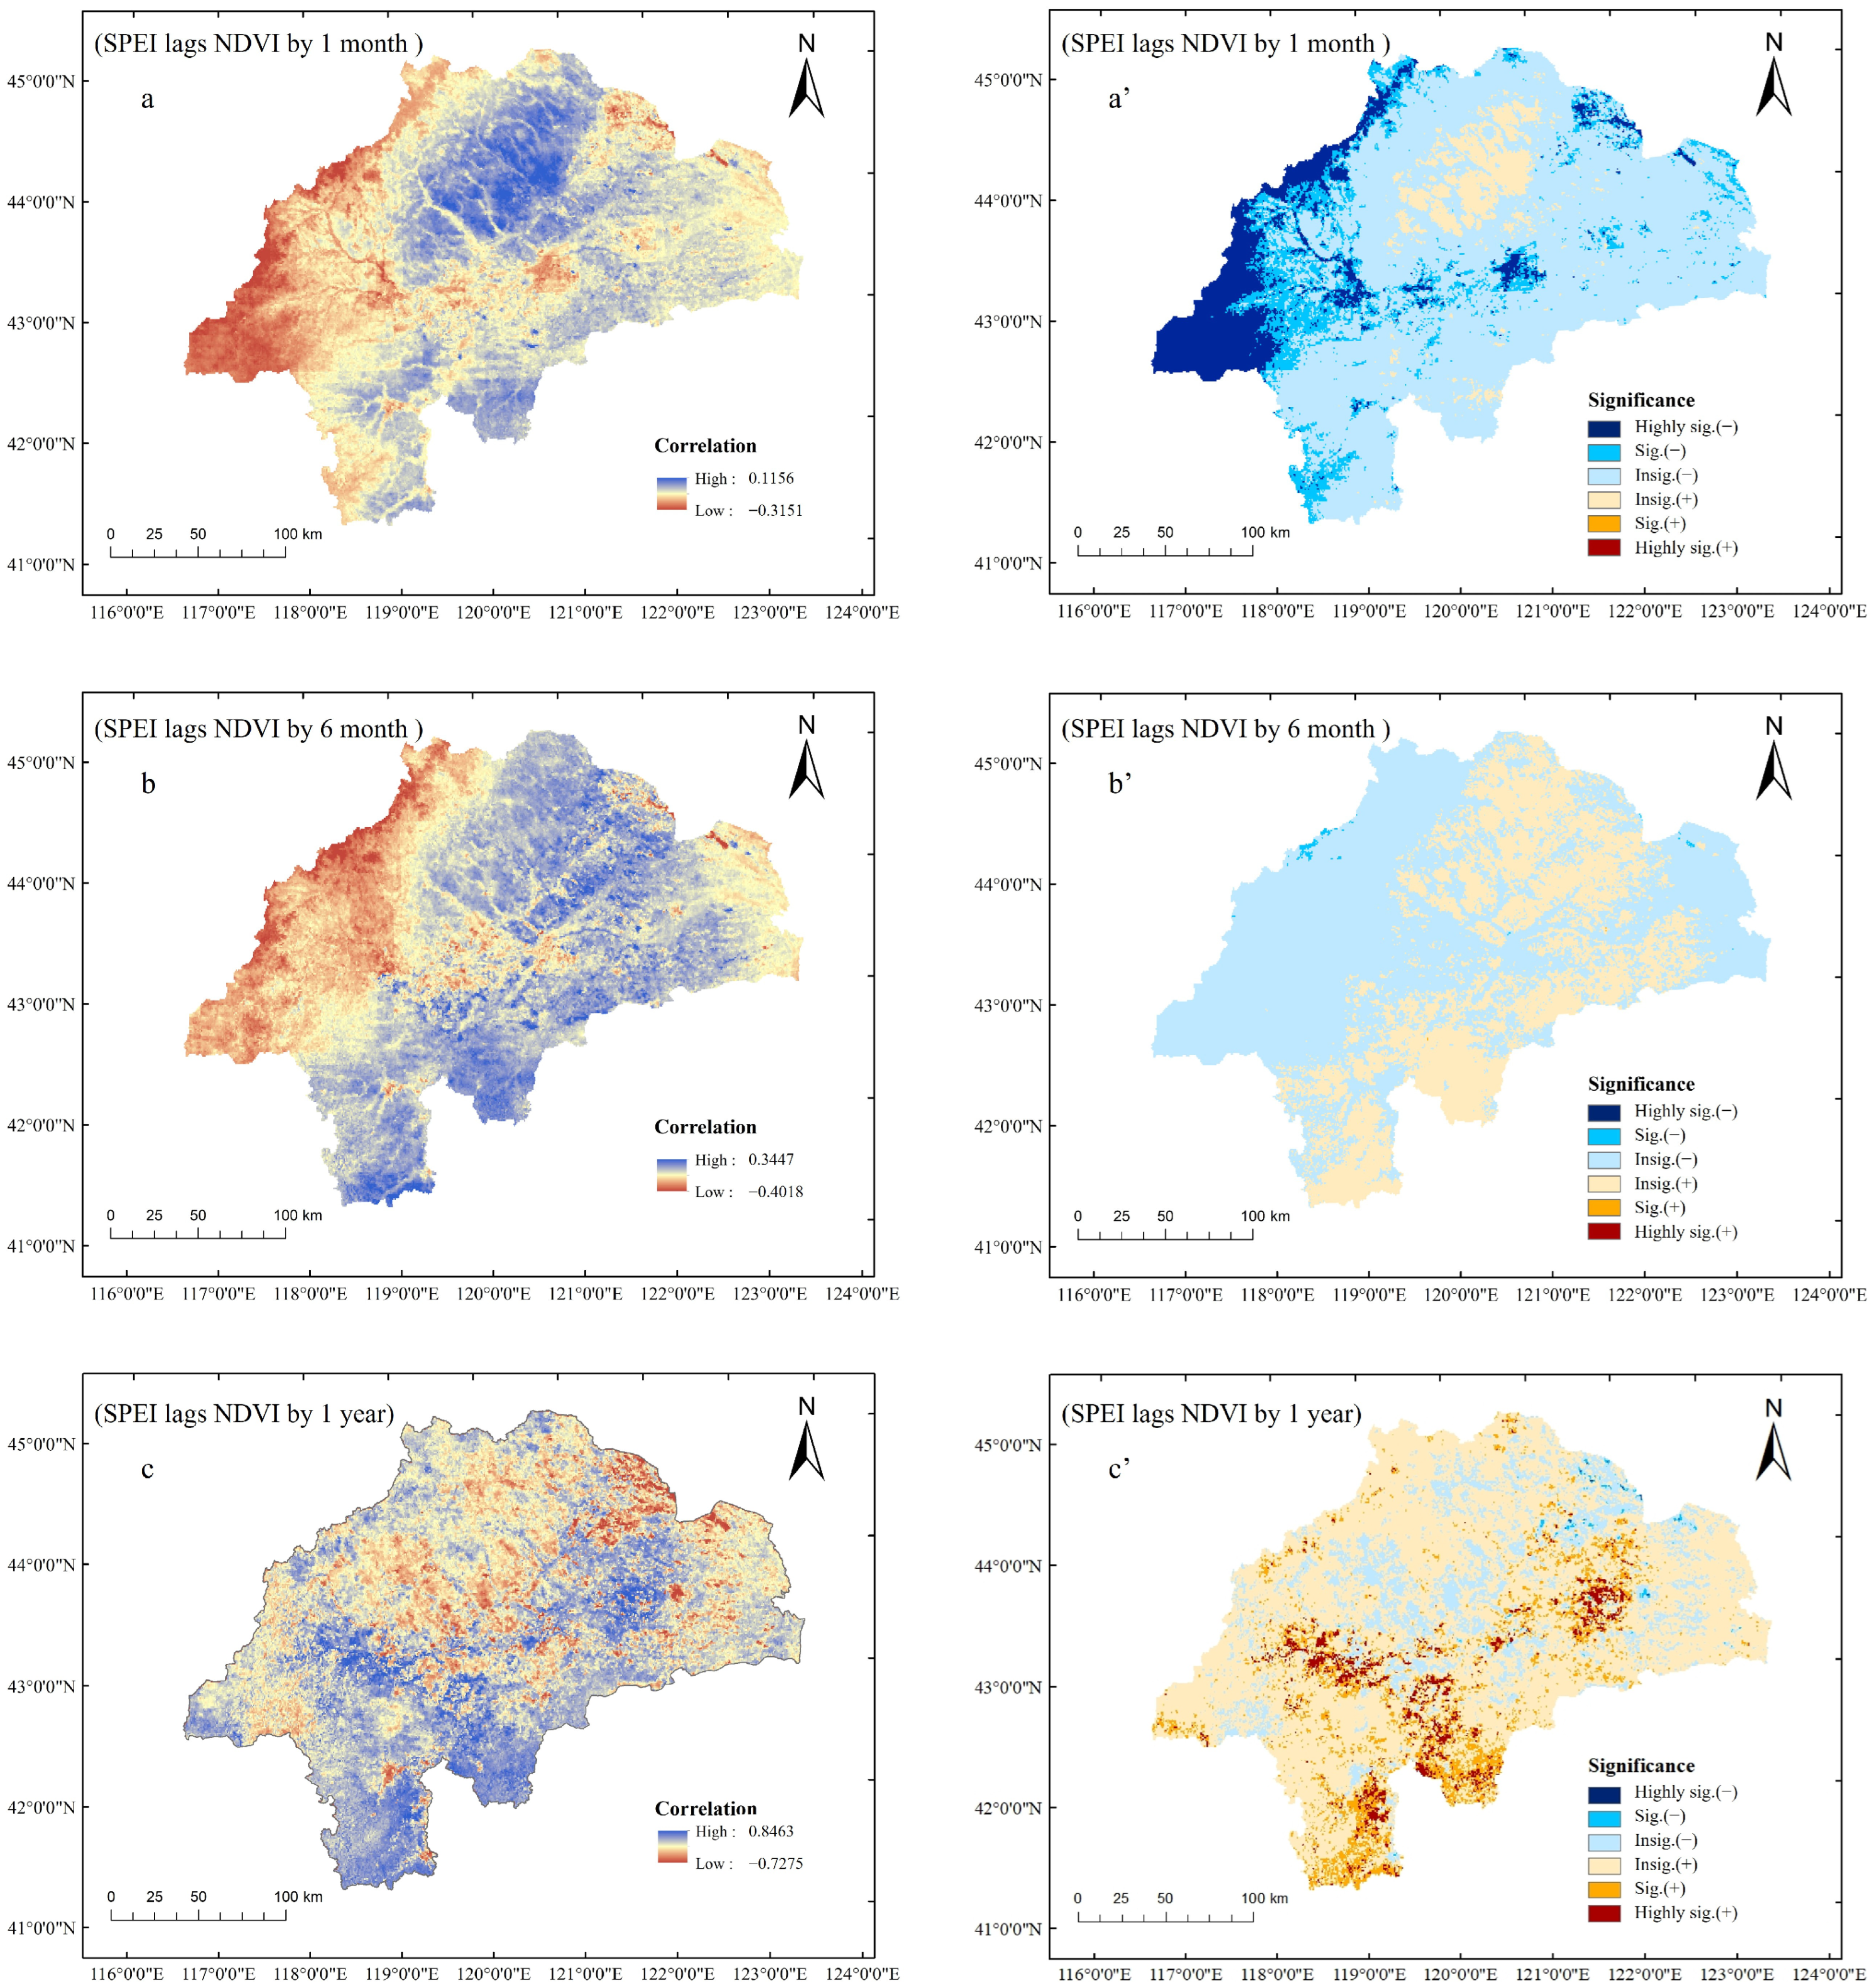
3.5. Sensitivity Analysis of Vegetation to Different Types of Drought Stress

After analyzing the spatial distribution of correlation coefficients and significance levels between NDVI and SPEI by one month, six months, and across different seasons and years from 2000 to 2018 in the West Liao River Basin, the results are shown in Figure 6 and Figure 7. Figure 6 shows that at the 1-month time scale (Figure 6a,a’), the correlation coefficients between NDVI and SPEI ranged from −0.32 to 0.12. Western regions exhibit more negative correlations than other areas. Strong significant negative correlations (p < 0.05) dominated in some parts of western, central, southern, and eastern areas, while weak positive correlations appeared in some northern areas. At the 6-month time scale (Figure 6b,b’), correlation coefficients varied from −0.40 to 0.34. Positive correlations prevailed in most areas, except for negative correlations in the western and central regions. Significance testing revealed weak positive/negative correlations across most of the basin, with only small areas in the northwestern part showing strong positive correlations. The correlation coefficients between NDVI and one-year-lagged SPEI spanned −0.72 to 0.85 (Figure 6c,c’). Negative correlations dominated most areas, though positive correlations appeared in some areas of the eastern and central regions. Most areas showed weak negative/positive correlations, with exceptions in eastern regions (strong/very strong significant positive correlations) and southern regions (strong significant negative correlations).
Figure 7 shows that in spring, the correlation coefficients ranged from −0.81 to 0.84. Most areas exhibited positive correlations, with about 16% showing highly significant or significant positive correlations, primarily in the central regions. Conversely, the western regions displayed more negative correlations, particularly in the west, south, and north. During summer, correlation coefficients ranged from −0.62 to 0.91. Approximately 98% of the area showed positive correlations, with 43% being highly significant. Negative correlations were observed in some western and central areas but were relatively minor. In autumn, correlation coefficients ranged from −0.74 to 0.79. Most regions exhibited insignificant positive correlations, with only about 8% in the east showing significant or highly significant positive correlations. Some northern and central areas displayed insignificant negative correlations. Winter correlation coefficients ranged from −0.80 to 0.63. About 98% of the area showed negative correlations, with 37% in the east, south, and west exhibiting significant or highly significant negative correlations. Only a few northern and central areas showed insignificant positive correlations. On an annual scale, correlation coefficients ranged from −0.61 to 0.87. Overall, 81.9% of the basin exhibited positive correlations, with about 20.8% of the basin mostly distributed in the east showing significant positive correlations. The northwestern regions mainly displayed insignificant negative correlations. In summary, the correlation between NDVI and SPEI in the West Liao River Basin exhibits significant spatial heterogeneity across seasons and years. Positive correlations dominate in spring and summer, especially in summer, while autumn shows widespread but less significant positive correlations. Winter is predominantly characterized by significant negative correlations. On an annual scale, positive correlations prevail, with significant positive correlations concentrated in the east-central region and insignificant negative correlations in the northwestern region.
These results indicate that the vegetation response to drought in the West Liao River Basin varies significantly by month, season, and region. Vegetation in the eastern regions is more sensitive to drought, while the western regions exhibit different response patterns, likely influenced by regional climate conditions, vegetation types, and human activities. This study provides crucial insights into the interactions between vegetation and climate in the West Liao River Basin.

3.6. Analysis of Vegetation Resistance and Resilience to Drought

The spatial distribution of vegetation resistance and resilience to drought in the study area is illustrated in Figure 8. Vegetation resistance in the West Liao River Basin exhibits significant spatial heterogeneity. Overall, resistance levels are relatively high, but lower in the eastern, central, and southern regions, where resistance indices mostly range between 5 and 10. In contrast, the western region shows higher resistance indices, generally exceeding 10, indicating stronger drought tolerance in these areas.
Vegetation resilience indices in the basin range from 0.6 to 1.28. Regions with higher resilience are primarily located in the west and center, where vegetation recovers more rapidly after drought. Conversely, resilience is weaker in the eastern and southern regions, likely due to local climatic conditions, soil types, and vegetation characteristics.
In summary, the spatial distribution of resistance and resilience reveals notable regional differences in vegetation response to drought. The western region demonstrates both high resistance and strong resilience, suggesting robust drought adaptation. In contrast, the eastern and southern regions exhibit weaker resistance and resilience, making them more vulnerable to drought impacts. This spatial heterogeneity is likely influenced by regional climate conditions, vegetation types, soil moisture, and human activities.

4. Discussion

4.1. Responses of Different Vegetation Types to Short-, Medium-, and Long-Term Droughts

Based on land-use distribution (forests in western/northwestern margins, croplands in eastern/central-western/southern regions, and grasslands widely distributed across the basin), combined with NDVI-SPEI correlation analysis, vegetation responses to drought exhibit significant spatial heterogeneity and type-dependent characteristics.
Forests in western/northwestern regions demonstrate deep-root buffering and lagged responses to drought. At the 1-month scale, weak negative correlations were observed, shifting to positive correlations after 6 months and 1 year and at 1-year lag. Deep roots (>3 m) utilizing groundwater minimize short-term drought impacts (1-month weak negative correlation), while the transition to non-significant positive correlations at 6-month and 1-year scales suggests long-term drought reduces productivity without showing significant one-year-lag effects. This response pattern reflects anisohydric stomatal regulation delaying water stress, where cumulative drought may deplete carbon reserves without manifesting significant 1-year-lag effects [12].
Croplands in eastern/central-western/southern regions show irrigation-dependent rapid responses. Strong positive NDVI-SPEI correlations at the 1-month scale weaken at the 6-month scale, indicating the sensitivity of crops (e.g., maize) to seasonal precipitation [34]. Irrigation projects like “Diverting Chaoer River to West Liao” enhance 1-year-lag positive correlations in eastern croplands, while non-irrigated central-western areas show reduced drought resistance following grassland-to-cropland conversion (1995–2010) [35]. Shallow roots (<1 m) dependent on soil moisture make these systems vulnerable, with a documented 30% maize yield reduction when SPEI < −1.5 [36].
Grasslands across the basin display type-specific responses. In mesic grasslands, positive 1-month correlations strengthen at the 6-month scale, reflecting water accumulation effects [37]. In xeric grasslands (Horqin Sandy Land), there are dominant negative correlations, as drought-tolerant species (e.g., Artemisia) gain a competitive advantage during dry periods [6]. Specific management should be followed, such as the following: (1) in western forests, limiting groundwater extraction (maintain depth < 6 m) and planting deep-rooted drought-resistant species (e.g., Ulmus pumila) [38]; (2) in eastern croplands, promoting water-saving irrigation (60% drip coverage) and rotating low-water crops (e.g., replace maize with castor); and (3) in grasslands, implementing ecological water replenishment in sandy areas and restoring floodplain wetlands [39].

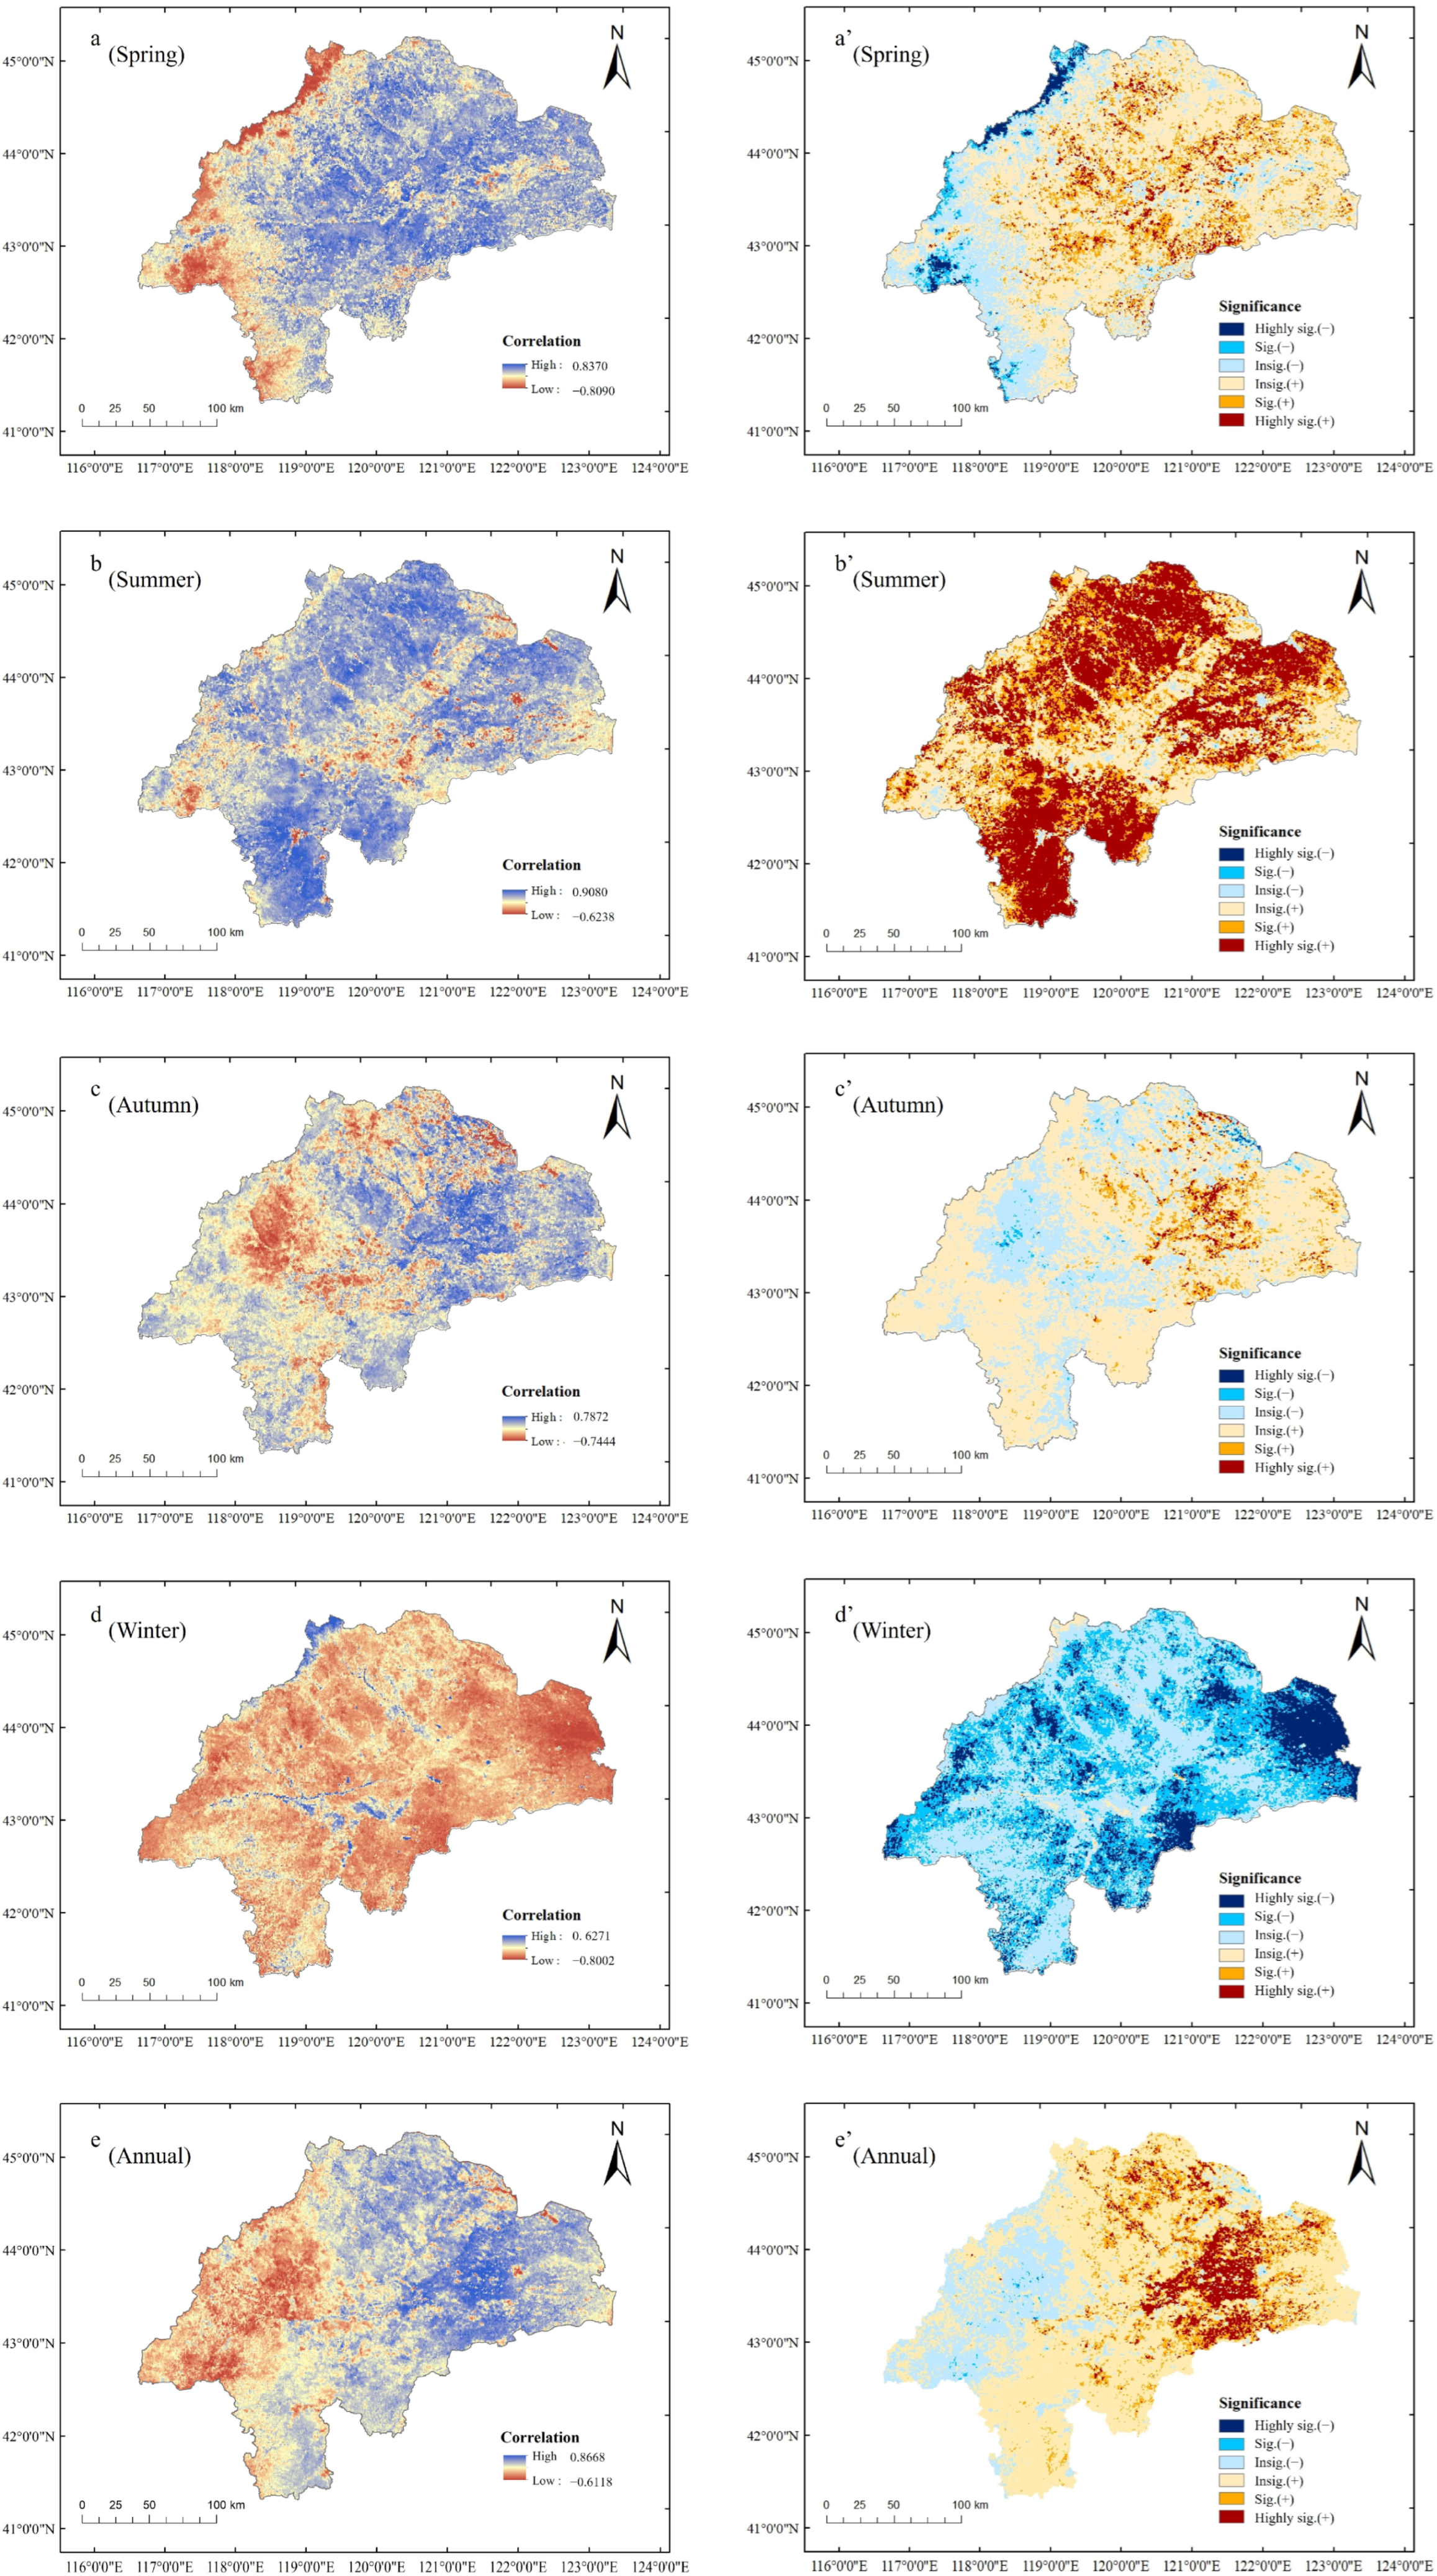
4.2. Seasonal Drought Trends and Heterogeneous Vegetation Responses

This study reveals significant seasonal differences in the impact of drought on vegetation in the West Liao River Basin. Drought during the growing season notably affects photosynthesis and biomass allocation. Spring, a critical period for vegetation regrowth, sees drought inhibiting plant germination and early growth [40]. For instance, the 2017 spring drought likely reduced vegetation cover, particularly affecting herbaceous plants and crops [28]. The 2002–2005 spring drought may have shortened the growing season and reduced photosynthetic efficiency, impacting ecosystem productivity [41].
The western basin’s persistent drought (2000–2018) may drive vegetation succession, with drought-tolerant species replacing moisture-dependent ones [3]. Summer, the peak growth period, experiences drought, which limits water uptake and transpiration and stunts growth. The 2000 summer drought likely affected crops (e.g., corn, soybeans) and grasslands, while pre-2005 droughts reduced biomass, especially in drought-sensitive areas [42], as discussed by Haughey et al. [43]. Autumn droughts, which affect late-season crops, hinder nutrient accumulation and overwintering preparation, potentially reducing yields [44]. The 2001 autumn drought may have forced early dormancy, impacting future growth. Winter droughts, though less directly impactful, deplete soil moisture, which affects spring regrowth. Spring droughts in the northwest likely reduce grassland and crop productivity. As indicated by the study of Yang [45], spring drought was negatively related to vegetation GPP and may lead to a decrease in grassland production. Additionally, vegetation in arid conditions is more sensitive to drought than in wetter conditions [46]. Furthermore, vegetation recovery exhibits a ‘drought memory effect’, with restoration capacity declining by 40% after repeated drought events [47].
The West Liao River Basin exhibits significant spatial heterogeneity in vegetation responses to drought. Grasslands are highly sensitive to short-term droughts, while forests respond more slowly, likely due to differences in root systems and groundwater reliance [48]. For example, shallow-rooted vegetation (grasslands/restoration forests) exhibits greater vulnerability compared to deep-rooted forests when adapting to seasonal drought [49]. Croplands (e.g., corn, wheat) are directly impacted, especially during critical growth periods, threatening regional food security [50]. These regional differences underscore the need for targeted ecological restoration and management measures.

4.3. Spatial Heterogeneity of Vegetation Resistance and Resilience to Drought

Vegetation resistance and resilience in the West Liao River Basin show significant spatial heterogeneity, with higher levels in the west and lower levels in the east and south. This variation is driven by natural and anthropogenic factors. Western vegetation, dominated by drought-tolerant shrubs and grasslands, exhibits strong drought resistance due to physiological adaptations [51]. In contrast, eastern and southern croplands are more sensitive to drought, influenced by both climatic and human factors (e.g., irrigation, land-use changes) [7]. Future research should integrate high-resolution remote sensing and ground observations to quantify these influences.
High resilience enables the rapid restoration of ecological functions (e.g., carbon uptake, water cycling) [52], mitigating cumulative drought impacts. However, extreme droughts exceeding recovery capacity can lead to ecosystem degradation [53]. The spatial patterns of resistance and resilience inform ecosystem management. In resilient western regions, maintaining ecosystem stability through measures like ecological reserves and grazing restrictions is crucial [5]. In vulnerable eastern and southern regions, targeted interventions—such as drought-resistant crops and ecological water replenishment—are needed to enhance resilience [54]. For example, deep-rooted legumes (such as alfalfa) sustain productivity under drought conditions, while intercropping drought-resistant legume species improves crop resilience to aridity [55]. Furthermore, drought during the flowering stage of maize can reduce yields by up to 50%, whereas sorghum exhibits higher drought tolerance due to its waxy cuticle. Therefore, adopting drought-resistant crop varieties (e.g., substituting maize with sorghum) and implementing precision irrigation can significantly enhance agricultural resilience to water stress [56]. Additionally, climate change scenarios should be integrated to predict long-term impacts and guide sustainable management.

4.4. Global Implications for Arid and Semi-Arid Regions

This study’s findings have broad applications for managing arid and semi-arid regions globally, which cover over 40% of the Earth’s land area and support 38% of the global population. These regions are highly vulnerable to climate change, making sustainable vegetation and water management critical.
(1)
Regional adaptive management of resistance and resilience: The spatial heterogeneity of vegetation resistance and resilience offers insights for other regions. For example, in Africa’s Sahel, drought-tolerant species and ecological water projects could mitigate land degradation [57]. Similarly, in Australia’s Murray–Darling Basin, this study’s methods could inform vegetation monitoring and restoration strategies [58].
(2)
Global applicability of seasonal drought impacts: The seasonal variability of drought impacts provides a framework for managing droughts elsewhere. In the Mediterranean, optimizing irrigation and crop structures could alleviate summer drought effects [59]. In the U.S. Southwest, winter drought management strategies (e.g., soil moisture conservation) could support spring regrowth.
(3)
Adaptive ecosystem management under drought trends: The long-term and cumulative effects of drought highlight the need for adaptive management. For example, in Central Asia, restoring natural vegetation and optimizing water resources could enhance ecosystem resilience [60]. In South America’s Pampas, this study’s framework could guide ecosystem monitoring and management [61].
(4)
International collaboration and knowledge sharing: This study’s findings can support global initiatives like the UNCCD, fostering knowledge exchange and technical cooperation. Additionally, the methods and results can improve global ecosystem models (e.g., DGVMs), enhancing predictions of drought impacts on vegetation.
In summary, this study provides valuable insights for managing the West Liao River Basin and other arid and semi-arid regions globally. By promoting resistance and resilience assessments, optimizing seasonal drought management, and fostering international collaboration, these regions can enhance ecosystem sustainability and contribute to achieving global SDGs.

4.5. Limitations and Future Prospects

Although this study presents a novel integration of NDVI trends with different types of drought impacts, it has some limitations that need to be addressed in future research. Firstly, the study only covers the period from 2000 to 2018, which may not fully capture long-term drought trends and vegetation adaptation cycles, especially under accelerating climate change. Secondly, while remote sensing (RS) provides broad-scale insights, coarse-resolution data (e.g., MODIS NDVI) may overlook fine-scale vegetation dynamics and localized drought impacts, particularly in heterogeneous landscapes like cropland–grassland transitions [62]. Thirdly, although croplands were identified as highly vulnerable, the study does not differentiate between crop types (e.g., maize vs. sorghum) or farming practices (e.g., irrigation vs. rainfed), which critically shape drought responses. Fourthly, the analysis does not explicitly incorporate anthropogenic influences (e.g., irrigation infrastructure, land-use changes), which may confound natural vegetation–drought relationships in agricultural zones. Finally, the Mann–Kendall test, as a widely used non-parametric trend detection method, offers advantages such as not requiring data normality and being insensitive to outliers. However, it still presents the following limitations or biases in practical applications: (1) the test assumes data point independence, but real-world time series (e.g., temperature, hydrological data) often exhibit autocorrelation, which may lead to incorrect conclusions about trend existence; and (2) the original test does not account for seasonal fluctuations (e.g., monthly temperature variations). Thus, seasonal patterns may obscure or exaggerate genuine trends.
To deepen the interdisciplinary impact, the following aspects could be added in future studies: (1) integrating multi-sensor data (e.g., Sentinel-2, LiDAR) to enhance spatial resolution; (2) combining RS with field experiments to validate drought–vegetation interactions; (3) incorporating crop models (e.g., DSSAT) to assess management-specific adaptations; (4) applying machine learning to disentangle climate and human drivers of vegetation changes; (5) tracking vegetation responses to cyclical droughts under compounding pressures (e.g., heatwaves, land-use changes); (6) integrating economic thresholds (e.g., farmer adaptation costs) and policy scenarios (e.g., water allocation rules); (7) testing whether the basin’s drought adaptation lessons apply to analogous regions (e.g., the Sahel or the Australian Murray–Darling Basin). Thus, future research should prioritize longitudinal studies tracking multi-decadal vegetation responses to increasingly frequent drought cycles [63] and mechanistic studies combining remote sensing with ground-based physiological measurements to unravel underlying processes [3]. Furthermore, to provide optimized policy recommendations, spatial resilience patterns could be translated into prioritized conservation zones (e.g., protecting drought-buffering shrublands). Early warning systems using vegetation sensitivity thresholds should also be developed [64]. Additionally, local water replenishment strategies could be aligned with transboundary water governance frameworks. Finally, socioeconomic factors and land-use changes should be integrated to develop holistic adaptation strategies.

5. Conclusions

This study reveals key spatiotemporal patterns of drought–vegetation interactions in the West Liao River Basin, demonstrating that (1) vegetation showed strong seasonal sensitivity, with growing-season droughts severely impairing productivity, while winter droughts depleted soil moisture; (2) vegetation responses varied spatially—grasslands reacted rapidly to short-term droughts, forests responded slowly due to deep roots, and croplands faced acute vulnerability during critical growth stages; and (3) western drought-adapted forests/shrubs exhibited greater resistance/resilience than eastern croplands, suggesting the need for targeted adaptation strategies like drought-resistant crops and water replenishment in vulnerable areas.
These findings provide critical insights for ecosystem management in dryland regions and for achieving global sustainability goals (e.g., SDG 13 on climate action and SDG 15 on terrestrial ecosystems). By demonstrating how different vegetation systems adapt to water stress, this work provides a scientific basis for (1) targeted ecosystem conservation in vulnerable arid zones; (2) climate-smart agricultural planning in food production areas; and (3) the development of early warning systems for drought-induced ecological degradation. The integration of these science-based strategies into regional policy frameworks will be essential for building resilient landscapes in an era of climate uncertainty.

Author Contributions

Conceptualization, Y.T.; methodology, Y.T., H.Z. and M.Y.; formal analysis, H.Z. and M.Y.; investigation, M.Y., L.W. and H.Z.; writing—original draft preparation, H.Z. and M.Y.; writing—review and editing, Y.T.; supervision, Y.T. All authors have read and agreed to the published version of the manuscript.

Funding

This research was supported by the National Natural Science Foundation of China (42271203) and the Project Supported by State Key Laboratory of Earth Surface Processes and Hazards Risk Governance (2022-ZD-02).

Institutional Review Board Statement

Not applicable.

Informed Consent Statement

Not applicable.

Data Availability Statement

All the data used in this paper are provided in the manuscript.

Conflicts of Interest

The authors declare no conflicts of interest.

References

  1. Yin, G.; Zhang, H. A new integrated index for drought stress monitoring based on decomposed vegetation response factors. J. Hydrol. 2023, 618, 129252. [Google Scholar] [CrossRef]
  2. Anderegg, W.R.L.; Schwalm, C.R.; Biondi, F.; Camarero, J.J.; Koch, G.W.; Litvak, M.; Ogle, K.; Shaw, J.D.; Shevliakova, E.; Williams, A.P.; et al. Pervasive drought legacies in forest ecosystems and their implications for carbon cycle models. Science 2015, 349, 528–532. [Google Scholar] [CrossRef]
  3. Anderegg, W.R.L.; Trugman, A.T.; Badgley, G.; Koings, A.G.; Shaw, J. Divergent forest sensitivity to repeated extreme droughts. Nat. Clim. Change 2020, 10, 1091–1095. [Google Scholar] [CrossRef]
  4. Gu, L.; Chen, J.; Yin, J.; Xu, C.-Y.; Chen, H. Drought hazard transferability from meteorological to hydrological propagation. J. Hydrol. 2020, 585, 124761. [Google Scholar] [CrossRef]
  5. Rahman, G.; Jung, K.M.; Kim, W.T.; Kwan, H.H. Drought impact, vulnerability, risk assessment, management and mitigation under climate change: A comprehensive review. KSCE J. Civ. Eng. 2025, 29, 100120. [Google Scholar] [CrossRef]
  6. Liu, X.; Sun, G.; Fu, Z.; Ciais, P.; Feng, X.; Li, J.; Fu, B. Compound droughts slow down the greening of the Earth. Glob. Change Biol. 2023, 29, 3072–3084. [Google Scholar] [CrossRef]
  7. Tangjialeke, W.; Zou, J.; Ding, J.; Yahefujiang, H.; Huang, S.; Li, J. Analysis of drought response thresholds and drought-causing factors of central Asian vegetation. Ecol. Indic. 2024, 169, 112926. [Google Scholar] [CrossRef]
  8. Wang, C.; Chen, J.; Lee, S.-C.; Xiong, L.; Su, T.; Lin, Q.; Xu, C.-Y. Response and recovery times of vegetation productivity under drought stress: Dominant factors and relationships. J. Hydrol. 2025, 655, 132945. [Google Scholar] [CrossRef]
  9. Zhao, Q.; Zhang, X.; Li, C.; Xu, Y.; Fei, J.; Hao, F.; Song, R. Diverse vegetation response to meteorological drought from propagation perspective using event matching method. J. Hydrol. 2025, 653, 132776. [Google Scholar] [CrossRef]
  10. Wu, B.; Quan, Q.; Huang, X.; Deng, J. Response of extreme precipitation to climatic warming in the Weihe river basin, China and its mechanism. Open Geosci. 2022, 14, 853–862. [Google Scholar] [CrossRef]
  11. De Keersmaecker, W.; Lhermitte, S.; Tits, L.; Honnay, O.; Somers, B.; Coppin, P. A model quantifying global vegetation resistance and resilience to short-term climate anomalies and their relationship with vegetation cover. Glob. Ecol. Biogeogr. 2021, 30, 714–728. [Google Scholar] [CrossRef]
  12. Choat, B.; Brodribb, T.J.; Brodersen, C.R.; Duursma, R.A.; López, R.; Medlyn, B.E. Triggers of tree mortality under drought. Nature 2022, 608, 528–533. [Google Scholar] [CrossRef] [PubMed]
  13. Schwalm, C.R.; Anderegg, W.R.L.; Michalak, A.M.; Fisher, J.B.; Biondi, F.; Koch, G.; Huntzinger, D.N. Global patterns of drought recovery. Nature 2020, 548, 202–205. [Google Scholar] [CrossRef]
  14. Zhang, X.; Zhang, B. The responses of natural vegetation dynamics to drought during the growing season across China. J. Hydrol. 2019, 574, 706–714. [Google Scholar] [CrossRef]
  15. Craine, J.M.; Ocheltree, T.W.; Nippert, J.B.; Towne, E.G.; Skibbe, A.M.; Kembel, S.W.; Fargione, J.E. Global diversity of drought tolerance and grassland climate-change resilience. Nat. Clim. Change 2013, 3, 63–67. [Google Scholar] [CrossRef]
  16. Gazol, A.; Camarero, J.J.; Anderegg, W.R.L.; Vicente-Serrano, S.M. Impacts of droughts on the growth resilience of Northern Hemisphere forests. Glob. Ecol. Biogeogr. 2017, 26, 166–176. [Google Scholar] [CrossRef]
  17. Stampfli, A.; Bloor, J.M.G.; Fischer, M.; Zeiter, M. High land-use intensity exacerbates shifts in grassland vegetation composition after severe experimental drought. Glob. Change Biol. 2018, 24, 2021–2034. [Google Scholar] [CrossRef]
  18. Kannenberg, S.A.; Maxwell, J.T.; Pederson, N.; D’Orangeville, L.; Ficklin, D.L.; Phillips, R.P. Drought legacies are dependent on water table depth, wood anatomy and drought timing across the eastern US. Ecol. Lett. 2019, 22, 119–127. [Google Scholar] [CrossRef]
  19. Jiang, W.; Fu, B.; Gao, G.; Lv, Y.; Wang, C.; Sun, S.; Wang, K.; Schüler, S.; Shu, Z. Exploring spatial-temporal driving factors for changes in multiple ecosystem services and their relationships in West Liao River Basin, China. Sci. Total Environ. 2023, 904, 166716. [Google Scholar] [CrossRef]
  20. Gong, J.; Yang, G.; Zhang, S.; Zhang, W.; Dong, X.; Zhang, S.; Wang, R.; Yan, C.; Wang, T. Human activities weaken the positive effects of soil abiotic factors and biodiversity on ecosystem multifunctionality more than drought: A case study in China’s West Liao River Basin. Sci. Total Environ. 2024, 957, 177564. [Google Scholar] [CrossRef]
  21. Cao, J.; Luo, Y.; Zhang, X.; Fan, L.; Tao, J.; Nam, W.-H.; Sur, C.; He, Y.; Gulakhmadov, A.; Niyogi, D. Assessing the responsiveness of multiple microwave remote sensing vegetation optical depth indices to drought on crops in Midwest US. Int. J. Appl. Earth Obs. Geoinf. 2024, 132, 104072. [Google Scholar] [CrossRef]
  22. Zhao, X.; Fan, P.; Wang, Y.; Zhou, Q. Study on the spatiotemporal variation characteristics and influencing factors of vegetation coverage in the West Liao River Basin from 2000 to 2018. Chin. J. Agric. Resour. Reg. Plan. 2021, 42, 75–88. [Google Scholar]
  23. Wang, Z.; Liu, D.; Wang, M. Mapping Main Grain Crops and Change Analysis in the West Liaohe River Basin with Limited Samples Based on Google Earth Engine. Remote Sens. 2023, 15, 5515. [Google Scholar] [CrossRef]
  24. Tucker, C.J.; Pinzon, J.E.; Brown, M.E.; Slayback, D.A.; Pak, E.W.; Mahoney, R.; Vermote, E.F.; El Saleous, N. An extended AVHRR 8-km NDVI dataset compatible with MODIS and SPOT vegetation NDVI data. Int. J. Remote Sens. 2005, 26, 4485–4498. [Google Scholar] [CrossRef]
  25. ESRI. ArcGIS Pro: How Resampling Works; Environmental Systems Research Institute: Redlands, CA, USA, 2023. [Google Scholar]
  26. Kendall, M.G. Rank Correlation Methods, 4th ed.; Griffin: London, UK, 1975. [Google Scholar]
  27. Kassahun, M.Z.; Ture, K.B.; Nedaw, D.H. Spatio-temporal variability and trends of hydroclimatic variables at Zarima Sub-Basin North Western Ethiopia. Environ. Syst. Res. 2022, 11, 27. [Google Scholar]
  28. Shi, J.; Liu, M.; Li, Y.; Guan, C. Response of total primary productivity of vegetation to meteorological drought in arid and semi-arid regions of China. J. Arid Environ. 2025, 228, 105346. [Google Scholar] [CrossRef]
  29. Huang, C.; Yang, Q.; Guo, Y.; Zhang, Y.; Guo, L. The pattern, change and driven factors of vegetation cover in the Qin Mountains region. Sci. Rep. 2020, 10, 20591. [Google Scholar] [CrossRef]
  30. Sun, B.; Li, Z.; Gao, Z.; Guo, Z.; Wang, B.; Hu, X.; Bai, L. Grassland degradation and restoration monitoring and driving forces analysis based on long time-series remote sensing data in Xilin Gol League. Ecol. Front. 2017, 37, 219–228. [Google Scholar] [CrossRef]
  31. Li, C.H.; Zhou, M.; Wang, Y.T.; Zhu, T.B.; Sun, H.; Yin, H.H.; Gao, H.J.; Han, H.Y. Interannual variation of vegetation net primary productivity and its spatiotemporal and climatic contributions in arid Northwest China: A case study of Hexi Corridor. Chin. J. Ecol. 2020, 39, 3265–3275. [Google Scholar]
  32. Huang, K.; Xia, J. High ecosystem stability of evergreen broadleaf forests under severe droughts. Glob. Change Biol. 2019, 25, 3494–3503. [Google Scholar] [CrossRef]
  33. Jha, S.; Das, J.; Sharma, A.; Hazra, B.; Goyal, M.K. Probabilistic evaluation of vegetation drought likelihood and its implications to resilience across India. Glob. Planet. Change 2019, 176, 23–35. [Google Scholar] [CrossRef]
  34. Yang, L.; Yang, Y.Z. Spatiotemporal patterns and influencing factors of soil moisture in the West Liao River Basin based on TVDI. J. Arid Land Resour. Environ. 2016, 30, 76–81. [Google Scholar]
  35. Chen, Z.Y. Response of Vegetation Ecology to Groundwater Depth Changes in the West Liaohe Plain Based on RS/GIS. Ph.D. Thesis, Jilin University, Jilin, China, 2012. [Google Scholar]
  36. Zou, D.; Zhou, Y.K.; Dong, X.J.; Lin, J.; Wang, H.; Liang, J. Spatiotemporal linkages and attribution analysis of vegetation and meteorological drought in the Yangtze River Basin. Remote Sens. Technol. Appl. 2024, 39, 1183–1195. [Google Scholar]
  37. Wang, X.; Guo, L.; Hu, C.; Zhou, L.; Sun, X.; Zhao, J. Relationship between groundwater and vegetation development in the West Liao River Basin based on RS and GIS. Groundwater 2024, 46, 20–22. [Google Scholar]
  38. Han, L.; Cao, X.X.; Zhu, H.L.; Chen, R.; Zhao, Y.H.; Liu, Z.; Zhao, Z.L.; Chang, Y.Q.; Yang, M.L.; Gao, Y.F. Vegetation coverage changes and driving factors in the Loess Plateau based on characteristic zoning. Acta Ecol. Sin. 2023, 43, 8564–8577. [Google Scholar]
  39. Wang, Z.K.; Chen, W.; Piao, J.L.; Cai, Q.; Chen, S.; Xue, X.; Ma, T. Synergistic effects of high atmospheric and soil dryness on vegetation productivity decline in Southwest China. NPJ Clim. Atmos. Sci. 2025, 8, 6. [Google Scholar] [CrossRef]
  40. Yin, M.; Yin, Y.; Zong, X.; Deng, H. Global vegetation vulnerability to drought is underestimated due to the lagged effect. Agric. For. Meteorol. 2025, 364, 110451. [Google Scholar] [CrossRef]
  41. Dang, C.; Shao, Z.; Huang, X.; Qian, J.; Cheng, G.; Ding, Q.; Fan, Y. Assessment of the importance of increasing temperature and decreasing soil moisture on global ecosystem productivity using solar-induced chlorophyll fluorescence. Glob. Change Biol. 2022, 28, 2066–2080. [Google Scholar] [CrossRef]
  42. Deng, K.-Q.; Azorin-Molina, C.; Yang, S.; Hu, C.-D.; Zhang, G.-F.; Minola, L.; Vicente-Serrano, S.; Chen, D. Shifting of summertime weather extremes in Western Europe during 2012–2020. Adv. Clim. Change Res. 2022, 13, 218–227. [Google Scholar] [CrossRef]
  43. Haughey, E.; McElwain, J.C.; Finn, J.A. Annual yields of multispecies grassland mesocosms outperformed monocultures across a drought gradient due to complementarity effects and rapid recovery. Grassland Res. 2023, 2, 309–321. [Google Scholar] [CrossRef]
  44. Ma, Z.; Sun, P.; Yao, R. Spatiotemporal characteristics of drought and its impact on vegetation in Inner Mongolia. J. Soil Water Conserv. 2022, 36, 231–240. [Google Scholar]
  45. Yang, M. Temporal and Spatial Distribution Characteristics of Gross Primary Productivity in Guizhou Province and Its Response to Drought Variability. Master’s Thesis, Guizhou Normal University, Guizhoi, China, 2022. [Google Scholar]
  46. Yuan, B.; Guo, S.; Zhang, X.; Mu, H.; Cao, S.; Xia, Z.; Pan, X.; Du, P. Quantifying the drought sensitivity of vegetation types in northern China from 1982 to 2022. Agric. For. Meteorol. 2024, 359, 110293. [Google Scholar] [CrossRef]
  47. Zhang, X.; Liu, Y.; Piao, S.; Wang, T.; Huang, K.; Wang, S.; Janssens, I.A. Drought memory weakens vegetation recovery capacity after recurrent droughts. Nat. Clim. Change 2023, 13, 754–760. [Google Scholar]
  48. Deng, H.; Yin, Y.; Han, X. Vulnerability of vegetation activities to drought in Central Asia. Environ. Res. Lett. 2020, 15, 084005. [Google Scholar] [CrossRef]
  49. Xiao, J.; Terrer, C.; Gentine, P.; Tateno, R.; Fan, L.; Ma, M.; Yue, Y.; Yuan, W.; Peñuelas, J.; Shi, W. Temporal and phenological modulation of the impact of increasing drought conditions on vegetation growth in a humid big river basin: Insights from global comparisons. Earth’s Future 2025, 13, e2024EF005720. [Google Scholar] [CrossRef]
  50. Cao, W.; Li, X.; Lyu, X.; Dang, D.; Wang, K.; Li, M.; Liu, S. To explore the effectiveness of various ecological security pattern construction methods in many growth situations in the future: A case study of the West Liaohe River Basin in Inner Mongolia. Sci. Total Environ. 2024, 948, 174607. [Google Scholar] [CrossRef]
  51. Zheng, W.; Askari, K.; Song, C.; Shi, P.; Ge, W.; Shi, S.; Chu, J.; Chen, H.; Wang, F. Increasing vulnerability of vegetation to meteorological and groundwater drought: A case study in Argentina. J. Hydrol. Reg. Stud. 2024, 55, 101931. [Google Scholar] [CrossRef]
  52. Shi, Y.; Zhang, B.; Liang, L.; Wang, S.; Zhang, H.; Sun, H.; Han, X. Unfolding the effectiveness of ecological restoration programs in enhancing vegetation carbon sinks across different climate zones in China. Resour. Conserv. Recycl. 2025, 212, 107974. [Google Scholar] [CrossRef]
  53. Li, X.; Piao, S.; Wang, K.; Wang, X.; Wang, T.; Ciais, P.; Chen, A.; Lian, X.; Peng, S.; Peñuelas, J. Temporal trade-off between gymnosperm resistance and resilience increases forest sensitivity to extreme drought. Nat. Ecol. Evol. 2022, 4, 1075–1083. [Google Scholar] [CrossRef]
  54. Prasad, J.; Akila, N.; Bharathi, C.S.; Alagudurai, S.; Rao, C.R.; Raju, B.; Rao, K.; Rao, A.S.; Rejani, R.; Ramana, D.; et al. Assessment of adaptation practices for risk minimization to drought in semi-arid environments. Clim. Risk Manag. 2023, 42, 100563. [Google Scholar] [CrossRef]
  55. Hoover, D.L.; Knapp, A.K.; Smith, M.D. Drought resistance and resilience in grassland ecosystems: The role of plant functional traits. Agronomy 2022, 12, 701. [Google Scholar]
  56. Lobell, D.B.; Deines, J.M.; Di Tommaso, S. Divergent crop responses to drought in a warming world. Proc. Natl. Acad. Sci. USA 2023, 120, e2208976120. [Google Scholar]
  57. Elagib, A.N.; Ali, A.M.M.; Musa, A.A. Intensifying drought render more Sahel drylands unsuitable for cultivation. Sci. Total Environ. 2024, 954, 176390. [Google Scholar] [CrossRef]
  58. Taschetto, S.A.; Stojanovic, M.; Holgate, M.C.; Drumond, A.; Evans, J.P.; Gimeno, L.; Nieto, R. Changes in moisture sources contributed to the onset and development of the 2017-2019 southeast Australian drought. Weather Clim. Extrem. 2024, 44, 100672. [Google Scholar] [CrossRef]
  59. Essa, Y.H.; Hirschi, M.; Thiery, W.; El-Kenawy, A.M.; Yang, C. Drought characteristics in Mediterranean under future climate change. npj Clim. Atmos. Sci. 2023, 6, 133. [Google Scholar] [CrossRef]
  60. Yuan, Y.; Bao, A.; Jiang, P.; Hamdi, R.; Termonia, P.; De Maeyer, P.; Guo, H.; Zheng, G.; Yu, T.; Prishchepov, A.V. Probabilistic assessment of vegetation vulnerability to drought stress in Central Asia. J. Environ. Manag. 2022, 310, 114504. [Google Scholar] [CrossRef]
  61. Porcelli, A.C.; Rubio, G.; Boem, G.H.F.; Lavado, R.S. The Effect of Water and Salt Stress on Paspalum dilatatum, a Constituent of Pampas Natural Grasslands. Phyton 2024, 93, 2009–2018. [Google Scholar] [CrossRef]
  62. Pettorelli, N.; Bühne, H.S.T.; Tulloch, A.; Dubois, G.; Macinnis-Ng, C.; Queirós, A.M.; Keith, D.A.; Wegmann, M.; Schrodt, F.; Stellmes, M.; et al. Satellite remote sensing of ecosystem functions: Opportunities, challenges, and way forward. Remote Sens. Ecol. Conserv. 2018, 4, 71–93. [Google Scholar] [CrossRef]
  63. Allen, C.D.; Breshears, D.D.; McDowell, N.G. On underestimation of global vulnerability to tree mortality and forest die-off from hotter drought in the Anthropocene. Ecosphere 2020, 6, 1–55. [Google Scholar] [CrossRef]
  64. AghaKouchak, A.; Chiang, F.; Huning, L.S.; Love, C.A.; Mallakpour, I.; Mazdiyasni, O.; Moftakhari, H.; Papalexiou, S.M.; Ragno, E.; Sadegh, M. Climate extremes and compound hazards in a warming world. Annu. Rev. Earth Planet. Sci. 2020, 48, 519–548. [Google Scholar] [CrossRef]
Figure 1. Study area with land-use distribution in 2020.
Remotesensing 17 01780 g001
Figure 2. Annual and seasonal variations of NDVI values and MK values. Note: (a) spring variations of NDVI values; (a’) spring variations of MK values; (b) summer variations of NDVI values; (b’) summer variations of MK values; (c) autumn variations of NDVI values; (c’) autumn variations of MK values; (d) winter variations of NDVI values; (d’) winter variations of MK values; (e) annual variations of NDVI values; (e’) annual variations of MK values.
Remotesensing 17 01780 g002
Figure 3. Spatial distribution of annual and seasonal NDVI variations for vegetation. Note: (a) spatial distribution of spring NDVI variations for vegetation according to slope; (a’) spatial distribution of spring NDVI variations for vegetation according to significance; (b) spatial distribution of summer NDVI variations for vegetation according to slope; (b’) spatial distribution of summer NDVI variations for vegetation according to significance; (c) spatial distribution of autumn NDVI variations for vegetation according to slope; (c’) spatial distribution of autumn NDVI variations for vegetation according to significance; (d) spatial distribution of winter NDVI variations for vegetation according to slope; (d’) spatial distribution of winter NDVI variations for vegetation according to significance; (e) spatial distribution of annual NDVI variations for vegetation according to slope; (e’) spatial distribution of annual NDVI variations for vegetation according to significance.
Remotesensing 17 01780 g003
Figure 4. Annual and seasonal variation characteristics of SPEI values and MK values. Note: (a) spring variations of SPEI values; (a’) spring variations of MK values; (b) summer variations of SPEI values; (b’) summer variations of MK values; (c) autumn variations of SPEI values; (c’) autumn variations of MK values; (d) winter variations of SPEI values; (d’) winter variations of MK values; (e) annual variations of SPEI values; (e’) annual variations of MK values.
Remotesensing 17 01780 g004
Figure 5. Spatial distribution of annual and seasonal SPEI variations. Note: (a) spatial distribution of spring SPEI variations for vegetation according to slope; (a’) spatial distribution of spring SPEI variations for vegetation according to significance; (b) spatial distribution of summer SPEI variations for vegetation according to slope; (b’) spatial distribution of summer SPEI variations for vegetation according to significance; (c) spatial distribution of autumn SPEI variations for vegetation according to slope; (c’) spatial distribution of autumn SPEI variations for vegetation according to significance; (d) spatial distribution of winter SPEI variations for vegetation according to slope; (d’) spatial distribution of winter SPEI variations for vegetation according to significance; (e) spatial distribution of annual SPEI variations for vegetation according to slope; (e’) spatial distribution of annual SPEI variations for vegetation according to significance.
Remotesensing 17 01780 g005
Figure 6. Spatial distribution of correlation coefficients and significance levels between NDVI and SPEI by 1-month, 6-month, and 1-year-lag time scales. Note: (a) spatial distribution of correlation coefficients between NDVI and SPEI by 1-month-lag time scales; (a’) spatial distribution of significance levels between NDVI and SPEI by 1-month-lag time scales; (b) spatial distribution of correlation coefficients between NDVI and SPEI by 6-month-lag time scales; (b’) spatial distribution of significance levels between NDVI and SPEI by 6-month-lag time scales; (c) spatial distribution of correlation coefficients between NDVI and SPEI by 1-year-lag time scales; (c’) spatial distribution of significance levels between NDVI and SPEI by 1-year-lag time scales.
Remotesensing 17 01780 g006
Figure 7. Spatial distribution of correlation coefficients and significance levels between NDVI and SPEI across seasons and years. Note: (a) spatial distribution of correlation coefficients between NDVI and SPEI across spring; (a’) spatial distribution of significance levels between NDVI and SPEI across spring; (b) spatial distribution of correlation coefficients between NDVI and SPEI across summer; (b’) spatial distribution of significance levels between NDVI and SPEI across summer; (c) spatial distribution of correlation coefficients between NDVI and SPEI across autumn; (c’) spatial distribution of significance levels between NDVI and SPEI across autumn; (d) spatial distribution of correlation coefficients between NDVI and SPEI across winter; (d’) spatial distribution of significance levels between NDVI and SPEI across winter; (e) spatial distribution of correlation coefficients between NDVI and SPEI across annual; (e’) spatial distribution of significance levels between NDVI and SPEI across annual.
Remotesensing 17 01780 g007
Figure 8. Spatial distribution of resistance and resilience indices of vegetation response to drought. Note: (a) spatial distribution of resistance indices of vegetation response to drought; (a’) spatial distribution of resilience indices of vegetation response to drought. Vegetation’s resistance and resilience were higher as the two indices increased.
Remotesensing 17 01780 g008
Table 1. Classification of SPEI values.
Drought SeveritySPEI Values
Near normal(−0.5, + ]
Light drought(−1.0, −0.5 ]
Moderate drought(−1.5, −1.0 ]
Severe drought(−2.0, −1.5 ]
Extreme drought( , −2.0 ]
Table 2. Significance level of annual and seasonal NDVI variations for vegetation.
AnnualSpringSummerAutumnWinter
Sen slope (/a)0.001790.00998 *0.00420 *0.00208 *0.00022
MK test1.699692.099132.518962.029160.34985
Note: * means that it passed the significance level test of 0.05.
Table 3. Significance level of annual and seasonal SPEI variations.
AnnualSpringSummerAutumnWinter
Sen slope (/a)0.027420.013440.045750.07995 *−0.00591
MK test1.539360.209911.329452.37902−0.06997
Note: * means that it passed the significance level test of 0.05.
Disclaimer/Publisher’s Note: The statements, opinions and data contained in all publications are solely those of the individual author(s) and contributor(s) and not of MDPI and/or the editor(s). MDPI and/or the editor(s) disclaim responsibility for any injury to people or property resulting from any ideas, methods, instructions or products referred to in the content.

