


Environmental Influence on NbS (Nature-Based Solution) Mitigation of Diurnal Surface Urban Heat Islands (SUHI)


Abstract
1. Introduction
2. Material and Methods
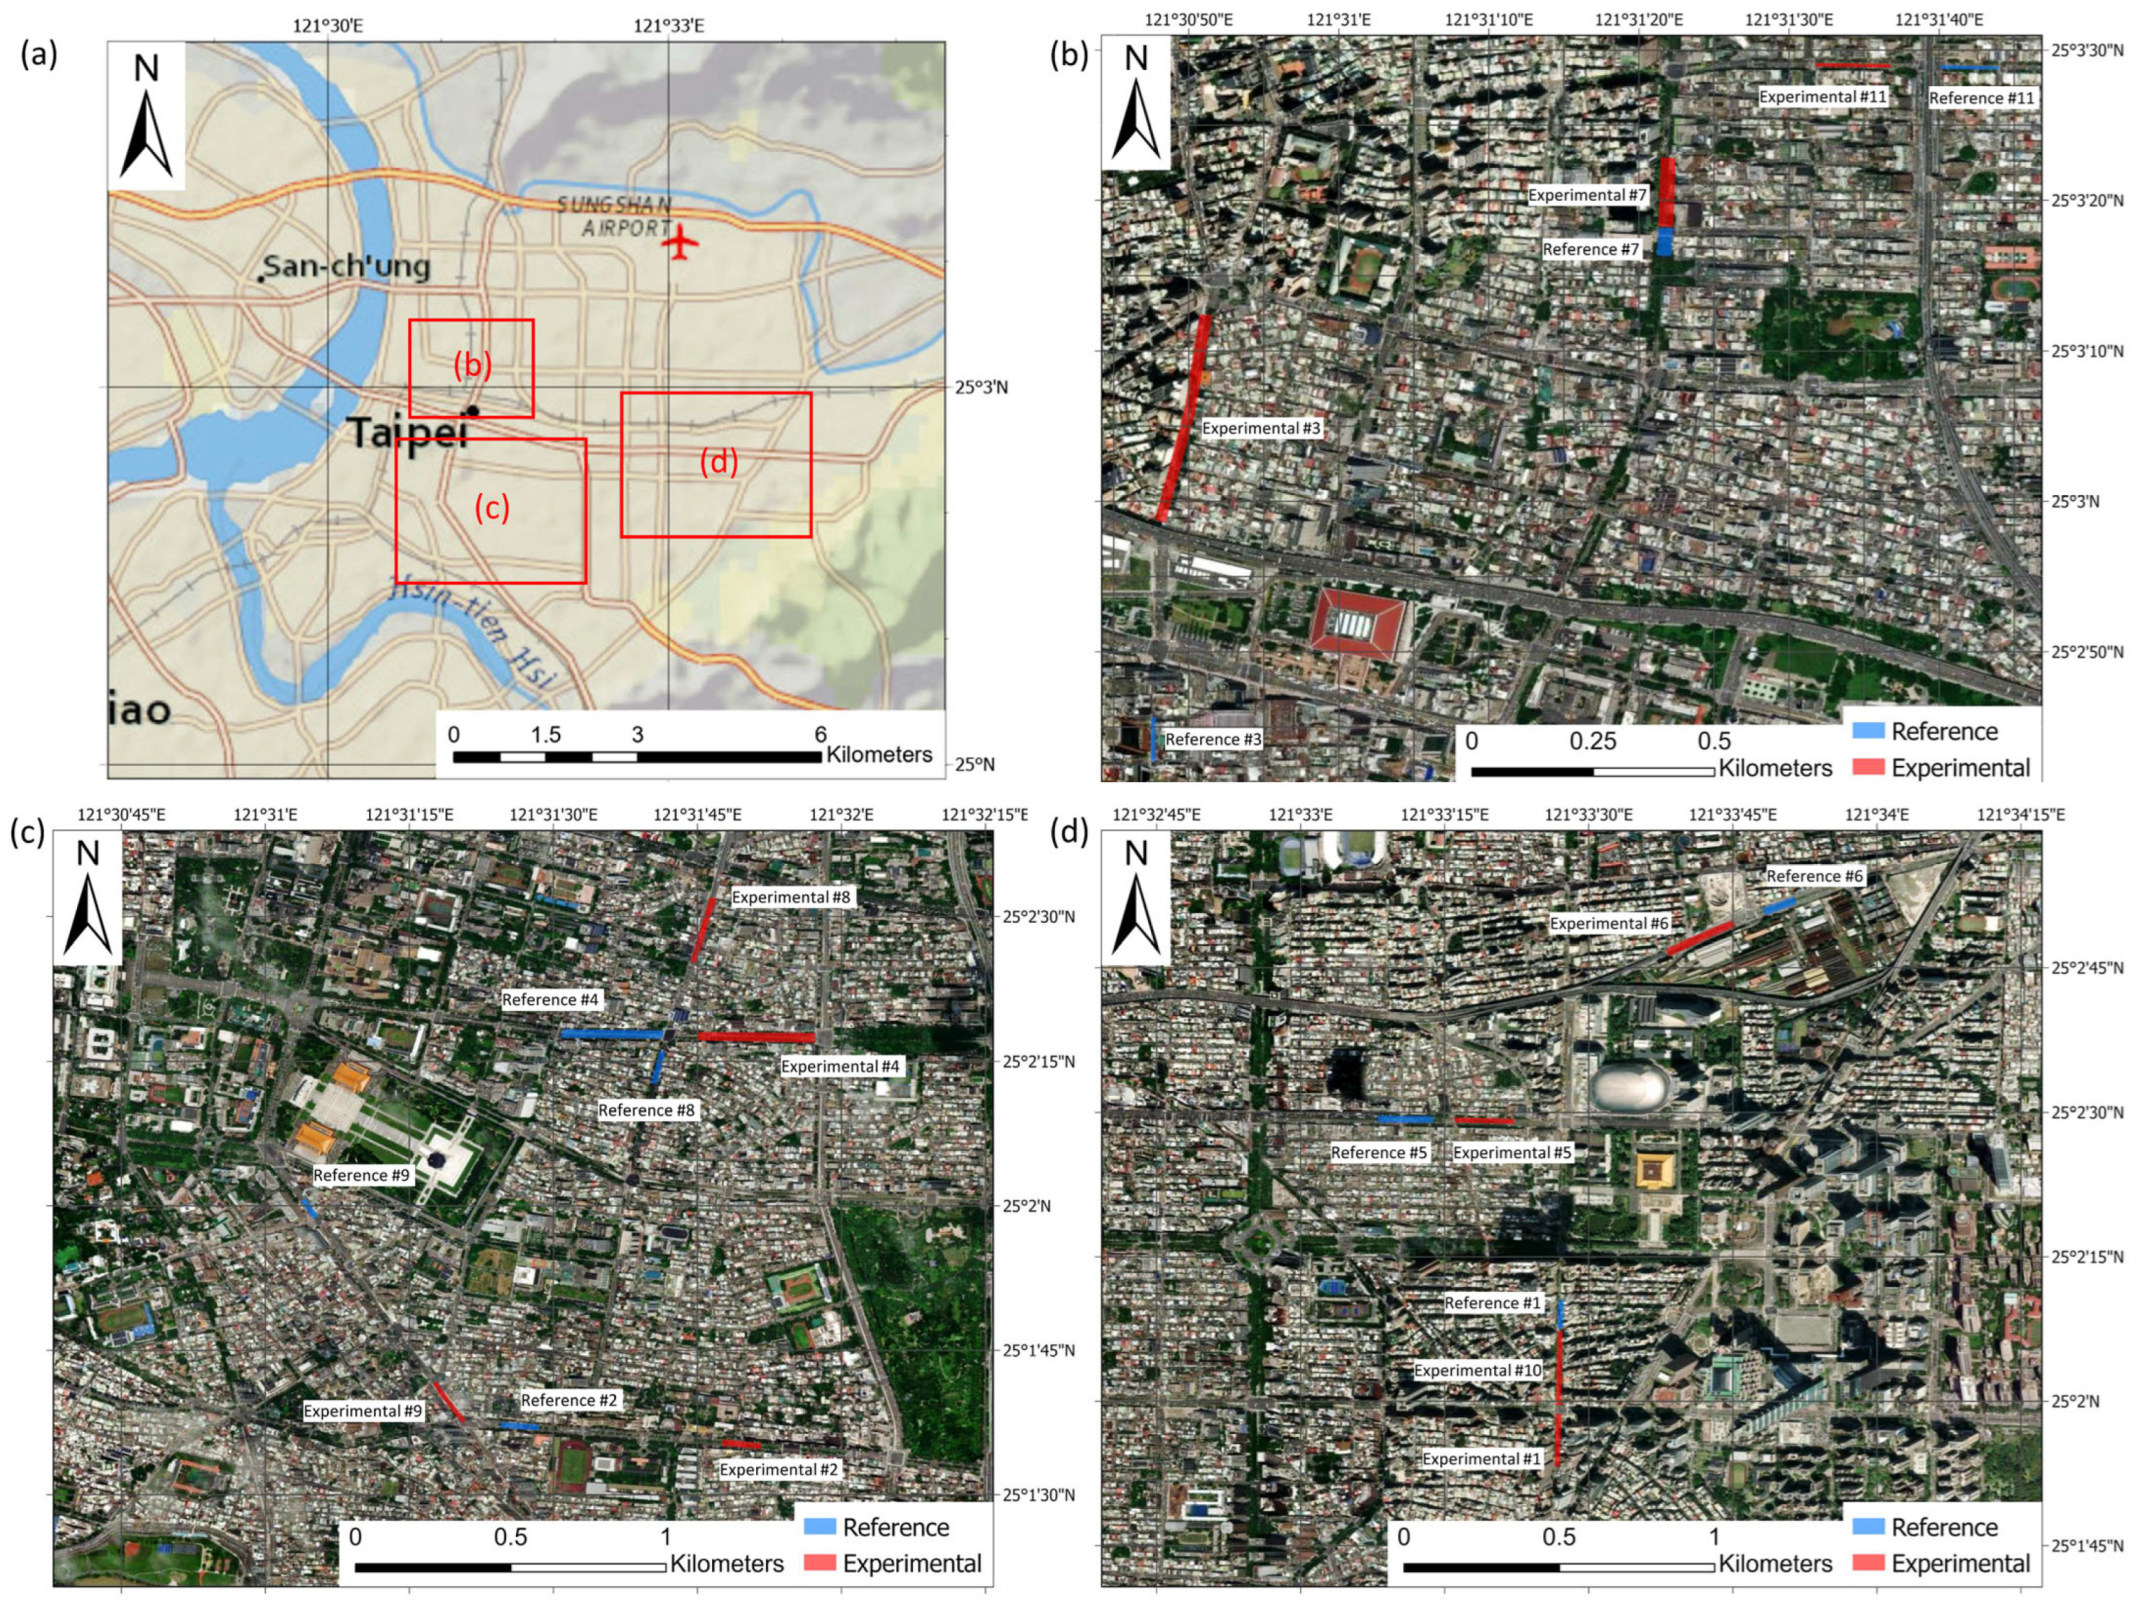
2.1. Site Description
2.2. Data Sources
2.3. Methodology
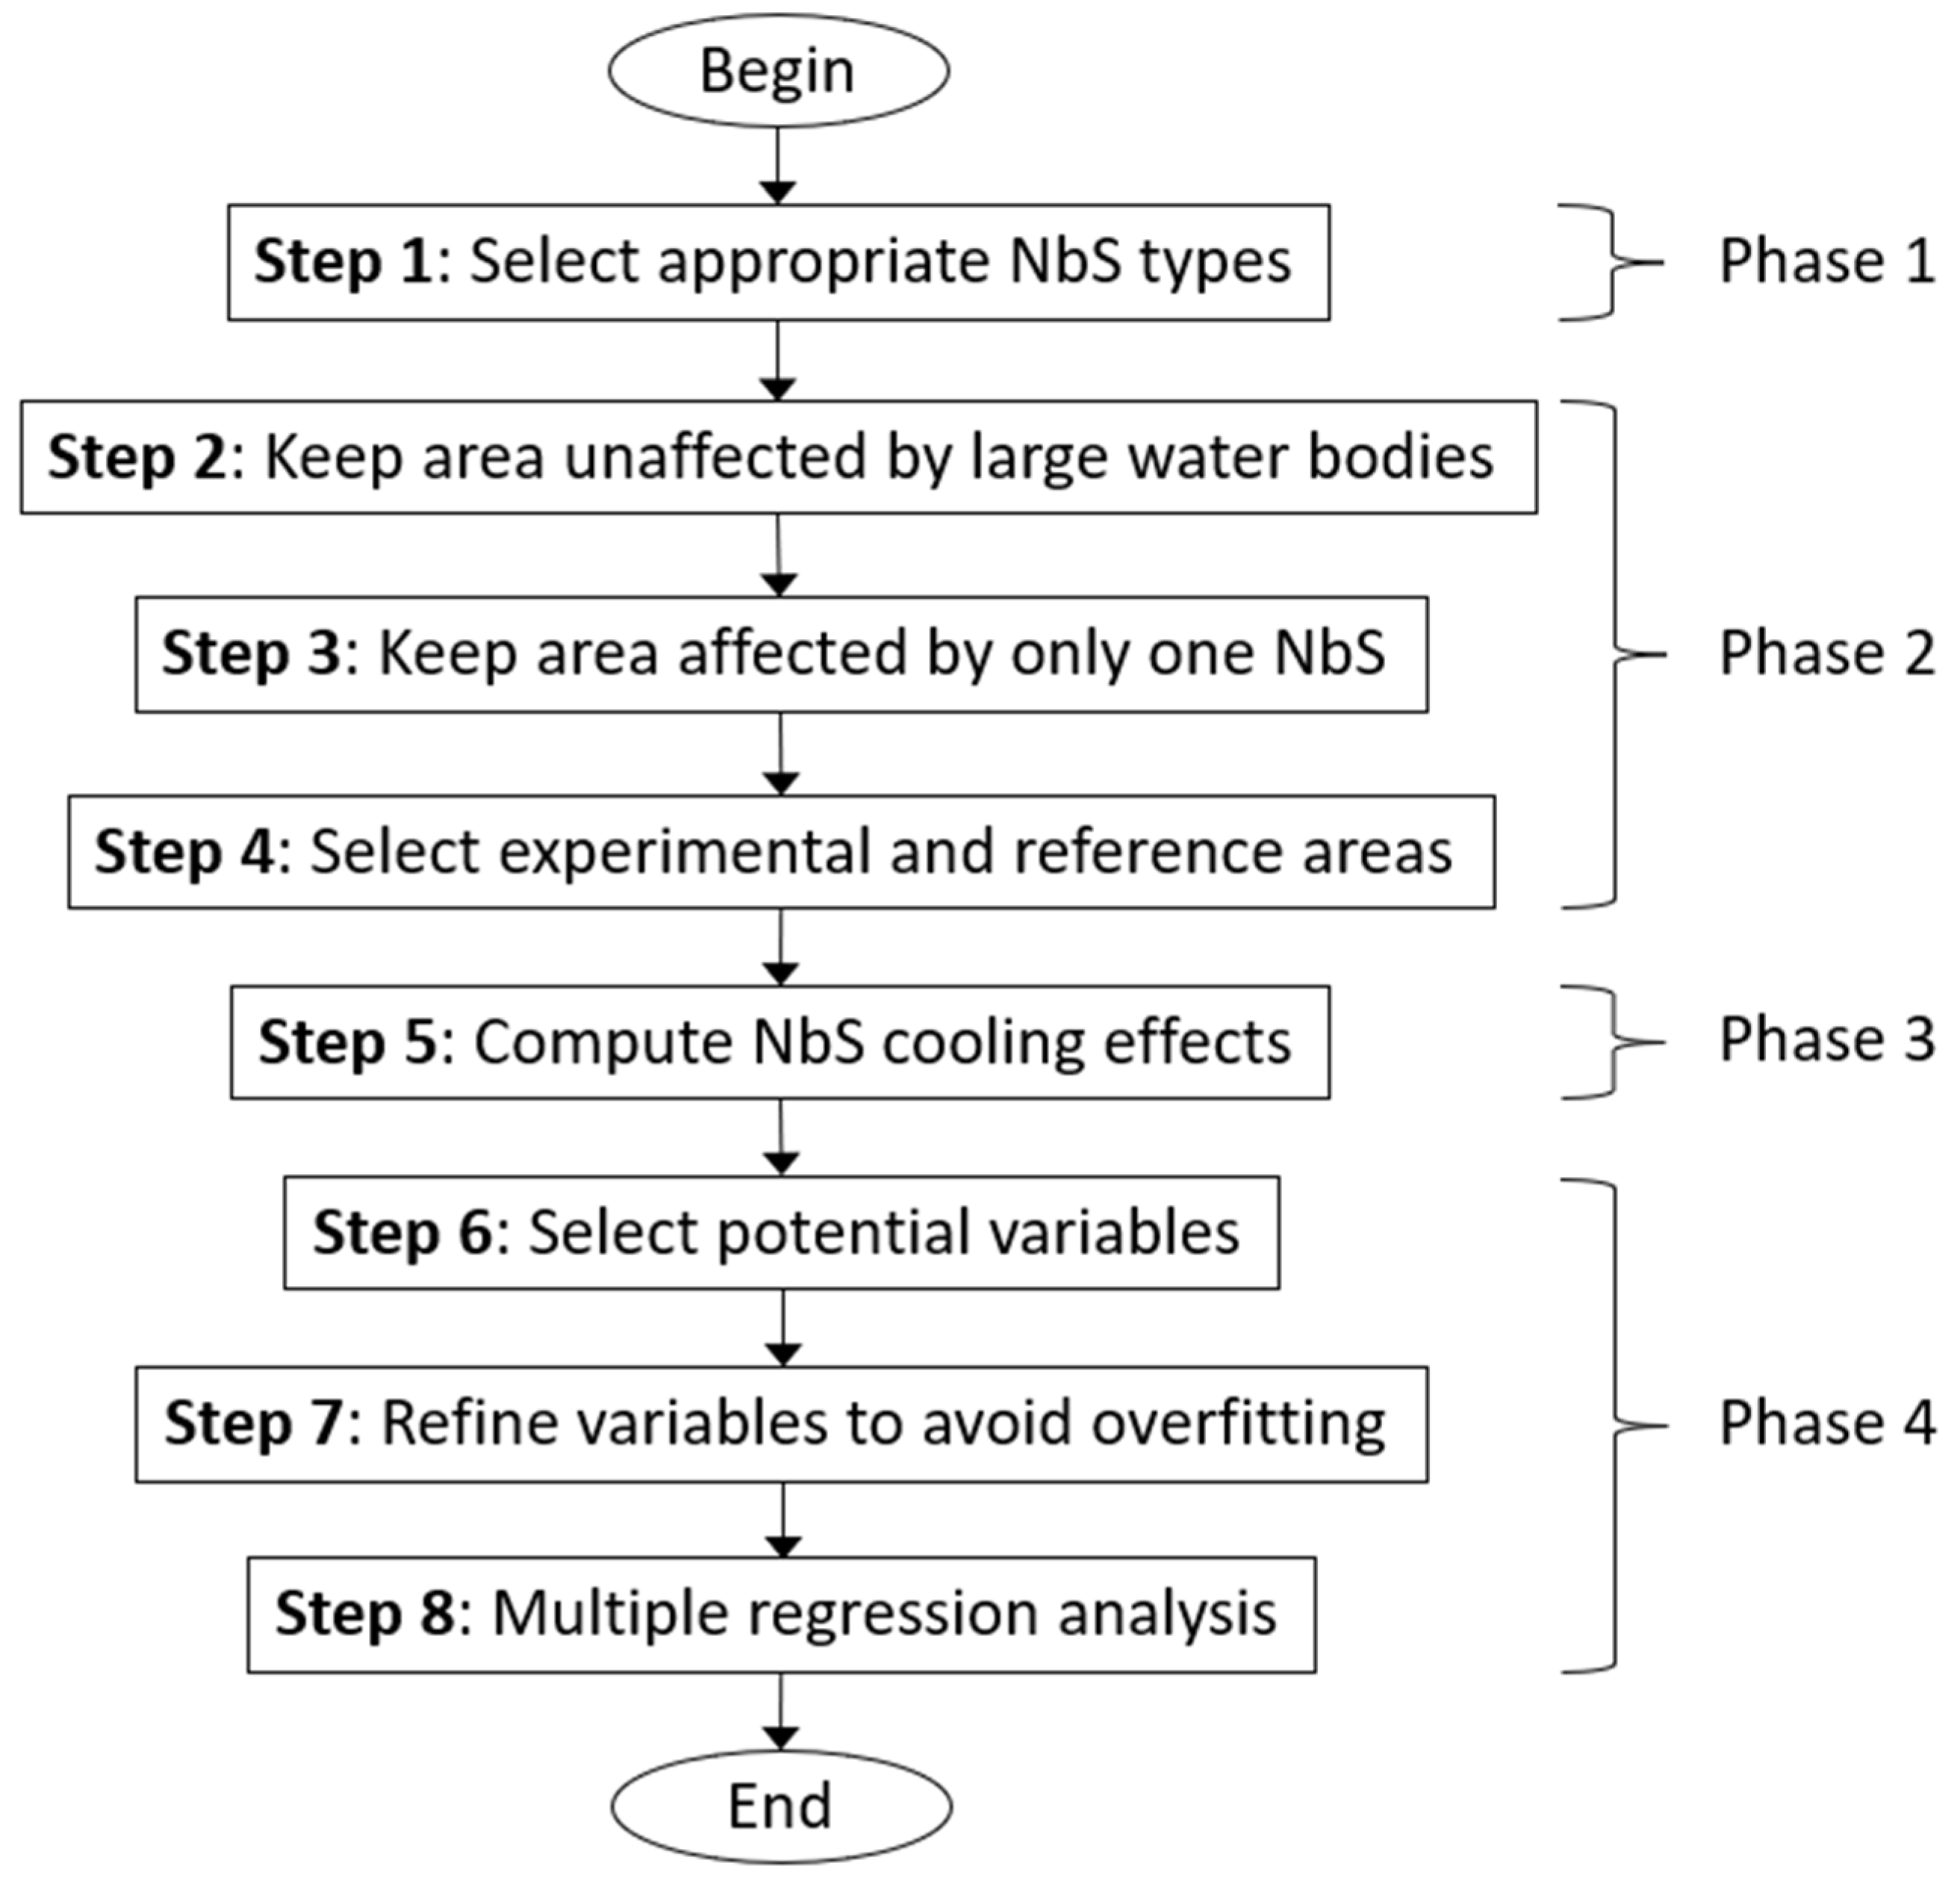
2.3.1. Research Steps
- (1)
- Step 2 kept areas unaffected by large waterbodies. Large waterbodies can cool the surrounding areas up to 740 m [30]. Therefore, this study excluded areas within 780 m of rivers from subsequent analysis.
- (2)
- Step 3 kept areas affected by only one NbS device. Fernández [9] determined that the horizontal temperature influence of green space can reach as far as 200 m. This study assumes an influential radius of green infrastructure as 180 m. Based on this assumed influential radius, areas influenced by more than one NbS were eliminated from the analysis, so any cooling effect can be confidently tagged to a single NbS.
- (3)
- Step 4 selected experimental and reference areas. After the previous steps, two kinds of areas are left: affected by only one NbS, or unaffected by any NbS. “Experimental areas” were selected from the former areas, and “reference areas” were selected from the latter, with the following criteria being observed:
- (a)
- Only street areas were selected;
- (b)
- Each experimental area has an NbS adjacent to its center;
- (c)
- For each experimental area, a reference area must be available nearby.
- (1)
- (2)
- Step 7 (refine variables to avoid overfitting): The current study adopted the hybrid forward-selection procedure proposed by Tu et al. [42], which considers both p-values and VIF (variance inflation factor) of variables added into a multiple regression model to prevent the model from overfitting. No transformations were applied to the variables, and the thresholds (VIF: 10, p-value: 0.25) used by Tu et al. [42] were adopted.
- (3)
- Step 8 (multiple regression analysis): This step derived the contribution of individual variables to the cooling capacity with multiple linear regression equations. The coefficient signs in the equations represent the trends (positive or negative correlations) of the variables’ influences on the cooling capacities of green infrastructure. The influence of each variable was computed by the method reported by Judd et al. [43] and Tu et al. [42], based on the proportional change of goodness-of-fit if the variable of interest was removed from the equation.
2.3.2. Scenarios Analyzed
- (1)
- Comprehensive: All available data.
- (2)
- Hot season: Because the summer SUHI was the primary concern in subtropical Taiwan, hot season (April to September) data were further scrutinized.
- (3)
- Different street patterns: Many cities incorporated both old and new districts. Old districts usually grew organically, with newer districts exhibiting gridded street patterns. The current study hypothesized that the cooling of NbSs was affected by nearby street patterns. The street patterns were determined by the coefficient of street complexness, whose calculation can be explained by Figure 4. Centering on each experimental area, an “area of interest” spanning a 300 m radius was drawn. Two main boulevards which are perpendicular (or nearly perpendicular) to each other can be selected in each area of interest. For Street segment (small streets within street blocks) k, two angles can be formed with the boulevards, and the smaller one was selected as to represent that street segment. For example, represents Street segment 1 and represents Street segment 2 in Figure 4. If the street segments and/or boulevards are not straight within the area of interest, is determined by their averaged directions within the area of interest. Within the area of interest, the length the Street segment k is . The coefficient of street complexness is defined as in Equation (2):
3. Results
4. Discussion
4.1. Summary of Seasonal Data
4.2. Comparing the Comprehensive and Hot Season Models
- (1)
- The timeframe is too short: The timeframe of the current study is less than ten years, so the growth of trees might not be noticeable. Ziter et al. [50] found that tree canopy provides nonlinear cooling effects, so that a significant cooling effect shows only when the ratio of canopy cover is high. However, if this is the only reason, the cooling effects should be kept steady, not degrade.
- (2)
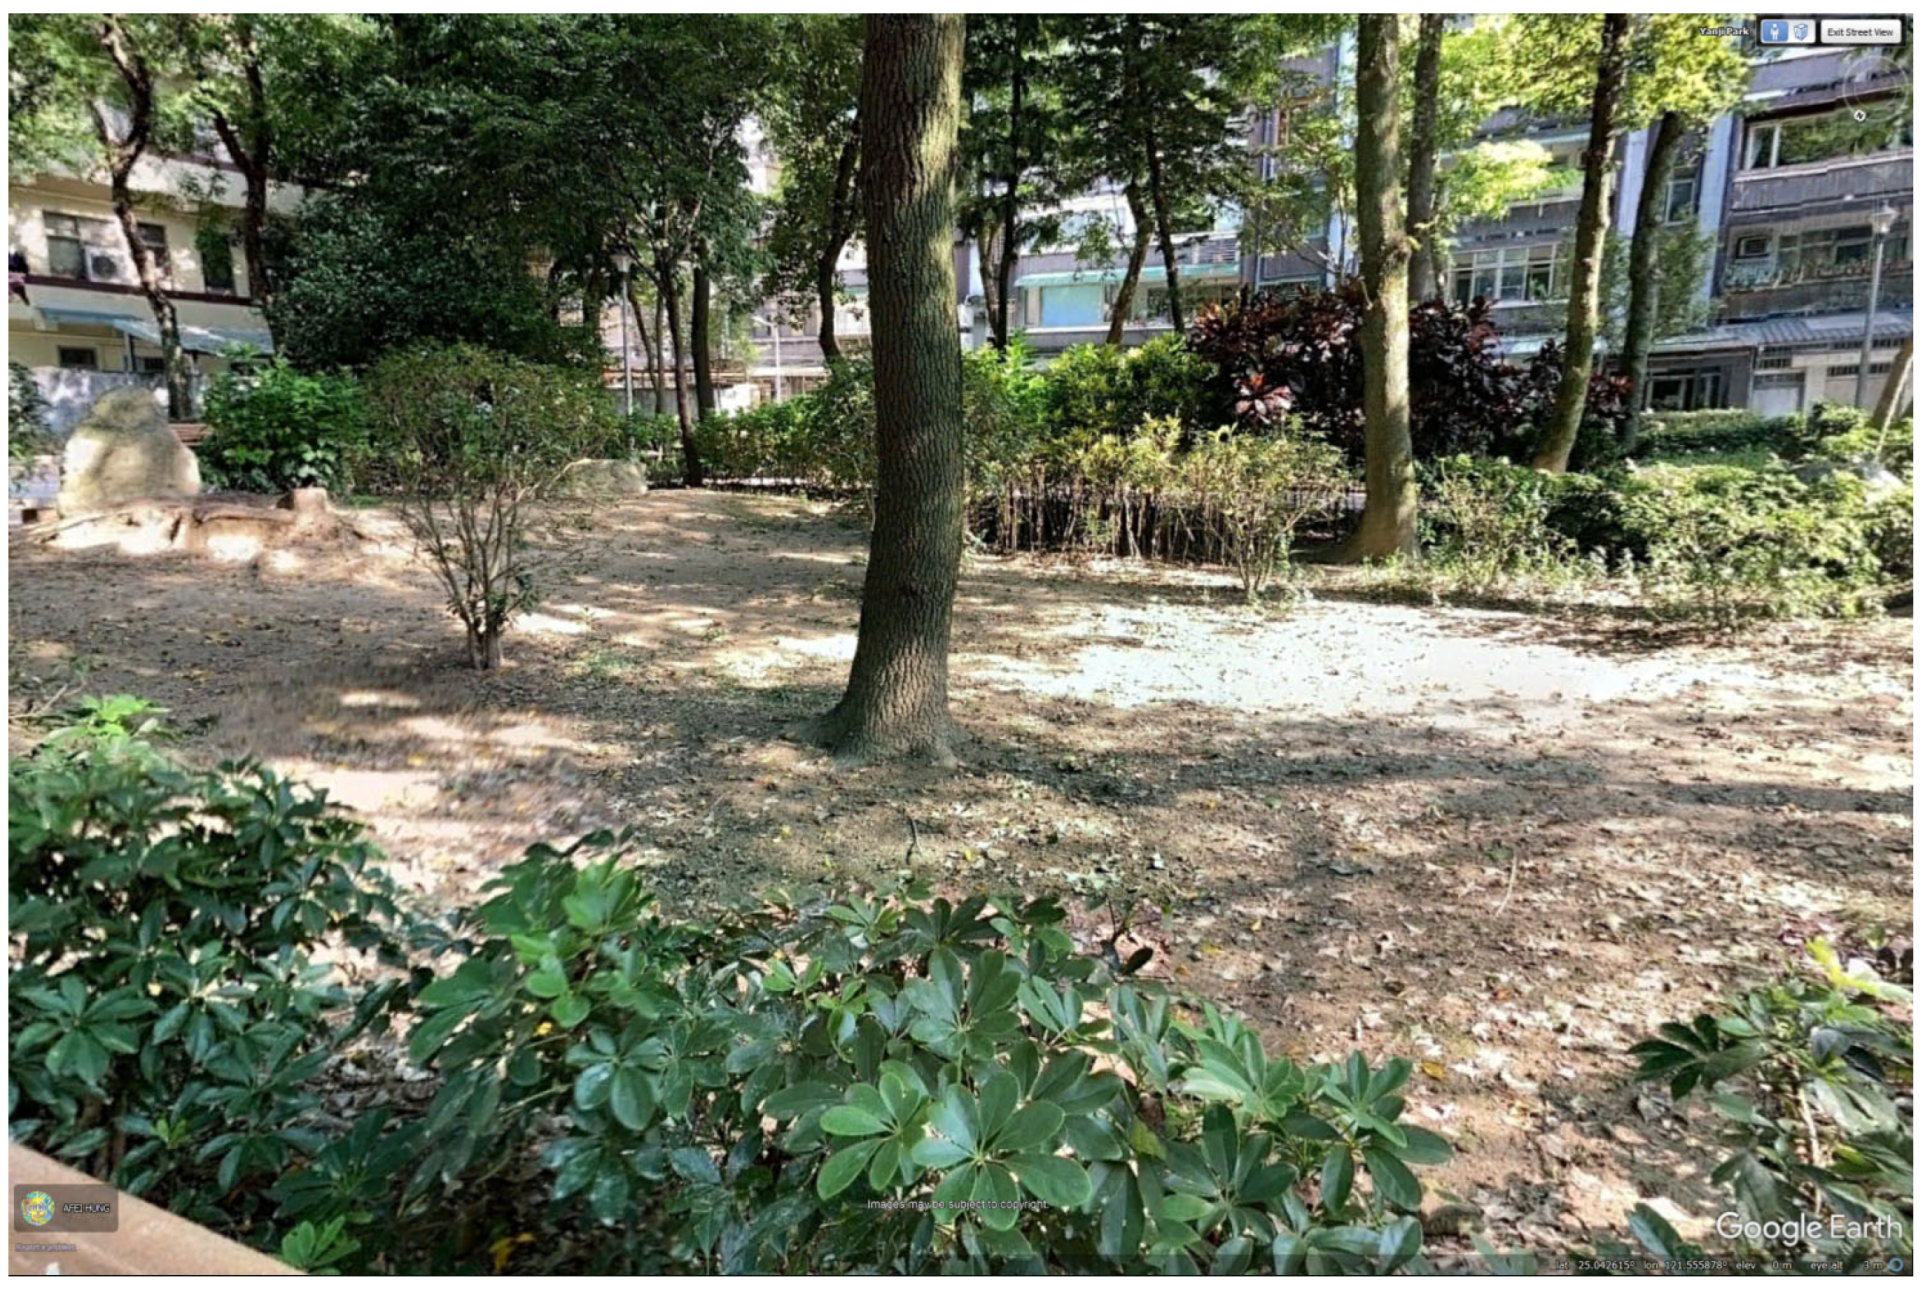
- Intensive utilization: Due to the ultra-high population density, parks serve as residents’ only outdoor recreation space. The authors’ observation is that the understory vegetation of many parks in Taipei City had worn down quickly over time. Figure 5 below shows the understory condition of NbS #5.
- (3)
- Lack of maintenance of permeable surfaces: Moreover, Taipei City had not developed a schedule for permeable surface maintenance (personal communication with the Public Works Department of Taipei City Government), which means that the permeable surface might become clogged over time, reducing its water infiltration, and thus its LST-reduction capabilities [52].
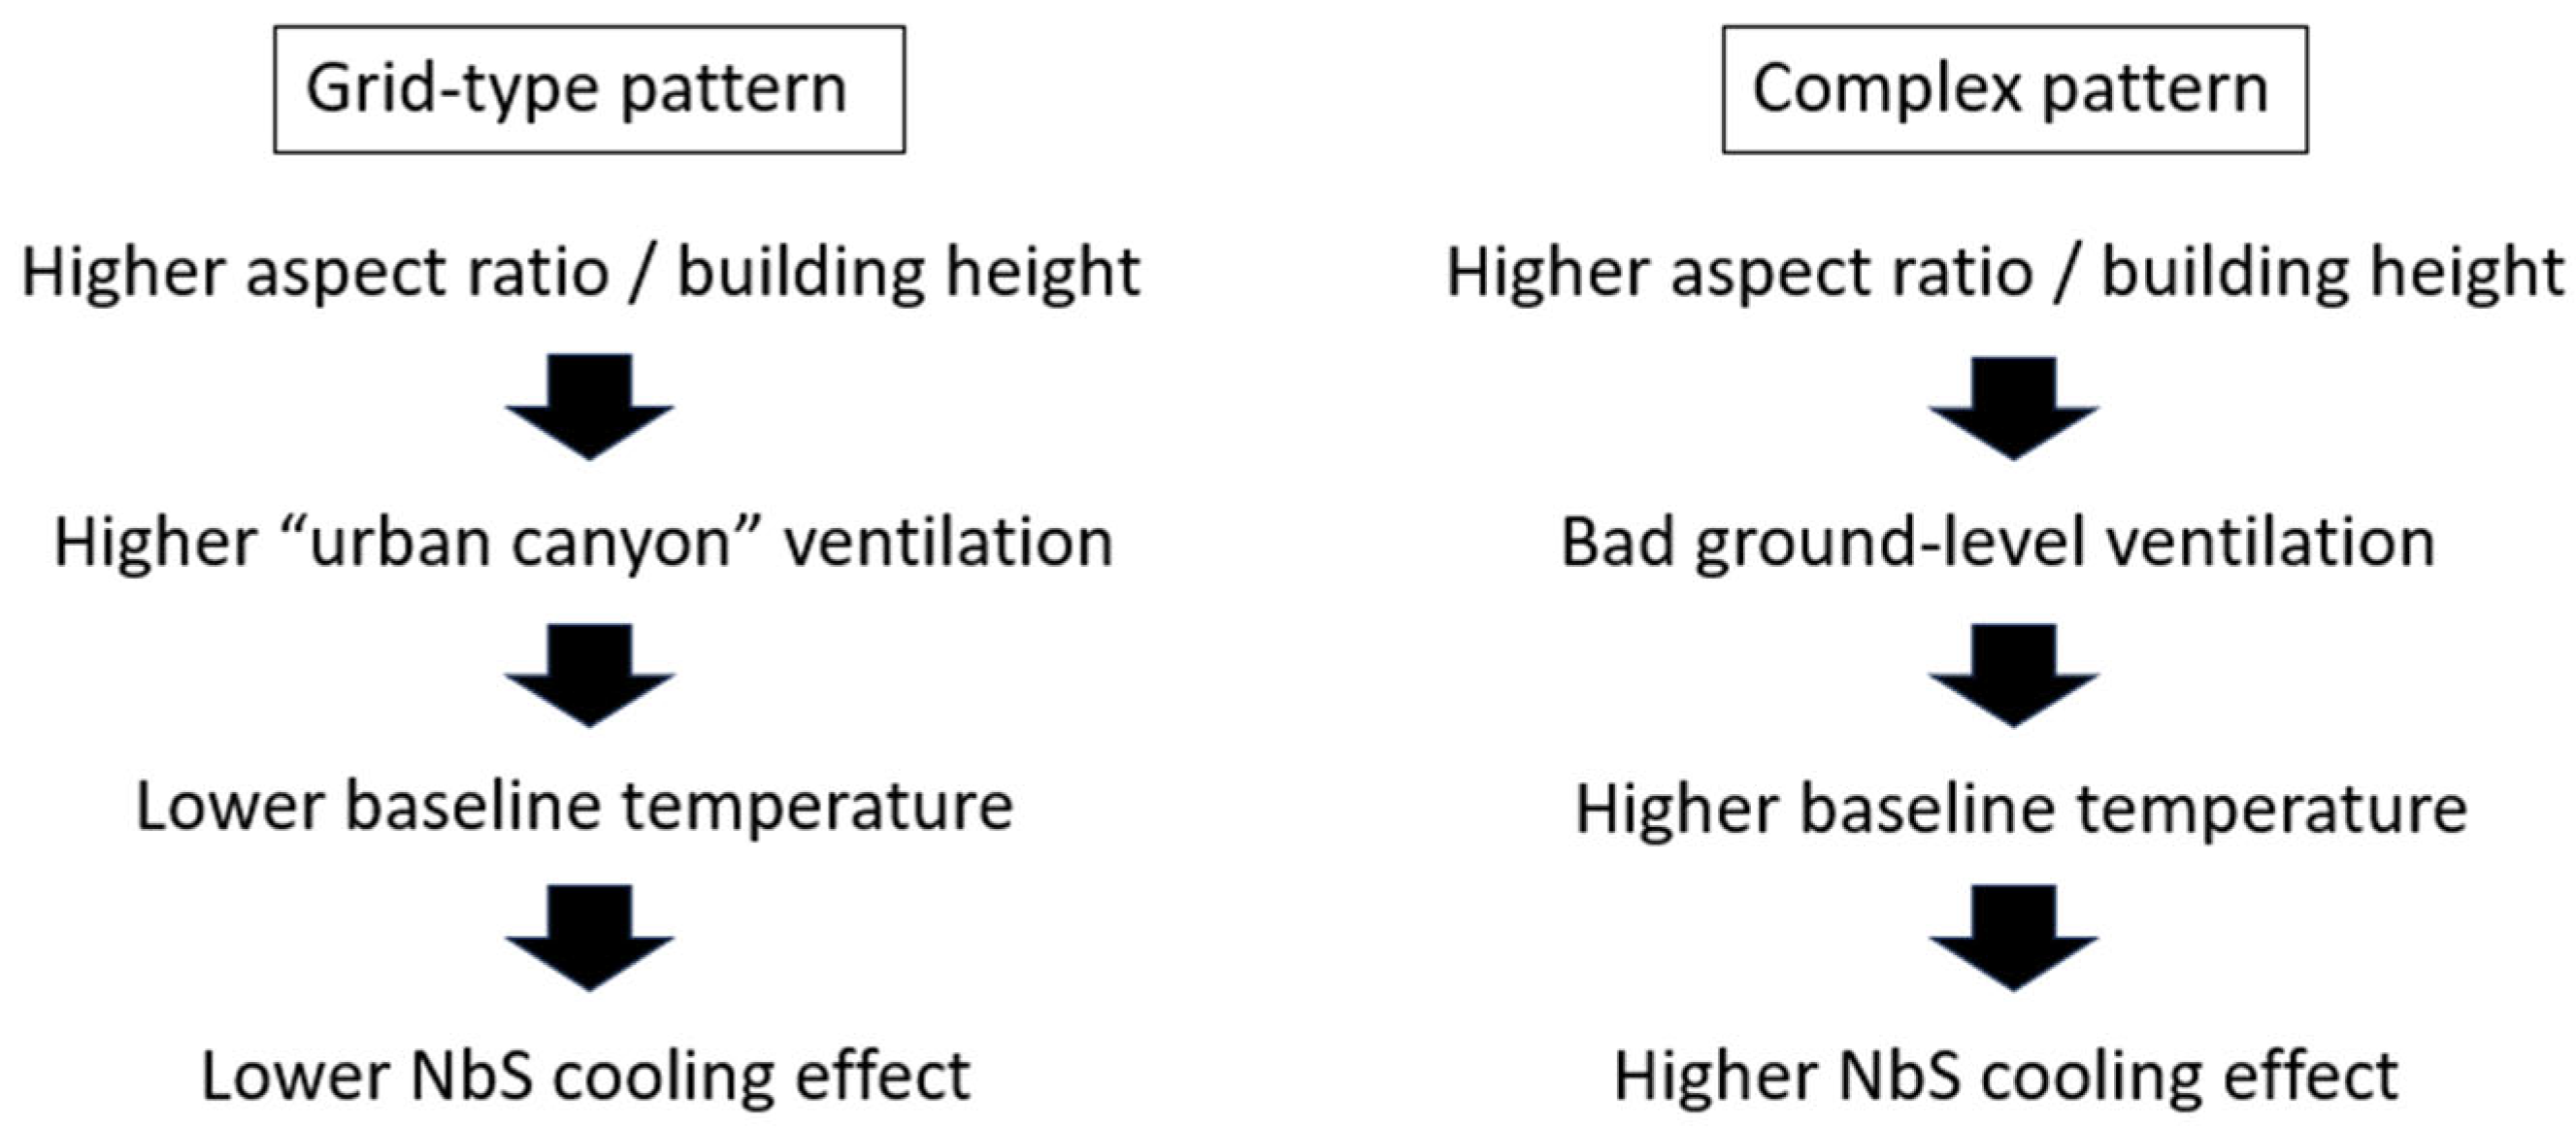
4.3. Comparing Models with Grid-Type and Complex Street Patterns
4.4. The Effect of Distance Across Scenarios
5. Conclusions
- The distance to NbS () is important to the cooling effect in most situations. On the other hand, the area of NbS () is not as crucial. Balany et al. [7] indicated that the effect of an increased NbS area is often insignificant and non-linear. This finding implies that having small NbS devices distributed evenly can generate better overall cooling effects compared to having larger NbS devices that are sparsely placed, if the same total NbS area is the same. This is even more crucial to older districts where the NbS cooling effect cannot reach far because of the complex street patterns.
- 2.
- When the street pattern is highly regulated (grid-type), NbSs might not be the primary cooling mechanism. It was hypothesized in this study that wind concentrated by the urban canyon provided the most cooling effects. On the other hand, NbSs are important for cooling districts with complex street patterns. When resources are limited, NbS planning should be focused on older districts with complex patterns, not newer districts with grid-like patterns.
- 3.
- Probably due to localized NbS cooling in districts with complex patterns, NbS cooling is sensitive to several variables. NbSs that are larger (higher ), newer (lower ), with better vegetation conditions (higher ), and closer to the observer (lower ) have higher cooling capacity. NbS installation in those districts needs careful planning to maximize the efficiency of the engineering investment.
- 4.
- The results imply that NbS maintenance is crucial for sustaining the cooling function of NbSs. The importance of maintenance has also been highlighted by past studies [55].
Author Contributions
Funding
Data Availability Statement
Conflicts of Interest
References
- Kim, S.W.; Brown, R.D. Urban heat island (UHI) intensity and magnitude estimations: A systematic literature review. Sci. Total Environ. 2021, 779, 146389. [Google Scholar] [CrossRef]
- Khare, V.R.; Vajpai, A.; Gupta, D. A big picture of urban heat island mitigation strategies and recommendation for India. Urban Clim. 2021, 37, 100845. [Google Scholar] [CrossRef]
- Amani, M.J.; Tanzadeh, R.; Nejad, F.M.; Nasrabad, M.M.K.; Chalanii, J.; Rad, M.M. Urban Sustainability Through Pavement Technologies: Reducing Urban Heat Islands with Cool Pavements. Buildings 2025, 15, 504. [Google Scholar] [CrossRef]
- Wanniarachchi, C.T.; Singh, M.; Bari, K.; Bock, M.; Harvey, S.; Arjunan, A. A novel reflective material coated polyurethane resin-based porous composite paving material for mitigating urban heat island effect. Trans. IMF 2025, 103, 63–71. [Google Scholar] [CrossRef]
- Tu, M.-c.; Traver, R.G. Optimal Configuration of an Underdrain Delivery System for a Stormwater Infiltration Trench. J. Irrig. Drain Eng. 2019, 145, 05019007. [Google Scholar] [CrossRef]
- Qi, Y.; Chan, F.K.S.; Thorne, C.; O’Donnell, E.; Quagliolo, C.; Comino, E.; Pezzoli, A.; Li, L.; Griffiths, J.; Sang, Y.; et al. Addressing Challenges of Urban Water Management in Chinese Sponge Cities via Nature-Based Solutions. Water 2020, 12, 2788. [Google Scholar] [CrossRef]
- Balany, F.; Ng, A.W.M.; Muttil, N.; Muthukumaran, S.; Wong, M.S. Green Infrastructure as an Urban Heat Island Mitigation Strategy—A Review. Water 2020, 12, 3577. [Google Scholar] [CrossRef]
- Budzik, G.; Sylla, M.; Kowalczyk, T. Understanding Urban Cooling of Blue–Green Infrastructure: A Review of Spatial Data and Sustainable Planning Optimization Methods for Mitigating Urban Heat Islands. Sustainability 2025, 17, 142. [Google Scholar] [CrossRef]
- Fernández, I.C. A multiple-class distance-decaying approach for mapping temperature reduction ecosystem services provided by urban vegetation in Santiago deChile. Ecol. Econ. 2019, 161, 193–201. [Google Scholar] [CrossRef]
- Addas, A.; Goldblatt, R.; Rubinyi, S. Utilizing Remotely Sensed Observations to Estimate the Urban Heat Island Effect at a Local Scale: Case Study of a University Campus. Land 2020, 9, 191. [Google Scholar] [CrossRef]
- Halder, B.; Bandyopadhyay, J.; Khedher, K.M.; Fai, C.M.; Tangang, F.; Yaseen, Z.M. Delineation of urban expansion influences urban heat islands and natural environment using remote sensing and GIS-based in industrial area. Environ. Sci. Pollut. Res. 2022, 29, 73147–73170. [Google Scholar] [CrossRef] [PubMed]
- Bartesaghi-Koc, C.; Osmond, P.; Peters, A. Quantifying the seasonal cooling capacity of ‘green infrastructure types’ (GITs): An approach to assess and mitigate surface urban heat island in Sydney, Australia. Landsc. Urban Plan. 2020, 203, 103893. [Google Scholar] [CrossRef]
- Marando, F.; Salvatori, E.; Sebastiani, A.; Fusaro, L.; Manes, F. Regulating Ecosystem Services and Green Infrastructure: Assessment of Urban Heat Island effect mitigation in the municipality of Rome, Italy. Ecol. Model. 2019, 392, 92–102. [Google Scholar] [CrossRef]
- Yu, X.; Liu, Y.; Zhang, Z.; Xiao, R. Influences of buildings on urban heat island based on 3D landscape metrics: An investigation of China’s 30 megacities at micro grid-cell scale and macro city scale. Landsc. Ecol. 2021, 36, 2743–2762. [Google Scholar] [CrossRef]
- Huang, J.; Wang, Y. Cooling intensity of hybrid landscapes in a metropolitan area: Relative contribution and marginal effect. Sustain. Cities Soc. 2022, 79, 103725. [Google Scholar] [CrossRef]
- Central Weather Bureau. Central Weather Bureau. 2025. Available online: https://www.cwa.gov.tw/eng/ (accessed on 28 March 2025).
- National Taiwan Normal University. The Climate of Taiwan. 2001. Available online: http://twgeog.ntnugeog.org/en/climatology/ (accessed on 28 March 2025).
- Google Earth. 25.08°N, 121.54°E, Elevation 67 km. 2025. Available online: http://www.google.com/earth/index.html (accessed on 28 March 2025).
- Google Earth. 24.36°N, 119.62°E, Elevation 3510 km. 2025. Available online: http://www.google.com/earth/index.html (accessed on 28 March 2025).
- City Mayors. The Largest Cities in the World by Land Area, Population and Density. 2007. Available online: http://www.citymayors.com/statistics/largest-cities-density-125.html (accessed on 28 March 2025).
- Urban Planning Association of the ROC. Compatible Use and Classification Study of Urban Residential Areas (Translated Title). 1980. Available online: https://ws.moi.gov.tw/Download.ashx?u=LzAwMS9VcGxvYWQvT2xkRmlsZV9BYnJpX0dvdi9yZXNlYXJjaC8zMzQvMTQ0NzkyOTc5NzEucGRm&n=Y29tcGxldGUucGRm (accessed on 28 March 2025).
- Taipei City Government. City Government News (Translated Title). 2005. Available online: https://www.gov.taipei/News_Content.aspx?n=F0DDAF49B89E9413&sms=72544237BBE4C5F6&s=3D047672A577B7FA (accessed on 28 March 2025).
- Chang, C.-R.; Li, M.-H.; Chang, S.-D. A preliminary study on the local cool-island intensity of Taipei city parks. Landsc. Urban Plan. 2007, 80, 386–395. [Google Scholar] [CrossRef]
- Central News Agency. The Taipei Basin Is Getting Hotter Due to The Heat Island Phenomenon (Translated Title). 2023. Available online: https://www.cna.com.tw/news/ahel/202307160030.aspx (accessed on 28 March 2025).
- United States Geological Survey. Landsat Collection 2 Level-2 Science Products. Available online: https://www.usgs.gov/landsat-missions/landsat-collection-2-level-2-science-products (accessed on 28 March 2025).
- Water Resources Agency. Hydrological GIS Service Platform (Translated Title). 2025. Available online: https://gic.wra.gov.tw/Gis/Gic/API/Google/Index.aspx (accessed on 28 March 2025).
- National Land Surveying and Mapping Center. Taiwan Map Service. 2020. Available online: https://maps.nlsc.gov.tw/ (accessed on 28 March 2025).
- Taipei City Urban Development Department. Historical Data GIS (Translated Title). 2025. Available online: https://www.historygis.udd.gov.taipei (accessed on 28 March 2025).
- Taipei City Government. Taipei Green Map (Translated Title). 2024. Available online: https://data.taipei/dataset/detail?id=5b277432-f534-4d09-a24c-d3f6b514e042 (accessed on 28 March 2025).
- Du, H.; Song, X.; Kan, Z.; Wang, Z.; Cai, Y. Research on the cooling island effects of water body: A case study of Shanghai, China. Ecol. Indic. 2016, 67, 31–38. [Google Scholar] [CrossRef]
- ESRI. ArcGIS Pro: Release 3.4.3; Environmental Systems Research Institute: Redlands, CA, USA, 2025. [Google Scholar]
- Zhang, Y.; Qin, H.; Zhang, J.; Hu, Y. An in-situ measurement method of evapotranspiration from typical LID facilities based on the three-temperature model. J. Hydrol. 2020, 588, 125105. [Google Scholar] [CrossRef]
- Aram, F.; Garcia, E.H.; Solgi, E.; Mansournia, S. Urban green space cooling effect in cities. Heliyon 2019, 5, e01339. [Google Scholar] [CrossRef]
- Karimi, A.; Mohammad, P.; Garcia-Martinez, A.; Moreno-Rangel, D.; Gachkar, D.; Gachkar, S. New developments and future challenges in reducing and controlling heat island effect in urban areas. Environ. Dev. Sustain. 2023, 25, 10485–10531. [Google Scholar] [CrossRef]
- Georgakis, C.; Zoras, S.; Santamouris, M. Studying the Effect of “Cool” Coatings in Street Urban Canyons and Its Potential as a Heat Island Mitigation Technique. Sustain. Cities Soc. 2014, 13, 20–31. [Google Scholar] [CrossRef]
- Zhu, S.; Yan, Y.; Zhao, B.; Wang, H. Assessing the impact of adjacent urban morphology on street temperature: A multisource analysis using random forest and SHAP. Build. Environ. 2025, 267, 112326. [Google Scholar] [CrossRef]
- Rajagopalan, R.; Lim, K.C.; Jamei, E. Urban heat island and wind flow characteristics of a tropical city. Sol. Energy 2014, 107, 159–170. [Google Scholar] [CrossRef]
- Hsieh, C.-m.; Huang, H.-c. Mitigating urban heat islands: A method to identify potential wind corridor for cooling and ventilation. Comput. Environ. Urban Syst. 2016, 57, 130–143. [Google Scholar] [CrossRef]
- Rana, D.P.; Tripathi, A.; Siddiqui, S.S.; Sabahat, S.; Chattopadhaya, R.; Munshi, S. Exploring the Interplay Between Urban Morphology and Microclimate in Urban Heat Island Formation. Int. Res. J. Adv. Eng. Manag. 2025, 3, 194–202. [Google Scholar]
- Tzavali, A.; Paravantis, J.P.; Mihalakakou, G.; Fotiadi, A.; Stigka, E. Urban heat island intensity: A literature review. Fresenius Environ. Bull. 2015, 24, 4537–4554. [Google Scholar]
- Tu, M.-c.; Chen, W.-j. Field Measurement of the Dynamic Interaction between Urban Surfaces and Microclimates in Humid Subtropical Climates with Multiple Sensors. Sensors 2023, 23, 9835. [Google Scholar] [CrossRef]
- Tu, M.-c.; Smith, P.; Filippi, A.M. Hybrid forward selection method based water quality estimation via combining Landsat TM, ETM+, and OLI/TIRS images and ancillary environmental data. PLoS ONE 2018, 13, e0201255. [Google Scholar] [CrossRef]
- Judd, C.M.; McClelland, G.H.; Ryan, C.S. Data Analysis: A Model Comparison Approach; Routledge: Abingdon, UK, 2008. [Google Scholar]
- Zardo, L.; Geneletti, D.; Perez-Soba, M.; Van Eupen, M. Estimating the cooling capacity of green infrastructures to support urban planning. Ecosyst. Serv. 2017, 26, 225–235. [Google Scholar] [CrossRef]
- Lee, L.S.H.; Jim, C.Y. Energy benefits of green-wall shading based on novel-accurate apportionment of short-wave radiation components. Appl. Energy 2019, 238, 1506–1518. [Google Scholar] [CrossRef]
- Convertino, F.; Vox, G.; Schettini, E. Heat transfer mechanisms in vertical green systems and energy balance equations. Int. J. Des. Nat. Ecodyn. 2019, 14, 7–18. [Google Scholar] [CrossRef]
- Hashimoto, S.; Suzuki, M. The impact of forest clear-cutting on soil temperature: A comparison between before and after cutting, and between clear-cut and control sites. J. For. Res. 2003, 9, 125–132. [Google Scholar] [CrossRef]
- Ramakreshnan, L.; Aghamohammadi, N. The Application of Nature-Based Solutions for Urban Heat Island Mitigation in Asia: Progress, Challenges, and Recommendations. Curr. Environ. Health Rep. 2024, 11, 4–17. [Google Scholar] [CrossRef]
- Hobbie, S.E.; Grimm, N.B. Nature-based approaches to managing climate change impacts in cities. Philos. Trans. B 2020, 375, 20190124. [Google Scholar] [CrossRef]
- Ziter, C.D.; Pedersen, E.J.; Kucharik, C.J.; Turner, M.G. Scale-dependent interactions between tree canopy cover and impervious surfaces reduce daytime urban heat during summer. Proc. Natl. Acad. Sci. USA 2019, 116, 7575–7580. [Google Scholar] [CrossRef] [PubMed]
- Google. Yanji Park, Taipei City, Taiwan (Photograph Dated September 2022). 2025. Available online: http://google.com/maps (accessed on 28 March 2025).
- Wang, J.; Meng, Q.; Zou, Y.; Qi, Q.; Tan, K.; Santamouris, M.; He, B.-J. Performance synergism of pervious pavement on stormwater management and urban heat island mitigation: A review of its benefits, key parameters, and co-benefits approach. Water Res. 2022, 221, 118755. [Google Scholar] [CrossRef]
- Zajic, D.; Fernando, H.J.S.; Calhoun, R.; Princevac, M.; Brown, M.J.; Pardyjak, E.R. Flow and Turbulence in an Urban Canyon. J. Appl. Meteorol. Climatol. 2011, 50, 203–223. [Google Scholar] [CrossRef]
- Cui, D.; Hu, G.; Ai, Z.; Du, Y.; Mak, C.M.; Kwok, K. Particle image velocimetry measurement and CFD simulation of pedestrian level wind environment around U-type street canyon. Build. Environ. 2019, 154, 239–251. [Google Scholar] [CrossRef]
- Assaad, R.H.; Assaf, G.; Boufadel, M. Optimizing the maintenance strategies for a network of green infrastructure: An agent-based model for stormwater detention basins. J. Environ. Manag. 2023, 330, 117179. [Google Scholar] [CrossRef]


| Category | Description |
|---|---|
| Satellite data | Landsat 7 Collection 2, Level 2 data [25], providing thermal, NDVI, and solar azimuth data |
| Meteorological data | Temperature, precipitation, relative humidity, wind speed, wind direction, and solar irradiation of Taipei City regarding satellite data from 2010 to 2020 [16] |
| Area geographic data | GIS layer of large water bodies in Taiwan [26] |
| The road network of Taipei City [27] | |
| Height of buildings [28] | |
| Additional NbS information | Age, type, location, and area of green infrastructure devices in Taipei City [29] |
| NbS Physical Variable | Variable Symbol | Unit |
|---|---|---|
| NbS type | Unitless | |
| NbS area | ||
| Distance from NbS | ||
| NbS age | Years | |
| NbS NDVI | Unitless |
| Street Environmental Variable | Variable Symbol | Unit |
|---|---|---|
| NDVI of the experimental area | Unitless | |
| Height of surrounding buildings | ||
| Street aspect ratio (height of building/street width) | Unitless | |
| Angle between street and wind directions | Degrees | |
| Angle between the direction to NbS and the wind direction | Degrees | |
| Angle between the solar azimuth and street directions | Degrees |
| Meteorological Variable | Variable Symbol | Unit |
|---|---|---|
| Ambient hourly air temperature | ||
| Hourly relative humidity | % | |
| Hourly wind speed | ||
| Hourly solar irradiation | MJ/m2 | |
| 2-day (48-h cumulative) accumulated precipitation | ||
| 3-day (72-h cumulative) accumulated precipitation | ||
| 5-day (120-h cumulative) accumulated precipitation |
| Season | Spring | Summer | Fall | Winter |
|---|---|---|---|---|
| () | 24.4 | 32.2 | 28.1 | 19.5 |
| (%) | 62 | 62 | 63 | 64 |
| (m/s) | 5.5 | 2.5 | 1.9 | 2.1 |
| (MJ/m2) | 1.66 | 1.94 | 1.61 | 1.18 |
| (mm) | 6.6 | 2.2 | 8.0 | 1.5 |
| (mm) | 13.6 | 5.6 | 12.9 | 6.8 |
| (mm) | 25.3 | 12.1 | 40.6 | 7.9 |
| Surface temp. reduced by NbS () | 0.98 | 1.56 | 0.64 | 0.92 |
| Variable | Coefficient | p-Value | VIF | Influence |
|---|---|---|---|---|
| Intercept | 3.88 | <10−4 | - | - |
| * | −0.75 | <10−4 | 2.57 | 0.056 |
| 5 × 10⁻⁵ | 0.29 | 2.49 | 0.0029 | |
| −0.013 | <10−4 | 1.99 | 0.10 | |
| −0.043 | <10−4 | 3.43 | 0.059 | |
| 1.20 | 0.15 | 1.05 | 0.0053 | |
| 0.026 | 0.17 | 5.03 | 0.0048 | |
| −0.45 | 0.32 | 5.05 | 0.0026 | |
| 0.0090 | <10−4 | 1.07 | 0.052 | |
| −6 × 10⁻⁴ | 0.65 | 1.13 | 6 × 10⁻⁴ | |
| −0.016 | <10−4 | 1.23 | 0.071 |
| Variable | Coefficient | p-Value | VIF | Influence |
|---|---|---|---|---|
| Intercept | 0.27 | 0.79 | - | - |
| * | −0.99 | <10−4 | 1.60 | 0.061 |
| −0.017 | <10−4 | 1.86 | 0.11 | |
| −0.071 | <10−4 | 2.55 | 0.10 | |
| 2.55 | 0.081 | 1.04 | 0.011 | |
| 0.12 | 10−4 | 4.51 | 0.053 | |
| −2.85 | <10−4 | 4.54 | 0.060 | |
| 0.016 | <10−4 | 1.10 | 0.073 | |
| −0.0034 | 0.078 | 1.12 | 0.011 | |
| SR | 2.30 | <10−4 | 1.09 | 0.12 |
| 0.024 | 0.0017 | 1.05 | 0.036 |
| Model (r = 0.4) for Grid-Type Streets (c ≤ ~500) | ||||
|---|---|---|---|---|
| Variable | Coefficient | p-Value | VIF | Influence |
| Intercept | 3.27 | <10−4 | - | - |
| 8 × 10⁻⁵ | 0.55 | 3.37 | 0.0026 | |
| 0.044 | 0.0036 | 1.12 | 0.085 | |
| 1.32 | 0.29 | 1.07 | 0.0084 | |
| 0.042 | 0.044 | 2.46 | 0.032 | |
| −4.85 | <10−4 | 5.11 | 0.16 | |
| 0.0081 | 0.0031 | 1.12 | 0.069 | |
| −0.0050 | 0.0050 | 1.15 | 0.062 | |
| 0.0053 | 0.0010 | 1.01 | 0.038 | |
| Model (r = 0.62) for Complex Streets (c > ~500) | ||||
| Variable | Coefficient | p-Value | VIF | Influence |
| Intercept | −4.65 | <10−4 | - | - |
| 7.1 × 10⁻⁴ | <10−4 | 5.17 | 0.14 | |
| −0.035 | <10−4 | 3.00 | 0.27 | |
| −0.12 | <10−4 | 1.33 | 0.55 | |
| 6.27 | <10−4 | 1.45 | 0.12 | |
| 0.27 | <10−4 | 8.50 | 0.13 | |
| Variables | Value Assumed |
|---|---|
| NbS type () | 0 |
| NbS area () | 2783 |
| NbS age () | 25.39 |
| NbS NDVI () | 0.41 |
| NDVI of the experimental area () | 0.08 |
| Height of surrounding buildings () | 27.62 |
| Street aspect ratio () | 1.04 |
| The angle between street and wind directions () | 42.6 |
| The angle between the direction of NbS and the wind direction () | 93.46 |
| The angle between the solar azimuth and street directions () | 58.58 |
| Solar irradiation () | 1.55 |
| 3-day accumulated precipitation () | 11.71 |
Disclaimer/Publisher’s Note: The statements, opinions and data contained in all publications are solely those of the individual author(s) and contributor(s) and not of MDPI and/or the editor(s). MDPI and/or the editor(s) disclaim responsibility for any injury to people or property resulting from any ideas, methods, instructions or products referred to in the content. |
© 2025 by the authors. Licensee MDPI, Basel, Switzerland. This article is an open access article distributed under the terms and conditions of the Creative Commons Attribution (CC BY) license (https://creativecommons.org/licenses/by/4.0/).
Share and Cite
Liu, C.-c.; Tu, M.-c.; Lin, J.-y.; Huo, H.; Chen, W.-j. Environmental Influence on NbS (Nature-Based Solution) Mitigation of Diurnal Surface Urban Heat Islands (SUHI). Remote Sens. 2025, 17, 1802. https://doi.org/10.3390/rs17101802
Liu C-c, Tu M-c, Lin J-y, Huo H, Chen W-j. Environmental Influence on NbS (Nature-Based Solution) Mitigation of Diurnal Surface Urban Heat Islands (SUHI). Remote Sensing. 2025; 17(10):1802. https://doi.org/10.3390/rs17101802
Chicago/Turabian StyleLiu, Chih-chen, Min-cheng Tu, Jen-yang Lin, Hongyuan Huo, and Wei-jen Chen. 2025. "Environmental Influence on NbS (Nature-Based Solution) Mitigation of Diurnal Surface Urban Heat Islands (SUHI)" Remote Sensing 17, no. 10: 1802. https://doi.org/10.3390/rs17101802
APA StyleLiu, C.-c., Tu, M.-c., Lin, J.-y., Huo, H., & Chen, W.-j. (2025). Environmental Influence on NbS (Nature-Based Solution) Mitigation of Diurnal Surface Urban Heat Islands (SUHI). Remote Sensing, 17(10), 1802. https://doi.org/10.3390/rs17101802