Next Issue
Volume 12, January
Previous Issue
Volume 11, November


Atmosphere, Volume 11, Issue 12 (December 2020) – 116 articles

Cover Story (view full-size image): 
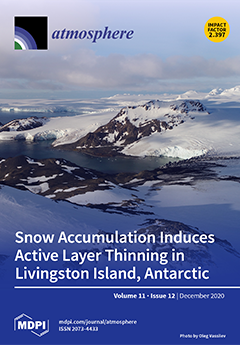
The Antarctic Peninsula is one of the Earth’s regions with the strongest warming since the mid-20th century. However, its northwest region cooled from 2000 to 2015. Increased snow accumulation was recorded in Livingston Island between 2009 and 2014, with sites that were snow-free in the summer becoming snow covered. The ground thermal regimes from two boreholes show the effects of the increasing snow insulation, resulting in the disappearance of the active layer and on permafrost aggradation. This regime shift may be used as an analogue for the transition from subaerial periglacial to subglacial ground thermal conditions. View this paper
  • Issues are regarded as officially published after their release is announced to the table of contents alert mailing list.
  • You may sign up for e-mail alerts to receive table of contents of newly released issues.
  • PDF is the official format for papers published in both, html and pdf forms. To view the papers in pdf format, click on the "PDF Full-text" link, and use the free Adobe Reader to open them.
Order results
Result details
Section
Select all
Export citation of selected articles as:
24 pages, 11539 KiB  
Article
Characteristics of Clouds and Raindrop Size Distribution in Xinjiang, Using Cloud Radar Datasets and a Disdrometer
by Yong Zeng, Lianmei Yang, Zuyi Zhang, Zepeng Tong, Jiangang Li, Fan Liu, Jinru Zhang and Yufei Jiang
Atmosphere 2020, 11(12), 1382; https://doi.org/10.3390/atmos11121382 - 21 Dec 2020
Cited by 15 | Viewed by 3172
Abstract
Observation data from March to May 2020 of the Ka-band millimeter-wave cloud radar and disdrometer, located in Xinjiang, a typical arid region of China, were used to study the diurnal variation of clouds and precipitation, raindrop size distribution (DSD), and the physical parameters [...] Read more.
Observation data from March to May 2020 of the Ka-band millimeter-wave cloud radar and disdrometer, located in Xinjiang, a typical arid region of China, were used to study the diurnal variation of clouds and precipitation, raindrop size distribution (DSD), and the physical parameters of raindrops. The results showed that there are conspicuous diurnal changes in clouds and precipitation. There is a decreasing trend of the cloud base height (CBH) from 05:00 to 19:00 CST (China Standard Time, UTC +8) and a rising trend of CBHs from 20:00 to 04:00 CST. The cloud top height (CTH) and the cloud thickness show a rising trend from 03:00 to 05:00 CST, 12:00 to 14:00 CST, and 20:00 to 01:00 CST. The diurnal variation of clouds is mainly driven by wind and temperature closely related to the topography of the study area. There are three apparent precipitation periods during the day, namely, 02:00–09:00 CST, 12:00 CST, and 17:00–21:00 CST. The changes in the physical parameters of raindrops are more drastic and evident with a lower CBH, lower CTH, and higher number of cloud layers from 12:00 to 21:00 CST than other times, which are closely related to day-to-day variations of systems moving through, and incoming solar radiation and the mountain–valley wind circulation caused by the trumpet-shaped topography that opens to the west played a secondary role. The DSD is in agreement with a normalized gamma distribution, and the value of the shape factor μ is significantly different from the fixed μ value in the Weather Research and Forecasting (WRF) Model. The rain in arid Xinjiang had a higher concentration of raindrops and a smaller average raindrop diameter than the rain in other humid regions of the Central and Southeast Asian continent. In the ZR (radar reflectivity–rain rate) relationship, Z=249R1.20 is derived for stratiform rain, and it is significantly different from humid regions. Using Z/Dm (mass–weighted mean diameter) and R, a new empirical relationship Z/Dm=214R1.20 is established, and improvement is obtained in rain retrieval by using the Z/DmR relation relative to the conventional ZR relation. Additionally, the NtR, DmR, NwR, and NtNw relationships with larger differences from humid regions are established by fitting the power-law equations. These results are useful for improving the data parameters of microphysical processes of WRF and the accuracy of quantitative precipitation estimation in arid regions. Full article
(This article belongs to the Section Meteorology)
Show Figures

Figure 1

16 pages, 1701 KiB  
Article
Increases in Biogenic Volatile Organic Compound Concentrations Observed after Rains at Six Forest Sites in Non-Summer Periods
by Takafumi Miyama, Tomoaki Morishita, Yuji Kominami, Hironori Noguchi, Yukio Yasuda, Natsuko Yoshifuji, Michiaki Okano, Katsumi Yamanoi, Yasuko Mizoguchi, Satoru Takanashi, Kenzo Kitamura and Kazuho Matsumoto
Atmosphere 2020, 11(12), 1381; https://doi.org/10.3390/atmos11121381 - 21 Dec 2020
Cited by 7 | Viewed by 2514
Abstract
Since biogenic volatile organic compounds (BVOCs) are important precursors of ozone, the monitoring of the BVOC concentration distributions is needed. In general, forest BVOC concentrations increase in summer as well as in other seasons. This study aims to detect temporally sporadic increases in [...] Read more.
Since biogenic volatile organic compounds (BVOCs) are important precursors of ozone, the monitoring of the BVOC concentration distributions is needed. In general, forest BVOC concentrations increase in summer as well as in other seasons. This study aims to detect temporally sporadic increases in BVOC concentrations in the non-summer months and to analyze the occurring climatic conditions. Using a uniform sampling system and shared gas chromatography–mass spectrometry, the concentrations of isoprene and monoterpenes in six Japanese forests were observed approximately once a month for 3 years. Using the observed data, the relations between the BVOC concentration increases and meteorological factors were evaluated. Twenty instances of temporal increases in BVOC concentrations were observed. These mainly occurred in spring for isoprene and in autumn for monoterpenes. Most of the increases in the non-summer months were observed after a rainfall event, when the daily temperature range was large, suggesting that wind, rain, and a rapid diurnal temperature rise could be factors in the non-summer months. Thus, the network monitoring of BVOC concentrations might be effective for understanding the effects of factors other than temperature, and the mechanisms and frequency of the temporal increases, on the BVOC concentrations in various forests. Full article
(This article belongs to the Special Issue Tropospheric Ozone Observations)
Show Figures

Figure 1

16 pages, 231 KiB  
Commentary
Lessons Learned from Coupled Fire-Atmosphere Research and Implications for Operational Fire Prediction and Meteorological Products Provided by the Bureau of Meteorology to Australian Fire Agencies
by Mika Peace, Joseph Charney and John Bally
Atmosphere 2020, 11(12), 1380; https://doi.org/10.3390/atmos11121380 - 21 Dec 2020
Cited by 4 | Viewed by 2174
Abstract
Coupled fire-atmosphere models are simulators that integrate a fire component and an atmospheric component, with the objective of capturing interactions between the fire and atmosphere. As a fire releases energy in the combustion process, the surrounding atmosphere adjusts in response to the energy [...] Read more.
Coupled fire-atmosphere models are simulators that integrate a fire component and an atmospheric component, with the objective of capturing interactions between the fire and atmosphere. As a fire releases energy in the combustion process, the surrounding atmosphere adjusts in response to the energy fluxes; coupled fire-atmosphere (CFA) models aim to resolve the processes through which these adjustments occur. Several CFA models have been developed internationally, mostly by meteorological institutions and primarily for use as a research tool. Research studies have provided valuable insights into some of the atmospheric processes surrounding a fire. The potential to run CFA models in real time is currently limited due to the intensive computational requirements. In addition, there is a need for systematic verification to establish their accuracy and the appropriate circumstances for their use. The Bureau of Meteorology (the Bureau) is responsible for providing relevant and accurate meteorological information to Australian fire agencies to inform decisions for the protection of life and property and to support hazard management activities. The inclusion of temporally and spatially detailed meteorological fields that adjust in response to the energy released by a fire is seen as a component in developing fire prediction systems that capture some of the most impactful fire and weather behavior. The Bureau’s ten-year research and development plan includes a commitment to developing CFA models, with the objective of providing enhanced services to Australian fire agencies. This paper discusses the operational use of fire predictions and simulators, learnings from CFA models and potential future directions for the Bureau in using CFA models to support fire prediction activities. Full article
(This article belongs to the Special Issue Coupled Fire-Atmosphere Simulation)
10 pages, 3509 KiB  
Article
Atmospheric Mercury Deposition in Macedonia from 2002 to 2015 Determined Using the Moss Biomonitoring Technique
by Trajče Stafilov, Lambe Barandovski, Robert Šajn and Katerina Bačeva Andonovska
Atmosphere 2020, 11(12), 1379; https://doi.org/10.3390/atmos11121379 - 21 Dec 2020
Cited by 8 | Viewed by 2150
Abstract
The moss biomonitoring technique was used in 2002, 2005, 2010 and 2015 in a potentially toxic elements study (PTEs) in Macedonia. For that purpose, more than 70 moss samples from two dominant species (Hypnum cupressiforme and Homalothecium lutescens) were collected during the [...] Read more.
The moss biomonitoring technique was used in 2002, 2005, 2010 and 2015 in a potentially toxic elements study (PTEs) in Macedonia. For that purpose, more than 70 moss samples from two dominant species (Hypnum cupressiforme and Homalothecium lutescens) were collected during the summers of the mentioned years. Total digestion of the samples was done using a microwave digestion system, whilst mercury was analyzed by cold vapour atomic absorption spectrometry (CV–AAS). The content of mercury ranged from 0.018 mg/kg to 0.26 mg/kg in 2002, from 0.010 mg/kg to 0.42 mg/kg in 2005, from 0.010 mg/kg to 0.60 mg/kg in 2010 and from 0.020 mg/kg to 0.25 mg/kg in 2015. Analysis of the median values shows the increase of the content in the period 2002–2010 and a slight reduction of the air pollution with Hg in the period 2010–2015. Mercury distribution maps show that sites with increased concentrations of mercury in moss are likely impacted by anthropogenic pollution. The results were compared to similar studies done during the same years in neighboring countries and in Norway—which is a pristine area and serves as a reference, and it was concluded that mercury air pollution in Macedonia is significant primarily in industrialized regions. Full article
Show Figures

Figure 1

20 pages, 8133 KiB  
Article
Circulation Specific Precipitation Patterns over Svalbard and Projected Future Changes
by Andreas Dobler, Julia Lutz, Oskar Landgren and Jan Erik Haugen
Atmosphere 2020, 11(12), 1378; https://doi.org/10.3390/atmos11121378 - 21 Dec 2020
Cited by 5 | Viewed by 2787
Abstract
Precipitation on Svalbard can generally be linked to the atmospheric circulation in the Northern Atlantic. Using an automated circulation type classification, we show that weather type statistics are well represented in the Max Planck Institute Earth System Model at base resolution (MPI-ESM-LR). For [...] Read more.
Precipitation on Svalbard can generally be linked to the atmospheric circulation in the Northern Atlantic. Using an automated circulation type classification, we show that weather type statistics are well represented in the Max Planck Institute Earth System Model at base resolution (MPI-ESM-LR). For a future climate projection following the Representative Concentration Pathway scenario RCP8.5, we find only small changes in the statistics. However, convection permitting simulations with the regional climate model from the Consortium for Small-scale Modeling in climate mode (COSMO-CLM) covering Svalbard at 2.5 km demonstrate an increase in precipitation for all seasons. About 74% of the increase are coming from changes under cyclonic weather situations. The precipitation changes are strongly related to differences in atmospheric conditions, while the contribution from the frequencies of weather types is small. Observations on Svalbard suggest that the general weather situation favouring heavy precipitation events is a strong south-southwesterly flow with advection of water vapour from warmer areas. This is reproduced by the COSMO-CLM simulations. In the future projections, the maximum daily precipitation amounts are further increasing. At the same time, weather types with less moisture advection towards Svalbard are becoming more important. Full article
Show Figures

Figure 1

15 pages, 2614 KiB  
Article
Quantifying the Independent Influences of Land Cover and Humidity on Microscale Urban Air Temperature Variation in Hot Summer: Methods of Path Analysis and Genetic SVR
by Weifang Shi, Nan Wang, Aixuan Xin, Linglan Liu, Jiaqi Hou and Yirui Zhang
Atmosphere 2020, 11(12), 1377; https://doi.org/10.3390/atmos11121377 - 21 Dec 2020
Cited by 2 | Viewed by 1691
Abstract
Mitigating high air temperatures and heat waves is vital for decreasing air pollution and protecting public health. To improve understanding of microscale urban air temperature variation, this paper performed measurements of air temperature and relative humidity in a field of Wuhan City in [...] Read more.
Mitigating high air temperatures and heat waves is vital for decreasing air pollution and protecting public health. To improve understanding of microscale urban air temperature variation, this paper performed measurements of air temperature and relative humidity in a field of Wuhan City in the afternoon of hot summer days, and used path analysis and genetic support vector regression (SVR) to quantify the independent influences of land cover and humidity on air temperature variation. The path analysis shows that most effect of the land cover is mediated through relative humidity difference, more than four times as much as the direct effect, and that the direct effect of relative humidity difference is nearly six times that of land cover, even larger than the total effect of the land cover. The SVR simulation illustrates that land cover and relative humidity independently contribute 16.3% and 83.7%, on average, to the rise of the air temperature over the land without vegetation in the study site. An alternative strategy of increasing the humidity artificially is proposed to reduce high air temperatures in urban areas. The study would provide scientific support for the regulation of the microclimate and the mitigation of the high air temperature in urban areas. Full article
Show Figures

Figure 1

13 pages, 6844 KiB  
Article
A 5000-Year Sedimentary Record of East Asian Winter Monsoon from the Northern Muddy Area of the East China Sea
by Yanping Chen, Yan Li, Wenzhe Lyu, Dong Xu, Xibin Han, Tengfei Fu and Liang Yi
Atmosphere 2020, 11(12), 1376; https://doi.org/10.3390/atmos11121376 - 20 Dec 2020
Cited by 6 | Viewed by 2491
Abstract
The variability of the winter monsoon is one of the key components of the Asian monsoon, significantly influencing paleoenvironmental evolution in East Asia. However, whether the winter or the summer monsoon is the dominated factor controlling sedimentary dynamics of the muddy areas of [...] Read more.
The variability of the winter monsoon is one of the key components of the Asian monsoon, significantly influencing paleoenvironmental evolution in East Asia. However, whether the winter or the summer monsoon is the dominated factor controlling sedimentary dynamics of the muddy areas of the continental shelves of the East China Sea is debated, due to lack of consistency between various winter monsoon proxies in previous studies. In this work, the sediments of the upper part of core ECS-DZ1 with several marine surface samples were studied in terms of sediment grain size and radiocarbon dating, and changes in sedimentary dynamics of the northern muddy area of the ECS over the past 5000 years were documented. The main findings are as follows: (1) regional sedimentary dynamics were low and did not significantly change since the middle Holocene; (2) coarse particles are the dominated component in the sediments; (3) a proxy can be derived to indicate changes in winter monsoon. Based on this reconstructed winter monsoon record, we found that this record was generally negatively correlated to the stalagmite-based summer monsoon variability over the past 3500 years, but positively correlated before that. Moreover, this record can be well correlated to changes in the Kuroshio Current and the Bond ice-rafting debris events in the North Atlantic on millennial timescales, inferring large-scale and common atmospheric dynamics across the Asian continent over the past 5000 years. Therefore, we concluded that the winter monsoon is the predominant factor controlling sedimentary dynamics in the northern part of the ECS and proposed that the contribution of coarse particles may be one of potential indices to identify the role of the winter and the summer monsoons in sedimentary evolution. Full article
(This article belongs to the Section Climatology)
Show Figures

Figure 1

26 pages, 25251 KiB  
Article
Graz Lagrangian Model (GRAL) for Pollutants Tracking and Estimating Sources Partial Contributions to Atmospheric Pollution in Highly Urbanized Areas
by Aleksey A. Romanov, Boris A. Gusev, Egor V. Leonenko, Anastasia N. Tamarovskaya, Alexander S. Vasiliev, Nikolai E. Zaytcev and Ilia K. Philippov
Atmosphere 2020, 11(12), 1375; https://doi.org/10.3390/atmos11121375 - 19 Dec 2020
Cited by 15 | Viewed by 8149
Abstract
Computational modeling allows studying the air quality problems in depth and provides the best solution reducing the population risks. This research demonstrates the Graz Lagrangian model effectiveness for assessing emission sources contributions to the air pollution: particles tracking and accumulation estimate. The article [...] Read more.
Computational modeling allows studying the air quality problems in depth and provides the best solution reducing the population risks. This research demonstrates the Graz Lagrangian model effectiveness for assessing emission sources contributions to the air pollution: particles tracking and accumulation estimate. The article describes model setting up parameters and datasets preparation for the analysis. The experiment simulated the dispersion from the main groups of emission sources for real weather conditions during 96 h of December 2018, when significant excess of NO2, CO, SO2, PM10, and benzo(a)pyrene concentrations were observed in the Krasnoyarsk surface atmospheric layer. The computational domain was a parallelepiped of 40 × 30 × 2.5 km, which was located deep inside the Eurasian continent on a heterogeneous landscape exaggerated by high-rise buildings, with various pollutions sources and the ice-free Yenisei River. The results demonstrated an excellent applicability of the Lagrange model for hourly tracking of particle trajectories, taking into account the urban landscape. For values <1 MPC (maximum permissible concentration) of peak pollutants concentrations, the coincidences were 93 cases, and for values < 0.1 shares of MPC, there were 36 cases out of the total number of 97. The same was found for the average daily concentration for values <1 MPC—31, and for values <0.1 MPC—5 matches out of 44. Wind speeds COR—65.3%, wind directions COR—68.6%. The Graz Lagrangian model showed the ability to simulate air quality problems in the Krasnoyarsk greater area conditions. Full article
(This article belongs to the Special Issue Atmospheric Trace Gas Source Detection and Quantification)
Show Figures

Figure 1

25 pages, 6870 KiB  
Article
Comparing Approaches for Reconstructing Groundwater Levels in the Mountainous Regions of Interior British Columbia, Canada, Using Tree Ring Widths
by Stephanie C. Hunter, Diana M. Allen and Karen E. Kohfeld
Atmosphere 2020, 11(12), 1374; https://doi.org/10.3390/atmos11121374 - 19 Dec 2020
Cited by 5 | Viewed by 2249
Abstract
Observed groundwater level records are relatively short (<100 years), limiting long-term studies of groundwater variability that could provide valuable insight into climate change effects. This study uses tree ring data from the International Tree Ring Database (ITRDB) and groundwater level data from 22 [...] Read more.
Observed groundwater level records are relatively short (<100 years), limiting long-term studies of groundwater variability that could provide valuable insight into climate change effects. This study uses tree ring data from the International Tree Ring Database (ITRDB) and groundwater level data from 22 provincial observation wells to evaluate different approaches for reconstructing groundwater levels from tree ring widths in the mountainous southern interior of British Columbia, Canada. The twenty-eight reconstruction models consider the selection of observation wells (e.g., regional average groundwater level vs. wells classified by recharge mechanism) and the search area for potential tree ring records (climate footprint vs. North American Ecoregions). Results show that if the climate footprint is used, reconstructions are statistically valid if the wells are grouped according to recharge mechanism, with streamflow-driven and high-elevation recharge-driven wells (both snowmelt-dominated) producing valid models. Of all the ecoregions considered, only the Coast Mountain Ecoregion models are statistically valid for both the regional average groundwater level and high-elevation recharge-driven systems. No model is statistically valid for low-elevation recharge-driven systems (rainfall-dominated). The longest models extend the groundwater level record to the year 1500, with the highest confidence in the later portions of the reconstructions going back to the year 1800. Full article
(This article belongs to the Special Issue Past Climate Reconstructed from Tree Rings)
Show Figures

Figure 1

19 pages, 1528 KiB  
Review
Monitoring of Selected CBRN Threats in the Air in Industrial Areas with the Use of Unmanned Aerial Vehicles
by Anna Rabajczyk, Jacek Zboina, Maria Zielecka and Radosław Fellner
Atmosphere 2020, 11(12), 1373; https://doi.org/10.3390/atmos11121373 - 19 Dec 2020
Cited by 7 | Viewed by 3883
Abstract
Unmanned aerial vehicles (UAVs) play an increasingly important role in various areas of life, including in terms of protection and security. As a result of fires, volcanic eruptions, or other emergencies, huge amounts of toxic gases, dust, and other substances are emitted into [...] Read more.
Unmanned aerial vehicles (UAVs) play an increasingly important role in various areas of life, including in terms of protection and security. As a result of fires, volcanic eruptions, or other emergencies, huge amounts of toxic gases, dust, and other substances are emitted into the environment, which, together with high temperature, often leads to serious environmental contamination. Based on the available literature and patent databases, an analysis of the available UAVs models was carried out in terms of their applicability in air contaminated conditions in industrial areas, in the event of emergencies, such as fire, chemical contamination. The possibilities of using the devices were analyzed in terms of weather conditions, construction, and used materials in CBRN (chemical, biological, radiological, nuclear) threat situations. It was found that, thanks to the use of appropriate sensors, cameras, and software of UAVs integrated with a given system, it is possible to obtain information on air quality at a given moment, which is very important for the safety of people and the environment. However, several elements, including the possibility of use in acidification conditions, requires refinement to changing crisis conditions. Full article
(This article belongs to the Section Air Quality)
Show Figures

Figure 1

13 pages, 1991 KiB  
Article
Improving Air Quality for Operators of Mobile Machines in Underground Mines
by Andrzej Szczurek, Monika Maciejewska, Marcin Przybyła and Wacław Szetelnicki
Atmosphere 2020, 11(12), 1372; https://doi.org/10.3390/atmos11121372 - 18 Dec 2020
Cited by 1 | Viewed by 2355
Abstract
In underground mines, mobile mining equipment is critical for the production system. The microenvironment inside the mobile machine may cause exposure to strongly polluted mine air, which adversely affects the health and working performance of the operator. Harmful pollutants may access the cabin [...] Read more.
In underground mines, mobile mining equipment is critical for the production system. The microenvironment inside the mobile machine may cause exposure to strongly polluted mine air, which adversely affects the health and working performance of the operator. Harmful pollutants may access the cabin together with the ventilation air delivered from the machine’s surroundings. This work proposes a solution that is able to ensure that the air for the machine operator is of proper quality. The proposal emerged from an analysis of the compliance of cabins of mobile machines working underground in mines with occupational health and safety (H&S) standards. An analytical model of air quality in a well-mixed zone was utilized for this purpose. The cabin atmosphere was investigated with regard to the concentration of gaseous species in the surrounding air, the cabin ventilation rate, and human breathing parameters. The analysis showed that if currently available ventilation approaches are used, compliance with multiple H&S standards cannot be attained inside the cabin if standards are exceeded in the surroundings of the machine. The proposed solution overcomes this problem by combining elements that are already in place, i.e., ventilation, air-conditioning, and filtration with a personal supply of clean air. The concept is generic and may be adapted to various specific requirements. Full article
(This article belongs to the Special Issue Exposure Assessment of Air Pollution)
Show Figures

Figure 1

12 pages, 2079 KiB  
Article
Vertical Profiles of Atmospheric Species Concentrations and Nighttime Boundary Layer Structure in the Dry Season over an Urban Environment in Central Amazon Collected by an Unmanned Aerial Vehicle
by Patrícia Guimarães, Jianhuai Ye, Carla Batista, Rafael Barbosa, Igor Ribeiro, Adan Medeiros, Tianning Zhao, Wei-Chun Hwang, Hui-Ming Hung, Rodrigo Souza and Scot T. Martin
Atmosphere 2020, 11(12), 1371; https://doi.org/10.3390/atmos11121371 - 18 Dec 2020
Cited by 16 | Viewed by 2955
Abstract
Nighttime vertical profiles of ozone, PM2.5 and PM10 particulate matter, carbon monoxide, temperature, and humidity were collected by a copter-type unmanned aerial vehicle (UAV) over the city of Manaus, Brazil, in central Amazon during the dry season of 2018. The vertical [...] Read more.
Nighttime vertical profiles of ozone, PM2.5 and PM10 particulate matter, carbon monoxide, temperature, and humidity were collected by a copter-type unmanned aerial vehicle (UAV) over the city of Manaus, Brazil, in central Amazon during the dry season of 2018. The vertical profiles were analyzed to understand the structure of the urban nighttime boundary layer (NBL) and pollution within it. The ozone concentration, temperature, and humidity had an inflection between 225 and 350 m on most nights, representing the top of the urban NBL. The profile of carbon monoxide concentration correlated well with the local evening vehicular congestion of a modern transportation fleet, providing insight into the surface-atmosphere dynamics. In contrast, events of elevated PM2.5 and PM10 concentrations were not explained well by local urban emissions, but rather by back trajectories that intersected regional biomass burning. These results highlight the potential of the emerging technologies of sensor payloads on UAVs to provide new constraints and insights for understanding the pollution dynamics in nighttime boundary layers in urban regions. Full article
(This article belongs to the Special Issue Atmospheric Measurements Using Unmanned Systems)
Show Figures

Figure 1

16 pages, 3752 KiB  
Article
Local Weather Conditions Create Structural Differences between Shallow Firn Columns at Summit, Greenland and WAIS Divide, Antarctica
by Ian E. McDowell, Mary R. Albert, Stephanie A. Lieblappen and Kaitlin M. Keegan
Atmosphere 2020, 11(12), 1370; https://doi.org/10.3390/atmos11121370 - 17 Dec 2020
Cited by 1 | Viewed by 2802
Abstract
Understanding how physical characteristics of polar firn vary with depth assists in interpreting paleoclimate records and predicting meltwater infiltration and storage in the firn column. Spatial heterogeneities in firn structure arise from variable surface climate conditions that create differences in firn grain growth [...] Read more.
Understanding how physical characteristics of polar firn vary with depth assists in interpreting paleoclimate records and predicting meltwater infiltration and storage in the firn column. Spatial heterogeneities in firn structure arise from variable surface climate conditions that create differences in firn grain growth and packing arrangements. Commonly, estimates of how these properties change with depth are made by modeling profiles using long-term estimates of air temperature and accumulation rate. Here, we compare surface meteorology and firn density and permeability in the depth range of 3.5–11 m of the firn column from cores collected at Summit, Greenland and WAIS Divide, Antarctica, two sites with the same average accumulation rate and mean annual air temperature. We show that firn at WAIS Divide is consistently denser than firn at Summit. However, the difference in bulk permeability of the two profiles is less statistically significant. We argue that differences in local weather conditions, such as mean summer temperatures, daily temperature variations, and yearly wind speeds, create the density discrepancies. Our results are consistent with previous results showing density is not a good indicator of firn permeability within the shallow firn column. Future modeling efforts should account for these weather variables when estimating firn structure with depth. Full article
(This article belongs to the Special Issue Modeling and Measuring Snow Processes across Scales)
Show Figures

Figure 1

22 pages, 4312 KiB  
Article
The Use of Gaussian Mixture Models with Atmospheric Lagrangian Particle Dispersion Models for Density Estimation and Feature Identification
by Alice Crawford
Atmosphere 2020, 11(12), 1369; https://doi.org/10.3390/atmos11121369 - 17 Dec 2020
Cited by 7 | Viewed by 3914
Abstract
Atmospheric Lagrangian particle dispersion models, LPDM, simulate the dispersion of passive tracers in the atmosphere. At the most basic level, model output consists of the position of computational particles and the amount of mass they represent. In order to obtain concentration values, this [...] Read more.
Atmospheric Lagrangian particle dispersion models, LPDM, simulate the dispersion of passive tracers in the atmosphere. At the most basic level, model output consists of the position of computational particles and the amount of mass they represent. In order to obtain concentration values, this information is then converted to a mass distribution via density estimation. To date, density estimation is performed with a nonparametric method so that output consists of gridded concentration data. Here we introduce the use of Gaussian mixture models, GMM, for density estimation. We compare to the histogram or bin counting method for a tracer experiment and simulation of a large volcanic ash cloud. We also demonstrate the use of the mixture model for automatic identification of features in a complex plume such as is produced by a large volcanic eruption. We conclude that use of a mixture model for density estimation and feature identification has potential to be very useful. Full article
(This article belongs to the Special Issue Forecasting the Transport of Volcanic Ash in the Atmosphere)
Show Figures

Figure 1

16 pages, 4819 KiB  
Article
Carbonaceous Aerosols in PM1, PM2.5, and PM10 Size Fractions over the Lanzhou City, Northwest China
by Xin Zhang, Zhongqin Li, Feiteng Wang, Mengyuan Song, Xi Zhou and Jing Ming
Atmosphere 2020, 11(12), 1368; https://doi.org/10.3390/atmos11121368 - 17 Dec 2020
Cited by 22 | Viewed by 2741
Abstract
Carbonaceous particles have been confirmed as major components of ambient aerosols in urban environments and are related to climate impacts and environmental and health effects. In this study, we collected different-size particulate matter (PM) samples (PM1, PM2.5, and PM [...] Read more.
Carbonaceous particles have been confirmed as major components of ambient aerosols in urban environments and are related to climate impacts and environmental and health effects. In this study, we collected different-size particulate matter (PM) samples (PM1, PM2.5, and PM10) at an urban site in Lanzhou, northwest China, during three discontinuous one-month periods (January, April, and July) of 2019. We measured the concentrations and potential transport pathways of carbonaceous aerosols in PM1, PM2.5, and PM10 size fractions. The average concentrations of OC (organic carbon) and EC (elemental carbon) in PM1, PM2.5, and PM10 were 6.98 ± 3.71 and 2.11 ± 1.34 μg/m3, 8.6 ± 5.09 and 2.55 ± 1.44 μg/m3, and 11.6 ± 5.72 and 4.01 ± 1.72 μg/m3. The OC and EC concentrations in PM1, PM2.5, and PM10 had similar seasonal trends, with higher values in winter due to the favorable meteorology for accumulating pollutants and urban-increased emissions from heating. Precipitation played a key role in scavenge pollutants, resulting in lower OC and EC concentrations in summer. The OC/EC ratios and principal component analysis (PCA) showed that the dominant pollution sources of carbon components in the PMs in Lanzhou were biomass burning, coal combustion, and diesel and gasoline vehicle emissions; and the backward trajectory and concentration weight trajectory (CWT) analysis further suggested that the primary pollution source of EC in Lanzhou was local fossil fuel combustion. Full article
(This article belongs to the Special Issue Chemistry of Aqueous Surfaces in the Atmospheric Context)
Show Figures

Figure 1

29 pages, 10275 KiB  
Article
Rainfall Threshold for Shallow Landslides Initiation and Analysis of Long-Term Rainfall Trends in a Mediterranean Area
by Anna Roccati, Guido Paliaga, Fabio Luino, Francesco Faccini and Laura Turconi
Atmosphere 2020, 11(12), 1367; https://doi.org/10.3390/atmos11121367 - 17 Dec 2020
Cited by 26 | Viewed by 3908
Abstract
The effects of climate change on landslide activity may have important environmental, socio-economic, and political consequences. In the last decades, several short-term extreme rainfall events affected Mediterranean regions, resulted in damaging geo-hydrological processes and casualties. It is unequivocal that the impact of landslides [...] Read more.
The effects of climate change on landslide activity may have important environmental, socio-economic, and political consequences. In the last decades, several short-term extreme rainfall events affected Mediterranean regions, resulted in damaging geo-hydrological processes and casualties. It is unequivocal that the impact of landslides in several Mediterranean countries is increasing with time, but until now, there has been little or no quantitative data to support these increases. In this paper, both rainfall conditions for the occurrence of shallow landslides and rainfall trends were investigated in the Portofino promontory, which extends in the Ligurian Sea, where heavy rainfall and related ground effects often occur. Adopting a frequentist approach, the empirical intensity-duration threshold was estimated. Our findings highlight that the rainfall intensity required to trigger landslides is lower for the same duration than those expected in other similar environments, suggesting a high susceptibility to rainfall-induced landslides in the Portofino territory. Further, the Mann-Kendall test and Hurst exponent were used for detecting potential trends. Analysis of long-term rainfall time series showed statistically significant increasing trends in short duration precipitation occurrence and rainfall rates, suggesting a possible future scenario with a more frequent exceedance of the threshold triggering value and an increase of landslide risk. Full article
Show Figures

Figure 1

16 pages, 2176 KiB  
Article
Pollution Caused by Potentially Toxic Elements Present in Road Dust from Industrial Areas in Korea
by Hyeryeong Jeong, Jin Young Choi, Jaesoo Lim and Kongtae Ra
Atmosphere 2020, 11(12), 1366; https://doi.org/10.3390/atmos11121366 - 17 Dec 2020
Cited by 14 | Viewed by 2703
Abstract
We examined the pollution characteristics of potentially toxic elements (PTEs) in road dust (RD) from nine industrial areas in South Korea to assess PTE pollution levels and their environmental risks for devising better strategies for managing RD. The median concentrations (mg/kg) were in [...] Read more.
We examined the pollution characteristics of potentially toxic elements (PTEs) in road dust (RD) from nine industrial areas in South Korea to assess PTE pollution levels and their environmental risks for devising better strategies for managing RD. The median concentrations (mg/kg) were in the order Zn (1407) > Cr (380) > Cu (276) > Pb (260) > Ni (112) > As (15) > Cd (2) > Hg (0.1). The concentration of PTEs was the highest at the Onsan Industrial Complex, where many smelting facilities are located. Our results show that Onsan, Noksan, Changwon, Ulsan, Pohang, and Shihwa industrial areas are heavily polluted with Cu, Zn, Cd, and Pb. The presence of these toxic elements in RD from the impervious layer in industrial areas may have a moderate to severe effect on the health of the biota present in these areas. The potential ecological risk index (Eri) for PTEs was in the decreasing order of Cd > Pb > Hg > Cu > As > Zn > Ni > Cr, indicating that the dominant PTE causing ecological hazards is Cd owing to its high toxicity. Our research suggests the necessity for the urgent introduction of an efficient management strategy to reduce RD, which adds to coastal pollution and affects human health. Full article
Show Figures

Figure 1

17 pages, 2392 KiB  
Article
Spatial Distribution, Source Apportionment, Ozone Formation Potential, and Health Risks of Volatile Organic Compounds over a Typical Central Plain City in China
by Kun He, Zhenxing Shen, Jian Sun, Yali Lei, Yue Zhang and Xin Wang
Atmosphere 2020, 11(12), 1365; https://doi.org/10.3390/atmos11121365 - 16 Dec 2020
Cited by 6 | Viewed by 2371
Abstract
The profiles, contributions to ozone formation, and associated health risks of 56 volatile organic compounds (VOCs) species were investigated using high time resolution observations from photochemical assessment monitoring stations (PAMs) in Luoyang, China. The daily averaged concentration of total VOCs (TVOCs) was 21.66 [...] Read more.
The profiles, contributions to ozone formation, and associated health risks of 56 volatile organic compounds (VOCs) species were investigated using high time resolution observations from photochemical assessment monitoring stations (PAMs) in Luoyang, China. The daily averaged concentration of total VOCs (TVOCs) was 21.66 ± 10.34 ppbv in urban areas, 14.45 ± 7.40 ppbv in suburbs, and 37.58 ± 13.99 ppbv in an industrial zone. Overall, the VOCs levels in these nine sites followed a decreasing sequence of alkanes > aromatics > alkenes > alkyne. Diurnal variations in VOCs exhibited two peaks at 8:00–9:00 and 19:00–20:00, with one valley at 23:00–24:00. Source apportionment indicated that vehicle and industrial emissions were the dominant sources of VOCs in urban and suburban sites. The industrial site displayed extreme levels, with contributions from petrochemical-related sources of up to 38.3%. Alkenes and aromatics displayed the highest ozone formation potentials because of their high photochemical reactivity. Cancer and noncancer risks in the industrial site were higher than those in the urban and suburban areas, and USEPA possible risk thresholds were reached in the industrial site, indicating PAMs VOC–related health problems cannot be ignored. Therefore, vehicle and industrial emissions should be prioritized when considering VOCs and O3 control strategies in Luoyang. Full article
Show Figures

Figure 1

19 pages, 1983 KiB  
Article
Impact of Environmental Conditions on Grass Phenology in the Regional Climate Model COSMO-CLM
by Eva Hartmann, Jan-Peter Schulz, Ruben Seibert, Marius Schmidt, Mingyue Zhang, Jürg Luterbacher and Merja H. Tölle
Atmosphere 2020, 11(12), 1364; https://doi.org/10.3390/atmos11121364 - 16 Dec 2020
Cited by 3 | Viewed by 2618
Abstract
Feedbacks of plant phenology to the regional climate system affect fluxes of energy, water, CO2, biogenic volatile organic compounds as well as canopy conductance, surface roughness length, and are influencing the seasonality of albedo. We performed simulations with the regional climate model COSMO-CLM [...] Read more.
Feedbacks of plant phenology to the regional climate system affect fluxes of energy, water, CO2, biogenic volatile organic compounds as well as canopy conductance, surface roughness length, and are influencing the seasonality of albedo. We performed simulations with the regional climate model COSMO-CLM (CCLM) at three locations in Germany covering the period 1999 to 2015 in order to study the sensitivity of grass phenology to different environmental conditions by implementing a new phenology module. We provide new evidence that the annually-recurring standard phenology of CCLM is improved by the new calculation of leaf area index (LAI) dependent upon surface temperature, day length, and water availability. Results with the new phenology implemented in the model show a significantly higher correlation with observations than simulations with the standard phenology. The interannual variability of LAI improves the representation of vegetation in years with extremely warm winter/spring (e.g., 2007) or extremely dry summer (e.g., 2003) and shows a more realistic growth period. The effect of the newly implemented phenology on atmospheric variables is small but tends to be positive. It should be used in future applications with an extension on more plant functional types. Full article
Show Figures

Figure 1

27 pages, 8504 KiB  
Article
A Long-Term, 1-km Resolution Daily Meteorological Dataset for Modeling and Mapping Permafrost in Canada
by Yu Zhang, Budong Qian and Gang Hong
Atmosphere 2020, 11(12), 1363; https://doi.org/10.3390/atmos11121363 - 16 Dec 2020
Cited by 2 | Viewed by 3755
Abstract
Climate warming is causing permafrost thaw and there is an urgent need to understand the spatial distribution of permafrost and its potential changes with climate. This study developed a long-term (1901–2100), 1-km resolution daily meteorological dataset (Met1km) for modeling and mapping permafrost at [...] Read more.
Climate warming is causing permafrost thaw and there is an urgent need to understand the spatial distribution of permafrost and its potential changes with climate. This study developed a long-term (1901–2100), 1-km resolution daily meteorological dataset (Met1km) for modeling and mapping permafrost at high spatial resolutions in Canada. Met1km includes eight climate variables (daily minimum, maximum, and mean air temperatures, precipitation, vapor pressure, wind speed, solar radiation, and downward longwave radiation) and is suitable to drive process-based permafrost and other land-surface models. Met1km was developed based on four coarser gridded meteorological datasets for the historical period. Future values were developed using the output of a new Canadian regional climate model under medium-low and high emission scenarios. These datasets were downscaled to 1-km resolution using the re-baselining method based on the WorldClim2 dataset as spatial templates. We assessed Met1km by comparing it to climate station observations across Canada and a gridded monthly anomaly time-series dataset. The accuracy of Met1km is similar to or better than the four coarser gridded datasets. The errors in long-term averages and average seasonal patterns are small. The error occurs mainly in day-to-day fluctuations, thus the error decreases significantly when averaged over 5 to 10 days. Met1km, as a data generating system, is relatively small in data volume, flexible to use, and easy to update when new or improved source datasets are available. The method can also be used to generate similar datasets for other regions, even for the entire global landmass. Full article
(This article belongs to the Special Issue Climate Data for Agricultural Applications: Downscaling and Scenarios)
Show Figures

Figure 1

19 pages, 591 KiB  
Article
Sensitivity of Surface Fluxes in the ECMWF Land Surface Model to the Remotely Sensed Leaf Area Index and Root Distribution: Evaluation with Tower Flux Data
by David Stevens, Pedro M. A. Miranda, René Orth, Souhail Boussetta, Gianpaolo Balsamo and Emanuel Dutra
Atmosphere 2020, 11(12), 1362; https://doi.org/10.3390/atmos11121362 - 16 Dec 2020
Cited by 8 | Viewed by 3178
Abstract
The surface-atmosphere turbulent exchanges couple the water, energy and carbon budgets in the Earth system. The biosphere plays an important role in the evaporation process, and vegetation related parameters such as the leaf area index (LAI), vertical root distribution and stomatal resistance are [...] Read more.
The surface-atmosphere turbulent exchanges couple the water, energy and carbon budgets in the Earth system. The biosphere plays an important role in the evaporation process, and vegetation related parameters such as the leaf area index (LAI), vertical root distribution and stomatal resistance are poorly constrained due to sparse observations at the spatio-temporal scales at which land surface models (LSMs) operate. In this study, we use the Carbon Hydrology Tiled European Center for Medium-Range Weather Forecasts (ECMWF) Scheme for Surface Exchanges over Land (CHTESSEL) model and investigate the sensitivity of the simulated turbulent fluxes to these vegetation related parameters. Observed data from 17 FLUXNET towers were used to force and evaluate model simulations with different vegetation parameter configurations. The replacement of the current LAI climatology used by CHTESSEL, by a new high-resolution climatology, representative of the station’s location, has a small impact on the simulated fluxes. Instead, a revision of the root profile considering a uniform root distribution reduces the underestimation of evaporation during water stress conditions. Despite the limitations of using only one model and a limited number of stations, our results highlight the relevance of root distribution in controlling soil moisture stress, which is likely to be applicable to other LSMs. Full article
Show Figures

Figure 1

2 pages, 128 KiB  
Editorial
Special Issue Air Quality and Smoke Management
by Scott L. Goodrick
Atmosphere 2020, 11(12), 1361; https://doi.org/10.3390/atmos11121361 - 15 Dec 2020
Viewed by 1399
Abstract
The Atmosphere Special Issue “Special Issue Air Quality and Smoke Management” explores our ability to simulate wildland fire smoke events and the potential to link such modeling to future studies of human health impacts [...] Full article
(This article belongs to the Special Issue Air Quality and Smoke Management)
14 pages, 2106 KiB  
Article
Evaluating Satellite Sounding Temperature Observations for Cold Air Aloft Detection
by Rebekah Esmaili, Nadia Smith, Mark Schoeberl and Chris Barnet
Atmosphere 2020, 11(12), 1360; https://doi.org/10.3390/atmos11121360 - 15 Dec 2020
Cited by 3 | Viewed by 1882
Abstract
Cold Air Aloft (CAA) can impact commercial flights when cold air descends below 12,192 m (40,000 ft) and temperatures drop dramatically. A CAA event is identified when air temperature falls below −65 °C, which decreases fuel efficiency and poses a safety hazard. This [...] Read more.
Cold Air Aloft (CAA) can impact commercial flights when cold air descends below 12,192 m (40,000 ft) and temperatures drop dramatically. A CAA event is identified when air temperature falls below −65 °C, which decreases fuel efficiency and poses a safety hazard. This manuscript assesses the performance of the National Oceanic and Atmospheric Administration Unique Combined Atmospheric Processing System (NUCAPS) in detecting CAA events using sounders on polar-orbiting satellites. We compare NUCAPS air temperature profiles with those from Constellation Observing System for Meteorology, Ionosphere, and Climate (COSMIC) for January–March 2018. Of 1311 collocated profiles, 236 detected CAA. Our results showed that NUCAPS correctly detects CAA in 48.1% of profiles, while 17.2% are false positives and 34.7% are false negatives. To identify the reason for these detection states, we used a logistic regression trained on NUCAPS diagnostic parameters. We found that cloud cover can impact the skill even at higher vertical levels. This work indicates that a CAA-specific quality flag is feasible and may be useful to help forecasters to diagnose NUCAPS in real-time. Furthermore, the inclusion of an additional sounder data source (e.g., NOAA-20) may increase CAA forecast accuracy. Cloud scenes change rapidly, so additional observations provide more opportunities for correct detection. Full article
(This article belongs to the Special Issue Weather and Aviation Safety)
Show Figures

Figure 1

2 pages, 147 KiB  
Editorial
Special Issue Editorial: Study of Brake Wear Particle Emissions
by Jens Wahlström
Atmosphere 2020, 11(12), 1359; https://doi.org/10.3390/atmos11121359 - 15 Dec 2020
Cited by 2 | Viewed by 1456
(This article belongs to the Special Issue Study of Brake Wear Particle Emissions)
31 pages, 2404 KiB  
Review
Radiation in the Atmosphere—A Hazard to Aviation Safety?
by Matthias M. Meier, Kyle Copeland, Klara E. J. Klöble, Daniel Matthiä, Mona C. Plettenberg, Kai Schennetten, Michael Wirtz and Christine E. Hellweg
Atmosphere 2020, 11(12), 1358; https://doi.org/10.3390/atmos11121358 - 14 Dec 2020
Cited by 14 | Viewed by 6906
Abstract
Exposure of aircrew to cosmic radiation has been recognized as an occupational health risk for several decades. Based on the recommendations by the International Commission on Radiological Protection (ICRP), many countries and their aviation authorities, respectively have either stipulated legal radiation protection regulations, [...] Read more.
Exposure of aircrew to cosmic radiation has been recognized as an occupational health risk for several decades. Based on the recommendations by the International Commission on Radiological Protection (ICRP), many countries and their aviation authorities, respectively have either stipulated legal radiation protection regulations, e.g., in the European Union or issued corresponding advisory circulars, e.g., in the United States of America. Additional sources of ionizing and non-ionizing radiation, e.g., due to weather phenomena have been identified and discussed in the scientific literature in recent years. This article gives an overview of the different generally recognized sources due to weather as well as space weather phenomena that contribute to radiation exposure in the atmosphere and the associated radiation effects that might pose a risk to aviation safety at large, including effects on human health and avionics. Furthermore, potential mitigation measures for several radiation sources and the prerequisites for their use are discussed. Full article
(This article belongs to the Special Issue Weather and Aviation Safety)
Show Figures

Figure 1

21 pages, 2674 KiB  
Article
Air Pollution Measurements and Land-Use Regression in Urban Sub-Saharan Africa Using Low-Cost Sensors—Possibilities and Pitfalls
by Asmamaw Abera, Kristoffer Mattisson, Axel Eriksson, Erik Ahlberg, Geremew Sahilu, Bezatu Mengistie, Abebe Genetu Bayih, Abraham Aseffaa, Ebba Malmqvist and Christina Isaxon
Atmosphere 2020, 11(12), 1357; https://doi.org/10.3390/atmos11121357 - 14 Dec 2020
Cited by 12 | Viewed by 4078
Abstract
Air pollution is recognized as the most important environmental factor that adversely affects human and societal wellbeing. Due to rapid urbanization, air pollution levels are increasing in the Sub-Saharan region, but there is a shortage of air pollution monitoring. Hence, exposure data to [...] Read more.
Air pollution is recognized as the most important environmental factor that adversely affects human and societal wellbeing. Due to rapid urbanization, air pollution levels are increasing in the Sub-Saharan region, but there is a shortage of air pollution monitoring. Hence, exposure data to use as a base for exposure modelling and health effect assessments is also lacking. In this study, low-cost sensors were used to assess PM2.5 (particulate matter) levels in the city of Adama, Ethiopia. The measurements were conducted during two separate 1-week periods. The measurements were used to develop a land-use regression (LUR) model. The developed LUR model explained 33.4% of the variance in the concentrations of PM2.5. Two predictor variables were included in the final model, of which both were related to emissions from traffic sources. Some concern regarding influential observations remained in the final model. Long-term PM2.5 and wind direction data were obtained from the city’s meteorological station, which should be used to validate the representativeness of our sensor measurements. The PM2.5 long-term data were however not reliable. Means of obtaining good reference data combined with longer sensor measurements would be a good way forward to develop a stronger LUR model which, together with improved knowledge, can be applied towards improving the quality of health. A health impact assessment, based on the mean level of PM2.5 (23 µg/m3), presented the attributable burden of disease and showed the importance of addressing causes of these high ambient levels in the area. Full article
(This article belongs to the Special Issue Challenges in Measuring and Assessing Environmental Health)
Show Figures

Figure 1

12 pages, 3756 KiB  
Article
The Lagged Effect of Anthropogenic Aerosol on East Asian Precipitation during the Summer Monsoon Season
by Su-Jung Lee, Yong-Cheol Jeong and Sang-Wook Yeh
Atmosphere 2020, 11(12), 1356; https://doi.org/10.3390/atmos11121356 - 14 Dec 2020
Cited by 2 | Viewed by 2372
Abstract
The authors investigated the lagged effect of anthropogenic aerosols (AAs) during the premonsoon season (April–May–June) on the East Asian precipitation during the postmonsoon season (July–August) using the aerosol optical depth (AOD) from a satellite dataset and reanalysis datasets. When the AOD is high [...] Read more.
The authors investigated the lagged effect of anthropogenic aerosols (AAs) during the premonsoon season (April–May–June) on the East Asian precipitation during the postmonsoon season (July–August) using the aerosol optical depth (AOD) from a satellite dataset and reanalysis datasets. When the AOD is high in Eastern China during the premonsoon season, the amount of precipitation increases in the western North Pacific, including the Korean Peninsula and Japan, during the postmonsoon season. The amount of cloud in the western-to-central North Pacific in the premonsoon season increases during the high-AOD period. Subsequently, it cools the sea surface temperature until the postmonsoon season, which strengthens the North Pacific High. The strengthened North Pacific High in the postmonsoon season expands to the western North Pacific, which leads to the enhancement of the moisture flows from the ocean. This results in the increase in precipitation in the western North Pacific, including the Korean Peninsula and Japan, during the postmonsoon season. Full article
(This article belongs to the Special Issue Aerosol-Climate Interaction)
Show Figures

Figure 1

12 pages, 10892 KiB  
Article
Air Pollution and Long Term Mental Health
by Younoh Kim, James Manley and Vlad Radoias
Atmosphere 2020, 11(12), 1355; https://doi.org/10.3390/atmos11121355 - 14 Dec 2020
Cited by 21 | Viewed by 3654
Abstract
We study the long-term consequences of air pollution on mental health, using a natural experiment in Indonesia. We find that exposure to severe air pollution has significant and persistent consequences on mental health. An extra standard deviation in the pollution index raises the [...] Read more.
We study the long-term consequences of air pollution on mental health, using a natural experiment in Indonesia. We find that exposure to severe air pollution has significant and persistent consequences on mental health. An extra standard deviation in the pollution index raises the probability of clinical depression measured 10 years past exposure by almost 1%. Women in particular seem to be more affected, but some effects persist for men as well. Pollution exposure increases the likelihood of clinical depression for women and also the severity of depressive symptoms for both sexes. It is not clear if men are more resistant to pollution or they simply recover faster from it. Education, perceived economic status, and marriage seem to be the best mitigators for these negative effects. Full article
(This article belongs to the Special Issue Contributions of Aerosol Sources to Health Impacts)
24 pages, 6405 KiB  
Article
Effect of Various Types of ENSO Events on Moisture Conditions in the Humid and Subhumid Tropics
by Daria Gushchina, Irina Zheleznova, Alexander Osipov and Alexander Olchev
Atmosphere 2020, 11(12), 1354; https://doi.org/10.3390/atmos11121354 - 13 Dec 2020
Cited by 14 | Viewed by 2948
Abstract
Moisture anomaly conditions within humid and subhumid tropics that are associated with different types of El Niño and La Niña phenomena are described and analyzed with a focus on their spatial distribution and seasonal variability. Five dryness indices (Keetch–Byram Drought Index, Weighted Anomaly [...] Read more.
Moisture anomaly conditions within humid and subhumid tropics that are associated with different types of El Niño and La Niña phenomena are described and analyzed with a focus on their spatial distribution and seasonal variability. Five dryness indices (Keetch–Byram Drought Index, Weighted Anomaly Standardized Precipitation Index, Standardized Precipitation Index, Palmer Drought Severity Index, and Percent of Normal Precipitation) were derived from ECMWF (European Centre for Medium-Range Weather Forecasts) fifth generation reanalysis (ERA5) reanalysis and University Corporation for Atmospheric Research (UCAR) datasets for the period from 1979 to 2019. Cross-correlation analysis was used to evaluate the relationships between the El Niño Southern Oscillation (ENSO) and selected dryness indices. To describe the seasonal variability of the ENSO–surface moisture relationships, the composite maps of dryness indices in different seasons were analyzed. The results showed a significant heterogeneity of the ENSO-induced moisture anomaly conditions both within and across various geographical regions. Four main areas in humid and subhumid tropics with the maximum effects of El Niño/La Niña events on the surface moisture conditions were found: Southeast Asia and Australia, Eastern and South Africa, Northeastern and Eastern South America, and Central America. It was shown that the effects of La Niña were usually opposite to those of El Niño, while the responses to the two types of El Niño differed mostly in the moisture anomaly intensity and its spatial patterns. Full article
Show Figures

Figure 1

16 pages, 3167 KiB  
Article
Farming Practices for Reducing Ammonia Emissions in Polish Agriculture
by Arkadiusz Piwowar
Atmosphere 2020, 11(12), 1353; https://doi.org/10.3390/atmos11121353 - 13 Dec 2020
Cited by 6 | Viewed by 3061
Abstract
The main source of ammonia emissions in Poland is agriculture. In 2017, approximately 94% of the total ammonia emissions in Poland came from agriculture, of which the largest part (78%) was related to livestock manure and 22% to nitrogen fertilization. This study presents [...] Read more.
The main source of ammonia emissions in Poland is agriculture. In 2017, approximately 94% of the total ammonia emissions in Poland came from agriculture, of which the largest part (78%) was related to livestock manure and 22% to nitrogen fertilization. This study presents the results of representative research on the implementation of technologies and techniques that reduce ammonia emissions on farms in Poland. The research methodology, including statistical data analysis (multiple correspondence analysis), allowed comparisons to be made of the applied low-carbon practices, taking into account farmers’ characteristics (e.g., age and education) and farm attributes (area size, location, etc.). According to the research, both in the case of mineral fertilization and animal production, farmers in Poland relatively rarely undertake pro-ecological practices aimed at reducing ammonia emissions. The most frequently undertaken activities include dividing the doses of nitrogen fertilizers (in terms of plant production) and the use of feed additives (in terms of livestock production). Empirical studies, supported by correspondence analyses, confirmed a significant differentiation of coexistence and strength of the relationship between the studied variables. The use of correspondence analysis made it possible to precisely recognize the differentiation and co-occurrence of variable categories. In the course of analytical work, a relatively strong correlation was found between the use of divided doses of nitrogen fertilizers and the economic size of farms (φ2 = 0.11571). In turn, the use of feed additives was most strongly determined by the economic size of farms (φ2 = 0.072614) and the location of farms (φ2 = 0.072223). Full article
(This article belongs to the Section Biosphere/Hydrosphere/Land–Atmosphere Interactions)
Show Figures

Figure 1

Previous Issue
Next Issue
Back to TopTop