Abstract
The effects of climate change on landslide activity may have important environmental, socio-economic, and political consequences. In the last decades, several short-term extreme rainfall events affected Mediterranean regions, resulted in damaging geo-hydrological processes and casualties. It is unequivocal that the impact of landslides in several Mediterranean countries is increasing with time, but until now, there has been little or no quantitative data to support these increases. In this paper, both rainfall conditions for the occurrence of shallow landslides and rainfall trends were investigated in the Portofino promontory, which extends in the Ligurian Sea, where heavy rainfall and related ground effects often occur. Adopting a frequentist approach, the empirical intensity-duration threshold was estimated. Our findings highlight that the rainfall intensity required to trigger landslides is lower for the same duration than those expected in other similar environments, suggesting a high susceptibility to rainfall-induced landslides in the Portofino territory. Further, the Mann-Kendall test and Hurst exponent were used for detecting potential trends. Analysis of long-term rainfall time series showed statistically significant increasing trends in short duration precipitation occurrence and rainfall rates, suggesting a possible future scenario with a more frequent exceedance of the threshold triggering value and an increase of landslide risk.
1. Introduction
The occurrence of rainfall-induced landslides and the effects of climate change on rainfall has been among the most debated and controversial scientific issues for some years because of the difficulty in forecasting and their serious environmental, socio-economic and political consequences, both at a global and regional scale.
In the last years, it has become apparent that the number of casualties and amount of economic losses due to shallow landslides and mud-debris flows have been dramatically increasing in Europe and worldwide [1,2,3,4,5,6,7,8,9,10]. But the quantification of the increasing impact of rainfall-induced landslides is still poor and supported by little empirical evidence.
It is commonly recognized by a large part of the scientific community that a change in the patterns of precipitation is unequivocal but irregular in space and time; an increase in global mean precipitation and in short-term extremes is expected, but both increasing and decreasing trends are projected at continental and regional scales [11,12,13]. For example, analysis developed for European and Mediterranean regions show different trends; an increase in total annual precipitation, rainfall intensity, and frequency of extreme rainfall events has been observed in several countries in Central and Northern Europe, whereas a common negative trend in annual precipitation has been detected in several Mediterranean areas [10,14,15,16]. In regards to Italian regions, a decreasing trend in the annual rainfall amount and the number of rainy days per year has been commonly recorded, with an increase in rainfall intensity [17,18,19]. Besides, it has been observed that the most intense events are often associated with high lightning activity [20] and convective systems.
Changes in rainfall intensity and spatial and seasonal distribution of precipitation may have negative consequences in ground effects, increasing the frequency and severity of geo-hydrological processes, such as damaging shallow landslides and destructive mud-debris flows [8,21,22,23,24,25,26,27,28,29,30,31,32]. However, the effects of climate change on landslides are difficult to predict. Even if extreme rainfall events seem to occur with a higher incidence in recent years, decisive evidence of an increasing trend in frequency and severity of rainfall-induced shallow landslides and mud-debris flows have not yet been established. Similarly, it is often difficult to quantify how the effects of climate variability or anthropogenic impact, including land-use changes and uncontrolled urbanization, may increase landslide risk [3,33,34,35,36,37,38].
From this perspective, knowledge of rainfall conditions able to trigger shallow landslides and information on distribution, temporal trends, and rates of change of precipitation are essential to assess the more suitable measures to forecast natural hazards to reduce landslide risk and at the same time to develop a more sustainable land-use planning and management.
Several methods have been proposed to identify rainfall thresholds for the possible initiation of landslides [39,40,41]. Due to the difficulties of defining physically-based thresholds, empirical approaches are commonly adopted to investigate correlations between rainfall events and landslide occurrence, in particular when an investigation is focused on the development of warning systems aimed at mitigating possible severe consequences and damage to property and the population [37,42,43,44,45,46,47]. The intensity-duration (ID) thresholds are the most employed empirical threshold to investigate shallow or rapid landslides, which are usually triggered by short-duration and high-intensity rainfall [48,49,50,51,52,53].
In order to analyze climatic tendencies and their impact on rainfall, numerous approaches have been proposed to identify significant variability in rainfall regimes at different temporal scales. A number of studies have carried out trend analysis in hydro-climatic time series using non-parametric tests because they can detect significant trends in time series, which display serial correlations and tolerate outliers of the data [54,55]. The Mann-Kendall (MK) test is the most common approach employed to identify statistically significant positive or negative trends in rainfall time series at different temporal scales at a given confidence level [56,57,58,59,60,61,62,63,64]. Other typical statistics used to estimate climate variability over time scale related to climate change are means, variances, cross- and auto-correlation, regression analysis, Sen’s t-test, and the Hurst coefficient [65,66]. Similarly, several researchers have investigated the effects of change in climate variables on the stability conditions of slopes and the possible variations in the probability of occurrence, type, and frequency of landslides [3,31,67,68,69]. However, consequences of climatic tendencies, e.g., trends in annual precipitation, intensity, and rainy days on rainfall conditions that trigger shallow landslides, are still less investigated.
The Portofino promontory is well-known for its attractive landscape and high natural and cultural heritage [70]. In recent decades, this sector of the Mediterranean has undergone several rainfall events, more and more characterized by short-duration and intense rainfall volumes, resulting in damaging geo-hydrological processes [53,71,72,73]. The promontory itself has been historically affected by destructive rainfall-induced shallow landslides and mud-debris flows, which have caused damage to buildings, infrastructure and have sometimes resulted in casualties. Therefore, the Portofino promontory represents a particularly interesting territory for evaluating the effects of climate change and related variability in rainfall on shallow landslide occurrence in terms of geo-hydrological risk reduction.
In this paper, we firstly investigated the rainfall conditions responsible for the occurrence of shallow landslides and mud-debris flows on the Portofino promontory. Collecting an inventory of historical rainfall and landslides events that occurred over the 1910–2019 period, we defined the empirical ID rainfall threshold, calculated using a frequentist approach; the aim was to increase the knowledge of correlations between precipitation and landslide initiation in the study area and to assess potential hazardous scenarios related to geo-hydrological processes.
Then, adopting the MK trend tests and Sen’s slope assessment, we analyzed the longer time series rainfall data available in the closeness of the Portofino promontory in order to detect possible trends and their magnitude. In addition, the Hurst exponent calculation was adopted to assess the eventual persistency of the series.
Finally, the effects of the detected precipitation trends on rainfall conditions that are able to trigger shallow landslides and mud-debris flows were discussed.
2. Study Area
2.1. General Settings
The Portofino promontory is located in the eastern sector of Liguria, Northern Italy, between Genoa city and Chiavari (Figure 1). The study area extends for 23 km2, with a coastal development of 27 km. It corresponds with the municipality boundaries of Camogli, Portofino, and Santa Margherita Ligure, three well-known seaside resorts in the Mediterranean area.
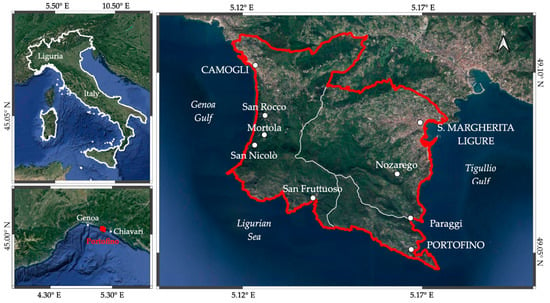
Figure 1.
Location of the Portofino promontory. The red line shows the study area; white lines represent the boundaries of the three municipalities.
The landscape of the promontory is featured by steep slopes, especially in southern and western sectors, and high cliffs (Figure 2). The relief reaches significant elevations (Mt. Pollone, 469 m; Mt. Tocco, 470 m; Mt. Portofino, 610 m a.s.l.) close to the coastline. Gentle hills characterize the eastern and northern sectors, where largely modified and urbanized small coastal floodplain extend along the final stretch of San Siro, Magistrato, and Santa Barbara creeks. The study area includes 68 catchments of small to very small sizes; surface areas are less than 1 km2, except for a few (Acqua Morta and San Siro creek, Gentile stream, and the upper Boate stream basin) which extend up to 5 km2 (Figure 2). Watercourses are generally short, steep, and straight, with irregular water flow. Riverbeds are frequently totally dry, particularly in the summer months or during a prolonged dry spell. Due to morphometric features, catchments have a short time of concentration, typically less than 1–2 h. Concentrated erosional processes are widespread, particularly along the narrow and steep incisions: during heavy rainfall events, run-off waters trigger large solid transport, thereby evolving into mud-debris flows.
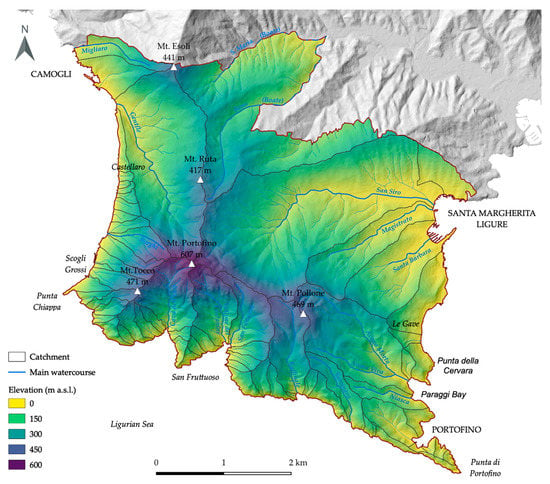
Figure 2.
Geographical setting of the Portofino promontory.
The bedrock of the Portofino Promontory is composed of sedimentary rocks (Figure 3) [74,75]. The Conglomerate of Portofino (Oligocene) crops out in the southern sectors and is made up of heterogeneous clastic elements in a sandy-limestone matrix [76], and characterized by several fault and fracture systems with a prevailing NW-SE and NE-SW orientation. Conglomerate overlays the Flysch of Mt. Antola (Cretaceous Sup-Paleocene), which consists of marly limestone, with shales, siltstones, and calcarenites interlayers, with several fracture and fold systems [77]. The contact between conglomerate and flysch is WNW-ESE oriented, which is partially due to tectonic activity, which strongly controls the structural and morphological settings of the promontory; from the complex fracture and fault systems, which intensely fractured both lithotypes, to the hydrographical network and the coastline and ridge orientation.
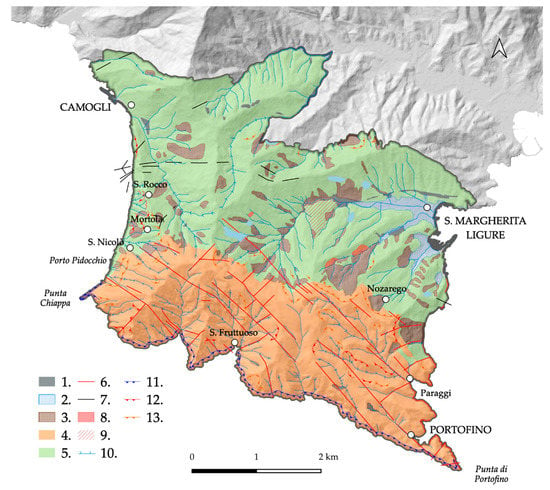
Figure 3.
Geological and geomorphological sketch map of the Portofino promontory: 1. Anthropic deposits; 2. Alluvial deposits; 3. Debris covers; 4. Conglomerate of Portofino; 5. Flysch of Mt. Antola; 6. Fault and presumed fault; 7. Fold axis; 8. Areas affected by rockfalls and widespread shallow landslides; 9. Deep-seated gravitational slope deformation; 10. Downcutting talwegs; 11. Cliff; 12. Active landslide or degradation scarp; 13. Inactive landslide or degradation scarp.
Due to the lithological, structural, and morphological settings, several landslides have affected the slopes of the Portofino promontory, particularly along the contact between the formations where the marly limestone flysch bedrock is present [72]. They include widespread shallow landslides, roto-translative and complex mass movements, with a different state of activity, and ancient deep-seated gravitational slope deformations, which re-activate occasionally [78]. Falls frequently affect the high western cliffs, locally favored by erosional processes caused by the sea waves action or sea storm surges from the prevailing SW sector (Libeccio auct.) [79].
Rockfalls and rapid shallow landslides may be observed on the steep southern slopes, formed in the conglomerate [80]. The high cliffs between Punta Chiappa and Portofino are frequently involved in rockfalls and topple, favored by the undercutting induced by the sea wave action by southwesterly winds (Libeccio auct.). Rockfalls also occur along the eastern cliffs, which are exposed to the sea wave action and sea storm surges produced by prevailing WE winds (Scirocco auct.). Rapid shallow landslides, including mud-debris flows, historically affect the steep, narrow small rocky valleys and canyons [81] produced by the intense erosional processes and downcutting talweg due to running waters.
Large sectors of the promontory are occupied by forests and vegetated areas. The high cliffs and the south-facing slopes represent open spaces with little or no vegetation, bare rocks, and small pebbly beaches in the little bays. Gentle slopes in the northern and eastern sectors of the promontory are largely occupied by agricultural lands, including widespread olive groves, both in use and abandoned. Both agricultural and re-vegetated areas are characterized by the presence of terraces, which have totally modified the former natural landscape [82]. Scattered buildings and discontinued urban areas characterize the slopes and the small coastal floodplains.
2.2. Meteorological Settings
The local orographic configuration strongly influences the climate condition of the Portofino promontory. The orientation of the high relief exceeds 600 m in elevation, and its proximity to the sea (<1 km) favor peculiar insolation and exposure conditions to marine winds. Consequently, the climate is mild, with moderate temperature and changeable, rainy weather. Precipitation is most abundant in autumn; depending on the orographic setting, the mean annual precipitation (MAP) ranges from 900 mm in the northern sector to 1300 mm at the highest elevation. The mean annual air temperature is approximately 16 °C. Generally, the warmest month is July, with air temperature values ranging between 21 °C and 27 °C, and the coldest one is January, with mean air temperature values ranging between 5 °C and 11 °C.
Rainfall and temperature values are typical of a Mediterranean climate with hot and dry summers and mild winter, Csa type (Hot-summer Mediterranean climate) [83]. According to the Thornthwaite climate classification [84], the climate ranges from humid, in the southern sector of the promontory, to very humid, in the internal and northern sectors and in the neighboring coastal areas.
Because of altitude effect, slope aspect, air humidity, and vegetation cover, the promontory is characterized by significant spatial climate variability, with several peculiar microclimates that enable significant biodiversity of fauna and vegetation [85,86]. In particular, three main microclimatic areas can be observed: (i) the southern slopes, characterized by a typically Mediterranean climate, with hot and dry summers and mild winters, long periods of insolation and exposure to hot southern winds, (ii) the northern slopes, featuring a typically continental climate, with mild summers and colder and rainier winters, favored by the larger exposure to the cold and dry northern currents, and (iii) the top of the relief, characterized by frequent and abundant rainfall and the presence of mists and orographic clouds also during the summer months, originating from the contact between the hot and humid currents, moving from the sea, and the dry and cold air masses flowing from the continental areas.
Intense and short duration rainfalls with high lightning activity [20] frequently occur in late summer or autumn months, from August to November, generated by a typical atmospheric circulation over the Genoa Gulf, called Genoa Low [87]. The peculiar orographic cyclogenesis is a low-pressure system generated by the contact over the sea between the Atlantic cold currents, moved from the Rodano valley and deviated to the NE by the Corsica relief, and the humid and cool winds, move from SW directions toward the N, to the Ligurian Sea. The substantial temperature contrast between humid and cold air masses and the warm sea surface generates a stationary low-pressure. The self-regenerating convective system, which usually moves with a typical V-shape from the sea towards the hinterland, results in localized and intense precipitation, which is frequently responsible for flash floods and shallow landslides or mud-debris flows.
Due to its great geological, geomorphological, climatic, and environmental value, the study area is largely included in the Natural Park of Portofino (18 km2) since 1935. The boundaries of the protected area were redefined in 2001, including the seaward area that became a marine reserve.
3. Materials and Methods
3.1. Data
Definition of the rainfall conditions able to trigger shallow landslides and debris flows is one of the most studied and argued topics in the geomorphological field. In the last years, several different approaches have been proposed to analyze the correlation between rainfall events and slope instability.
We started gathering all available information about rainfall-induced shallow landslides and mud-debris flows occurring in the study area since 1910. For this purpose, we went to different sources, including scientific papers, technical reports, archives of local municipalities, and newspaper articles [79,82,87,88]. Most of the historical data was collected from the inventory of information on sites historically affected by landslides and flood events in Italy in the period 1918–1990 of the AVI (Aree Vulnerate Italiane, Vulnerable Areas of Italy) Project of GNDCI-CNR (Gruppo Nazionale per la Difesa dalle Catastrofi Idrogeologiche del Consiglio Nazionale delle Ricerche, National Group for Geo-hydrological Disaster Protection of National Research Council [89].
Each slope failure was georeferenced within a GIS—Geographical Information System open sources software (QGIS 3.10), using regional base maps at 1:10,000 scale. All vector and raster data used are listed in Table 1. Since we have no real information on landslide size, we adopted punctual features. A geodatabase was compiled, containing (i) landslide type, according to Hungr et al. [90,91]; (ii) location, including administrative and geographical details (iii) spatial accuracy in the geographical location, from P1 (approximative location of slope failure within a buffer area < 1 km2 compared to the real location) to P3 (buffer area > 10 km2); (iv) data and time of the landslide occurrence; (v) temporal accuracy in estimating the time of landslides occurrence, from hourly (true occurrence time) to daily (occurrence time approximated to the end of the daily recording period); (vi) source of landslide information and/or archive where bibliographic research was carried out.

Table 1.
Vector and raster data used. IFFI (Italian Landslide Inventory) [92]; DTM (Digital Terrain Model).
Once the landslides had been georeferenced, a spatial analysis was carried out to identify the most representative rain gauge for each natural instability process. For each rainfall event that triggered slope failures, the most representative rain gauge was selected considering its location with respect to the minimum geographical distance and difference in elevation between the rain gauge and the landslide and the availability to validate functional rainfall measurements.
For events that occurred after 2003, we gathered rainfall information from the regional rainfall database of the Regional Agency for Environment Protection [93], which provides hourly rainfall cumulative values (in mm) and maximum monthly rainfall intensity values (in mm/h) for 1, 3, 6, 12 and 24 h periods. For the other events, and particularly for the historical ones, we collected rainfall information mainly from the Hydrological Series of the National Hydrographic and Oceanographic Service [94] and scientific literature or unpublished studies. All the rain gauges, both in use and dismantled, within the Portofino promontory and in the surrounding areas (Figure 4) that were used to define rainfall conditions that activated slope instability processes are listed in Table 2.
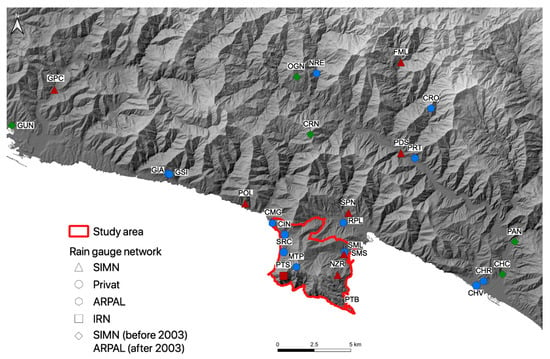
Figure 4.
Rain gauges available in the Portofino promontory and surrounding area classified by networks and type of rainfall data. Colored symbols represent different types of rainfall data: red, daily; blue, hourly; green, daily (before 2003) and hourly (after 2003). For rain gauge list, see Table 2.

Table 2.
Rain gauges used to define rainfall conditions that triggered shallow landslides and debris flows in the Portofino promontory. Type of rainfall data: H, hourly; D, daily. ARPAL = Regional Agency for Environment Protection of Liguria Region; IRN = Italian Royal Navy; SIMN = National Hydrographic and Oceanographic Service. For rain gauge location, see Figure 4.
3.2. Rainfall Threshold
By analyzing the pluviogram recorded by representative rain gauges for each event, we reconstructed the rainfall conditions associated with the first landslide trigger in terms of cumulate, E (in mm), duration, D (in h) and mean intensity, I (in mm/h). Among rainfall parameters, assessment of rainfall duration is a crucial step in the threshold definition, controlling the curve slope. Different methods have been proposed in the literature to extract rainfall duration [41]. We identified this parameter by measuring the period between the time of the landslides (end-time of the rainfall event) and the time when the rain started in the rainfall record of the representative gauge (start-time of the rainfall event) [95]. According to Tiranti and Rabuffetti [96], we set a standard period without rainfall to define the start/end time of each rainfall event. Because of the climatic conditions, we considered a minimum period without rainfall or with very low-intensity rainfall (<1 mm/h) of 12 h from April to September, and 24 h from October to March, as proposed for the neighboring Entella River basin [53].
In the literature, the definition of thresholds for the possible occurrence of rainfall-induced landslides rely on different approaches. In our study, we adopted the statistical frequentist approach proposed by Brunetti et al. [95] and modified by Peruccacci et al. [97] to assess the empirical ID curve representing the rainfall conditions able to trigger shallow landslides and mud-debris flows in the Portofino promontory and its associated uncertainties. For each event for which both accurate landslide and precipitation information were available, e.g., the location and date/time of landslide occurrence and the rainfall measurements for the most representative rain gauge, we plotted the rainfall conditions (in logarithmic coordinates) and fitted the cloud of empirical data points with a power-law curve. Adopting the non-parametric technique of Kernel Density Estimation (KDE) [98,99,100], we estimated the probability density of the differences, in terms of distances, calculated between I and the fit for each (D, I) point. Next, we modeled the distribution of the difference using a Gaussian function, and we established thresholds corresponding to different exceedance probabilities. The obtained threshold is represented by a power-law curve
where I is the intensity of the rainfall event (in mm/h), D is the duration of the rainfall event (in h), α is the intercept (scaling parameter), γ is the slope (shape parameter) of the power-law curve, ∆α and ∆γ are the associated uncertainties. In this study, we calculated the ID rainfall threshold at the 5% exceedance probability level. The associated uncertainties ∆α and ∆γ were defined in terms of the standard deviation of α and γ calculated for the remaining population of (D, I) value after sampling a single (D, I) value and repeating the procedure for all the (D, I) conditions used to define the threshold. Adopting the same approaches, we also defined thresholds for different periods, from 1910 to 2019, identified by the analysis of rainfall events triggering landslides and the features of the rainfall measurements.
I = (α ± ∆α) D(γ ± ∆γ)
3.3. Rainfall Historical Series Trend Evaluation
Using historical rainfall series acquired from the archives of the Regional Agency for the Protection of the Environment [93] and Hydrological Series [94], we analyzed the rainfall distribution, temporal trends, and rates in the study area, with the aim to identify significant variability in the pluviometry and the possible effects of climate change on rainfall conditions able to trigger shallow landslides on the Portofino promontory. Since rain gauges within the study area or close by the promontory were installed quite recently or they show gaps in their records, we used rain gauges located in the neighboring region for which historical data are available (Table 2): Chiavari, to the east, and Genova Ponte Carrega and Genova University, to the west (see location in Figure 4). For each station, we considered historical series at an annual time scale of mean rainfall, maximum rainfall intensity at 1, 3, 6, 12, and 24 h, and the annual number of rainy days for the maximum available periods, which were:
- Chiavari: 1877–2019 for annual rainfall and rainy days; 1932–2019 for hourly maximum.
- Genova University: 1833–2019 for annual rainfall and rainy days.
- Genova Ponte Carrega: 1939–2019 for hourly maximum.
First, the Mann-Kendall test (MK) was applied to check the presence of statistically significant annual trends for both rainy days and rainfall rate, calculated as the ratio between mean annual precipitation and number of rainy days, and maximum peak intensity at 1, 3, 6, 12 and 24 h. The MK test is a non-parametric test used to analyze the statistical significance of a trend in time series [101,102]. It is commonly employed for the trend analysis of climatic and hydrogeological variables [103], such as rainfall, temperature, and streamflow. This test checks the null hypothesis, which assumes there is no trend (i.e., data are independent and randomly ordered) against the alternative hypothesis, which assumes the existence of a monotonic increasing or decreasing trend over time for different confidence levels. We tested the null hypothesis at both 95% and 90% confidence levels. Further, the Theil–Sen [104,105] non-parametric regression technique was used for the trend estimation due to its high robustness in the slope assessment [106].
Then, the Hurst exponent (H) was calculated for the same rainfall time series. It provides a measure for the long-term memory spread of a dataset [107]. According to the H-value, which ranges between 0 and 1, non-stationary time series can be classified as (i) random (H = 0.5), meaning that the future values of the time series are not influenced by the present or past ones; (ii) anti-persistent (0 ≤ H < 0.5), which means that an up value is more likely followed by a down value and vice versa, and (iii) persistent (0.5 < H ≤ 1), which means the direction of the future value is more likely the same as current value [108]. The Hurst exponent was calculated using the software Origin2020 from OriginLab, both in the estimated rescaled range formulation and in the corrected one, proposed by Anis and Lloyd [109]. Recently several researchers have applied the H exponent in order to assess the characteristics of climatologic time series [110,111,112].
4. Results
4.1. Rainfall Events and Shallow Landslides
Historical research enabled to identify 85 rainfall events that triggered 114 landslides on the Portofino promontory in the period 1910–2019 (Table 3).

Table 3.
Rainfall events triggering shallow landslides and mud-debris flows on the Portofino promontory starting from the year 1910, organized in decades. For each year, the number in round brackets represents the number of rainfall events that triggered landslides.
The spatial distribution of shallow landslides and mud-debris flows are shown in Figure 5. The major number of instability processes affected the promontory area within the municipality of Camogli (54%), followed by Santa Margherita Ligure (30%) and Portofino (16%). Regarding the data accuracy, most of the landslides has a temporal accuracy ranging between date (43%) and day period (27%), whereas occurrence time is known only in few cases (5%): consequently, for a quarter of landslides, accurate information about the time of occurrence was not available. Most of the slope failures are mapped with high geographical accuracy (P1, 77%), and only a small number of landslides are located with a medium (P2, 14%) and low (P3, 9%) accuracy.
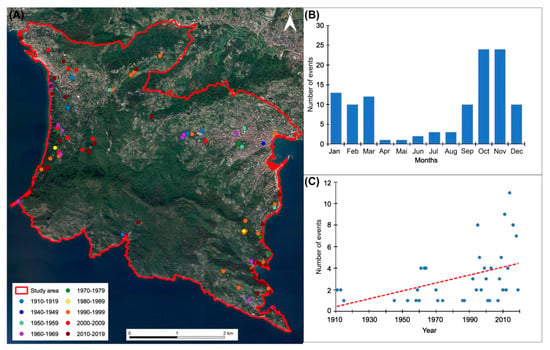
Figure 5.
(A) Spatial distribution of the rainfall-induced shallow landslides and mud-debris flows that affected the Portofino promontory over the 1910–2019 period. (B) Monthly distribution of slope instabilities triggered by precipitations over the 1910–2019 period. (C) Distribution of annual landslide occurrences over the 1910–2019 period.
Figure 5B shows the monthly distribution of the rainfall-induced mass movements. It highlights the first critical period in the autumn months, between October and November (21%, respectively), and the second one in winter (January, 12%). As shown in Figure 5C, the temporal distribution of shallow landslides and mud-debris flows reveals an increase of processes over the period from 1910 to 2019. Except for the 1960–1969 (10 landslide occurrences), the number of slope instabilities that affected the Portofino promontory over the last three decades was higher (12 in 1990–1999 and 13 in 2000–2009) to significantly higher (34 in 2010–2019) than those observed over the former period.
One of the most important processes affected the western sector of the promontory on 28 October 1961, when the rain gauges located at San Pietro di Novella and Santa Margherita Ligure recorded cumulate rainfall peaks of 276 mm and 112.8 mm in 3 h respectively, corresponding to 96% and 99% of the cumulated rainfall amounting to 24 h respectively [79,93,94]. The intense precipitation caused severe and widespread shallow landslides and mud/debris flows close to San Rocco and Castellaro, at Camogli, and flooding in Santa Margherita Ligure (San Siro Stream) (Figure 6A,B).
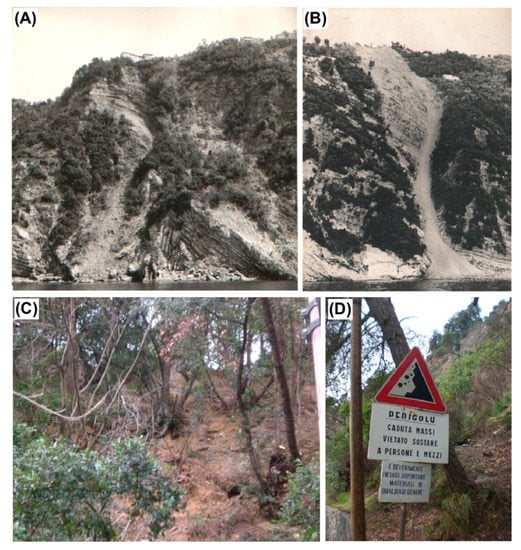
Figure 6.
(A) Debris flow affected slope downstream San Rocco along the western coast on 28 October 1961 (photo R. Terranova); (B) New debris flow occurred on 24 March 1964, in the same coastal sector previously involved in instability processes (photo R. Terranova); (C) Erosional processes and widespread shallow landslides along the slope at Le Gave, after the events in 1987, 1995 and 1996 (photo R. Bovolenta); (D) Warning notice for possible rockfall along the road crossing the ancient coastal landslide body at Le Gave (photo R. Bovolenta). See location in Figure 2.
Similar intense, critical precipitations, with a cumulate of 100 mm and a rainfall intensity peak of 47 mm in the 24 h recorded by the rain gauge at Santa Margherita Ligure (see location in Figure 3), affected the eastern slope of the promontory at Le Gave on 16 January 1987. A large rockfall involved approximately 200 m3 of materials and caused damage to the municipal road and several terraces, gardens, and trees along the tracks of the boulders [94,113]. In winter and autumn time, damaging debris flows and shallow landslides also occurred in October 1995 and January 1996 [113] (Figure 6C,D).
However, some of the most critical and destructive events occurred in summer or late summer. On 25 September 1915, an extreme rainfall event, with 440 mm in less than 24 h recorded at Santa Margherita Ligure [79,89,114], triggered a large debris flow down the Fontanini creek, which affected the historical hamlet of San Fruttuoso, partially destroying the ancient abbey and generating a new small beach in front of it (Figure 7A,B). More recently, on 26 July 2014, a very intense, short-duration shower, with 120 mm in 2 h recorded by the Monte di Portofino rain gauge caused the collapse of some terraces and the initiation of a mud-debris flow along the San Fruttuoso creek, resulting in severe damage to touristic facilities at the seaside (Figure 7C,D).
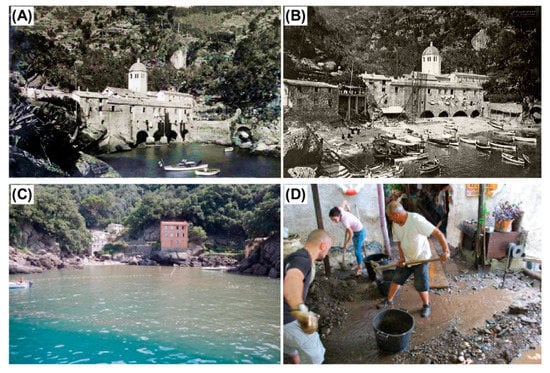
Figure 7.
(A) San Fruttuoso bay and its hamlet in 1910 when the sea lapped against rocks and the ancient arcade (photo from the historical archive of Agenzia Bozzo, Camogli); (B) The new small beach in front of the abbey in 1920 generated by debris and materials carried downstream the Fontanini creek by running water during the damaging rainfall event on 25 September 1915 (photo from the historical archive of Agenzia Bozzo, Camogli); (C) Suspended sediment load inside the bay transported downstream the San Fruttuoso creek by intense and short-lived rainfall on 26 July 2014; (D) Damage to tourist structures and facilities in San Fruttuoso hamlet caused by the mud-debris flow occurred on 26 July 2014.
4.2. Rainfall Threshold
Using a cluster of 69 rainfall events triggering 94 slope failures for which landslide and rainfall information are known with sufficient geographical and temporal accuracy, the empirical ID-rainfall thresholds for the possible initiation of shallow landslides on the Portofino promontory was established adopting a Frequentist approach. Figure 8 shows the curves corresponding to 5% exceedance probability and its associated uncertainty Δα and Δβ. Black dots represent the distribution of the 69 rainfall conditions I, D that have resulted in shallow landslides and debris flows in the study area between 1910 and 2019. The Grey pattern shows a proxy for the uncertainty associated with each threshold.
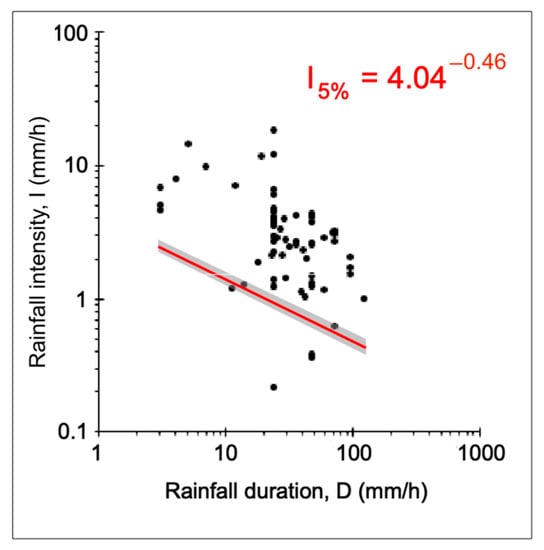
Figure 8.
Rainfall thresholds obtained for the possible initiation of shallow landslides and mud/debris flows on the Portofino promontory corresponding to a 5% exceedance probability level (red curve) and associated uncertainty (grey pattern).
The red curve in Figure 8 is the threshold corresponding to the 5% exceedance probability with the equation:
I = (4.04 ± 0.14) D (−0.46 ± 0.01)
Rainfall events that have triggered shallow landslides on the Portofino promontory used to establish the thresholds were in the range of duration 3 h ≤ D ≤ 122 h, and in the range of mean intensity 0.2 mm/h ≤ I ≤ 18.3 mm/h.
4.3. Rainfall Historical Series
The longer rainfall series available have been used to assess the long-time trend in precipitation features: Genova University, Genova Ponte Carrega, and Chiavari data. The first one provided the annual rainfall and rainy days in the period 1833–2019, the second one the hourly maximum annual rainfall in the period 1939–2019, and the latter annual rainfall and rainy days in the period 1877–2019 and the hourly maximum annual rainfall in the period 1932–2019. Besides, the three rain gauges are along the coastline, then in a similar physiographical context of the Portofino promontory, and they border it to the west and to the east directions. Further, due to the Genoa Low cyclogenesis, the coastline between Genova and Chiavari is entirely comprised of a higher probability heavy rainfall area [73,115].
Descriptive statistics are displayed in Table 4 and Table 5. Rainfall rate values are generally higher in Chiavari due to the lower numbers of rainy days. In particular, the maximum number of rainy days registered at Genova University station is considerably higher than the one measured in Chiavari. Hourly annual maximum precipitations were quite similar for the 1, 3, and 6 h spans in Genova University and in Chiavari, while they were considerably different for 12 and 24 h. In particular, the maximum values in 12 and 24 h durations in Genova were almost double the ones in Chiavari.

Table 4.
Descriptive statistics for rainfall rate and rainy days at Genoa University (1833–2019) and Chiavari (1877–2019) rain gauges.

Table 5.
Descriptive statistics of hourly rainfall at Genoa Ponte Carrega (1939–2019) and Chiavari (1932–2019) rain gauges.
The Mann-Kendall trend test analysis for Genova University and Chiavari series supplied a partially coherent indication (Table 6). The 187 years long Genova University series showed a decreasing number of rainy days and an increasing rainfall rate at 95% confidence; the 143 years Chiavari series showed a decrease in rainy days at the same confidence level, while no trend could be found for the rainfall rate, as testified by the relative high p-value in Table 6. Besides, in this latter case, Sen’s slope and the lower and upper confidence levels were not coherent, as expected, no trend was identified.

Table 6.
Mann-Kendall trend test results at 95% confidence for rainfall rate (RR) and rainy days (RD) series at Genoa University (1833–2019) and Chiavari (1877–2019) rain gauges.
No statistically significant trends were found in the 1, 3, 6, 12, and 24 h data, both for the Genova Ponte Carrega 81-year series and in the Chiavari 88-year one. The Mann-Kendall trend tests were performed at a 90% confidence level, without producing any significant result.
The Hurst exponent calculation for Genova University and Chiavari rainy days and rainfall rate series are shown in Table 7; values, both for the simple computation and for the corrected one, indicating a persistent series in both the variables and this indication was particularly strong for rainfall rate at Genova University station. Only rainy days series in Chiavari presented a lower value, close to 0.5 in the corrected calculation, indicating a possible weaker persistence in the series. On the other hand, the rainfall rate in Chiavari showed a possible persistence feature.

Table 7.
The Hurst exponent, both classical formulation and the corrected one, for rainfall rate (RR) and rainy days (RD) series at Genova University (1833–2019) and Chiavari (1877–2019) rain gauges.
Hurst exponent calculation was performed even for the 1, 3, 6, 12, and 24 h yearly maximum in Genova Ponte Carrega and in Chiavari (Table 8). Persistency was clearly recognized in 1h series in Genova Ponte Carrega and in the 3, 6, and 12-h series in Chiavari, with the other series showing weaker persistency indications, as testified in particular by the corrected values.

Table 8.
The Hurst exponent, both classical formulation and the corrected one, for hourly rainfall series at Genova Ponte Carrega (1939–2019) and Chiavari (1932–2019) rain gauges.
5. Discussion
5.1. Rainfall Thresholds
Analysis of the rainfall events that generated shallow landslides and mud-debris flows on the Portofino promontory between 1910 and 2019 revealed that this Mediterranean sector was frequently affected by severe geo-hydrological processes, which caused damage to buildings, structures, and infrastructure. Most destructive events were observed chiefly in autumn and winter months, when warm and moist air from the south and cold air from the north collide, generating local convective thunderstorms which resulted in very intense rainfall.
Except for the 1920s and 1930s, for which no evidence has been found, rainfall-induced landslides occurred regularly over the 1910–2019 periods, with an increasing occurrence of geo-hydrological processes over the last three decades. However, we cannot exactly know if the lack of events (1920–1939) or their minor numbers is due to information gaps in the historical sources or to the absolute absence of processes. Considering equal 39-years intervals, we observed that the number of rainfall events resulting in landslides had been increased from four in the 1910–1949 period (0.1 events/year) to 22 in the 1950–1989 periods (0.5 events/year) and up to 59 in the 1990–2019 periods (two events/year).
Rainfall analysis revealed that the range of (D, I) conditions that likely result in shallow landslides and mud-debris flows in the Portofino region occupies a low position in the (D, I) diagram. We compared the established thresholds for the Portofino promontory to other ID curves proposed in the literature for the possible initiation of shallow landslides and debris flows in similar topographical and climate regions in Italy and worldwide (Table 9). We considered both global, regional, local, and single catchment thresholds.

Table 9.
ID rainfall thresholds for the possible initiation of shallow landslides in similar mountain and climate regions in Italy and worldwide. Geographical extent: G, global; R, regional; L, local; C, single catchment. Area: where the threshold has been defined. Landslide type: A, all; D, debris flow; Sh, shallow landslide. Range: range of validity for the threshold (in h). Notes: annotation about the curve type and the approach adopted in threshold definition. Source: 1. Caine [48]; 2. Ceriani et al. [116], 1994; 3. Crosta and Frattini [117]; 4. Jacob and Weatherly [118]; 5. Marchi et al. [119]; 6. Aleotti [42]; 7. Floris et al. [120]; 8,9. Giannecchini [121]; 10. Guzzetti et al. [40]; 11. Brunetti et al. [95]; 12,13. Cevasco et al. [122]; 14,15. Peruccacci et al. [123]; 16. Roccati et al. [53].
Visual inspection of Figure 9 suggested the following consideration: Except for the global curve (#10) defined by Guzzetti et al. [40], in the range of validity for the thresholds (1 h < D < 122 h), the new threshold established for the Portofino promontory were generally lower or much lower than other curves. In particular, the local threshold defined in the present work was substantially lower than the local curves defined for the Valzangona area, Northern Apennines (#7) [120], and the Apuan Alps (#8, #9) [121]. Similarly, it was significantly lower than the curves proposed for the Moscardo mountain catchment, North-eastern Alps (#5) [119], and those defined for the Bisagno stream (#12, #13) [122] and the Entella river (#16) [53] basins. Moreover, the threshold obtained for the Portofino promontory was very lower than the regional curves proposed by Ceriani et al. [116] and Aleotti [42] for the Lombardy (#2) and Piedmont (#6) Regions, respectively, and lower than the regional ones proposed by Brunetti et al. [95] for the Abruzzo Region (#11). That means that the rainfall intensity able to initiate shallow landslides on the Portofino promontory is lower to considerably lower for any given rainfall duration than the rainfall conditions expected in other territories in Italy and worldwide on average. As shown in Figure 10, the threshold obtained in the present work was comparable to the curve established by Jacob and Weatherly [118] for the North Shore Mountains, Canada (#4). We noted that the new threshold was also lower to slightly lower than the curves established by Peruccacci et al. [123] for the physiographical and climatic regions in Italy in which the Portofino area is included; in particular, the Apennines mountain province (#14) and the Csa climate region, i.e., regions with a temperate climate with dry and hot summers (#15).
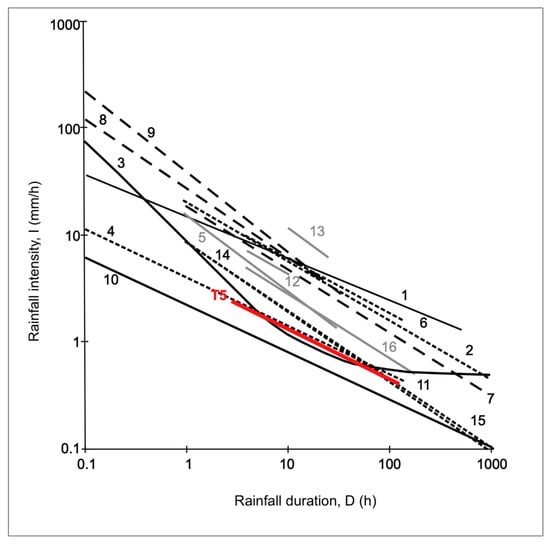
Figure 9.
Comparison between the ID threshold established for the Portofino promontory and threshold curves available in the literature for the possible initiation of shallow landslides in Italy and worldwide (Table 4). The red curve is the new threshold obtained in the present work. Black curves represent global thresholds, dotted and broken black curves portray local and regional thresholds, respectively, grey curves symbolize thresholds defined for single catchments.
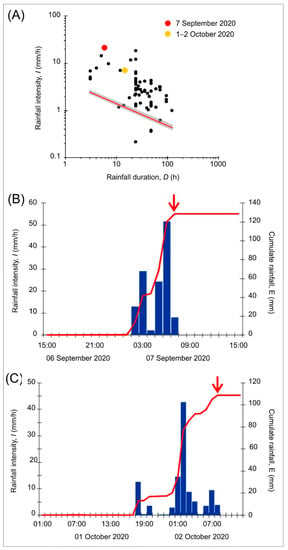
Figure 10.
(A) Rainfall conditions (gray dots) that resulted in shallow landslides on Portofino promontory: colored dots show rainfall conditions for the 7 September 2020 (red) and the 1–2 October 2020 (yellow) events; the black line represents the 5% rainfall threshold. (B) Hourly rainfall (blue bars) and cumulated event rainfall (red line) for the 7 September 2020 recorded at Santa Margherita rain gauge. (C) Hourly rainfall (blue bars) and cumulated event rainfall (red line) for the 1–2 October 2020 recorded at Rapallo rain gauge. Red arrows identify the time of landslides occurrence (true or assumed).
We stress the fact that the comparison between our thresholds and the other considered curves were affected by a degree of subjectivity and uncertainty. As highlighted in Table 9, rainfall thresholds taken from the literature were established using different methods (manual fitting, statistical or probabilistic approach, corresponding to the different level of exceedance probability) and different scales of analysis (global, regional, local or single catchment). Moreover, different types of landslide and/or rainfall data were analyzed, and different criteria were adopted to identify the rainfall events and critical rainfall conditions that have triggered landslides, information that frequently was not clearly expressed and described by the authors of the papers. For example, some threshold analyses were performed using information from only a few severe meteorological events [41,117] or hundreds of rainfall events that triggered landslides [40,123]. Different types of landslides were considered: shallow landslides [53,117], shallow landslides associated with debris flows [40,48] or soil slips [122], or all landslide types that affected the investigated territory [116,119]. Moreover, different criteria were adopted to define the extent of rainfall events, which is closely correlated to the mean rainfall intensity and, consequently, to the slope of the curves; for instance, a rainfall event was separated from the preceding and the following events by a dry period without rainfall where ranges depended on the seasonal conditions [53,95,123].
We noted that our local threshold was systematically lower than the regional and local curves taken from literature, which was unexpected, as local thresholds generally predict the initiation of rainfall-induced landslides for higher average rainfall intensity than regional thresholds [40]. The low position of the new curve is probably linked to the peculiar lithological, morpho-structural, and land-use settings and climate conditions of the Portofino territory that are recognized as being able to generate hazardous geo-hydrological conditions in similar Ligurian basins.
Moreover, the rainfall conditions required to initiate shallow landslides and mud-debris flows on the Portofino promontory were lower to significatively lower than those obtained for some neighboring Ligurian basins, i.e., the Bisagno stream [122] and the Entella river [53], which are a few kilometers away from the promontory. We attributed such differences first of all to the significant spatial variability of the meteorological conditions within this Mediterranean region, characterized by MAP values which range substantially within few kilometers (Chiavari, 1120 mm/y; Neirone, 1520 mm/y; Rapallo, 1390 mm/y; Santa Margherita Ligure, 1120 mm/y; Monte di Portofino, 1200 mm/y; Camogli, 1210 mm/y; Colonia Arnaldi, 1600 mm/y; Genova Ponte Carega, 1350 mm/y; see location in Figure 4); and the frequent occurrence of convective thunderstorms, short-duration and high to very high-intensity rainfall events, with an extremely localized extent [20,124]. Secondarily, we attributed the position of the curve in the lower part of the ID diagram to the type of rainfall events considered and the uncertainty associated with rainfall measurements. A significant number of events that resulted in shallow landslides on the Portofino promontory in the considered period were particularly severe and damaging rainfall events, with large amounts of cumulated rainfall in few hours and consequently high mean intensity values. Regarding the pluviometric measurements, a certain inconsistency was introduced by difficulties in obtaining hourly rainfall data, in particular for the historical events for which Hydrological Annals give only daily hours recorded in the 24 h antecedent at 9:00 a.m. (time of the daily data gathering). Because of a gap in records common to all gauges between 1999 and 2001, rainfall measurements correlated to landslide occurring over this period were obtained from different sources, e.g., scientific papers and event reports.
To test the validity of the obtained threshold, we used independent landslide information [125]. We considered shallow landslides triggered by the rainfall events that affected the Portofino promontory recently, on 7 September and 1–2 October 2020.
On 7 September 2020, a very intense rainstorm hit the whole area for a period of few hours; the rain gauge located at Santa Margherita recorded a cumulate rainfall of 128.4 mm in 6 h between 01:00 and 07:00 UTC, with an hourly maximum peak rainfall intensity of 51.6 mm between 05:00 and 06:00 UTC. Whereas, on 1–2 October 2020, a convective system remained for several hours on the area; heavy rainfall affected the eastern slopes of the promontory extensively in the Santa Margherita and Portofino municipalities, with a cumulate rainfall of 108.4 mm in 15 h at Rapallo and an hourly maximum peak rainfall intensity of 42.8 mm/h on 1 October between 01:00 and 02:00 UTC. As shown in Figure 10, the (I, D) points were associated with both rainfall events as all plotted above the established threshold curve.
5.2. Rainfall Trends
The physical setting of the Portofino promontory, lying at a short distance and between Genova and Chiavari, allowed extending some results that emerge from their rainfall time series analysis to it. Both the Mann–Kendall trend test and Hurst exponent analysis allow some considerations in terms of the past rainfall features. Figure 11 and Figure 12 present respectively Genova University and Chiavari rainy days and rainfall rate data: the full series scatterplot, the moving average at 30 years, the Theil-Sen trend with the lower and upper confidence (95%) slope values. The previously recognized trends appeared confirmed by the moving average. Increasing rainfall rate and decreasing rainy days probably increased the criticalities in the area due to a more probable or more frequent exceedance of threshold as previously calculated. This could have reflected in more frequent shallow landslide triggering and resulting in a higher hazard.
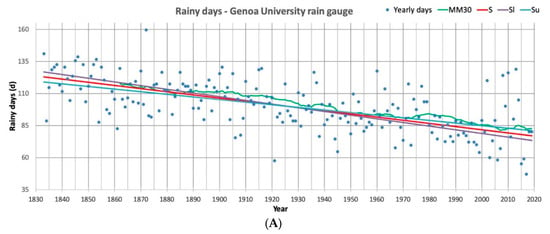
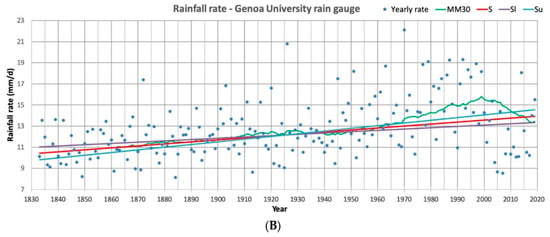
Figure 11.
Rainy days (A) and rainfall rate (B) series scatterplot for Genoa University rain gauge (1833–2019); MM30: mean mobile at 30 years; S: Sen’s trend line; Sl: Sen’s lower confidence (95%) slope; Su: Sen’s upper confidence (95%) slope.
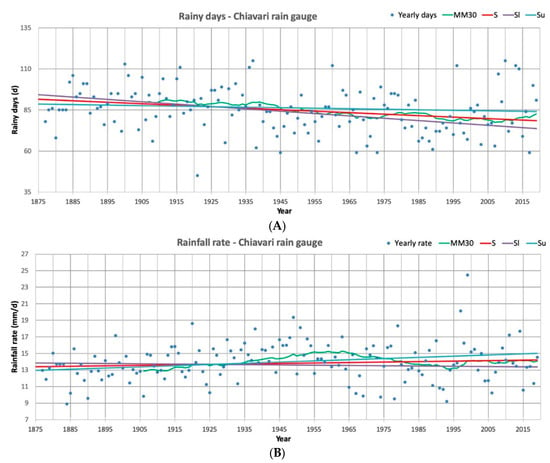
Figure 12.
Rainy days (A) and rainfall rate (B) series scatterplot for Chiavari rain gauge (1877–2019); MM30: mean mobile at 30 years; S: Sen’s trend line; Sl: Sen’s lower confidence (95%) slope; Su: Sen’s upper confidence (95%) slope.
In this sense, while Genova University series showed a clearer trend, Chiavari ones presented a weaker indication, with lower slope values both on rainy days and in rainfall rate. A further consideration appears from the rainfall rate series at Genova University station: values in 1872, 1927, and 1970, which were the highest ones calculated in the 30 years periods 1870–1899, 1900–1929 and 1960–1979, respectively, appeared to increase in intensity. These values are evidence of the persistency feature of the series that is furtherly confirmed by the last 100 years’ data that show increasing maximum figures. This characteristic appears weaker in the Chiavari series (Figure 12).
In Figure 13, the comparison between 1, 3, 6, 12, and 24 h yearly maximum at Genova Ponte Carrega and Chiavari stations are shown. For short durations (1, 3, and 6 h), Genova station presented some periodic higher values, respectively over 80 mm/h, 140 mm/3 h, and 190 mm/6 h diffused along with the whole time series, while in Chiavari, these were concentrated in the first part (1932–1962). Besides, for the 12 and 24 h longer durations, Genova showed the highest values (over 300 mm/12 h and 350 mm/24 h) in the recent period (1970, 1992, 2011), while Chiavari presents lower values along with the whole time series. Particularly in the shorter duration series, Chiavari recently did not reach the higher values touched at the beginning of the series as, on the other side, Genova did. This discordance could be potentially attributable to the strong spatial variability of the intense precipitations caused by the Genoa Low. The higher duration series of 12 and 24 h were clearly dominated by the higher values (over 380 mm/12 h and 410 mm/24 h) recorded at Genova Ponte Carrega station. Despite the lack in identifying trends in the 1, 3, 6, 12, and 24 h series, the persistency features evidenced by the Hurst exponent emerge and may be extended to the Portofino promontory, stressing the critical conditions in terms of rain intensity and, consequently, of shallow landslides hazard.
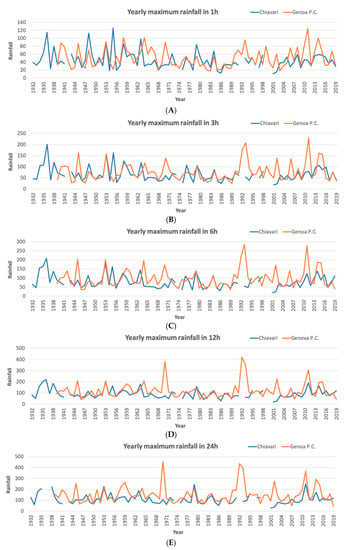
Figure 13.
Maximum rainfall in 1 (A), 3 (B), 6 (C), 12 (D), and 24 (E) h in the yearly series of Chiavari (1932–2019) and Genova Ponte Carrega (1939–2019).
5.3. Effects of Rainfall Trends on Landslides Occurrence
Further evidence of changes in long-term rainfall trends and their effects on the rainfall conditions triggering landslides on Portofino promontory was provided by the comparison between rainfall thresholds defined for different periods from 1910 to 2019. The two periods (1910–1999 and 2000–2019) were identified based on the analysis of rainfall data. They were also comparable in terms of numbers of events and correspond with the different types of rainfall measurements available. As shown in Figure 14, for the same duration, an increase in the rainfall intensity was observed for the 1915–1999 and the 2000–2019 periods. This corresponded to an increased hazard related to shallow landslides triggering. Then, the analysis performed in terms of rainfall time series trends and related ground effects appeared to coherently identify a changing condition over an extended period of time.
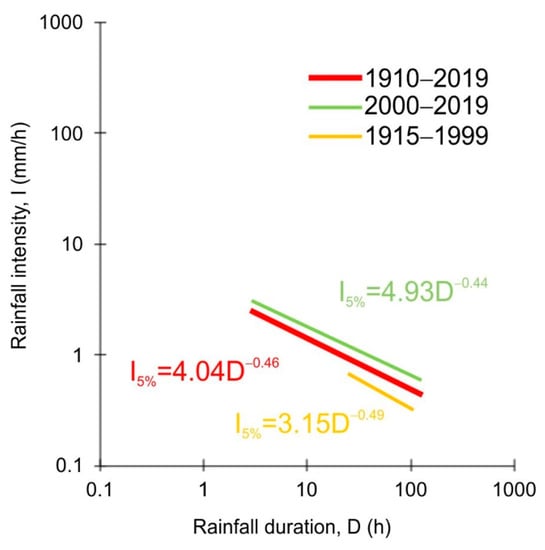
Figure 14.
Comparison between the rainfall threshold established for different periods, from the past to the present: 1910–1999 (yellow curve), 2000–2019 (green curve), and 1910–2019 (red curve).
Further, analyzing the rainfall rate coefficient of variation in 30 years periods (Table 10) for both the rainfall series, a temporal increase appeared. This effect is qualitatively shown in Figure 11 and Figure 12. The second halves of the series show an alternation of high values and low ones, while the first halves of the series present less scattered values. The last 1990–2019 period presented the highest coefficient of variation values for both the rainfall gauges (Table 10).

Table 10.
The Rainfall Rate Coefficient of Variation (CV) for Genova and Chiavari rain gauges, computed over 30 year periods.
Finally, some more reflections were done in terms of possible future scenarios, considering statistical downscaling and modeling achieved by many authors for the Mediterranean area [126,127,128]. While the yearly medium precipitation in the study area should be subject to small variations or reduction, an increase in extreme events is considered to be probable. In particular, Goubanova and Li [126] and Drobinski et al. [127], investigating possible future scenarios of climate extremes, highlight an increasing tendency of more intense precipitation events for the studied area, particularly in fall and winter. This scenario is coherent with the observed increasing tendency of rainfall rate mainly evidenced by the Genova rainfall gauge.
6. Conclusions
In the present study, we investigated the rainfall conditions that result in landslides in a coastal Mediterranean area characterized by peculiar geological, morphological, and climate settings, which underwent increasing natural hazards chiefly due to climate change and anthropogenic pressure. The Portofino promontory has been historically affected by severe and damaging geo-hydrological processes. We identified 85 rainfall events that overall triggered 114 shallow landslides and mud-debris flows in the region over a 109-year period from 1910 to 2019.
Using a cluster of 69 rainfall events triggering 94 slope failures for which landslide and rainfall information are known with sufficient geographical and temporal accuracy, an empirical ID threshold was established, adopting a Frequentist approach. The new curve was systematically lower than regional and local ones proposed in the literature for similar environments in neighboring Ligurian basins, in Italy and worldwide. We attribute the low range of I, D conditions chiefly to the geological, geomorphological, orographic, and meteorological settings of the promontory that greatly increase the susceptibility to rainfall-induced shallow landslides and, secondarily, to the type of rainfall events used for the analysis.
Historical rainfall time series were analyzed with the aim to identify potential trends and assess their significance over the occurrence of shallow landslides on the promontory.
The statistically significant trend that emerged from the performed analysis suggests a possible future increase of shallow landslides hazard. Short duration rainfall and a general rainfall rate increase would result in a more frequent exceedance of threshold triggering values. This situation may result exacerbated in the framework of climate change scenarios, that in the Mediterranean area, evidence an increase in temperatures and a possible increase in rain intensity [128,129]. In the next years, new local rainfall trends may be assessed using the rainfall series that will be implemented within the monitoring program of the RECONECT project (Regenerating ECOsystems with Nature-based solutions for hydrometeorological risk rEduCTion), for which the Portofino Natural Regional Park represents the Italian case study [129].
In a world where the effects of human impact on climate and natural processes are becoming more severe and catastrophic every year, analysis of temporal variations in precipitations and their consequences on the conditions responsible for landslides initiation represent a challenge and an essential instrument to assess the possible scenarios and support decision-makers and stakeholders in sustainable land-use and planning and landslides risk management.
Author Contributions
Conceptualization, A.R., G.P., and L.T.; methodology, A.R. and G.P.; software, A.R. and G.P.; validation, F.F.; formal analysis, A.R. and G.P.; investigation, A.R. and G.P.; resources, F.F.; data curation, A.R., F.F., and G.P.; writing—original draft preparation, A.R. and G.P.; writing—review and editing, F.L., F.F., and L.T.; visualization, A.R.; supervision, F.L. and L.T.; project administration, F.L.; funding acquisition, F.F. and L.T. All authors have read and agreed to the published version of the manuscript.
Funding
This article is an outcome of the RECONECT project (Regenerating ECOsystens with Nature-based solutions for hydro-meteorological risks eEduCTion). This project received funding from the European Union’s Horizon 2020 research and Innovation Program under grant agreement No. 776866.
Conflicts of Interest
The authors declare no conflict of interest.
References
- European Environment Agency. Mapping the Impacts of Recent Natural Disasters and Technological Accidents in Europe; Environmental Issue Report 35; European Environment Agency: Copenhagen, Denmark, 2003; pp. 1–47. ISBN 92-9167-630-6. Available online: https://www.eea.europa.eu/publications/environmental_issue_report_2004_35 (accessed on 14 September 2020).
- Bryant, E. Natural Hazards, 2nd ed.; Cambridge University Press: Cambridge, UK, 2005; pp. 1–312. ISBN 978-0-521-53743-8. [Google Scholar]
- Petley, D.N.; Dunning, S.A.; Rosser, N.J. The analysis of global landslide risk through the creation of a database of worldwide landslide fatalities. In Landslide Risk Management; Hungr, O., Fell, R., Couture, R., Eberhardt, E., Eds.; A. Balkema: Amsterdam, The Netherland, 2005; pp. 367–374. [Google Scholar]
- Nadim, F.; Kjekstad, O.; Peduzzi, P.; Herold, C.; Jaedicke, C. Global Landslide and Avalanche Hotspots. Landslides 2006, 3, 159–173. [Google Scholar] [CrossRef]
- European Environment Agency. Mapping the Impacts of Natural Hazards and Technological Accidents in Europe—An Overview of the Last Decade; Environmental Issue Report 13; European Environment Agency: Copenhagen, Denmark, 2010; pp. 1–146. Available online: https://www.eea.europa.eu/publications/mapping-the-impacts-of-natural (accessed on 14 September 2020). [CrossRef]
- Petley, D. Global patterns of loss of life from landslides. Geology 2012, 40, 927–930. [Google Scholar] [CrossRef]
- Nadim, F.; Jaedicke, C.; Smebye, H.; Kalsnes, B. Assessment of Global Landslide Hazard Hotspots. In Landslides: Global Risk Preparedness; Sassa, K., Rouhban, B., Briceño, S., McSaveney, M., He, B., Eds.; Springer: Berlin, Germany, 2013; pp. 59–71. [Google Scholar] [CrossRef]
- Wood, J.L.; Harrison, S.; Turkington, T.A.R.; Reinhardt, L. Landslides and synoptic weather trends in the European Alps. Clim. Chang. 2016, 136, 297–308. [Google Scholar] [CrossRef]
- Froude, M.J.; Petley, D.N. Global fatal landslide occurrence from 2004 to 2016. Nat. Hazards Earth Syst. Sci. 2018, 18, 2161–2181. [Google Scholar] [CrossRef]
- International Federation of Red Cross and Red Crescent Societies; Sanderson, D.; Sharma, A. World Disasters Report 2018: Leaving No One Behind; International Federation of Red Cross and Red Crescent Societies: Geneva, Switzerland, 2018; ISBN 978-2-9701289-0-8. Available online: https://media.ifrc.org/ifrc/world-disaster-report-2018/ (accessed on 14 September 2020).
- Dore, M.H.I. Climate change and changes in global precipitation patterns: What do we know? Environ. Int. 2005, 31, 1167–1181. [Google Scholar] [CrossRef]
- Kyselý, J.; Beguería, S.; Beranová, R.; Gaál, L.; López-Moreno, J.I. Different patterns of climate change scenarios for short-term and multi-day precipitation extremes in the Mediterranean. Glob. Planet. Chang. 2012, 98, 63–72. [Google Scholar] [CrossRef]
- IPCC. Intergovernmental Panel on Climate Change. Climate Change 2014: Synthesis Report. Contribution of Working Groups I, II and III to the Fifth Assessment Report of the Intergovernmental Panel on Climate Change; IPCC: Geneva, Switzerland, 2014; pp. 1–151. Available online: https://www.ipcc.ch/report/ar5/syr/ (accessed on 14 September 2020).
- Longobardi, A.; Villani, P. Trend analysis of annual and seasonal rainfall time series in the Mediterranean area. Int. J. Clim. 2010, 30, 1538–1546. [Google Scholar] [CrossRef]
- Caloiero, T.; Coscarelli, R.; Ferrari, E.; Macini, M. Trend detection of annual and seasonal rainfall in Calabria (Southern Italy). Int. J. Climatol. 2011, 31, 44–56. [Google Scholar] [CrossRef]
- Mueller, E.N.; Pfister, A. Increasing occurrence of high- intensity rainstorm events relevant for the generation of soil erosion in a temperate lowland region in Central Europe. J. Hydrol. 2011, 411, 266–278. [Google Scholar] [CrossRef]
- Brunetti, M.; Buffoni, L.; Maugeri, M.; Nanni, T. Precipitation intensity trends in northern Italy. Int. J. Climatol. 2000, 20, 1017–1031. [Google Scholar] [CrossRef]
- Brunetti, M.; Colacino, M.; Maugeri, M.; Nanni, T. Trends in the daily intensity of precipitation in Italy from 1951 to 1996. Int. J. Climatol. 2001, 21, 299–316. [Google Scholar] [CrossRef]
- Brunetti, M.; Maugeri, M.; Nanni, T. Changes in total precipitation, rainy days and extreme events in northeastern Italy. Int. J. Climatol. 2001, 21, 861–871. [Google Scholar] [CrossRef]
- Paliaga, G.; Donadio, C.; Bernardi, M.; Faccini, F. High-Resolution Lightning Detection and Possible Relationship with Rainfall Events over the Central Mediterranean Area. Remote Sens. 2019, 11, 1601. [Google Scholar] [CrossRef]
- Petley, D.N.; Oven, K.; Mitchell, W.A.; Rosser, N.J.; Dunning, S.A.; Allison, R.J. The role of global and regional precipitation patterns in landslide generation. In Proceedings of the International Conference on Slopes Malaysia 2006; Ashaari, M., Ed.; Public Works Department: Kuala Lumpur, Malaysia, 2006; pp. 249–268. [Google Scholar]
- Ciccarelli, N.; von Hardenberg, J.; Provenzale, A.; Ronchi, C.; Vargiu, A.; Pelosini, R. Climate variability in north-western Italy during the second half of the 20th century. Glob. Planet. Chang. 2008, 63, 185–195. [Google Scholar] [CrossRef]
- Giorgi, F.; Lionello, P. Climate change projections for the Mediterranean region. Glob. Planet. Chang. 2008, 63, 90–104. [Google Scholar] [CrossRef]
- Jomelli, V.; Brunstein, D.; Déqué, M.; Vrac, M.; Grancher, D. Impacts of future climatic change (2070–2099) on the potential occurrence of debris flows: A case study in the Massif des Ecrins (French Alps). Clim. Chang. 2009, 97, 171–191. [Google Scholar] [CrossRef]
- Seneviratne, S.I.; Nicholls, N.; Easterling, D.; Goodess, C.M.; Kanae, S.; Kossin, J.; Luo, Y.; Marengo, J.; McInnes, K.; Rahimi, M.; et al. Changes in Climate Extremes and their Impacts on the Natural Physical Environment. In Managing the Risks of Extreme Events and Disasters to Advance Climate Change Adaptation. A Special Report of Working Groups I and II of the Intergovernmental Panel on Climate Change (IPCC); Field, C.B., Barros, V., Stocker, T.F., Dahe, Q., Eds.; Cambridge University Press: Cambridge, UK, 2012; pp. 109–230. ISBN 978-1-13-917724-5. Available online: https://www.ipcc.ch/report/managing-the-risks-of-extreme-events-and-disasters-to-advance-climate-change-adaptation/ (accessed on 14 September 2020).
- Saez, J.L.; Corona, C.; Stoffel, M.; Berger, F. Climate change increases frequency of shallow spring landslides in the French Alps. Geology 2013, 41, 619–622. [Google Scholar] [CrossRef]
- Field, C.B.; Barros, V.R.; Dokken, D.J.; Mach, K.J.; Mastrandrea, M.D.; Bilir, T.E.; Chatterjee, M.; Ebi, K.L.; Estrada, Y.O.; Genova, R.C.; et al. Intergovernmental Panel on Climate Change. Climate Change 2014: Impacts, Adaptation, and Vulnerability. Part A: Global and Sectoral Aspects. Contribution of Working Group II to the Fifth Assessment Report of the Intergovernmental Panel on Climate Change. Available online: https://www.ipcc.ch/site/assets/uploads/2018/02/WGIIAR5-PartA_FINAL.pdf (accessed on 14 September 2020).
- Barros, V.R.; Field, C.B.; Dokken, D.J.; Mastrandrea, M.D.; Mach, K.J.; Bilir, T.E.; Chatterjee, M.; Ebi, K.L.; Estrada, Y.O.; Genova, R.C.; et al. Intergovernmental Panel on Climate Change. Climate Change 2014: Impacts, Adaptation, and Vulnerability. Part B: Regional Aspects. Contribution of Working Group II to the Fifth Assessment Report of the Intergovernmental Panel on Climate Change. Available online: https://www.ipcc.ch/site/assets/uploads/2018/02/WGIIAR5-PartB_FINAL.pdf (accessed on 14 September 2020).
- Stoffel, M.; Tiranti, D.; Huggel, C. Climate change impacts on mass movements—Case studies from the European Alps. Sci. Total Environ. 2014, 493, 1255–1266. [Google Scholar] [CrossRef]
- IPCC. Intergovernmental Panel on Climate Change. Climate Change 2014: Synthesis Report. Contribution of Working Groups I, II and III to the Fifth Assessment Report of the Intergovernmental Panel on Climate Change; Pachauri, R.K., Meyer, L.A., Eds.; IPCC: Geneva, Switzerland, 2015; 151p, ISBN 978-9-29-169143-2. Available online: https://www.ipcc.ch/site/assets/uploads/2018/02/SYR_AR5_FINAL_full.pdf (accessed on 14 September 2020).
- Gariano, S.L.; Guzzetti, F. Landslides in a changing climate. Earth Sci. Rev. 2016, 162, 227–252. [Google Scholar] [CrossRef]
- Turkington, T.; Remaître, A.; Ettema, J.; Hussin, H.; van Westen, C. Assessing debris flow activity in a changing climate. Clim. Chang. 2016, 137, 293–305. [Google Scholar] [CrossRef]
- Glade, T. Landslide occurrence as a response to land use change: A review of evidence from New Zealand. Catena 2003, 51, 297–314. [Google Scholar] [CrossRef]
- Alexander, D. Vulnerability to landslides. In Landslide Hazard and Risk; Glade, T., Anderson, M.G., Crozier, M.J., Eds.; Wiley: Chichester, UK, 2005; 824p. [Google Scholar]
- Petley, D.N.; Hearn, G.J.; Hart, A.; Rosser, N.J.; Dunning, S.A.; Oven, K.; Mitchell, W.A. Trends in landslide occurrence in Nepal. Nat. Hazards 2007, 43, 23–44. [Google Scholar] [CrossRef]
- Acquaotta, F.; Faccini, F.; Fratianni, S.; Paliaga, G.; Sacchini, A.; Vilímek, V. Increased flash flooding in Genoa Metropolitan Area: A combination of climate changes and soil consumption? Meteorol. Atmos. Phys. 2018, 9131, 1099–1110. [Google Scholar] [CrossRef]
- Luino, F.; De Graff, J.; Roccati, A.; Biddoccu, M.; Cirio, C.G.; Faccini, F.; Turconi, L. Eighty Years of Data Collected for the Determination of Rainfall Threshold Triggering Shallow Landslides and Mud-Debris Flows in the Alps. Water 2020, 12, 133. [Google Scholar] [CrossRef]
- Roccati, A.; Faccini, F.; Luino, F.; Ciampalini, A.; Turconi, L. Heavy rainfall triggering shallow landslides: A susceptibility assessment by a GIS-approach in a Ligurian Apennine catchment (Italy). Water 2019, 11, 605. [Google Scholar] [CrossRef]
- Guzzetti, F.; Peruccacci, S.; Rossi, M.; Stark, C.P. Rainfall thresholds for the initiation of landslides in central and southern Europe. Meteorog. Atmos. Phys. 2007, 98, 239–267. [Google Scholar] [CrossRef]
- Guzzetti, F.; Peruccacci, S.; Rossi, M.; Stark, C.P. The rainfall intensity-duration control of shallow landslides and debris flows: An update. Landslides 2008, 5, 3–17. [Google Scholar] [CrossRef]
- Segoni, S.; Piciullo, L.; Gariano, S.L. A review of the recent literature on rainfall thresholds for landslide occurrence. Landslides 2018, 15, 1483–1501. [Google Scholar] [CrossRef]
- Aleotti, P. A warning system for rainfall-induced shallow failures. Eng. Geol. 2004, 73, 247–265. [Google Scholar] [CrossRef]
- Baum, R.L.; Godt, J.W. Early warning of rainfall-induced shallow landslides and debris flows in the USA. Landslides 2010, 7, 259–272. [Google Scholar] [CrossRef]
- Segoni, S.; Rosi, A.; Rossi, G.; Catani, F.; Casagli, N. Analysing the relationship between rainfalls and landslides to define a mosaic of triggering thresholds for regional-scale warning systems. Nat. Hazards Earth Syst. Sci. 2014, 14, 2637–2648. [Google Scholar] [CrossRef]
- Palladino, M.R.; Viero, A.; Turconi, L.; Brunetti, M.T.; Melillo, M.; Luino, F.; Deganutti, A.M.; Guzzetti, F. Rainfall thresholds for the activation of shallow landslides in the Italian Alps: The role of environmental conditioning factors. Geomorphology 2018, 303, 53–67. [Google Scholar] [CrossRef]
- Abraham, M.T.; Pothuraju, D.; Satyam, N. Rainfall Thresholds for Prediction of Landslides in Idukki, India: An Empirical Approach. Water 2019, 11, 2113. [Google Scholar] [CrossRef]
- Jordova, G.; Gariano, S.L.L.; Melillo, M.; Peruccacci, S.; Brunetti, M.T.; Auflic, M.J. Determination of Empirical Rainfall Thresholds for Shallow Landslides in Slovenia Using an Automatic Tool. Water 2020, 12, 1449. [Google Scholar] [CrossRef]
- Caine, N. The Rainfall Intensity: Duration Control of Shallow Landslides and Debris Flows. Geogr. Ann. 1980, 62, 23–27. [Google Scholar] [CrossRef]
- Wieczorek, G.F. Effect of rainfall intensity and duration on debris flow in central Santa Cruz mountains, California. In Debris Flow/Avalanches: Processes, Recognition and Migration; Reviews in Engineering Geology; Geological Society of America: Boulder, CO, USA, 1987; Volume 2. [Google Scholar]
- Crosta, G. Regionalization of rainfall thresholds: An aid to landslide hazard evaluation. Environ. Geol. 1998, 35, 131–145. [Google Scholar] [CrossRef]
- Saito, H.; Nakayama, D.; Matsuyama, H. Relationship between the initiation of a shallow landslide and rainfall intensity—Duration thresholds in Japan. Geomorphology 2010, 118, 167–175. [Google Scholar] [CrossRef]
- Hong, M.; Kim, J.; Jeong, S. Rainfall intensity-duration thresholds for landslide prediction in South Korea by considering the effects of antecedent rainfall. Landslides 2018, 15, 523–534. [Google Scholar] [CrossRef]
- Roccati, A.; Faccini, F.; Luino, F.; Turconi, L.; Guzzetti, F. Rainfall events with shallow landslides in the Entella catchment, Liguria, northern Italy. Nat. Hazards Earth Sys. Sci. 2018, 18, 2367–2386. [Google Scholar] [CrossRef]
- Hess, A.; Iyer, H.; Malm, W. Linear trend analysis: A comparison of methods. Atmos. Environ. 2001, 35, 5211–5222. [Google Scholar] [CrossRef]
- Yue, S.; Pilon, P.; Phinney, B.; Cavadias, G. The influence of autocorrelation on the ability to detect trend in hydrological series. Hydrol. Process. 2002, 16, 1807–1829. [Google Scholar] [CrossRef]
- Helsel, D.R.; Hirsch, R.M. Statistical Methods in Water Resources; Elsevier: Amsterdam, The Netherland, 1992; 395p. [Google Scholar]
- Hamed, K.H.; Rao, A.R. A modified Mann-Kendall trend test for autocorrelated data. J. Hydrol. 1998, 204, 182–196. [Google Scholar] [CrossRef]
- Buffoni, L.; Maugeri, M.; Nanni, T. Precipitation in Italy from 1833 to 1996. Theor. Appl. Climatol. 1999, 63, 33–40. [Google Scholar] [CrossRef]
- Whitfield, P.H.; Cannon, A.J. Recent variations in climate and hydrology in Canada. Can. Water. Resour. J. 2000, 25, 19–65. [Google Scholar] [CrossRef]
- Yue, S.; Hashino, M. Long term trends of annual and monthly precipitation in Japan. J. Am. Water. Resour. Assoc. 2003, 39, 587–596. [Google Scholar] [CrossRef]
- Gemmer, M.; Becker, S.; Jiang, T. Observed monthly precipitation trends in China 1951–2002. Theor. Appl. Climatol. 2004, 77, 39–45. [Google Scholar] [CrossRef]
- Cannarozzo, M.; Noto, L.V.; Viola, F. Spatial distribution of rainfall trends in Sicily (1921–2000). Phys. Chem. Earth 2006, 31, 1201–1211. [Google Scholar] [CrossRef]
- Yavuz, H.; Erdogan, S. Spatial analysis of monthly and annual precipitation trends in Turkey. Water Resour. Manag. 2012, 26, 609–612. [Google Scholar] [CrossRef]
- Mondal, A.; Kundu, S.; Mukhopadhyay, A. Rainfall trend analysis by Mann–Kendall test: A case study of north-eastern part of Cuttack district, Orissa. Int. J. Geol. Earth Environ. Sci. 2012, 2, 70–78. [Google Scholar]
- Burn, D.H.; Hag Elnur, M.A. Detection of hydrologic trends and variability. J. Hydrol. 2002, 255, 107–122. [Google Scholar] [CrossRef]
- Koutsoyiannis, D. Climate change, the Hurst phenomenon, and hydrological statistics. Hydrol. Sci. J. 2009, 48, 3–24. [Google Scholar] [CrossRef]
- Schmidt, J.; Dikau, R. Modeling historical climate variability and slope stability. Geomorphology 2004, 60, 433–447. [Google Scholar] [CrossRef]
- Crozier, M.J. Deciphering the effect of climate change on landslide activity: A review. Geomorphology 2010, 124, 260–267. [Google Scholar] [CrossRef]
- Coe, J.A.; Godt, J.W. Review of approaches for assessing the impact of climate change on landslide hazards. In Landslides and Engineered Slopes, Protecting Society Through Improved Understanding: Proceedings 11th International and 2nd North American Symposium on Landslides and Engineered Slopes, Banff, AB, Canada, 2–8 June 2012; Eberhardt, E., Froese, C., Turner, A.K., Leroueil, S., Eds.; Taylor & Francis Group: London, UK, 2012; pp. 371–377. [Google Scholar]
- Faccini, F.; Gabellieri, N.; Paliaga, G.; Piana, P.; Angelini, S.; Coratza, P. Geoheritage map of the Portofino Natural Park (Italy). J. Maps 2018, 14, 87–96. [Google Scholar] [CrossRef]
- Salvati, P.; Bianchi, C.; Rossi, M.; Guzzetti, F. Societal landslide and flood risk in Italy. Nat. Hazards Earth Syst. Sci. 2010, 10, 465–483. [Google Scholar] [CrossRef]
- Faccini, F.; Robbiano, A.; Sacchini, A. Geomorphic hazard and intense rainfall: The case study of the Recco Stream Catchment (Eastern Liguria, Italy). Nat. Hazards Earth Syst. Sci. 2012, 12, 893–903. [Google Scholar] [CrossRef]
- Faccini, F.; Luino, F.; Sacchini, A.; Turconi, L. The 4th October 2010 flash flood event in Genoa Sestri Ponente (Liguria, Italy). Disaster Adv. 2015, 8, 1–14. [Google Scholar]
- Regione Liguria. Carta Geologica Regionale (CGR), Scala 1:25,000, Tav. 231.1, 231.4—Chiavari Recco. 2005. Available online: https://geoportal.regione.liguria.it/catalogo/mappe.html (accessed on 15 September 2020).
- Faccini, F.; Piccazzo, M.; Robbiano, A.; Roccati, A. Applied geomorphological map of the Portofino municipal territory. J. Maps 2012, 4, 451–462. [Google Scholar] [CrossRef]
- Giammarino, S.; Messiga, B. Clasti di meta-ofioliti a paragenesi di alta pressione nel Conglomerato di Portofino: Implicazioni paleogegrafiche e strutturali. Ofioliti 1979, 4, 25–41. (In Italian) [Google Scholar]
- Corsi, B.; Elter, F.M.; Giammarino, S. Structural fabric of the Antola Unit (Riviera di Levante, Italy) and implications for its alpine versus apennine origin. Ofioliti 2003, 26, 1–8. [Google Scholar]
- Brandolini, P.; Faccini, F.; Pelfini, M.; Firpo, M. A complex landslide along the Eastern Liguria rocky coast (Italy). Rend. Online Soc. Geol. Ital. 2013, 28, 28–31. [Google Scholar]
- Brandolini, P.; Faccini, F.; Robbiano, A.; Terranova, R. Geomorphological hazards and monitoring activity along the western rocky coast of the Portofino Promontory (Italy). Quat. Int. 2007, 171, 131–142. [Google Scholar] [CrossRef]
- Brandolini, P.; Faccini, F.; Piccazzo, M. Geomorphological hazards and tourist vulnerability along Portofino Park trails (Italy). Nat. Hazard Earth Syst. Sci. 2006, 6, 1–8. [Google Scholar] [CrossRef]
- Turconi, L.; Faccini, F.; Marchese, A.; Paliaga, G.; Casazza, M.; Vojinovic, Z.; Luino, F. Implementation of nature-based solutions for hydro-meteorological risk reduction in small Mediterranean catchments: The case of Portofino Natural Regional Park. Sustainability 2019, 12, 1240. [Google Scholar] [CrossRef]
- Paliaga, G.; Luino, F.; Turconi, L.; De Graff, J.V.; Faccini, F. Terraced Landscapes on Portofino Promontory (Italy): Identification, Geo-Hydrological Hazard and Management. Water 2020, 12, 435. [Google Scholar] [CrossRef]
- Köppen, W. Das Geographische System der Klimate. In Handbuch der Klimatologie; Köppen, W., Geiger, R., Eds.; Gebrüder Borntraeger: Berlin, Germany, 1936; Volume 1, pp. 1–44. (In German) [Google Scholar]
- Thornthwaite, C.W.; Mather, J.R. Instruction and Tables for Computing Potential Evapotranspiration and the Water Balance; Laboratory of Climatology: Centerton, NJ, USA, 1957; pp. 183–311. [Google Scholar]
- Gestro, C. Education to protection of biodiversity in Liguria. Ital. Bot. 2004, 36, 537–539. [Google Scholar]
- Balletti, F.; Soppa, S. The landscapes of the Portofino natural regional Park. In Nature Policies and Landscape Policies; Springer: Cham, Switzerland, 2015; pp. 415–422. [Google Scholar]
- Terranova, R. Squilibri geomorfologici e rischi sulla costa alta rocciosa occidentale del Promontorio di Portofino (Liguria Orientale). In Studi Geografici e Geologici in Onore di S. Belloni; Università degli Studi di Milano e Milano Bicocca: Bicocca, Italy, 1999; pp. 595–607. (In Italian) [Google Scholar]
- Terranova, R. Le frane del Castellaro e di S. Rocco sul versante occidentale del Promontorio di Portofino. In Atti Istituto di Geologia Università di Genova 1964; Istituto di geologia dell’Università di Genova: Genova, Italy, 1964; pp. 342–376. (In Italian) [Google Scholar]
- Guzzetti, F.; Cardinali, M.; Reichenbach, P. The AVI Project: A bibliographical and archive inventory of landslides and floods in Italy. Environ. Manag. 1994, 18, 623–633. [Google Scholar] [CrossRef]
- Hungr, O.; Evans, S.G.; Bovis, M.J.; Hutchinson, J.N. A review of the classification of landslides of the flow type. Environ. Eng. Geosci. 2001, 7, 221–238. [Google Scholar] [CrossRef]
- Hungr, O.; Leroueil, S.; Picarelli, L. The Varnes classification of landslide types, an update. Landslides 2014, 11, 167–194. [Google Scholar] [CrossRef]
- Regione Liguria. Inventario dei Fenomeni Franosi sc. 1:10000—Progetto IFFI. 2014. Available online: https://geoportal.regione.liguria.it/catalogo/mappe.html (accessed on 15 September 2020).
- Regional Agency for Environment Protection of Liguria—ARPAL, 2003–2020. Consultazione Dati Climatici. Available online: http://www.cartografiarl.regione.liguria.it/SiraQualMeteo/script/PubAccessoDatiMeteo.asp (accessed on 15 September 2020).
- National Hydrographic and Oceanographic Service—SIMN, 1917–2003. Annali Idrologici. Compartimento di Genova. Available online: http://www.acq.isprambiente.it/annalipdf/ (accessed on 15 September 2020).
- Brunetti, M.T.; Peruccaci, S.; Rossi, M.; Luciani, S.; Valigi, D.; Guzzetti, F. Rainfall thresholds for the possible occurrence of landslides in Italy. Nat. Hazards Earth Syst. Sci. 2010, 10, 447–458. [Google Scholar] [CrossRef]
- Tiranti, D.; Rabuffetti, D. Estimation of rainfall thresholds triggering shallow implementation. Landslides 2010, 7, 471–481. [Google Scholar] [CrossRef]
- Peruccacci, S.; Brunetti, M.T.; Luciani, S.; Vennari, C.; Guzzetti, F. Lithological and seasonal control on rainfall thresholds for the possible initiation of landslides in central Italy. Geomorphology 2012, 139, 79–90. [Google Scholar] [CrossRef]
- Silverman, B.W. Density Estimation for Statistics and Data Analysis; Chapman and Hall: London, UK, 1986; 176p. [Google Scholar]
- Scott, D.W. Multivariate Density Estimation: Theory, Practice and Visualization; Wiley: New York, NY, USA, 1992; 336p. [Google Scholar]
- Venables, W.N.; Ripley, B.D. Modern Applied Statistics with S.; Springer: New York, NY, USA, 2002; 495p. [Google Scholar]
- Mann, H.B. Nonparametric tests against trend. Econometrica 1945, 13, 245–259. [Google Scholar] [CrossRef]
- Kendall, M.G. Rank Correlation Methods; Griffin: London, UK, 1975; 196p. [Google Scholar]
- Wang, Y.; Xu, Y.; Tabari, H.; Wang, J.; Wang, Q.; Song, S.; Hu, Z. Innovative trend analysis of annual and seasonal rainfall in the Yangtze River Delta, eastern China. Atmos. Res. 2020, 231, 104673. [Google Scholar] [CrossRef]
- Theil, H. A rank-invariant method of linear and polynomial regression analysis. Proc. Roy. Neth. Acad. Sci. 1950, 53, 386–392. [Google Scholar]
- Sen, P.K. Estimates of the regression coefficient based on Kendall’s tau. J. Am. Stat. Assoc. 1968, 63, 1379–1389. [Google Scholar] [CrossRef]
- Fernandes, R.; Leblanc, S.G. Parametric (modified least squares) and non-parametric (Theil–Sen) linear regressions for predicting biophysical parameters in the presence of measurement errors. Remote Sens. Environ. 2005, 95, 303–316. [Google Scholar] [CrossRef]
- Hurst, H.E. Long-term storage of reservoirs: An experimental study. Trans. Am. Soc. Civ. Eng. 1951, 116, 770–799. [Google Scholar]
- Sakalauskiené, G. The Hurst phenomenon in hydrology. Environ. Res. Eng. Manag. 2003, 3, 16–20. [Google Scholar]
- Anis, A.A.; Lloyd, E.H. The expected value of the adjusted rescaled Hurst range of independent normal summands. Biometrika 1976, 63, 111–116. [Google Scholar] [CrossRef]
- Xu, Z.; Tang, Y.; Connor, T.; Li, D.; Li, Y.; Liu, J. Climate variability and trends at a national scale. Sci. Rep. 2017, 7, 3258. [Google Scholar] [CrossRef]
- López-Lambraño, A.A.; Fuentes, C.; López-Ramos, A.A.; Mata-Ramírez, J.; López-Lambraño, M. Spatial and temporal Hurst exponent variability of rainfall series based on the climatological distribution in a semiarid region in Mexico. Atmosphere 2018, 31, 199–219. [Google Scholar] [CrossRef]
- Chandrasekaran, S.; Poomalai, S.; Saminathan, B.; Suthanthiravel, S.; Sundaram, K.; Abdul Hakkim, F.F. An investigation on the relationship between the Hurst exponent and the predictability of a rainfall time series. Meteorol. Appl. 2019, 26, 511–519. [Google Scholar] [CrossRef]
- Faccini, F.; Benedettini, A.; Pelfini, M.; Brandolini, P. La frana costiera delle Gave nel Promontorio di Portofino (Liguria, Italia): Evoluzione recente e interazione con le opere antropiche. StudiCostieri 2014, 22, 45–56. (In Italian) [Google Scholar]
- Faccini, F.; Piccazzo, M.; Robbiano, A. Natural hazards in San Fruttuoso of Camogli (Portofino Park, Italy): A case study of a debris flow in a coastal environment. Boll. Soc. Geol. Ital. 2009, 128, 641–654. [Google Scholar]
- Parodi, A.; Boni, G.; Ferraris, L.; Siccardi, F.; Pagliara, P.; Trovatore, E.; Foufoula-Georgiou, E.; Kranzmüller, D. The “perfect storm”: From across the Atlantic to the hills of Genoa. EOS T. Am. Geophys. Union 2012, 93, 225. [Google Scholar] [CrossRef]
- Ceriani, M.; Lauzi, S.; Padovan, N. Rainfall thresholds triggering debris flows in the alpine area of Lombardia Region, central Alps. In Proceedings of the Man and Mountain ’94 Proceedings Ponte di Legno, Ponte di Legno, Italy, 20–24 June 1994; pp. 123–139. [Google Scholar]
- Crosta, G.B.; Frattini, P. Rainfall thresholds for triggering soil slips and debris flow. In Proceedings of the 2nd EGS Plinius Conference on Mediterranean Storms, Siena, Italy, 1–3 October 2001; pp. 463–487. [Google Scholar]
- Jakob, M.; Weatherly, H. A hydroclimatic threshold for landslide initiation on the North Shore Mountains of Vancouver, British Columbia. Geomorphology 2003, 54, 137–156. [Google Scholar] [CrossRef]
- Marchi, L.; Arattano, M.; Deganutti, A.M. Ten years of debris flow monitoring in the Moscardo Torrent (Italian Alps). Geomorphology 2002, 46, 1–17. [Google Scholar] [CrossRef]
- Floris, M.; Mari, M.; Romeo, R.W.; Gori, U. Modelling of landslides-triggering factors—A case study in the Northern Apennines, Italy. In Engineering Geology for Infrastructure Planning in Europe. Lecture Notes in Earth Sciences; Hack, R., Azzam, R., Chalier, R., Eds.; Springer: Berlin/Heidelberg, Germany, 2004; Volume 104, pp. 745–753. [Google Scholar] [CrossRef]
- Giannecchini, R. Relationship between rainfall and shallow landslides in southern Apuane Alps (Italy). Nat. Hazards Earth Syst. Sci. 2006, 6, 357–364. [Google Scholar] [CrossRef]
- Cevasco, A.; Pepe, G.; Brandolini, P. The influences of geological and land use settings on shallow landslides triggered by an intense rainfall event in a coastal terraced environment. Bull. Eng. Geol. Environ. 2014, 73, 859–875. [Google Scholar] [CrossRef]
- Peruccacci, S.; Brunetti, M.T.; Gariano, S.L.; Melillo, M.; Rossi, M.; Guzzetti, F. Rainfall thresholds for possible landslide occurrence in Italy. Geomorphology 2017, 290, 39–57. [Google Scholar] [CrossRef]
- Anagnostopoulou, C.; Tolika, K.; Flocas, H.; Maheras, P. Cyclones in the Mediterranean region: Present and future climate scenarios derived from a general circulation model (HadAM3P). Adv. Geosci. 2006, 7, 9–14. [Google Scholar] [CrossRef]
- Rossi, M.; Luciani, S.; Valigi, D.; Kirschbaum, D.; Brunetti, M.T.; Peruccacci, S.; Guzzetti, F. Statistical approaches for the definition of landslide rainfall thresholds and their uncertainty using rain gauge and satellite data. Geomorphology 2017, 285, 16–27. [Google Scholar] [CrossRef]
- Goubanova, K.; Li, L. Extremes in temperature and precipitation around the Mediterranean basin in an ensemble of future climate scenario simulations. Glob. Planet. Chang. 2007, 57, 27–42. [Google Scholar] [CrossRef]
- Drobinski, P.; Da Silva, N.; Panthou, G.; Bastin, S.; Muller, C.; Ahrens, B.; Borga, M.; Conte, D.; Fosser, G.; Giorgi, F.; et al. Scaling precipitation extremes with temperature in the Mediterranean: Past climate assessment and projection in anthropogenic scenarios. Clim. Dyn. 2018, 51, 1237–1257. [Google Scholar] [CrossRef]
- RECONECT Project—Regenerating ECOsystems with Nature-Based Solutions for Hydrometeorological Risk rEduCTion. Available online: www.reconect.eu (accessed on 28 October 2020).
- Tramblay, Y.; Samuel, S. Future evolution of extreme precipitation in the Mediterranean. Clim. Chang. 2018, 151, 289–302. [Google Scholar] [CrossRef]
Publisher’s Note: MDPI stays neutral with regard to jurisdictional claims in published maps and institutional affiliations. |
© 2020 by the authors. Licensee MDPI, Basel, Switzerland. This article is an open access article distributed under the terms and conditions of the Creative Commons Attribution (CC BY) license (http://creativecommons.org/licenses/by/4.0/).