Article

Pollution Caused by Potentially Toxic Elements Present in Road Dust from Industrial Areas in Korea

1
Marine Environmental Research Center, Korea Institute of Ocean Science and Technology (KIOST), Busan 49111, Korea
2
Department of Ocean Science (Oceanography), KIOST School, University of Science and Technology (UST), Daejeon 34113, Korea
3
Geological Research Division, Korea Institute of Geosciences and Mineral Resources (KIGAM), Daejeon 34132, Korea
*
Author to whom correspondence should be addressed.
Atmosphere 2020, 11(12), 1366; https://doi.org/10.3390/atmos11121366
Submission received: 2 November 2020 / Revised: 14 December 2020 / Accepted: 14 December 2020 / Published: 17 December 2020

Abstract

:
We examined the pollution characteristics of potentially toxic elements (PTEs) in road dust (RD) from nine industrial areas in South Korea to assess PTE pollution levels and their environmental risks for devising better strategies for managing RD. The median concentrations (mg/kg) were in the order Zn (1407) > Cr (380) > Cu (276) > Pb (260) > Ni (112) > As (15) > Cd (2) > Hg (0.1). The concentration of PTEs was the highest at the Onsan Industrial Complex, where many smelting facilities are located. Our results show that Onsan, Noksan, Changwon, Ulsan, Pohang, and Shihwa industrial areas are heavily polluted with Cu, Zn, Cd, and Pb. The presence of these toxic elements in RD from the impervious layer in industrial areas may have a moderate to severe effect on the health of the biota present in these areas. The potential ecological risk index ( E r i ) for PTEs was in the decreasing order of Cd > Pb > Hg > Cu > As > Zn > Ni > Cr, indicating that the dominant PTE causing ecological hazards is Cd owing to its high toxicity. Our research suggests the necessity for the urgent introduction of an efficient management strategy to reduce RD, which adds to coastal pollution and affects human health.

1. Introduction

In view of rapid and intense industrialization, several studies have been conducted on soils [1,2], stream sediments [3,4], river sediments [5] and road dust (RD) or road-deposited sediments [6,7] around industrial areas that are significantly contaminated with potentially toxic elements (PTEs). The levels of PTEs in soils and RD are comparatively higher in industrial areas than in urban areas [8,9]. Trace metals present in soils are difficult to migrate owing to their long residual time and strong concealment [4]. Pollution caused by PTEs present in RD has become an interesting topic of research because RD is an important carrier of PTEs and can contribute as a non-point source to runoff pollution in urban areas [6,10].
Industrial activities, such as metal processing and smelting, and industrial emissions are major sources of PTE pollution in industrial areas [11,12]. Hg pollution in agricultural soils is attributed to the atmospheric deposition of Hg through industrial emission [13]. Ma et al. [14] reported that nonferrous metal industries released approximately 88 tons of Cd into the environment. Particles emitted into the atmosphere from industrial sources and waste incineration can be deposited directly on the top surface of roads and soil, as well as on the leaves of crop plants [15,16]. Therefore, in the past decade, there has been an interest in the quality of ambient air subjected to dry deposition [17,18,19] and in the pollution status of soil and other nature in industrial areas [20,21]. The main sources of ambient pollution in industrial areas are not only coal-based power generation and industrial activities but also traffic activity and resuspension on the road [22]. However, unlike in metropolitan and urban areas, pollution caused by RD in industrial areas has not been studied, and there are no strategies in place to manage it.
A large proportion of industrial areas are covered with impervious areas, such as roads, and are being zoned for industrial use. RD from impervious areas contains large amounts of PTEs. During rainfall, RD can be transported through stormwater runoff to the surrounding aquatic environments without any treatment; thus, streams, rivers, and marine sediments can be contaminated with toxic elements [7,23,24,25]. We reported the contamination of coastal sediments near industrial complexes with PTEs compared with urban areas in Korea [26].
RD can easily be resuspended in the atmosphere by wind and vehicular movement and can spread PTEs over large areas [27,28]. Bi et al. [29] reported that industrial and combustion emissions were the major sources of Pb in dust and vegetables. PTEs present in RD continues to contaminate crops, water, sediments, and the atmosphere, posing a threat to human health. Therefore, RD pollution in industrial complexes should be considered an important factor in the maintenance of the surrounding areas; human health, pollution level, environmental risk, and mobility of RD should be investigated to establish an effective management strategy.
The objectives of this study were (1) to investigate the extent of pollution caused by PTEs present in RD collected from nine industrial areas in Korea; (2) to quantify the potential ecological risk of PTEs present in RD; and (3) to discuss environmental concerns that may be posed by runoff and resuspension of RD. The results presented here provide valuable information for managing RD in industrial areas.

2. Materials and Methods

2.1. Sampling Area

After the 1960s, Korea implemented an export-driven industrialization policy to promote industrialization. In the 1970s, the development strategy focused on the heavy and chemical industries such as steel, nonferrous metal, refinery, machinery, shipbuilding, electronic and chemicals and large-scale industrial area were created in cities of coastal areas in Korea [30]. There are 27 national industrial complexes and 133 local industrial complexes located along the coast of Korea, but the total area is 3.7 times higher than that of national industrial complexes. Most of the industrial complexes in Korea were developed during the 1960s–1970s when there was little environmental interest; therefore, environmental problems continuously arise from the planning stage [31]. Coastal sediments and airborne particles in industrial areas are reported to be contaminated with metals and metalloids [32,33], but there are little data on PTEs in RD. Therefore, this study was conducted in 9 industrial complexes (Shihwa; SH, Gunsan; GS, Daebul; DB, Gwangyang; GW, Changwon; CW, Noksan; NS, Onsan; OS, Ulsan; US, Pohang; PH) selected in consideration of representative industries of Korea’s major industries.
The average temperature in December 2013 in Korea was 1.5 °C, like the average level (1.5 °C), and the average precipitation was 84% higher than that of the 10-year average level. Sampling was conducted from 1st to 6th December 2013. During the sampling duration, the average temperature and relative humidities were 0–5.4 °C and 47–80 (%), respectively, in the regions of sampling. The climate of the regions in the north was low and humid, and those in the south were high and dry. Detailed climate information of the sampling regions is shown in the Supplementary Table S1.

2.2. Road Dust Sampling

RD samples were collected from 165 sampling sites in eight national industrial complexes and one steel industrial complex of South Korea (Figure 1 and Table 1) following antecedent dry-weather periods of approximately 10 days. RD samples were collected using a cordless vacuum cleaner (DC-35, Dyson Co., Malmesbury, UK) from a 0.5 m × 0.5 m area along the curb. The dry vacuum cleaning method is a method adopted in several RD studies and is designed to collect even fine particles on the road surface [34]. Because of road design, it is reported that 95% of the RD on the total road areas is accumulated in the curb and 1 m inside the road by Novotny and Chesters [35]. In one industrial region, 14–25 sampling points were selected at equal intervals within the complex to evenly reflect road pollution in every sampling region. Four or more subsamples were taken per site and then composited to ensure representativeness for each sampling site. The vacuum cleaner was replaced or cleaned to prevent cross-contamination between a sampling of a single point. The collected RD was dried in an oven at 40 °C, weighed, sealed and stored in a zipper bag until analysis.

2.3. Particle Size and Magnetic Susceptibility Analysis

Before analysis, large contaminants such as leaves, petals, metal lumps, and garbage were removed by hand, and particles larger than 1000 μm were removed using a standard test sieve (1000 μm) from every raw RD sample. The particle size of RDS samples was measured using a laser particle size analyzer (Mastersizer 2000, Malvern Instruments, Malvern, UK) after removing organic matter with 30% hydrogen peroxide and carbonate with 1 N HCl, respectively. The determination of magnetic susceptibility was conducted with a magnetic susceptibility meter (MS2, Bartington Instruments Ltd., Oxford, UK) and was performed three times.

2.4. Potentially Toxic Metal Analysis

For the determination of PTEs (Cr, Ni, Cu, Zn, As, Cd, Pb, and Hg), RD samples were pulverized and homogenized using a mechanical mortar (Pulverisette 6, Fritsch Co., Markt Einersheim, Germany). Total digestion of samples with mixed acids was performed. Briefly, 0.1 g of ground samples were placed in Teflon digestion vessels and digested with nitric acid, hydrofluoric acid and perchloric acid (Ultra-100 grade, Kanto Chemical, Tokyo, Japan) on a hot plate at 180 °C for 24 h. After dryness, the digested samples were dissolved with 1% nitric acid (v/v) to a final volume of 10 mL. Al, Li, Cr, Co, Ni, Cu, Zn, As, Cd and Pb concentrations were measured by inductively coupled plasma mass spectrometry (ICP-MS; iCAP-Q, Thermo Scientific Co., Bremen, Germany). Hg was analyzed using an automated direct Hg analyzer (Hydra-C, Leeman Labs, Hudson, NH, USA) according to the USEPA 7473 method.
The blanks and triplicate determinations were performed. Data accuracies were checked using two types of certified reference materials, MESS-4 and PACS-3 (National Research Council, Ottawa, ON, Canada). Metals and metalloid recoveries ranged from 94.7% to 104.3%.

2.5. Pollution and Ecological Risk Assessment

The geo-accumulation index (Igeo), potential ecological risk factor ( E r i ) and potential ecological risk index (PER) for eight PTEs (Cr, Ni, Cu, Zn, As, Cd, Pb, and Hg) were used to assess the PTEs pollution in RD of this study.
The geo-accumulation index (Igeo) was calculated using the following equation proposed by Müller [36]:
I geo = log 2 ( C n / ( 1.5 × B n ) )
where Cn represents the metals and metalloids concentrations in RD of this study. Bn represents the natural background values of the soils in Korea, and its values (mg/kg) of Cr, Ni, Cu, Zn, As, Cd, and Pb are 25.4, 17.6, 15.3, 54.3, 6.8, 0.05, and 18.4, respectively [37]. The background value of Hg was not presented in Korea, so the value of the upper continental crust was used [38]. Müller [36] defined seven classes of Igeo index ranging from Class 0 (Igeo < 0, unpolluted) to Class 6 (Igeo > 5, extremely polluted).
The potential ecological risk factor ( E r i ) was also calculated using the following equation by Håkanson [39].
E r i = T r i × ( C n / B n )
where, T r i is the metals and metalloid toxicity response factors (Hg = 40, Cd = 30, As = 10, Cu = Ni = Pb = 5, Cr = 2, Zn = 1). Cn and Bn represent the same in Igeo calculation. The E r i values were classified into five classes: low risk ( E r i < 40), moderate risk (40 < E r i < 80), considerable risk (80 <   E r i < 160), high risk (160 < E r i < 320), serious risk ( E r i > 320).
The comprehensive ecological risk (PER) is the sum of E r i of eight PTEs in RD. PER value illustrates the potential ecological risks caused by the overall contamination for eight PTEs. The PER values were classified into four classes of potential ecological risk: low-grade (PER < 150), moderate (150 < PER < 300), severe (300 < PER < 600) and serious (PER > 600) [39].

3. Results and Discussion

3.1. Characteristics of PTEs Concentrations

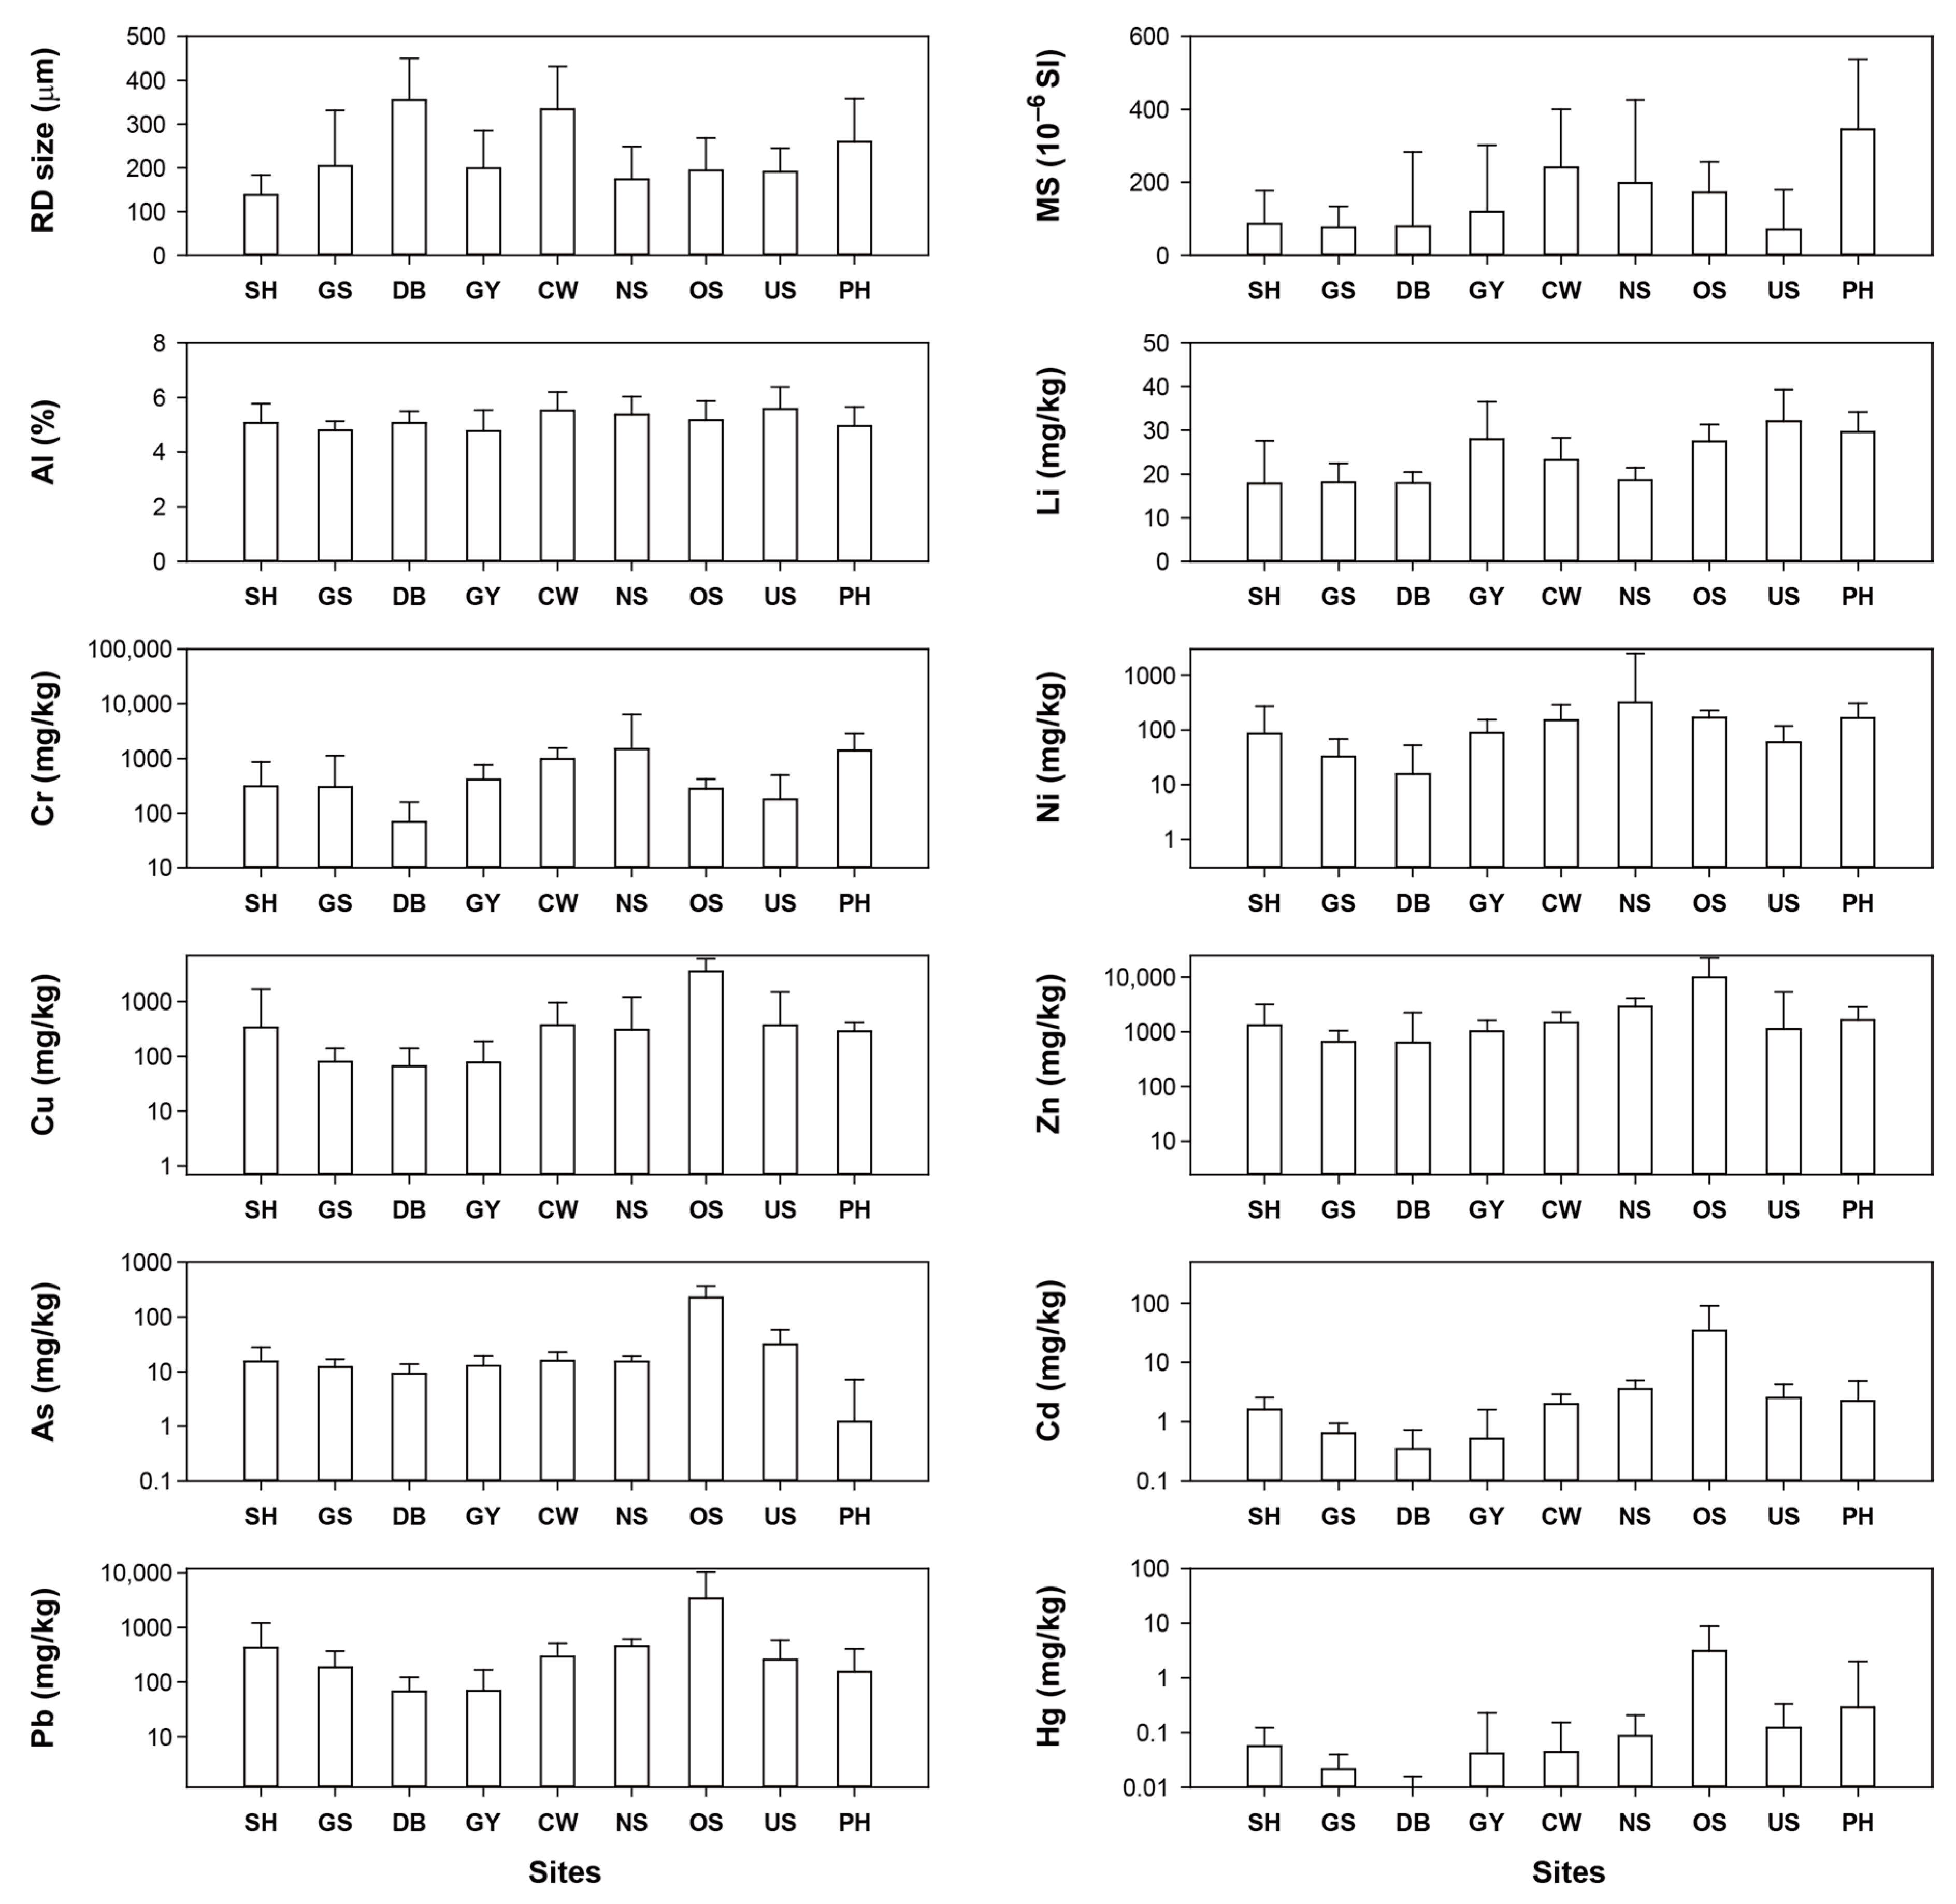
A comparison of particle size, magnetic susceptibility, and concentration of PTEs in RD from the sampling sites is presented in Figure 2 and Table S2. The median RD surface load and the median size of particles were 1652 g/m2 and 355 μm, respectively, with the highest concentrations observed at the Daebul Industrial Complex. The median magnetic susceptibility of RD ranged from 76 × 10−6 to 346 × 10−6 SI units, with the highest value observed at the Pohang Steel Industrial Complex (PH) and the lowest value observed at the Gunsan Industrial Complex (GS) (Figure 2). Al and Li were present at high concentrations at the Ulsan Industrial Complex (US); however, differences in median concentrations of these elements between industrial areas were very small compared with those of the other toxic elements.
The median concentrations of PTEs were in the following order: Zn (1407 mg/kg) > Cr (380 mg/kg) > Cu (276 mg/kg) > Pb (260 mg/kg) > Ni (112 mg/kg) > As (15 mg/kg) > Cd (2 mg/kg) > Hg (0.1 mg/kg). The median concentrations of Cr and Ni in RD samples were 1486 and 315 mg/kg, respectively, with the highest values observed at the Noksan Industrial Complex. Relatively higher values for Cr and Ni were also observed at the Pohang Steel Industrial Complex than in other areas because of the presence of many industrial facilities, such as steel-related metal manufacturing, precision machinery manufacturing using stainless steel, and automobile manufacturing. Cr and Ni are major conventional pollutants emitted from blast furnaces during the manufacture of iron and steel [40].
The coefficient of variation (CV) describes the degree of variation in the concentrations of PTEs present in RD samples investigated in this study. CVs over 100% are considered exceptionally highly variable among the sampling sites. The mean CVs for the concentrations of PTEs in RD samples decreased in the following order: Hg (360%) > Ni (342%) > Cd (334%) > Pb (302%) > Cr (215%) > As (210%) > Cu (196%) > Zn (189%). The large CV values indicate that the pollution sources of these metals greatly differed among the sampling sites. There is no specific major source of pollution in a particular industrial complex. Although the dominant industrial type differs among the nine industrial regions, there are many different types of factories around the sampling sites from where RD samples were collected. Considering the spatial distribution and large variability in the concentration of PTEs, the contamination of RD samples with PTEs seems to reflect the various types of industries rather than the difference in the degree of pollution according to the distance from individual metal pollution sources.
The median concentrations of Cu, Zn, As, Cd, Pb, and Hg were the highest in the Onsan Industrial Complex, where the largest nonferrous metal processing facilities in Korea are located. Significant differences (p < 0.05) in the concentrations of these PTEs between Onsan Industrial Complex and those of other industrial areas were observed (Table S2). The pollution of RD with PTE caused by the smelting activity was found to be severe. The lowest concentrations of Cr, Ni, Cu, Cd, Pb, and Hg were observed at the Daebul Industrial Complex, and those of Zn and As were observed at the Gunsan and Pohang Industrial complexes, respectively. Based on the sum of the concentrations of the eight PTEs, the descending order of predominance in RD from different areas was as follows: OS > NS > PH > SH > CW > US > GY > GS > DB. According to a previous study, PTEs concentrations in RD samples from industrial areas were 3.5–24.3 times higher than those of urban areas in Korea [41].
PTEs are bound to RD, which is a mixture of various particles, are derived from diverse sources, such as traffic activities (e.g., wear of brake pads, tires, and vehicles; engine exhaust; wear of roads) and industrial activities (e.g., transportation and processing of industrial raw materials) [7,42,43,44,45].
A principal component analysis (PCA) was performed to identify the differences in the parameters measured in this study (Table 2). Three significant principal components (PC1–PC3) were determined. PC1 was dominant for Cu, Zn, As, Cd, Pb, and Hg, explaining 35.5% of the total variance. There was a strong positive correlation between these elements (Table S3). These PTEs did not show significant relationships with the other measured parameters. The major source of Cu and Zn in urban RD is the brake pads and tires wearing [44]. The Zn/Cu ratio in RD from urban areas is widely used as a potential tool to assess the contribution of traffic activities related to the abrasion of brake pads and tires [25,46]. The Zn/Cu ratio in RD samples from urban areas was reported to be 2.6–5.1 in the USA and 4.5 in Korea. In this study, the average Zn/Cu ratio was found to be 7.8 and ranged from 0.4 to 62.0. The mean CV of the Zn/Cu ratio was 93%, indicating a high variability, depending on the sampling site. In industrial regions, the traffic of large vehicles is higher than that in urban regions. Therefore, traffic activity would have caused RD pollution with PTEs in industrial regions. Considering the higher concentration of PTEs, the Zn/Cu ratio, and the large difference in concentrations between industrial regions, the effect of industrial activities, such as the transport of raw materials and industrial emissions, on ambient pollution would be greater than that of traffic activity. Hwang et al. [46] reported that the proportion of Zn in RD samples from urban areas is also affected by climatic factors. Our results show a relatively higher Zn/Cu ratio and Zn concentration from industrial areas than those in RD samples from urban areas.
High-strength galvanized steel sheet is widely used in the form of Zn alloy and for Zn plating of metals containing iron because of its excellent resistance to corrosion [47,48]. It is also used worldwide in the construction industry owing to its low cost and easy maintenance [49,50]. Indeed, most factories in industrial areas are assembled using galvanized steel panels. In addition, all industrial complexes included in this study were located along the coast. The average humidity in the study areas was 61%, ranging from 47% to 80%. Corrosion of galvanized steel sheets is accelerated by the influence of sea salt and high humidity. A large amount of Zn accumulates on the road surface. Therefore, in this study, Cu, Zn, As, Cd, Pb, and Hg contamination in RD samples may have been affected by a combination of traffic and industrial activities.
PC2 was dominated by magnetic susceptibility, Cr, and Ni, explaining 18.5% of the total variance (Table 2). According to Pearson’s correlation, magnetic susceptibility shows a strong positive relationship with the concentration of Cr and Ni (Table S3). In several studies, a good relationship of magnetic susceptibility with Cr, Ni, Pb, Cu, and Zn present in soils from industrial areas has been reported [51,52,53]. The presence of hematite and magnetite as primary and secondary minerals in soil and solid waste, and the content of Fe, Mn, Cr, Co, and Ni affect the magnetic susceptibility of soil [54]. The pollution levels of Cr and Ni in this study were lower than those of Cu, Zn, Cd, Pb, and Hg comprising the PC1 component. PC3 was dominated by Al and Li, explaining 10.9% of the total variance. Al and Li were not correlated with the other measured parameters (Table S3), indicating that these elements were mainly derived from natural sources.

3.2. PTEs Pollution and Ecological Risk Assessments

The New York State Department of Environmental Conservation (NYSDEC) [55] has proposed three types of freshwater sediment guidance values. Class A considered low risk to aquatic life. Class B is slight to moderately contaminated, and Class C is considered to be highly contaminated. If the PTE concentration lies between that in Class A and Class C, the sediments pose potential risks to aquatic life. If the PTE concentration exceeds the Class C threshold value, the sediment could potentially present a high risk to the aquatic life. Among the 165 RD samples, the concentrations of Cr, Ni, Cu, Zn, and Pb exceeded the Class C threshold values in 88%, 76%, 68%, 90%, and 75% of the samples, respectively (Table 3). The concentrations of As, Cd, and Hg exceeded the Class C threshold values in 10–18% of the RD samples, most of which were samples at the Onsan Industrial Complex. In the RD samples from Onsan Industrial Complex, the concentrations of Cr, Ni, Cu, Zn, As, Cd, Pb, and Hg significantly exceeded the Class C threshold values, implying that the PTEs present in RD samples would pose a very high risk to the aquatic life. In Shihwa, Changwon, Noksan, and Pohang Industrial complexes, the concentrations of only five PTEs, namely Cr, Ni, Cu, Zn, and Pb, exceeded the Class C threshold values.
The geoaccumulation index (Igeo) was applied to compare RD pollution with PTEs in different industrial areas (Table 4). Cd has the highest median Igeo value among toxic metals. The median Igeo values were in the following order: Cd (4.5) > Zn (4.1) > Cu (3.6) > Pb (3.2) > Cr (3.3) > Ni (2.1) > As (0.6) > Hg (–0.02). The Shihwa Industrial Complex is heavily contaminated with Cr, Cu, and Pb and is heavily to extremely contaminated with Cd and Zn. The median Igeo values revealed that RD from the Daebul Industrial Complex is not heavily contaminated with Cr, Ni, Cu, As, Cd, Pb, and Hg. The Gwangyang Industrial Complex is heavily contaminated with Cr and Zn. The Changwon Industrial Complex is heavily to extremely contaminated with Cr, Cu, Zn, and Cd. The Noksan Industrial Complex is heavily to extremely contaminated with Ni, Cu, and Pb, whereas it is extremely contaminated with Cr, Zn, and Cd. Our results show that RD at the Onsan Industrial Complex is extremely contaminated with Cu, Zn, Cd, Pb, and Hg, heavily to extremely contaminated with As, and moderately contaminated with Cr and Ni. The Ulsan Industrial Complex is extremely contaminated with Cd. The Pohang Industrial Complex is extremely contaminated with Cr and heavily to extremely contaminated with Zn and Cd.
Pollution assessments using Igeo values and comparisons with sediment guidance values have the advantage of classifying the pollution status for each metal; however, these assessment tools are limited as they cannot comprehensively assess metallic pollution in environmental samples. Therefore, the ecological risk assessment was used to evaluate the potential ecological risk of each metal and the comprehensive toxicity of metals in this study.
The ecological risk factor, E r i , and potential ecological risk (PER) for RD from the nine industrial areas of Korea are presented in Figure 3. The decreasing order of potential E r i for PTEs was as follows: Cd (2573) > Hg (584) > Pb (305) > Cu (139) > As (85) > Zn (45) > Ni (24) > Cr (19). Cd poses a serious potential ecological risk to the environment. A value of 88% of Cr and 92% of Ni in RD samples was categorized as below low ecological risk. Values of 57% of Cu, 22% of Zn, 38% of As, 100% of Cd, 75% of Pb, and 60% of Hg exceeded the moderate ecological risk level ( E r i > 40) (Figure 3). For Cd, 72% of the RD samples were classified to pose a serious ecological risk ( E r i > 320). The industrial areas where Cd posed a serious ecological risk were SH, CW, NS, OS, and US. Among them, in the Onsan Industrial Complex, most E r i values indicated serious ecological risk posed by Cu, Pb, As, and Hg ( E r i > 320). The highest median PER value of 25,489 was recorded at the Onsan Industrial Complex (OS), whereas the lowest median PER value of 250 was observed at the Daebul Industrial Complex (DB). Based on the PER classification, 4.8% of the total RD-sampling sites were placed in the low ecological risk category (PER < 150); 7.9% in the moderate risk category (150 < PER < 300); 20.0% in the severe risk category (300 < PER < 600); and 67.3% in the serious risk category (PER > 600).

3.3. RD as a Potential Pollution Source for Coastal Environments and Atmosphere

The median total load of RD at the nine industrial complexes considered in this study was 822 g/m2, ranging from 334 to 1669 g/m2. The total load of RD in the industrial areas was 2.1–6.5 and 15–16.4 times higher than that in the heavy traffic (126–393 g/m2) and urban (50 g/m2 in commercial areas; 54 g/m2 in residential areas) areas of Korea, respectively [10,41].
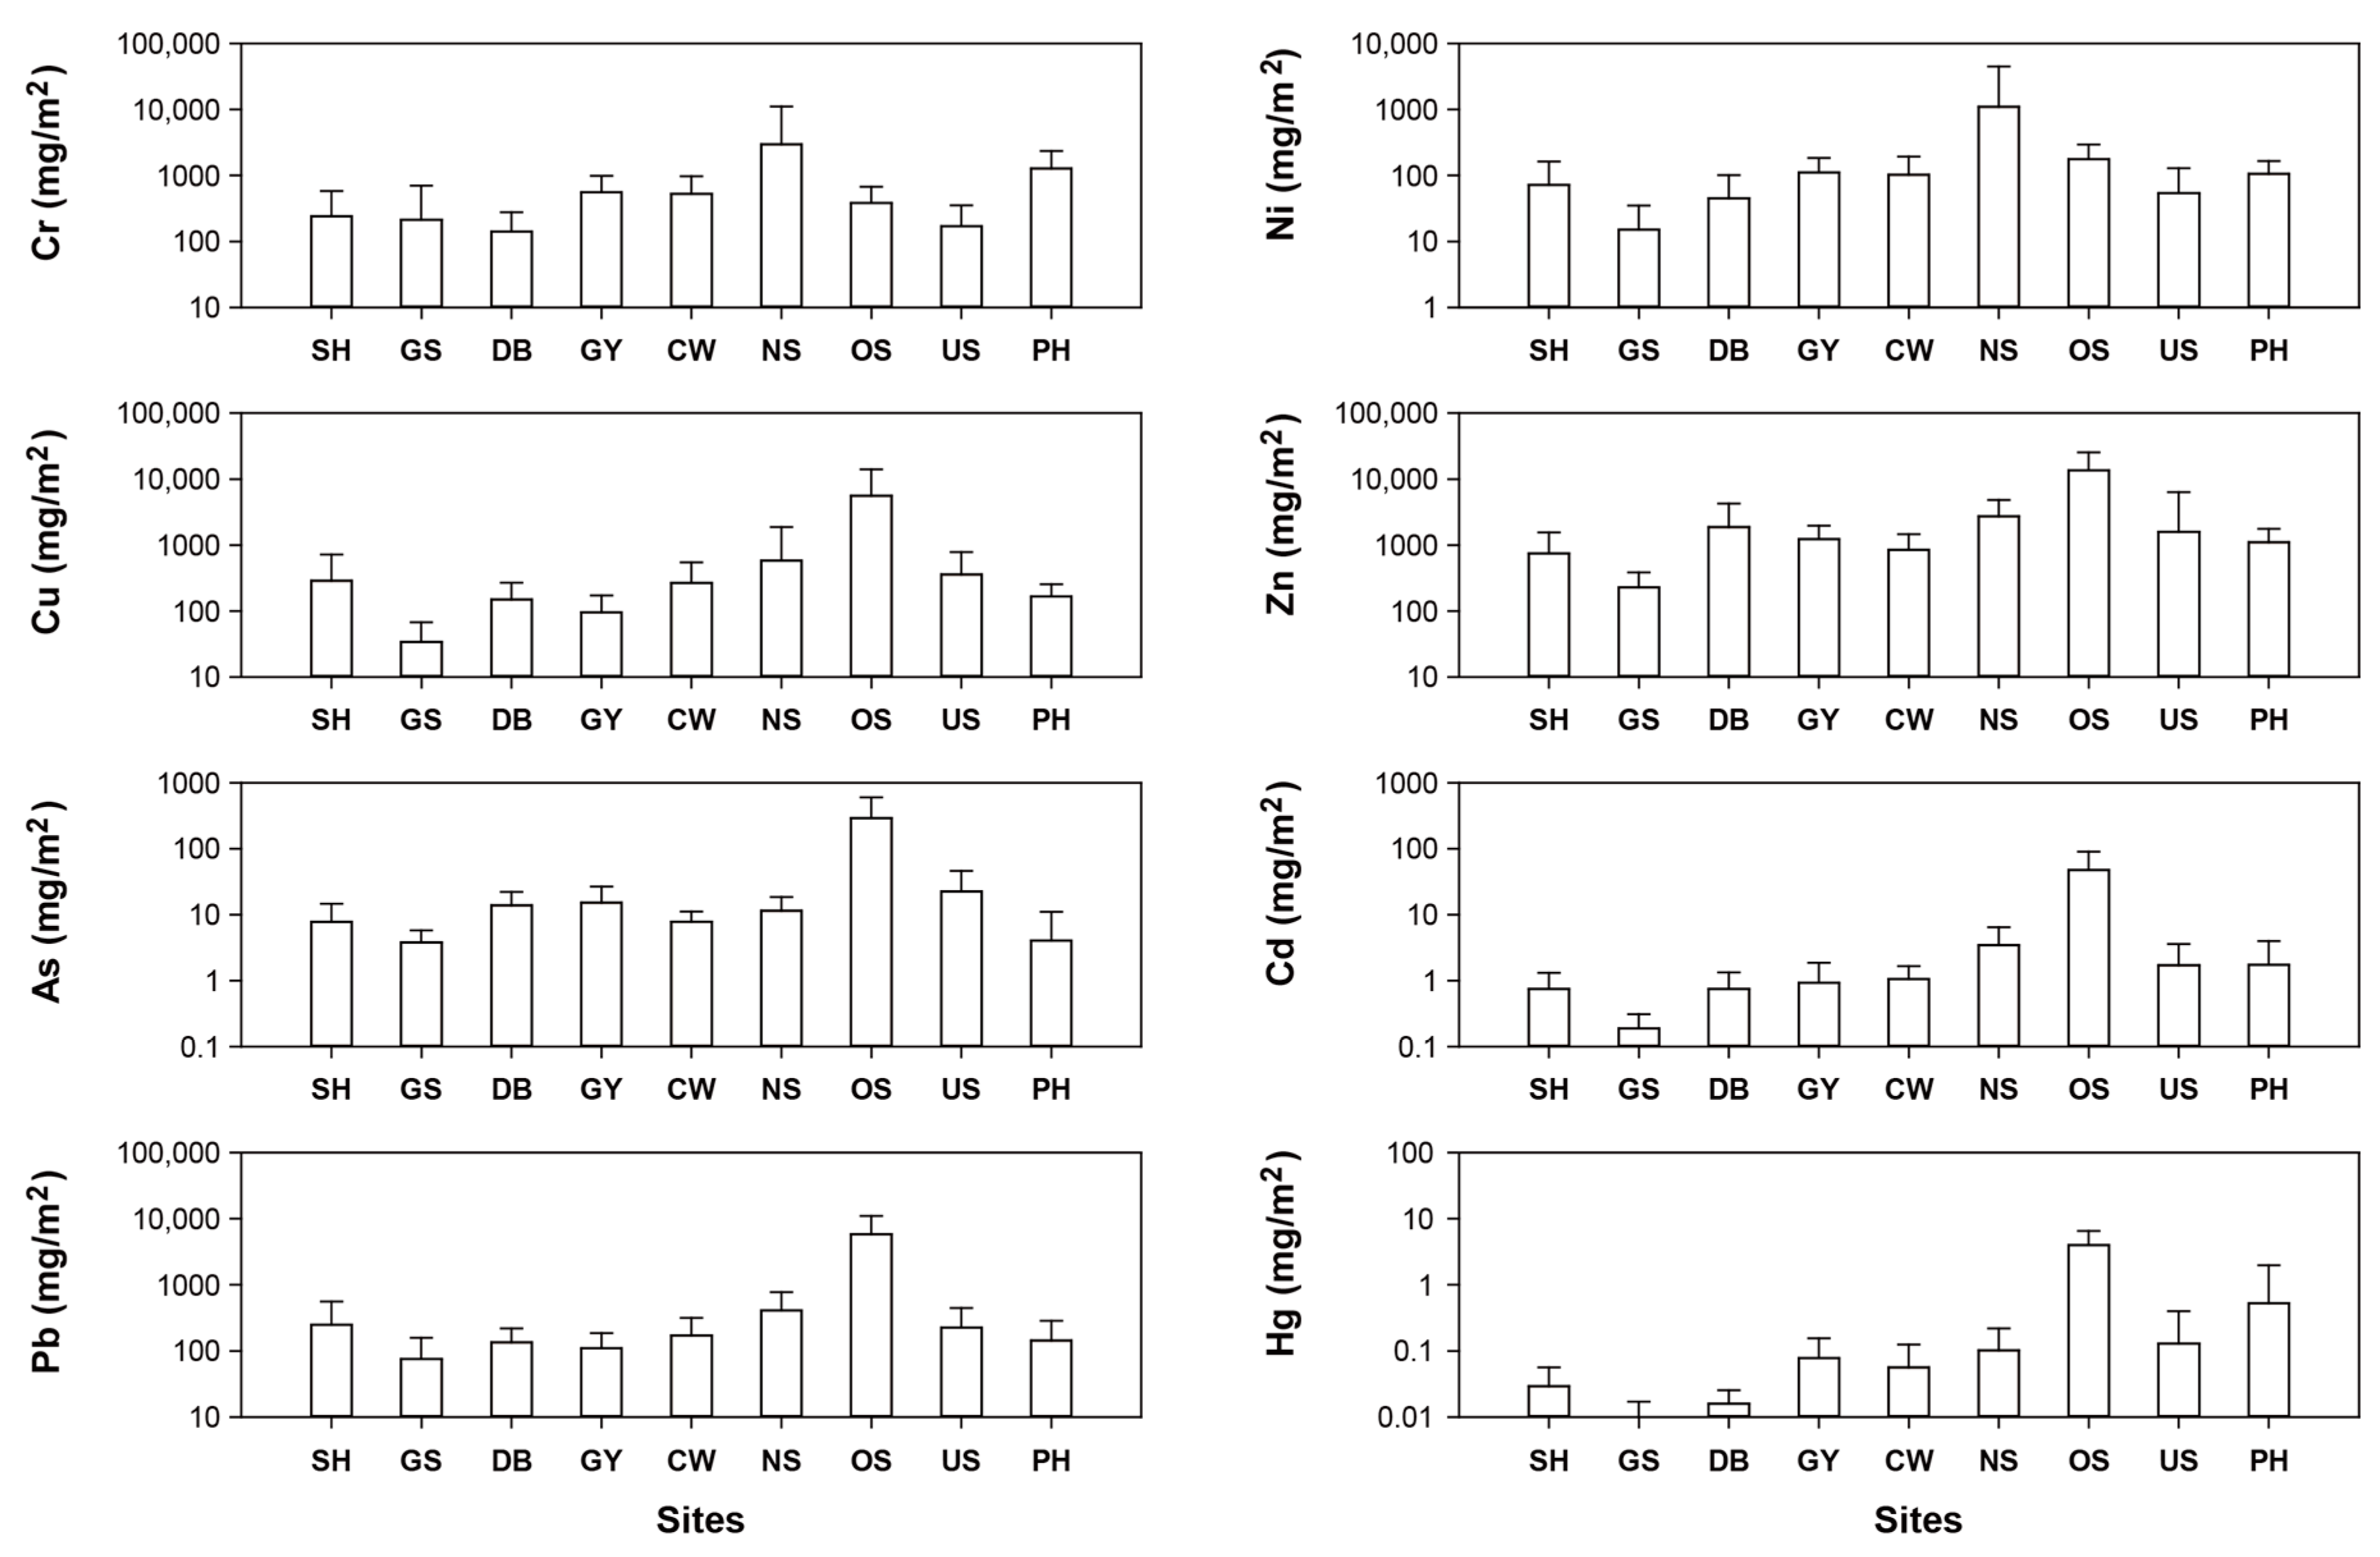
The decreasing order of median PTE load (mg/m2) in RD samples from the study areas was as follows: Zn (2667.6) > Cu (839.4) > Pb (824.9) > Cr (722.5) > Ni (198.6) > As (42.2) > Cd (6.5) > Hg (0.6). The highest PTE loads in RD were found at the Noksan Industrial Complex for Cr and Ni and at the Onsan Industrial Complex for Cu, Zn, As, Cd, Pb, and Hg (Figure 4).
The median total PTE load (for Cr, Ni, Cu, Zn, As, Cd, Pb, and Hg) in RD samples was 5302 mg/m2, ranging from 574 mg/m2 in Gunsan to 26,011 mg/m2 in Onsan. The median PTE load in RD was 120-times higher than that in the urban areas of Korea [41]. Zn occupied a large proportion of the total load (50.3%), and Cr, Cu, Zn, and Pb accounted for 95.3% of the total load. The total metal load of eight metals was highest in the Onsan Industrial Complex (Figure 4).
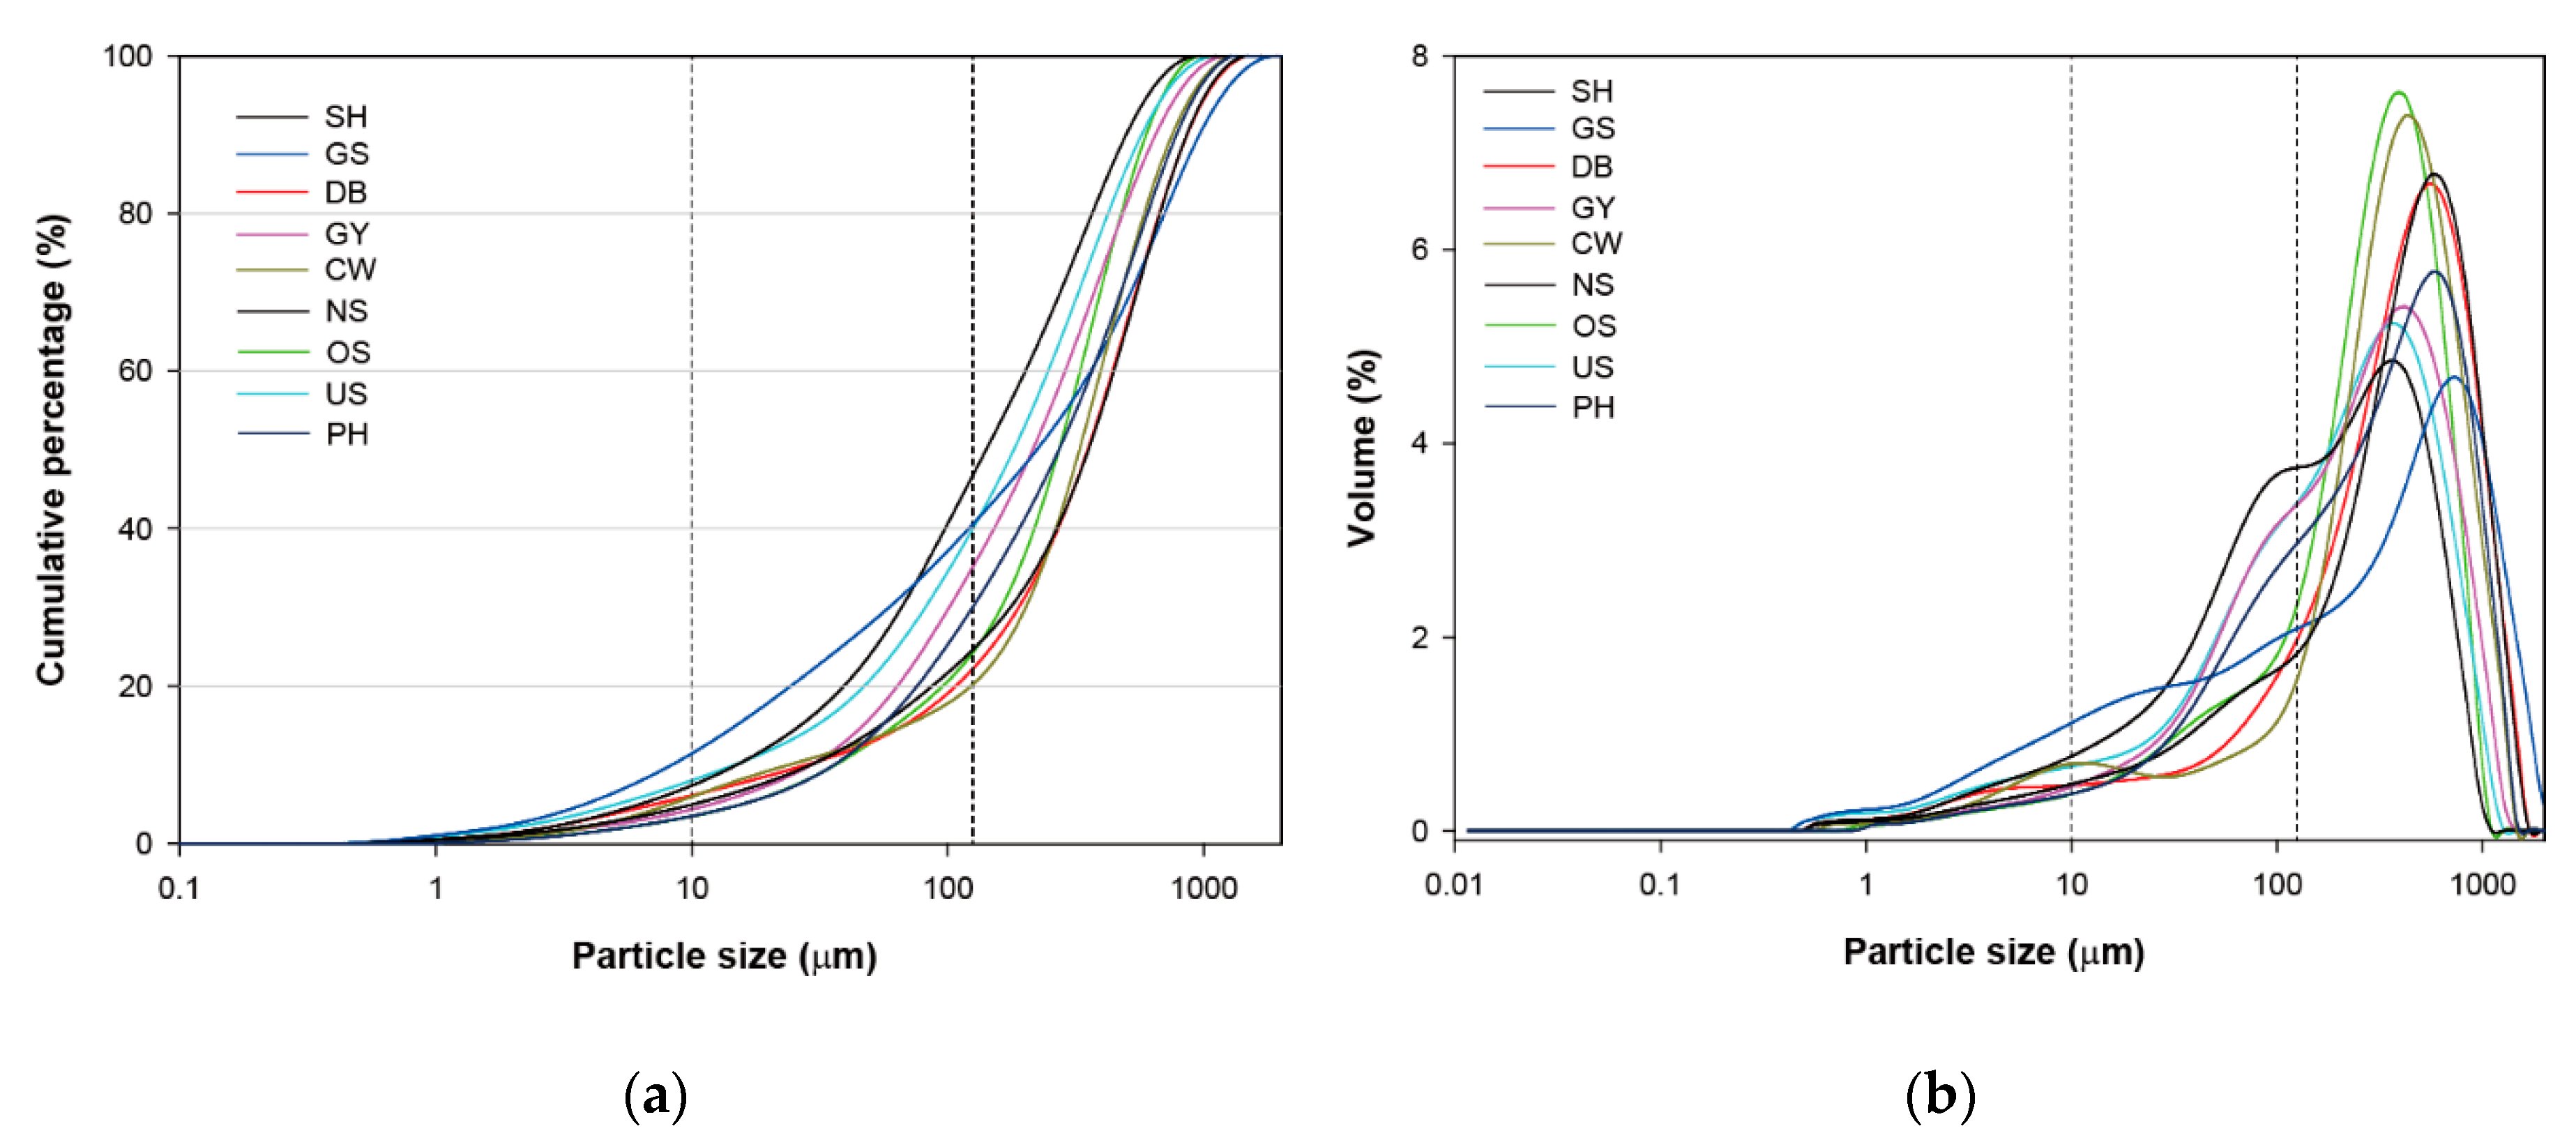
The particle size distribution in RD samples from different industrial areas investigated in this study is shown in Figure 5. The median relative proportions of particles less than 10 and 125 μm in size in the RD samples were 6.7% (5.0–8.3%) and 36.2% (23.4–46.2%), respectively. Generally, the highest PTE concentrations are found in finer size fractions [56,57]. Considering the total area and the total length of roadways in industrial areas, enormous amounts of RD and PTEs would have accumulated on the road surface.
Runoff and resuspension of RD are important contributors to aquatic environments and ambient particulate matter (PM) in the urban area [7,58,59,60,61]. Therefore, RD has increased environmental problems, such as water, sediment, and air pollution, and there are concerns regarding human health associated with RD [25,62,63,64].
Stormwater runoff derives from the wash-off of RD, which is contaminated with PTEs and thus imposes an increasing threat to aquatic and coastal environments [65,66]. Aryal et al. [24] reported that the particle size < 75 μm made up between 6% and 10% of the entire particle size distribution in runoff from motorways, and such particles contributed to more than 90% of the trace metal content. In a previous study [7], we reported that road-deposited sediment (<125 μm) contributed to 41% of a total load of suspended solids in stormwater runoff at intensive industrial areas of Korea. The relative contribution of road-deposited sediment to the total PTE load of suspended solids in runoff was 10–25% in urban areas [67] and 22.1% in industrial areas [7]. RD and associated PTEs are ultimately discharged into coastal environments during wet seasons without any treatment. It has been reported that the concentration of trace metals around the Onsan Industrial complex is the highest among that in marine sediments along the coast of Korea [26,32] as well as in stream sediments [68]. One of the important sources of PTE pollution in coastal sediments around industrial areas is possibly RD, which is accumulated on impervious surfaces such as roads.
RD resuspension is also a major source of urban air pollution and contributes to non-exhaust emission (for example, from the wear of brake pads and tires and abrasion of the road surface) emanating from road transport [63,69,70]. Rexeis and Hausberger [71] reported that 80–90% of the total particulate matter emission due to traffic came from non-exhaust emission until 2020.
In Korea, it has been reported that resuspension dust or fugitive dust from paved roads contributes more than 60% of fine dust [72,73]. The mean traffic in the National Industrial Complex was 52,012 vehicles/day in 2017, comprising 77.4%, 1.9%, and 20.7% of cars, buses, and trucks, respectively [74]. Therefore, resuspended dust in industrial areas is higher than that in urban areas owing to the accumulation of large amounts of RD and the increase in traffic-induced turbulence by large trucks. The fine particles present in RD are inhaled by humans and may have harmful effects on the respiratory system [75,76].
In Korea, the importance of resuspended dust (fugitive dust) has been emphasized recently, and roads in urban areas are periodically cleaned using road-cleaning vehicles with vacuum-assisted rotary sweepers. However, in industrial areas, although the amount of RD accumulated on the road surface and the concentration of PTEs are very high compared to that in urban areas, there is a lack of awareness regarding the importance of road cleaning. In addition, industrial complexes in Korea were created several decades ago; many vehicles are parked on roads around the facility because of the lack of parking spaces. Large cities are established around the industrial areas where a large population resides (Table 1). Therefore, it is important to establish a strategy to efficiently remove RD in industrial areas to protect the health of employees and residents around industrial complexes as well as to reduce coastal pollution induced by RD wash-off during rainfall events.

4. Conclusions

This study examined the pollution characteristics of PTEs in road dust from nine different industrial areas in Korea. The PTEs contamination in RD samples was affected by a combination of traffic and industrial activities, such as corrosion of galvanized steel sheets in factories, transportation of raw industrial materials, and the presence of smelters. The concentration of Zn in RD was the highest, but Cd was more severe than that of other elements in terms of pollution and ecological risk assessment. Considering the total length of the roads, enormous amounts of Cu, Zn, Cr, and Pb would have accumulated on road surfaces in industrial areas of Korea. Additionally, the mean proportions of particles < 10 and < 125 μm in size were 6.7% and 36.2% of the total particles in RD, respectively. PTEs accumulated on the impervious layers, especially road surfaces, may be diffused by the wind, affecting the surrounding cities and transported to coastal environments without any treatment as a non-point source, causing coastal pollution. This study provides a scientific basis for solving public and environmental concerns caused by RD highly contaminated with PTEs and proposes the necessity of introducing an efficient management strategy to reduce RD, which affects coastal pollution and human health. Furthermore, it would be important to conduct additional surveys on the impact of small-sized RD on the health of industrial employees and residents living around industrial areas.

Supplementary Materials

The following are available online at https://www.mdpi.com/2073-4433/11/12/1366/s1, Table S1: Detailed climate information of the sampling regions in this study, Table S2: Median, minimum, and maximum values (in parentheses) for amount of road dust surface loading (g/m2), median particle size (µm), magnetic susceptibility (10–6 SI), PTEs concentrations and pollution assessment indices in road dust from 9 different Industrial regions of this study, Table S3: Pearson’s correlation coefficient between the measured parameters in the RD of this study. Marked correlations (bold) are significant at the 0.01 level (2–tailed).

Author Contributions

Conceptualization, field sampling, methodology, writing—original draft, H.J. and K.R.; methodology, writing—review and editing, J.Y.C. and J.L. All authors have read and agreed to the published version of the manuscript.

Funding

This research was funded by the Korea Institute of Ocean Science and Technology (PE99812).

Acknowledgments

We thank Seung-yong Lee for helping us with road dust sampling.

Conflicts of Interest

The authors declare no conflict of interest.

References

  1. Gabarrón, M.; Faz, A.; Martínez-Martínez, S.; Zornoza, R.; Acosta, J.A. Assessment of metals behaviour in industrial soil using sequential extraction, multivariable analysis and a geostatistical approach. J. Geochem. Explor. 2017, 172, 174–183. [Google Scholar] [CrossRef]
  2. Radziemska, M.; Bęś, A.; Gusiatin, Z.M.; Majewski, G.; Mazur, Z.; Bilgin, A.; Jaskulska, I.; Brtnický, M. Immobilization of potentially toxic elements (PTE) by mineral-based amendments: Remediation of contaminated soils in post-industrial sites. Minerals 2020, 10, 87. [Google Scholar] [CrossRef] [Green Version]
  3. Srarfi, F.; Rachdi, R.; Bol, R.; Gocke, M.I.; Brahim, N.; SlimShimi, N. Stream sediments geochemistry and the influence of flood phosphate mud in mining area, Metlaoui, Western south of Tunisia. Environ. Earth Sci. 2019, 78, 211. [Google Scholar] [CrossRef]
  4. Wei, J.; Duan, M.; Li, Y.; Nwankwegu, A.S.; Ji, Y.; Zhang, J. Concentration and pollution assessment of heavy metals within surface sediments of the Raohe Basin, China. Sci. Rep. 2019, 9, 1–7. [Google Scholar] [CrossRef] [PubMed] [Green Version]
  5. Gabrielyan, A.V.; Shahnazaryan, G.; Minasyan, S. Distribution and identification of sources of heavy metals in the Voghji River Basin impacted by mining activities (Armenia). J. Chem. 2018, 2018, 7172426. [Google Scholar] [CrossRef] [Green Version]
  6. Zhao, H.; Li, X.; Wang, X. Heavy metal contents of road-deposited sediment along the urban-rural gradient around Beijing and its potential contribution to runoff pollution. Environ. Sci. Technol. 2011, 45, 7120–7127. [Google Scholar] [CrossRef] [PubMed]
  7. Jeong, H.; Choi, J.Y.; Lee, J.; Lim, J.; Ra, K. Heavy metal pollution by road-deposited sediments and its contribution to total suspended solids in rainfall runoff from intensive industrial areas. Environ. Pollut. 2020, 265, 115028. [Google Scholar] [CrossRef] [PubMed]
  8. Jeong, H.; Kim, K.T.; Kim, E.S.; Ra, K.; Lee, S.Y. Sediment quality assessment for heavy metals in streams around the Shihwa Lake. J. Korean Soc. Mar. Environ. Energy 2016, 19, 25–36, (in Korean with English abstract). [Google Scholar] [CrossRef]
  9. Kelepertzis, E.; Argyraki, A.; Chrastny, V.; Botsou, F.; Skordas, K.; Komarek, M.; Fouskas, A. Metal(loid) and isotopic tracing of Pb in soils, road and house dusts from the industrial area of Volos (central Greece). Sci. Total Environ. 2020, 725, 138300. [Google Scholar] [CrossRef]
  10. Kim, D.G.; Kang, H.M.; Ko, S.O. Reduction of non-point source contaminants associated with road-deposited sediments by sweeping. Environ. Sci. Pollut. Res. 2019, 26, 1192–1207. [Google Scholar] [CrossRef]
  11. Zhang, X.; Yang, L.; Li, Y.; Li, H.; Wang, W.; Ye, B. Impacts of lead/zinc mining and smelting on the environment and human health in China. Environ. Monit. Assess. 2012, 184, 2261–2273. [Google Scholar] [CrossRef] [PubMed]
  12. Xia, Q.; Zhang, J.; Chen, Y.; Ma, Q.; Peng, J.; Rong, G.; Tong, Z.; Liu, X. Pollution, sources and human health risk assessment of potentially toxic elements in different land use types under the background of industrial cities. Sustainability 2020, 12, 2121. [Google Scholar] [CrossRef] [Green Version]
  13. Xu, X.; Zhao, Y.; Zhao, X.; Wang, Y.; Deng, W. Sources of heavy metal pollution in agricultural soils of a rapidly industrializing area in the Yangtze Delta of China. Ecotoxicol. Environ. Saf. 2014, 108, 161–167. [Google Scholar] [CrossRef] [PubMed]
  14. Ma, C.Y.; Cai, D.J.; Yan, H. Soil Cd pollution and research progress of treatment techniques. Henan Chem. Ind. 2013, 30, 17–22. (In Korean) [Google Scholar]
  15. Shi, J.; Liang, L.; Yuan, C.; He, B.; Jiang, G. Methylmercury and total mercury in sediments collected from the East China Sea. Bull. Environ. Contam. Toxicol. 2005, 74, 980–987. [Google Scholar] [CrossRef] [Green Version]
  16. Luo, L.; Ma, Y.; Zhang, S.; Wei, D.; Zhu, Y.G. An inventory of trace element inputs to agricultural soils in China. J. Environ. Manag. 2009, 90, 2524–2530. [Google Scholar] [CrossRef]
  17. Fang, W.; Yang, Y.; Xu, Z. PM10 and PM2.5 and health risk assessment for heavy metals in a typical factory for Cathode Ray tube television recycling. Environ. Sci. Technol. 2013, 47, 12469–12476. [Google Scholar] [CrossRef]
  18. Hsu, C.Y.; Chiang, H.C.; Chen, M.J.; Chuang, C.Y.; Tsen, C.M.; Fang, G.C.; Tsai, Y.I.; Chen, N.T.; Lin, T.Y.; Lin, S.L.; et al. Ambient PM2.5 in the residential area near industrial complexes: Spatiotemporal variation, source apportionment, and health impact. Sci. Total Environ. 2017, 590–591, 204–214. [Google Scholar] [CrossRef]
  19. Jia, J.; Cheng, S.; Yao, S.; Xu, T.; Zhang, T.; Ma, Y.; Wang, H.; Duan, W. Emission characteristics and chemical components of size-segregated particulate matter in iron and steel industry. Atmos. Environ. 2018, 182, 115–127. [Google Scholar] [CrossRef]
  20. Song, X.; Shao, L.; Zheng, Q.; Yang, S. Mineralogical and geochemical composition of particulate matter (PM10) in coal and non-coal industrial cities of Henan Province, North China. Atmos. Res. 2014, 143, 462–472. [Google Scholar] [CrossRef]
  21. Li, Y.; Zhang, B.; Liu, Z.; Wang, S.; Yao, J.; Borthwick, A.G.L. Vanadium contamination and associated health risk of farmland soil near smelters throughout China. Atmos. Environ. 2018, 182, 115–127. [Google Scholar] [CrossRef] [PubMed]
  22. Konieczynski, J.; Zajusz-Zubek, E.; Jablonska, M. The release of trace elements in the process of coal coking. Sci. World J. 2012, 2012, 1–8. [Google Scholar] [CrossRef] [PubMed] [Green Version]
  23. Liu, A.; Liu, L.; Ii, D.; Guan, Y. Characterizing heavy metal build-up on urban road surfaces: Implication for stormwater reuse. Sci. Total Environ. 2015, 515–516, 20–29. [Google Scholar] [CrossRef] [PubMed]
  24. Aryal, R.; Beecham, S.; Sarkar, B.; Chong, M.N.; Kinsela, A.; Kandasamy, J.; Vigneswaran, S. Readily wash-off road dust and associated heavy metals on motorways. Water Air Soil Pollut. 2018, 228, 1. [Google Scholar] [CrossRef]
  25. Jeong, H.; Choi, J.Y.; Lim, J.; Shim, W.J.; Kim, Y.O.; Ra, K. Characterization of the contribution of road deposited sediments to the contamination of the close marine environment with trace metals: Case of the port city of Busan (South Korea). Mar. Pollut. Bull. 2020, 161, 111717. [Google Scholar] [CrossRef]
  26. Ra, K.; Kim, E.S.; Kim, K.T.; Kim, J.G.; Lee, J.M.; Choi, J.Y. Assessment of heavy metal contamination and its ecological risk in the surface sediments along the coast of Korea. J. Coast. Res. 2013, 65, 105–110. [Google Scholar] [CrossRef]
  27. Hussein, T.; Johansson, C.; Karlsson, H.; Hansson, H.C. Factors affecting non-tailpipe aerosol particle emissions from paved roads: On-road measurements in Stockholm, Sweden. Atmos. Environ. 2008, 42, 688–702. [Google Scholar] [CrossRef]
  28. Chen, J.; Wang, W.; Liu, H.; Ren, L. Determination of road dust loading and chemical characteristics using resuspension. Environ. Monit. Assess. 2011, 184, 1693–1709. [Google Scholar] [CrossRef]
  29. Bi, C.; Zhou, Y.; Chen, Z.; Jia, J.; Bao, X. Heavy metals and lead isotopes in soils, road dust and leafy vegetables and health risks via vegetable consumption in the industrial areas of Shanghai, China. Sci. Total Environ. 2018, 619–620, 1349–1357. [Google Scholar] [CrossRef]
  30. Kim, K.S.; Gallent, N. Industrial park development and planning in South Korea. Reg. Stud. 1997, 31, 424–430. [Google Scholar]
  31. Choi, J.S. A study on problems of environmental facilities in industrial complexes and some policy recommendations. J. Korean Urban Manag. Assoc. 2009, 22, 117–144. (In Korean) [Google Scholar]
  32. Ra, K.; Kim, J.K.; Hong, S.H.; Yim, U.H.; Shim, W.J.; Lee, S.Y.; Kim, Y.O.; Lim, J.; Kim, E.S.; Kim, K.T. Assessment of pollution and ecological risk of heavy metals in the surface sediments of Ulsan Bay, Korea. Ocean Sci. J. 2014, 49, 279–289. [Google Scholar] [CrossRef]
  33. Kang, B.W.; Kim, M.J.; Baek, K.M.; Seo, Y.K.; Lee, H.S.; Kim, J.H.; Han, J.S.; Baek, S.O. A study on the concentration distribution of airborne heavy metals in major industrial complexes in Korea. J. Korean Soc. Atmos. Environ. 2018, 34, 269–280, (In Korean with English abstract). [Google Scholar] [CrossRef]
  34. Gundawardena, J.; Ziyath, A.M.; Egodawatta, P.; Ayoko, G.A.; Goonetilleke, A. Mathematical relationships for metal build-up on urban road surfaces based on traffic and land use characteristics. Chemosphere 2014, 99, 267–271. [Google Scholar] [CrossRef] [Green Version]
  35. Novotny, V.; Chesters, G. Handbook of Nonpoint Pollution Sources and Management; Van Nostrand Reinhold Company: New York, NY, USA, 1981; p. 255. [Google Scholar]
  36. Müller, G. Index of geoaccumulation in sediments of the Rhine River. Geojournal 1969, 2, 108–118. [Google Scholar]
  37. Yoon, J.K.; Kim, D.H.; Kim, T.S.; Park, J.G.; Chung, I.R.; Kim, J.H.; Kim, H. Evaluation on natural background of the soil heavy metals in Korea. J. Soil Groundw. Environ. 2009, 14, 32–39. (In Korean) [Google Scholar]
  38. Rudnick, R.I.; Gao, S. Composition of the continental crust. Treatise Geochem. 2003, 3, 1–64. [Google Scholar] [CrossRef]
  39. Håkanson, L. An ecological risk index for aquatic pollution control. A sedimentological approach. Water. Res. 1980, 14, 975–1001. [Google Scholar] [CrossRef]
  40. Wang, K.; Tian, H.; Hua, S.; Zhu, C.; Gao, J.; Xue, Y.; Hao, J.; Wang, Y.; Zhou, J. A comprehensive emission inventory of multiple air pollutants from iron and steel industry in China: Temporal trends and spatial variation characteristics. Sci. Total Environ. 2016, 559, 7–14. [Google Scholar] [CrossRef]
  41. Jeong, H.; Choi, J.Y.; Ra, K. Characteristics of heavy metal pollution in road dust from urban areas: Comparison by land use types. J. Environ. Anal. Health Toxicol. 2020, 23, 101–111. [Google Scholar] [CrossRef]
  42. Gunawardena, J.; Ziyath, A.M.; Egodawatta, P.; Ayoko, G.A.; Goonetilleke, A. Sources and transport pathways of common heavy metals to urban road surfaces. Ecol. Engin. 2015, 77, 98–102. [Google Scholar] [CrossRef] [Green Version]
  43. Mummullage, S.; Egodawatta, P.; Ayoko, G.A.; Goonetilleke, A. Use of physiochemical signatures to assess the sources of metals in urban road dust. Sci. Total Environ. 2015, 541, 1303–1309. [Google Scholar] [CrossRef] [PubMed]
  44. Hong, N.; Zhu, P.; Liu, A.; Zhao, X.; Guan, Y. Using an innovative flag element ratio approach to tracking potential source of heavy metals on urban road surfaces. Environ. Pollut. 2018, 243, 410–417. [Google Scholar] [CrossRef] [PubMed]
  45. Jeong, H.; Choi, J.; Ra, K. Assessment of metal pollution of road-deposited sediments and marine sediments around Gwangyang Bay, Korea. J. Korean Soc. Oceanogr. 2020, 25, 42–53. (in Korean). [Google Scholar] [CrossRef]
  46. Hwang, H.M.; Fiala, M.J.; Park, D.; Wade, T.L. Review of pollutants in urban road dust and stormwater runoff: Part 1. Heavy metals released from vehicles. Int. J. Urban Sci. 2016, 20, 334–360. [Google Scholar] [CrossRef]
  47. Helmreich, B.; Hilliges, R.; Schriewer, A.; Horn, H. Runoff pollutants of a highly trafficked urban road-Correlation analysis and seasonal influences. Chemosphere 2010, 80, 991–997. [Google Scholar] [CrossRef]
  48. Huber, M.; Welker, A.; Helmreich, B. Critical review of heavy metal pollution of traffic area runoff: Occurrence influencing factors and partitioning. Sci. Total Environ. 2016, 541, 895–919. [Google Scholar] [CrossRef]
  49. Sere, P.R.; Deya, C.; Elsner, C.I.; Di Sarli, A.R. Corrosion of painted galvanneal steel. Procedia Mater. Sci. 2015, 8, 1–10. [Google Scholar] [CrossRef] [Green Version]
  50. Ji, C.; Ma, X.; Zhai, Y.; Zhang, R.; Shen, X.; Zhang, T.; Hong, J. Environmental impact assessment of galvanized sheet production: A case study in Shandong Province, China. Int. J. Life Cycle Assess. 2020, 25, 760–770. [Google Scholar] [CrossRef]
  51. Lu, S.G.; Bai, S.Q.; Xue, Q.F. Magnetic properties as indicators of heavy metals pollution in urban topsoils: A case study from the city of Luoyang, China. Geophys. J. Int. 2007, 171, 568–580. [Google Scholar] [CrossRef] [Green Version]
  52. Cao, L.; Appel, E.; Hu, S.; Yin, G.; Lin, H.; Rosler, W. Magnetic response to air pollution recorded by soil and dust-loaded leaves in a changing industrial environment. Atmos. Environ. 2015, 119, 304–313. [Google Scholar] [CrossRef]
  53. Jaffar, S.T.A.; Chen, L.Z.; Younas, H.; Ahmad, N. Heavy metals pollution assessment in correlation with magnetic susceptibility in topsoils of Shanghai. Environ. Earth Sci. 2017, 76, 277. [Google Scholar] [CrossRef]
  54. Brempong, F.; Mariam, Q.; Preko, K. The use of magnetic susceptibility measurements to determine pollution of agricultural soils in road proximity. Afr. J. Environ. Sci. Technol. 2016, 10, 263–271. [Google Scholar] [CrossRef] [Green Version]
  55. NYSDEC (New York State Department of Environmental Conservation). Screening and Assessment of Contaminated Sediment; Division of Fish, Wildlife and Marine Resources: Albany, NY, USA, 2014; p. 66. [Google Scholar]
  56. Zhao, H.; Li, X.; Wang, X.; Tian, D. Grain size distribution of road-deposited sediment and its contribution to heavy metal pollution in urban runoff in Beijing, China. J. Hazard. Mater. 2010, 183, 203–210. [Google Scholar] [CrossRef] [PubMed]
  57. Lanzerstorfer, C. Heavy metals in the finest size fractions of road-deposited sediments. Environ. Pollut. 2018, 239, 522–531. [Google Scholar] [CrossRef]
  58. Han, S.; Youn, J.S.; Jung, Y.W. Characterization of PM10 and PM2.5 source profiles for resuspended road dust collected using mobile sampling methodology. Atmos. Environ. 2011, 45, 3343–3351. [Google Scholar] [CrossRef]
  59. Ram, S.S.; Kumar, R.V.; Chaudhuri, P.; Chanda, S.; Santra, S.C.; Sudarshan, M.; Chakraborty, A. Physico-chemical characterization of street dust and re-suspended dust on plant canopies: An approach for fingerprinting the urban environment. Ecol. Indic. 2014, 36, 334–338. [Google Scholar] [CrossRef]
  60. Alves, C.A.; Evtyugina, M.G.; Vicente, A.M.P.; Vicente, E.; Nunes, T.; Silva, P.M.A.; Duarte, M.A.C.; Pio, C.A.; Amato, F.; Querol, X. Chemical profiling of PM10 from urban road dust. Sci. Total Environ. 2018, 434, 41–51. [Google Scholar] [CrossRef]
  61. Lanzerstorfer, C. Toward more intercomparable road dust studies. Crit. Rev. Environ. Sci. Technol. 2020, 1737472. [Google Scholar] [CrossRef] [Green Version]
  62. Yang, Q.; Li, Z.; Lu, X.; Duan, Q.; Huang, L.; Bi, J. A review of soil heavy metal pollution from industrial and agricultural regions in China: Pollution and risk assessment. Sci. Total Environ. 2018, 642, 690–700. [Google Scholar] [CrossRef]
  63. Pun, V.C.; Tian, L.; Ho, K.F. Particulate matter from re-suspended mineral dust and emergency cause-specific respiratory hospitalizations in Hong Kong. Atmos. Environ. 2017, 165, 191–197. [Google Scholar] [CrossRef] [Green Version]
  64. Askariyeh, M.H.; Venugopal, M.; Khreis, H.; Birt, A.; Zietsman, J. Near-road traffic-related air pollution: Resuspended PM2.5 from highways and arterials. Int. J. Environ. Res. Public Health 2020, 17, 2851. [Google Scholar] [CrossRef] [PubMed]
  65. Huang, J.; Li, F.; Zeng, G.; Liu, W.; Huang, X.; Xiao, Z.; Wu, H.; Gu, Y.; Li, X.; He, X.; et al. Integrating hierarchical bioavailability and population distribution into potential eco-risk assessment of heavy metals in road dust: A case study in Xiandao District, Changsha City, China. Sci. Total Environ. 2016, 541, 969–976. [Google Scholar] [CrossRef] [PubMed]
  66. Wang, Q.; Zhang, Q.; Dzakpasu, M.; Chang, N.; Wang, X. Transferral of HMs pollution from road-deposited sediments to stormwater runoff during transport processes. Front. Environ. Sci. Eng. 2019, 13, 13. [Google Scholar] [CrossRef]
  67. Zhao, H.; Li, X. Risk assessment of metals in road-deposited sediment along an urban-rural gradient. Environ. Pollut. 2013, 174, 297–304. [Google Scholar] [CrossRef]
  68. Jeong, H.; Choi, J.Y.; Ra, K. Heavy metal pollution assessment in stream sediments from urban and different types of industrial areas in South Korea. Soil Sediment Contam. 2021. under review. [Google Scholar]
  69. Pant, P.; Harrison, R.M. Estimation of the contribution of road traffic emissions to particulate matter concentrations from field measurements: A review. Atmos. Environ. 2013, 77, 78–97. [Google Scholar] [CrossRef]
  70. Valotto, G.; Rampazzo, G.; Visin, F.; Bonella, F.; Cattaruzza, E.; Slisenti, A.; Formenton, G.; Tieppo, P. Environmental and traffic related parameters affecting road dust composition: A multi-technique approach applied to Venice area (Italy). Atmos. Environ. 2015, 122, 596–608. [Google Scholar] [CrossRef]
  71. Rexeis, M.; Hausberger, S. Trend of vehicle emission levels until 2020—Prognosis based on current vehicle measurements and future emission legislation. Atmos. Environ. 2009, 43, 4689–4698. [Google Scholar] [CrossRef]
  72. Jung, Y.W.; Han, S.; Won, K.H.; Jang, K.W.; Hong, J.H. Present status of emission estimation methods of resuspended dusts from paved roads. J. Korean Soc. Environ. Eng. 2006, 28, 1126–1132, (in Korean with English abstract). [Google Scholar]
  73. Yoo, E.C.; Dou, W.G.; Cho, J.G. Study for the control of re-suspend dust from paved road. Annu. Rep. Busan Metropolitan City Inst. Health. Environ. 2009, 19, 177–186, (In Korean with English abstract). [Google Scholar]
  74. MOLIT (Ministry of Land, Infrastructure and Transport). National Traffic Survey in 2017 (Freight Transport Surveys); MOLIT: Sejong City, Korea, 2017; p. 328.
  75. Bian, B.; Lin, C.; Wu, H.S. Contamination and risk assessment of metals in road-deposited sediments in a medium-sized city of China. Ecotox. Environ. Safe 2015, 112, 87–95. [Google Scholar] [CrossRef] [PubMed]
  76. Adamiec, E.; Jarosz-Krzeminska, E. Human Health risk assessment associated with contaminants in the finest fraction of sidewalk dust collected in proximity to trafficked roads. Sci. Rep. 2019, 9, 16364. [Google Scholar] [CrossRef] [PubMed]
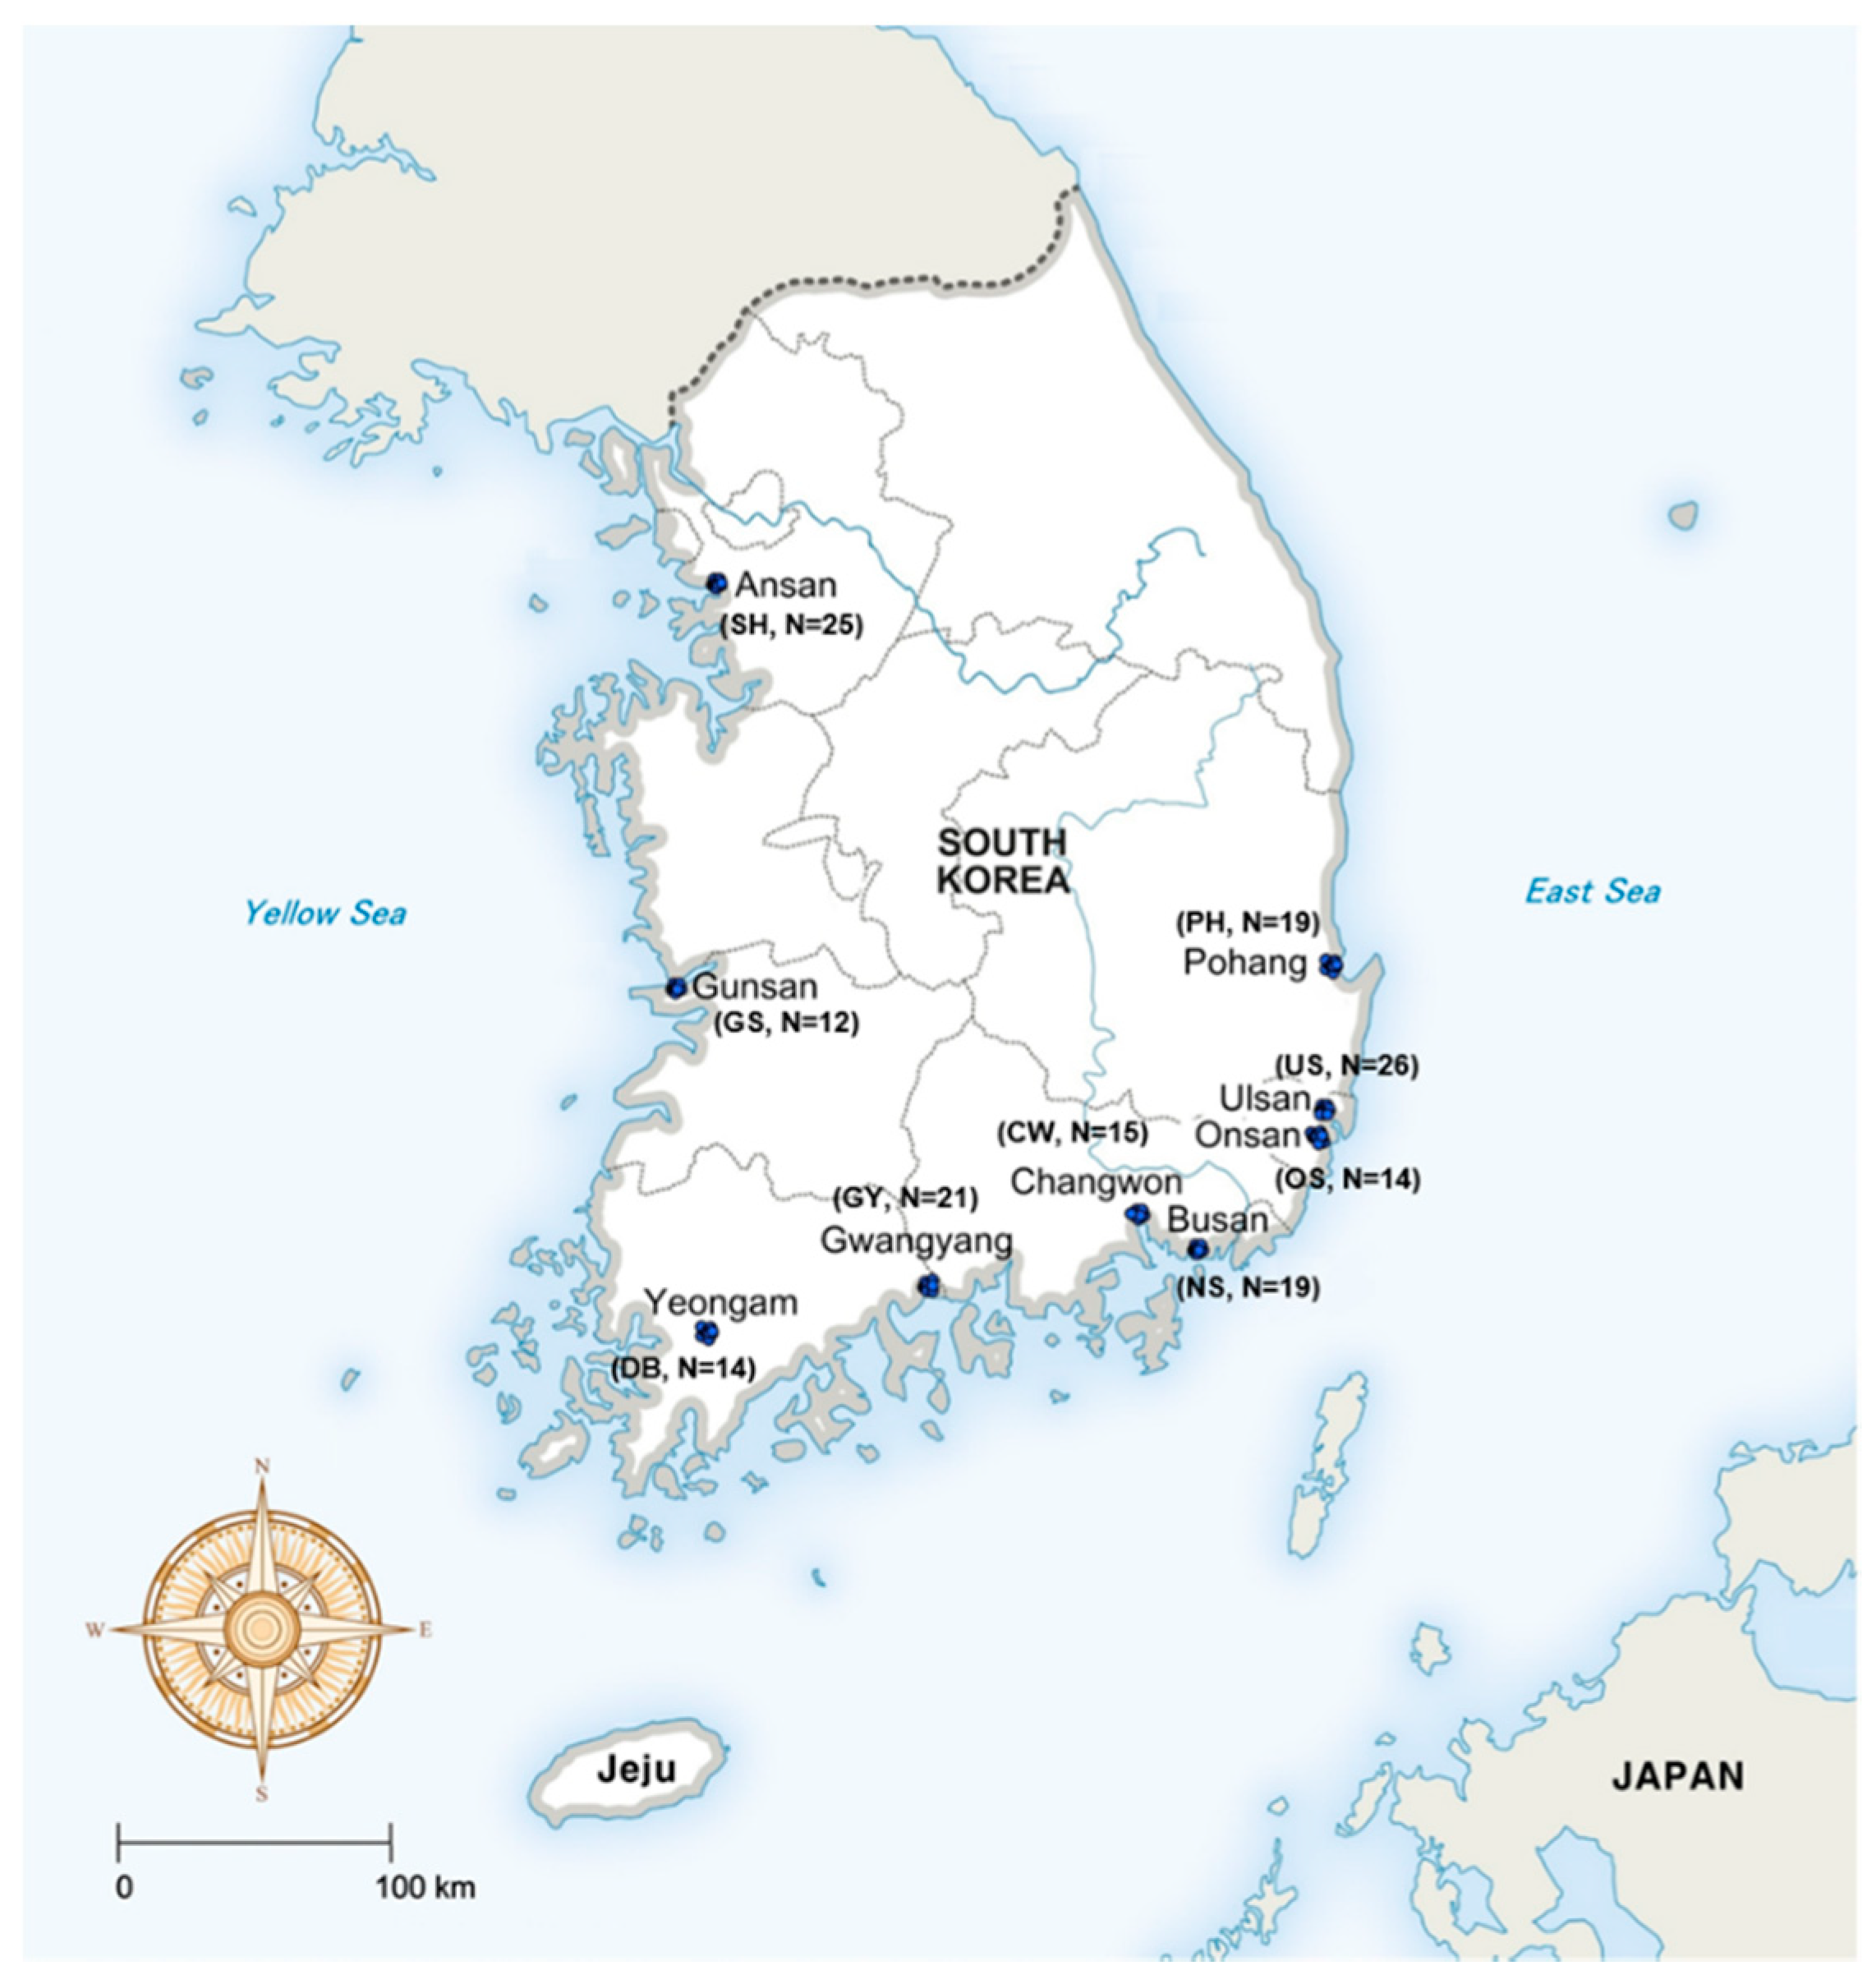
Figure 1. Map of the study area showing road dust sampling locations from 9 different industrial areas of Korea.
Atmosphere 11 01366 g001
Figure 2. Comparison of PTEs concentrations in RD from different Industrial areas of Korea. The bar height and error bar represents the median values and standard deviation (SD) of the data (note the log scale on the y–axis).
Atmosphere 11 01366 g002
Figure 3. Ecological risk factors ( E r i ) of individual toxic elements in RD samples in this study.
Atmosphere 11 01366 g003
Figure 4. Comparison of median potentially toxic elements (PTEs) load (mg/m2) in RD samples from different industrial areas in this study. Log-scale was used for arithmetic scaling of the y-axis. Values are expressed as median ± standard deviation (SD) of the measured metal data.
Atmosphere 11 01366 g004
Figure 5. Cumulative curves (a) and particle size distributions (b) in the RD samples from different national industrial areas of this study.
Atmosphere 11 01366 g005
Table 1. Information on the number of operating facilities, designated area (km2), the number of employees, residents and major industrial types in different industrial regions collected from the road dust (RD) of this study.
RegionNo. of Facilities
(N)
Designated Area
(km2)
No. of Employees
(N)
No. of Residents
(N)
No. of Sampling
(N)
Major Industrial Types
Ansan (Shihwa; SH)18,80930.8292,070650,91825Assembled metal, metal processing, electronics components
Gunsan (Gunsan; GS)51919.29.573270,13112Manufacture of assembly metals related to automobiles
Yeongam (Daebul; DB)24510.76.17254,59314Transportation equipment, steel, machinery manufacturing
Gwangyang (Gwangyang; GY)9216.64.643156,75021Steel and steel-related works, container terminal
Changwon (Changwon; CW)246924.4116.4361,044,74015Industrial machinery industry, electrical equipment, transportation machinery
Busan (Noksan; NS)14596.035.2083,413,84119Precision machinery manufacturing, assembled metal, automobile
Onsan (Onsan; OS)29616.617.220223,16714Nonferrous metals processing, shipbuilding equipment, oil refining
Ulsan (Ulsan; US)75737.1106.0751,148,01926Petrochemicals, automobile and transportation equipment
Pohang (Pohang; PH)783.97.134507,02519Steel-related primary metal manufacturing industry
Table 2. Principal component factor scores and eigenvalues of the measured parameter of this study. The results of the principal component analysis (PCA) (PCA loadings > 0.5) are shown in Bold.
ParameterComponent
PC1PC2PC3
Eigenvalue4.252.221.3
Variance (%)35.5%18.5%10.9%
Particle size−0.093−0.024−0.523
Magnetic susceptibility0.0630.504−0.383
Al−0.122−0.0950.803
Li0.057−0.0700.538
Cr−0.0510.962−0.022
Ni−0.0010.947−0.006
Cu0.797−0.002−0.079
Zn0.8900.036−0.111
As0.774−0.0440.238
Cd0.929−0.015−0.014
Pb0.938−0.0130.010
Hg0.6710.0320.106
Table 3. Comparison of sediment criteria and percent exceedance samples (in parentheses) using freshwater sediment guidance values (class A, B, and C) in all RD samples (N = 165) of this study.
CrNiCuZnAsCdPbHg
<Class A
(% samples)
6
(4%)
16
(10%)
6
(4%)
0
(0%)
43
(26%)
61
(37%)
4
(2%)
117
(71%)
Class B
(% samples)
13
(8%)
24
(15%)
46
(28%)
16
(10%)
93
(56%)
81
(49%)
37
(22%)
32
(19%)
>Class C
(% samples)
146
(88%)
125
(76%)
113
(68%)
149
(90%)
29
(18%)
23
(14%)
124
(75%)
16
(10%)
Class A<43<23<32<120<10<1<36<0.2
Class B43–11023–4932–150120–46010–331–536–1300.2–1
Class C>110>49>150>460>33>5>130>1
Table 4. Comparison of median Igeo values in RD from 9 different industrial areas of Korea.
SH GS DB GY CW NS OS US PH
Cr3.03.00.93.44.75.32.92.25.2
Ni1.70.3−0.81.72.53.62.71.22.6
Cu3.91.81.51.84.03.77.34.03.7
Zn4.03.03.03.74.25.26.93.84.3
As0.60.2−0.20.30.60.64.51.6−3.1
Cd4.33.02.12.74.65.58.85.04.8
Pb3.92.81.31.33.44.06.93.22.5
Hg−0.4−1.8−2.9−0.9−0.80.25.30.71.9
Atmosphere 11 01366 i001
Publisher’s Note: MDPI stays neutral with regard to jurisdictional claims in published maps and institutional affiliations.