Article

Effect of Various Types of ENSO Events on Moisture Conditions in the Humid and Subhumid Tropics

Department of Meteorology and Climatology, Faculty of Geography, Lomonosov Moscow State University, GSP-1, Leninskie Gory, 119991 Moscow, Russia
*
Author to whom correspondence should be addressed.
Atmosphere 2020, 11(12), 1354; https://doi.org/10.3390/atmos11121354
Submission received: 24 October 2020 / Revised: 7 December 2020 / Accepted: 8 December 2020 / Published: 13 December 2020

Abstract

:
Moisture anomaly conditions within humid and subhumid tropics that are associated with different types of El Niño and La Niña phenomena are described and analyzed with a focus on their spatial distribution and seasonal variability. Five dryness indices (Keetch–Byram Drought Index, Weighted Anomaly Standardized Precipitation Index, Standardized Precipitation Index, Palmer Drought Severity Index, and Percent of Normal Precipitation) were derived from ECMWF (European Centre for Medium-Range Weather Forecasts) fifth generation reanalysis (ERA5) reanalysis and University Corporation for Atmospheric Research (UCAR) datasets for the period from 1979 to 2019. Cross-correlation analysis was used to evaluate the relationships between the El Niño Southern Oscillation (ENSO) and selected dryness indices. To describe the seasonal variability of the ENSO–surface moisture relationships, the composite maps of dryness indices in different seasons were analyzed. The results showed a significant heterogeneity of the ENSO-induced moisture anomaly conditions both within and across various geographical regions. Four main areas in humid and subhumid tropics with the maximum effects of El Niño/La Niña events on the surface moisture conditions were found: Southeast Asia and Australia, Eastern and South Africa, Northeastern and Eastern South America, and Central America. It was shown that the effects of La Niña were usually opposite to those of El Niño, while the responses to the two types of El Niño differed mostly in the moisture anomaly intensity and its spatial patterns.

1. Introduction

The El Niño Southern Oscillation (ENSO) is a major phenomenon of climate variability at the interannual timescale that induces dramatic weather anomalies within and outside the tropics [1]. The anomalously large release of heat and moisture from the ocean into the atmosphere leads to a large-scale transformation of atmospheric circulation [2,3] that invokes precipitation and temperature anomalies around the world [4]. Within the tropics, there are two key mechanisms that allow the ENSO to affect atmospheric processes. The first mechanism involves the propagation of the Kelvin and Rossby waves in the tropical troposphere eastward and westward, respectively, which are forced by El Niño (La Niña) warming (cooling) of the troposphere over the tropical central and eastern Pacific region [5,6]. These tropical tropospheric temperature anomalies then affect the temperature and humidity in the atmospheric planetary boundary layer, resulting in anomalies of the sea surface temperature (SST) in the tropical Indian and Atlantic Oceans through changed surface fluxes [7]. The second mechanism is the atmospheric bridge [8,9,10], which is associated with the Walker circulations shift. During El Niño, the eastward displacement of convective activity occurs over the Pacific region, leading to anomalous descending motions over the tropical eastern Indian Ocean that induce oceanic warming via increased solar radiation and latent heat fluxes. The convection displacement also disturbs the Atlantic branch of the Walker Circulation, resulting in anomalous descending motions over the tropical Atlantic.
The impacts of the ENSO on tropical climate anomalies have been extensively studied over the past several decades [1,7]. The main regions within the tropics that are affected by the ENSO include Indonesia, Southeastern Asia and Australia, South America, and equatorial Africa. In Southeastern Asia, El Niño usually leads to very dry conditions, whereas La Niña results in extremely wet conditions with high flood risks, e.g., [11,12]. In tropical Australia, El Niño is also associated with reduced rainfall and higher temperatures, reduced tropical cyclone numbers, and a later monsoon onset. Dry weather very often leads to increased fire danger, especially in southeastern Australia [13]. La Niña events almost result in mirrored anomalies. As shown in the review carried out by Cai et al. [14], El Niño’s impacts on South America are characterized by flooding along the western coast of Ecuador, Peru, and Colombia, and droughts in the Amazonian and northeastern parts of the continent, while the La Niña exhibits the opposite anomalous conditions in these regions. The ENSO’s impact on the African climate is highly differentiated in space and time and has its maximum effect in Southern and Eastern Africa [15,16]. It is noteworthy that the ENSO’s impact is modulated by a variety of factors, including a diversity of ENSO events themselves, as well as other modes of climate variability within and outside the Pacific region, inter-basin climate interactions, and greenhouse warming [14].
The extreme weather conditions associated with El Niño/La Niña events may affect tropical ecosystems (e.g., forests, grasslands, savannas, and shrublands) [17,18] in multiple ways, particularly via increased drought and fire that result from a precipitation deficit [19,20,21]. Tropical forests and savannas cover large areas of the global land surface and have a significant impact on biosphere processes at wide spatial and temporal scales [17,22,23,24]. These ecosystems influence energy and water budgets; regulate surface runoff, groundwater discharge, and evapotranspiration; alleviate flooding; guard against soil erosion [25,26,27,28]. Tropical forests take up atmospheric CO2 during photosynthesis and store the carbon in above- and below-ground biomass and soils, thereby actively affecting the global carbon cycle [29,30,31]. Lack of precipitation can lead to changes in plant ecosystem function and production [32,33,34]. The ENSO induced wildfires can disturb natural ecosystems and cause a loss of biodiversity [35,36,37,38,39].
Noticeably the influence of weather anomalies on terrestrial ecosystems varies depending on the plant species’ adaptation to local conditions [34]. This variation in the responses of tropical vegetation to El Niño, combined with a high diversity of terrestrial ecosystems [40] and the difficulties of data collection in remote areas, together pose a major challenge to better understanding El Niño’s impacts on tropical terrestrial ecosystems.
Prior studies investigating the effects of El Niño and La Niña on the surface moisture conditions of terrestrial ecosystems mainly explored the relationships between the ENSO indices and precipitation variability [37,41,42,43,44,45,46], as well as how these atmospheric phenomena affect forest fires [39,44,47]. Several studies also evaluated surface moisture conditions using dryness or moisture indices [48,49,50,51,52]. Dryness or moisture indices can be a more effective tool to assess the possible effects of ENSO anomalies on terrestrial ecosystems since they account for multiple factors that affect land surface energy and water budgets (e.g., surface temperature, potential and actual evapotranspiration, runoff) [49,53].
The influence of ENSO on precipitation and dryness indices can vary significantly in space and time [39,43,47]. However, the effects of ENSO on moisture conditions in different geographical regions have not been extensively evaluated. In particular, there is still a limited understanding of how La Niña affects the surface moisture patterns and variability within many tropical regions. Another key uncertainty is how surface moisture conditions vary with two types of El Niño: (1) Eastern Pacific (EP), with maximum anomalies of the SST in the eastern equatorial Pacific, and (2) Central Pacific (CP), which is characterized by maximum warming in the central Pacific region [54,55]. So far, only a few studies have evaluated the impacts of so-called ENSO diversity on surface moisture conditions [56]. These studies focused on how the two types of El Niño affect drought conditions in specific regions, such as the Amazon [37] or Indonesia [45].
Given the uncertainty in the interactions between ENSO phenomena and land surface moisture conditions, the main goal of our study was to investigate the spatial distribution and seasonal variation of the ENSO-induced anomalies of surface moisture conditions within humid and subhumid tropics, with a special focus on the different effects that are induced by two types of El Niño and La Niña.

2. Materials and Methods

2.1. Climate Dryness Indices

To derive the possible effects of the ENSO events on the spatial pattern and severity of precipitation anomalies within the world’s humid and subhumid tropics, we used five dryness indices: the Keetch–Byram Drought Index (KBDI), the Weighted Anomaly Standardized Precipitation Index (WASP), the Standardized Precipitation Index (SPI), the Palmer Drought Severity Index (PDSI), and the Percent of Normal Precipitation (PERCENT).
KBDI is specifically designed for wildfire potential assessment [57]. Its value reflects the dryness of the upper soil layer by deriving the amount of precipitation necessary to return the soil to full field capacity [58]. It is calculated as a function of the maximum daily air temperature and annual and daily precipitation rates, and ranges from 0 to 800, with 0 being the point of no moisture deficiency and 800 being the maximum possible drought severity.
WASP shows the precipitation excess or deficit for different periods ranging from 1 to 12 months. It can be very useful for monitoring developing drought in wet tropical regions, taking into account the climate seasonality (wet and dry periods) [59,60].
SPI was suggested by McKee et al. [61] and it is widely used to derive the extent of meteorological drought in different regions and at different timescales. It is calculated from long-term precipitation data and can be interpreted as the number of standard deviations the observed anomaly deviates from the long-term means [62,63].
PDSI is a dryness index that is based on the supply-and-demand concept of the soil water budget, where it incorporates data on recent precipitation, air temperature, soil moisture, and runoff [64]. It is usually applied to estimate the soil moisture availability for plant growth and assess drought conditions. Potential evapotranspiration (PET) is a useful measure for describing plant water demand and can be derived as a function of the air temperature using the Thornthwaite method [65]. Surface runoff, actual evapotranspiration and soil moisture recharge, and loss from the soil surface layer are calculated using precipitation and PET data. PDSI is usually distributed over several categories using a comprehensive classification that depends on the severity of the dry or wet conditions [66,67].
PERCENT is calculated by dividing the actual precipitation by the long-term averaged (climate mean) precipitation rate for the time being considered and is broadly used for identifying the various impacts of droughts on natural ecosystems [68].
The ECMWF (European Centre for Medium-Range Weather Forecasts) fifth generation reanalysis (ERA5) reanalysis data [69] were used to calculate KBDI, WASP, and PERCENT. These indices were estimated for the regular grid with a 0.25 × 0.25° spacing within the latitude band of 30° S–30° N and for the period from 1979 to 2019. While KBDI was calculated using daily data on the air temperature at 2 m and the precipitation amount, WASP and PERCENT were derived from monthly precipitation amount only. Precipitation data from the ERA5 reanalysis was also used for the correlation analysis.
To avoid the uncertainty introduced by a discrepancy between the different reanalyses, in the first step, we compared the results provided by the ERA5 reanalysis and global (land) precipitation and temperature data from the University of Delaware (UDEL, Newark, DE, USA) [70]. Given that both datasets yielded very similar results and the lower spatial resolution of the UDEL climatology (0.5 × 0.5°), we only used the results of the ERA5 reanalysis for our further analysis.
The SPI values at 1 × 1 km grid spacing with 3-, 6-, and 12-month averages for the period from 1950 to 2012 were taken from the research data archive at University Corporation for Atmospheric Research (UCAR) [71]. We only used the SPI data with 3-month averages (SPI-3) because the 3-month period allowed us to better describe the seasonal variability of the ENSO and SPI relationships and the spatial SPI patterns for the 3-, 6-, and 12-month averages were quite similar.
The PDSI was derived using NCAR data [72] at a 2.5 × 2.5° grid spacing for the period from 1950 to 2014.

2.2. ENSO Indices

We used the two ENSO indices introduced by Takahashi et al. [73], which make it possible to separate the two types of El Niño. They are based on the first two leading empirical orthogonal function (EOF) modes of monthly anomalies of the SST that are estimated over the tropical Pacific region (120° E–80° W; 20° S–20° N) and account for the SST variability associated with EP (E index) and CP (C index) El Niño events. They are calculated by the linear combination (through rotation) of the principal components of the first two EOFs, namely, PC1 and PC2. While the E index accounts for the extreme El Niño events of the EP type, the C index represents the variability associated with the CP El Niño (positive values of the C index) and La Niña events (negative values of the C index). These indices are statistically independent (i.e., their correlation is zero) and can be conveniently used for correlation analysis.
The Hadley Centre Global Sea Ice and Sea Surface Temperature (HadISST) archive was used to characterize the monthly SST anomalies [74].

2.3. The Vertical Circulation Cells

The Walker and Hadley circulation cells were analyzed through vertical cross-sections. The cross-sections were plotted following the method suggested by Wang [75]. As horizontal components of the vectors, the divergent components of zonal and meridional winds were used for zonal and meridional cells, respectively. Vertical velocity was taken as a vertical component. To plot the Walker cell, the zonal and vertical components were averaged between 5° S and 5° N. The Hadley cells were plotted for three analyzed regions: the Australian–Indonesian region (the meridional and vertical components were averaged between 90 and 160° E), the South American region (the meridional and vertical components were averaged between 30 and 80° W), and the African region (the meridional and vertical components were averaged between 20° W and 50° E).

2.4. Data Analysis

Pearson correlation analysis was used to evaluate the relationships between the ENSO and dryness indices. The normality of distribution of the ENSO and dryness indices was evaluated using the Shapiro–Wilk and Kolmogorov–Smirnov tests. The Kolmogorov–Smirnov test showed a very good similarity between the observed and normal distributions for all considered ENSO and dryness indices (p < 0.001). The Shapiro–Wilk test showed similar results for all ENSO and most dryness indices used. Insignificant deviations from normal distributions were only detected for WASP for a few small areas in South America and Africa.
Statistical analysis was performed using MATLAB software. The correlation coefficients between the ENSO and dryness indices were calculated using the corrcoef function. A significance level of p < 0.05 was applied for the correlation analysis.
The linear regression of the dryness indices on the ENSO indices was calculated using the fitlm function. Taking into account the very similar spatial distributions of regression coefficients relative to the correlation coefficient patterns, we presented in our analysis in terms of the correlation fields only.
To describe the seasonal variability of the relationships between the ENSO and dryness indices, the composite maps of five dryness indices for four seasons were created (December, January, February (DJF); March, April, May (MAM); June, July, August (JJA); September, October, November (SON)). The composites were derived by taking into account the culmination of the ENSO event in DJF and considering the response to the ENSO during the following three seasons. Thus, the calculations started with December of the first ENSO year (Table 1) and were conducted until November of the following year. The composites were calculated as a mean of all observed cases of the EP and CP El Niños and La Niñas during the study period from 1950 to 2019 (Table 1). In particular, the composite for the EP El Niño in DJF was a mean of the December parameters of 1982, 1986, 1987, 1997, 2015, and 2018 and the January–February parameters of 1983, 1987, 1988, 1998, 2016, and 2019. To select the years of the CP and EP El Niño and La Niña events, we used the method proposed by Yeh et al. [76]. Following Yeh et al., EP El Niño has occurred if the SST anomaly (SSTA) averaged over Niño3 (5° S–5° N; 150°–90° W) was greater than 0.5 °C and the SST anomaly in Niño4 (5° S–5° N, 160° E–150° W) during the three consecutive months in the period from October to March was greater than 0.5 °C. CP El Niño was identified if the SSTA in Niño4 was greater than in the Niño3 region and it exceeded 0.5 °C during the three consecutive months in the period from October to March. La Niña events occurred if the SSTA averaged over Niño3 was smaller than −0.5 °C during the three consecutive months in the period from October to March. For example, the EP El Niño 1982–1983 was identified because during at least three consecutive months from October 1982 to March 1983, the SSTA in Niño3 was greater than −0.5 °C and higher than the SSTA in Niño4. Thus, December 1982, January 1983, and February 1983 were used for the DJF composite, while the other months of 1983 were used for the MAM, JJA, and SON composites, respectively. The method used for identifying ENSO based on Niño3 and Niño4 is well agreed upon, with the method being based on E and C indices when the standard deviation (std) of the E and C time series equal to 0.5 is taken as a threshold. The exception is EP El Niño 2018–2019, where the C index was greater than 0.5 stds.
Positive and negative values of dryness indices correspond to wet and dry conditions, respectively, except for the KBDI index, which has an opposite scale that reflects surface moisture conditions. To simplify the interpretation of the results in our study, the KBDI time series were multiplied by −1.

3. Results

3.1. Response of the Dryness Indices to the El Niño/La Niña Spatial Distributions

Analysis of the spatial patterns of correlation coefficients between the ENSO indices and five selected dryness indices (KBDI, WASP, PDSI, SPI, and PERCENT) showed significant heterogeneity both within and across geographical regions (Figure 1, Figure 2 and Figure 3). Four main areas in the humid and subhumid tropics with the maximum effects of El Niño/La Niña events on the surface moisture conditions were found: Southeast Asia and Australia, Eastern and South Africa, Northeastern and Eastern South America, and Central America.
The variability of the moisture conditions was mostly associated with the amount of precipitation. Within the tropical belt, abundant precipitation usually results from deep convection that is associated with intensive air rising in the ascending branches of thermally driven vertical cells (Walker and Hadley). Precipitation deficit is mostly due to large-scale downward air movement that develops in descending branches of Walker and Hadley cells [75]. Thus, to interpret how ENSO cycles affect surface moisture conditions, the spatial pattern and temporal variability of tropical vertical circulation cells were examined.

3.1.1. Southeast Asia and Australia

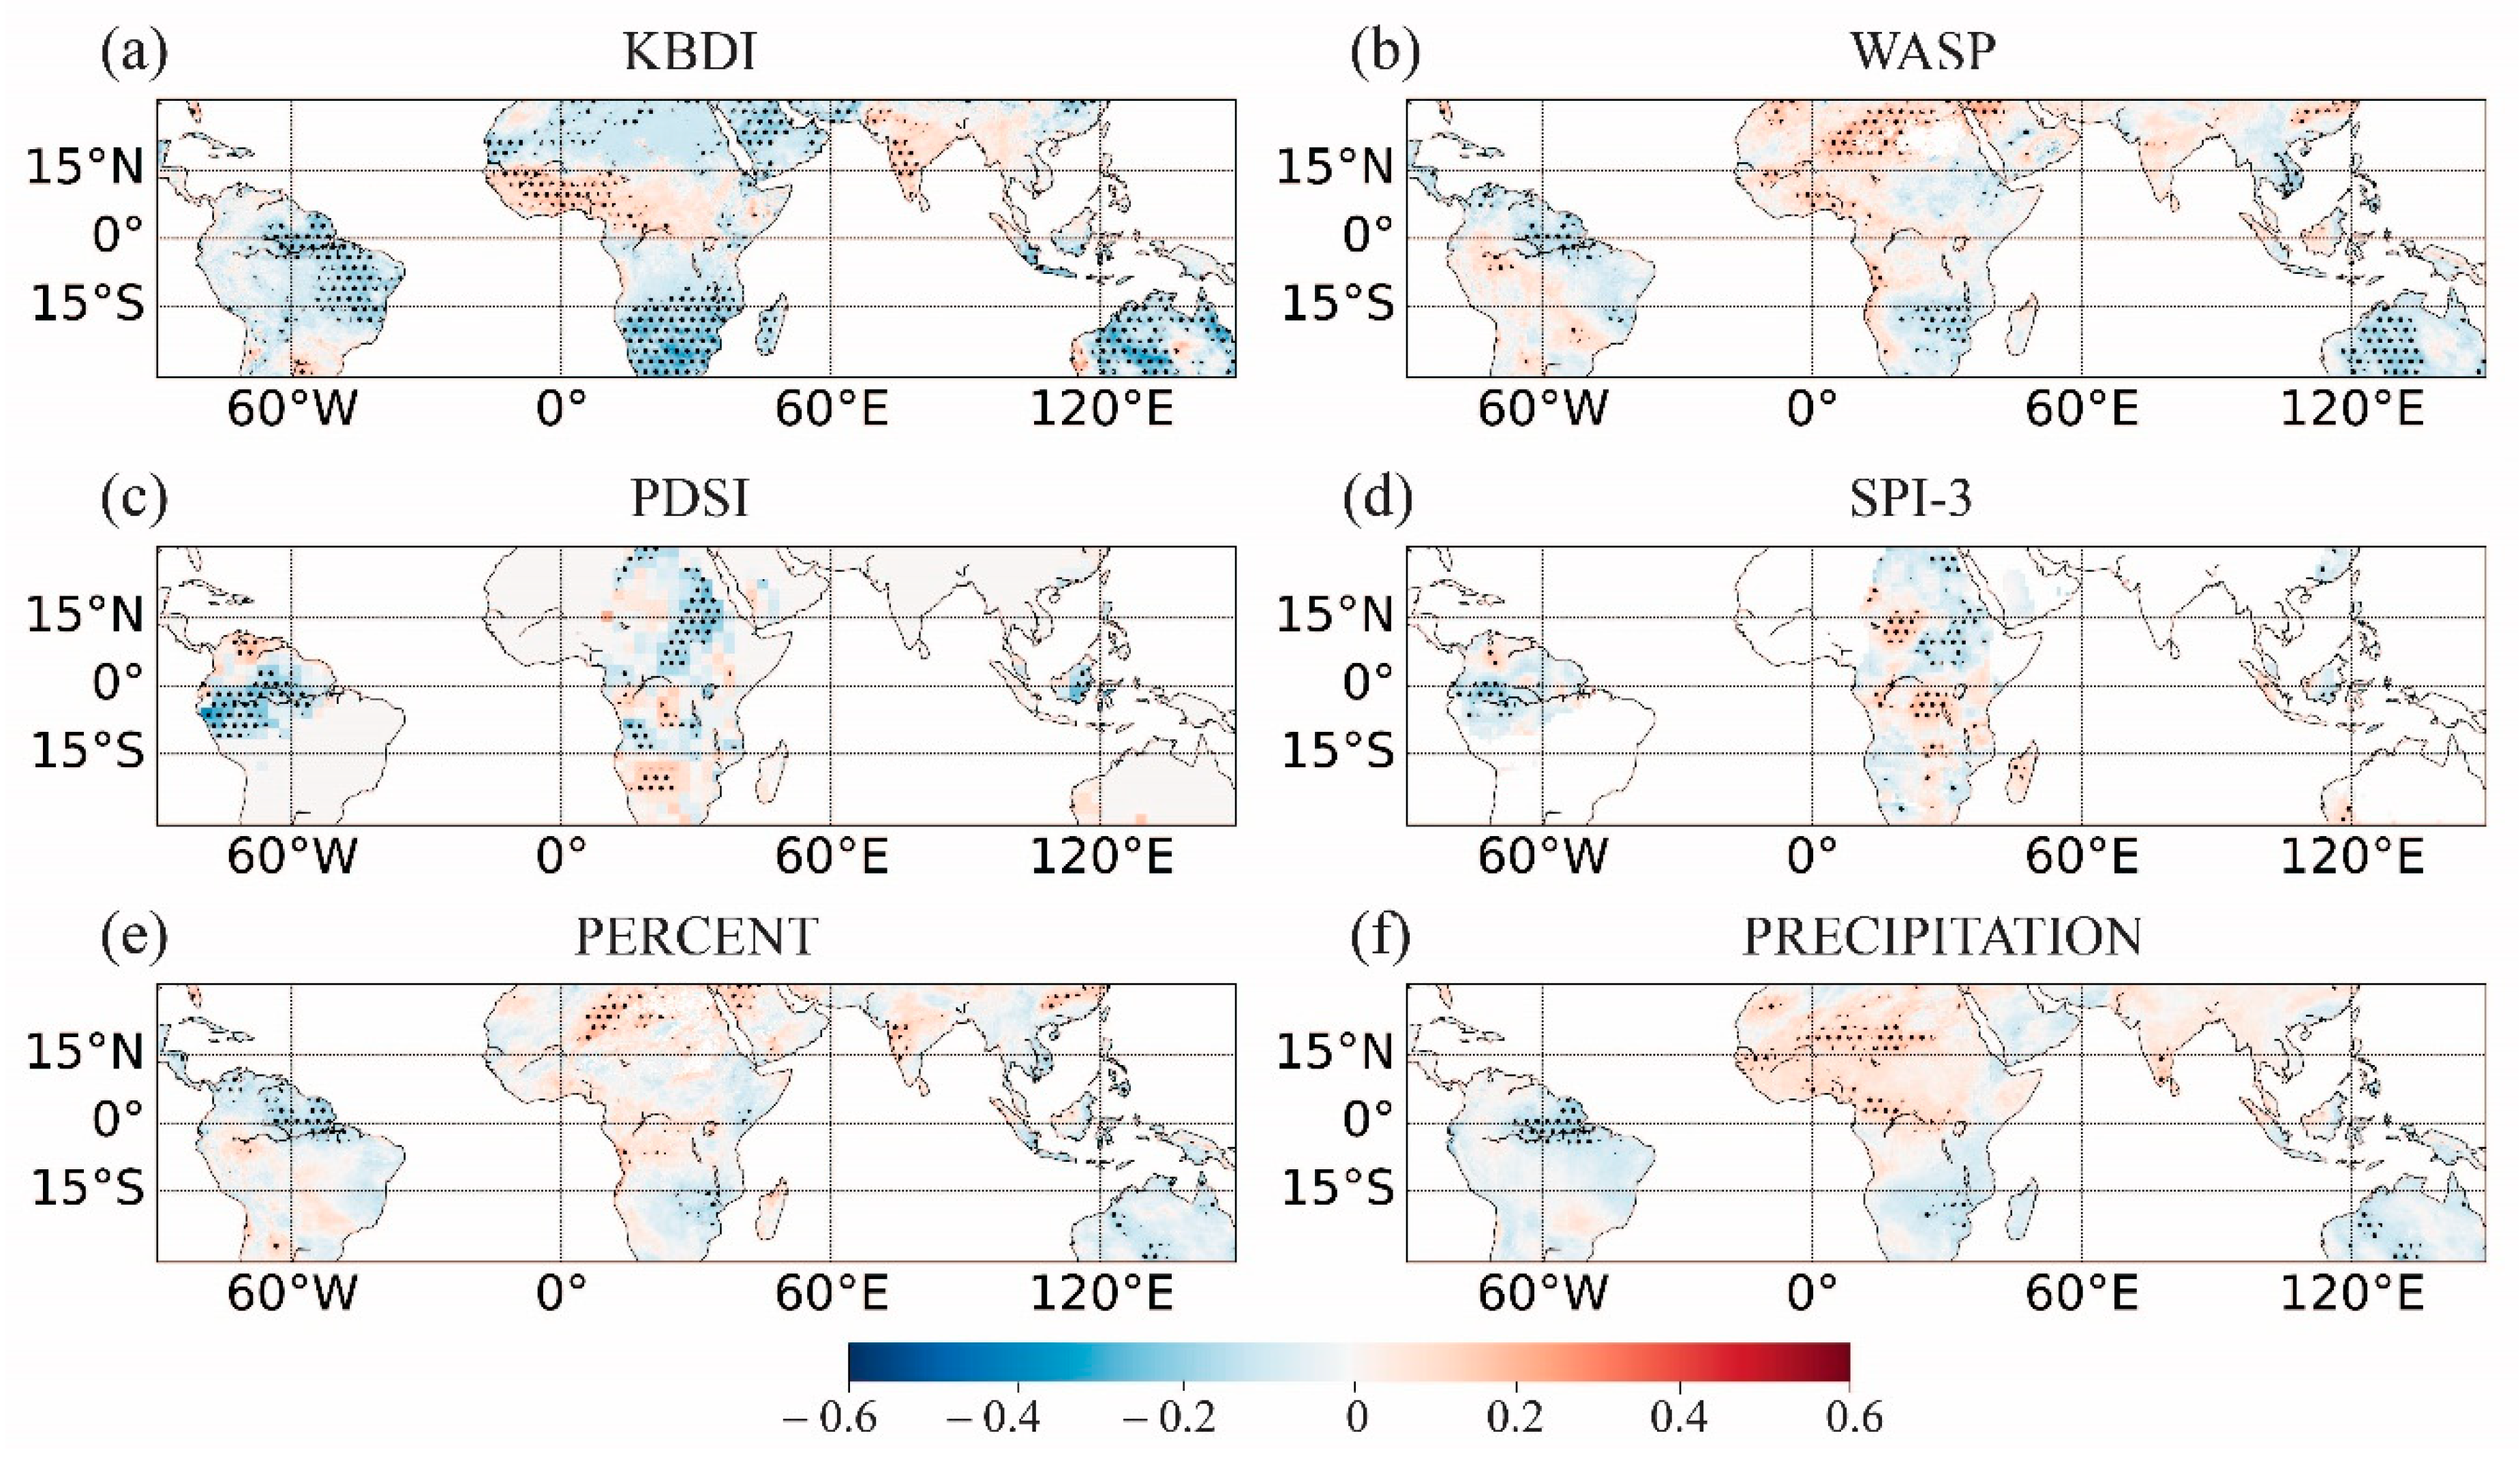
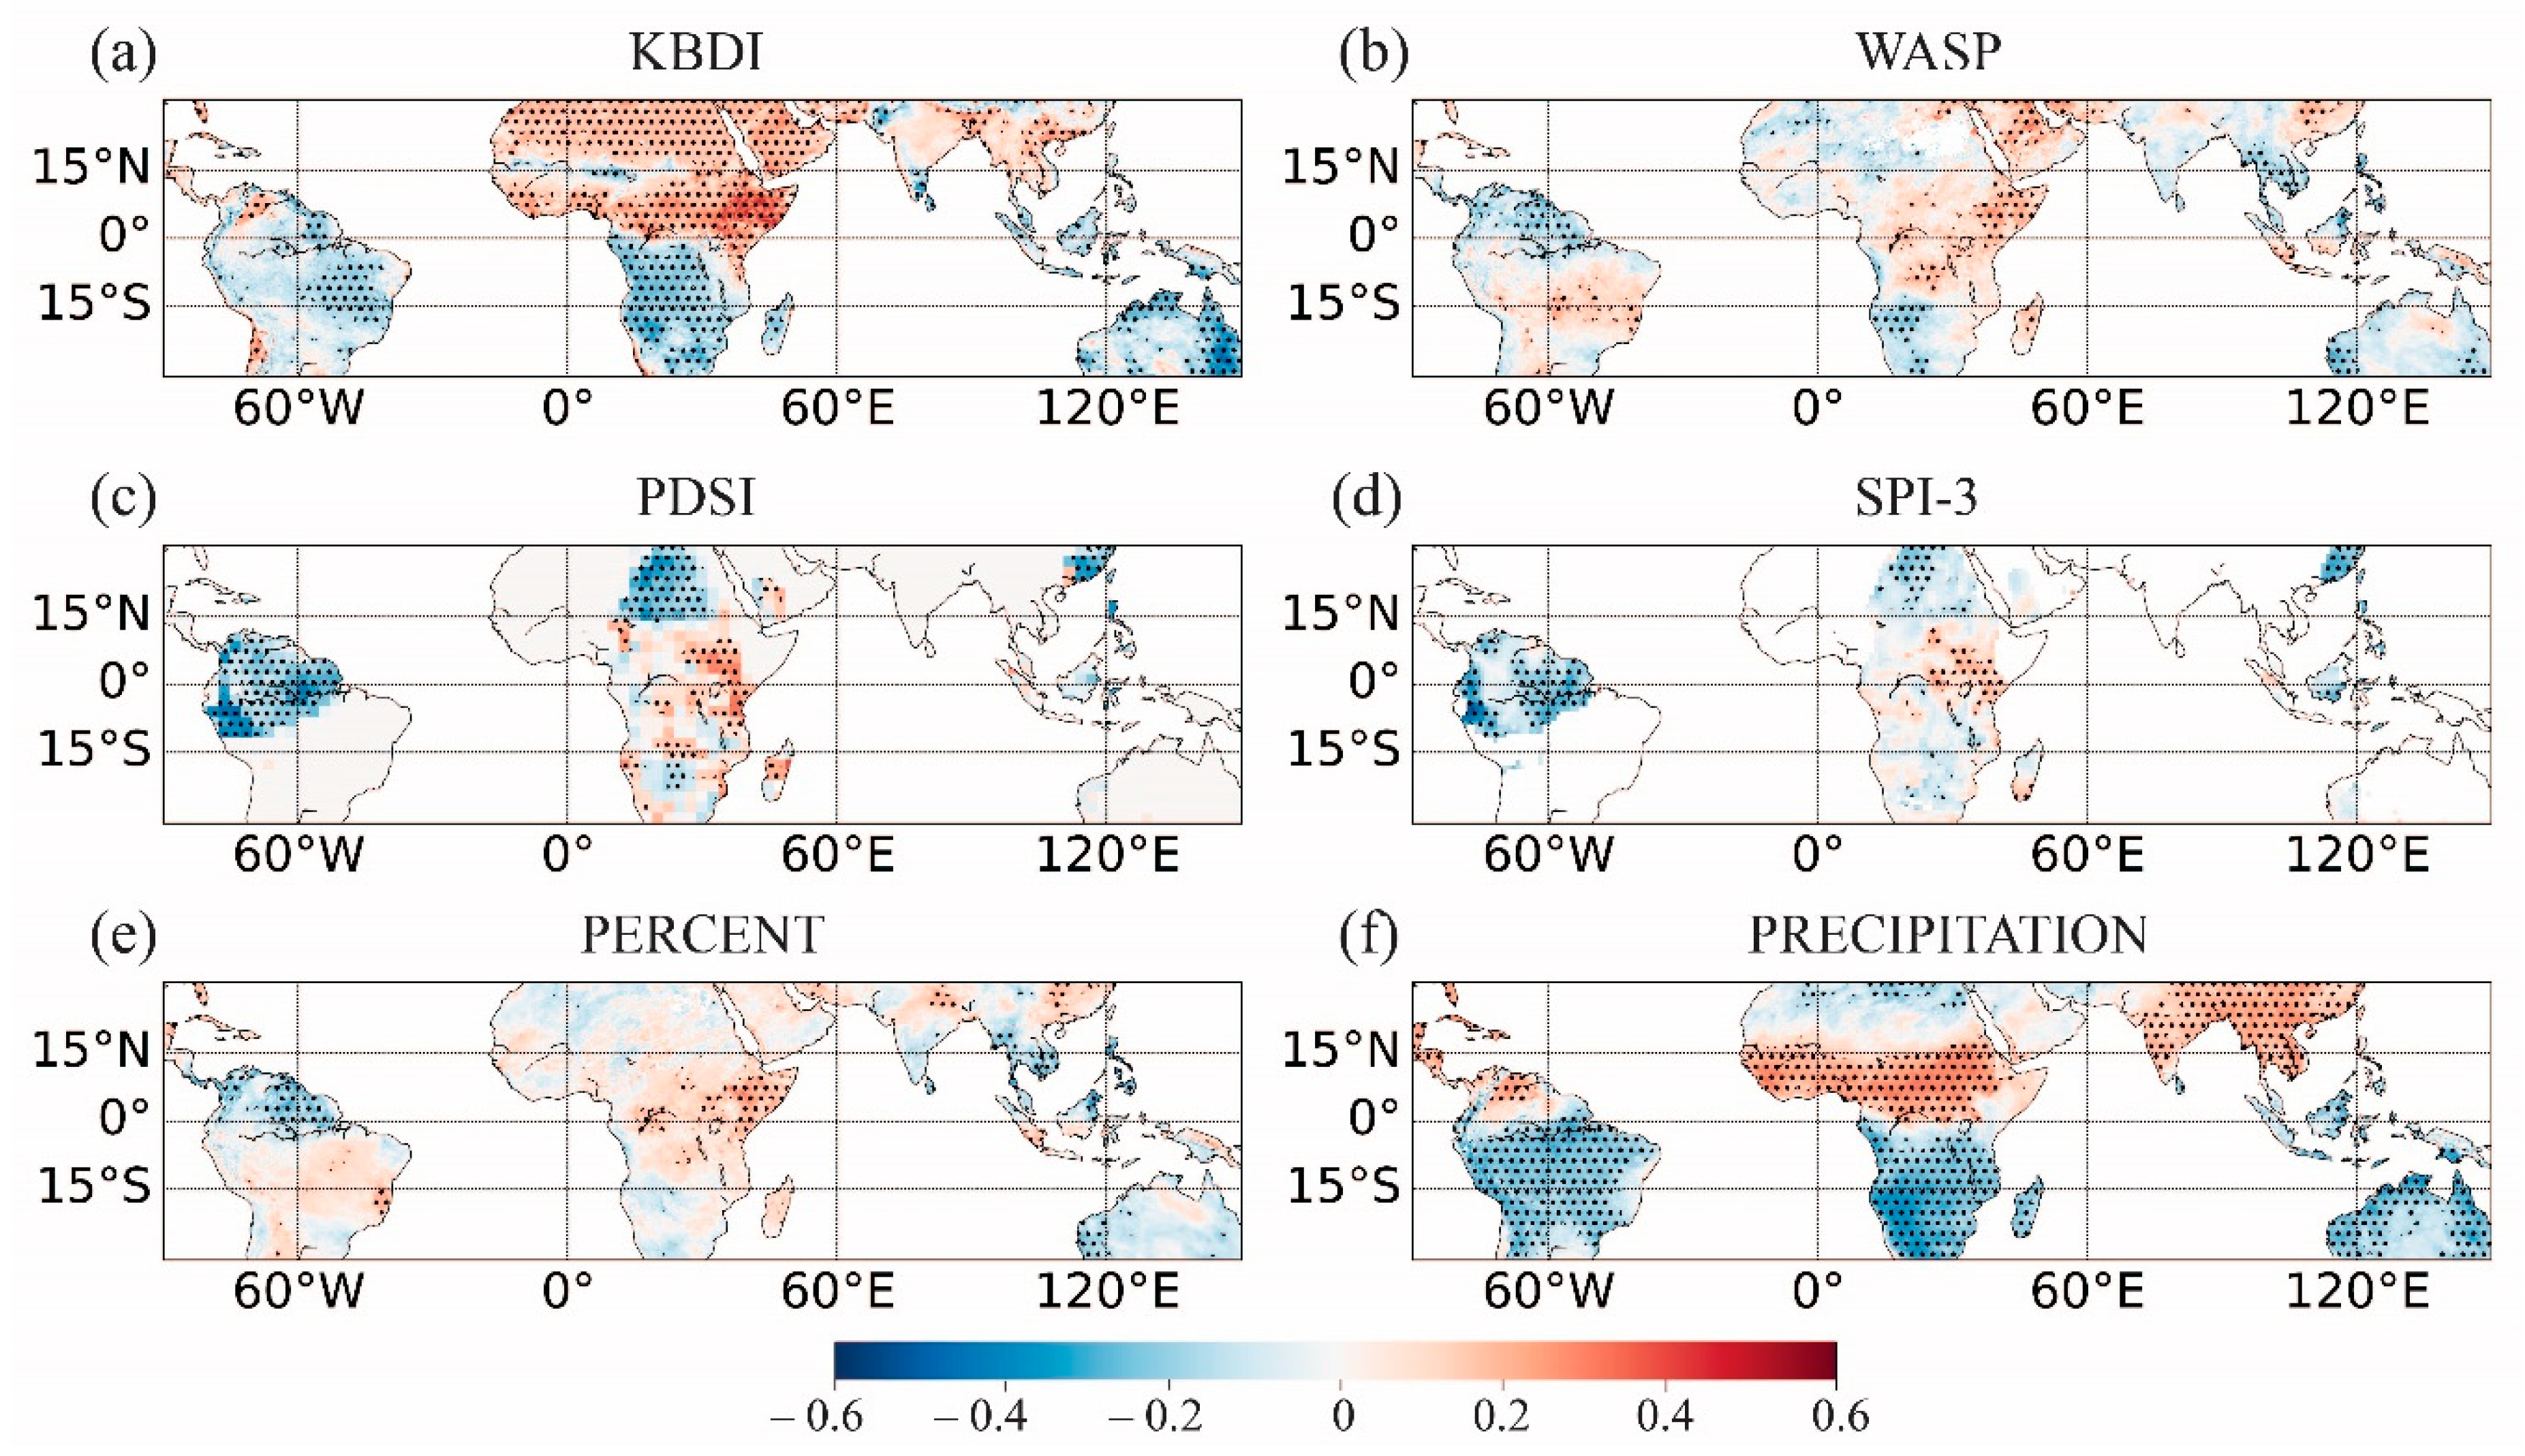
The strongest effect of the ENSO was observed over Indonesia and Northern Australia and was evident in the high negative correlation between the ENSO and dryness indices within the entire region (Figure 1, Figure 2 and Figure 3). This effect manifested as increased surface dryness (negative indices) due to a precipitation deficiency during El Niño (positive E and C indices) and the opposite effect (abundant precipitation) during La Niña. It is noteworthy that the anomalously dry (wet) conditions associated with El Niño (La Niña) were indicated for the area by all the applied dryness indices. The highest correlations (R = 0.53, p < 0.05) were revealed for SPI-3 (SPI with 3-month averages) and PDSI (Figure 1c,d, Figure 2c,d and Figure 3c,d), while the largest areas of statistically significant correlations were found for KBDI, PERCENT, and WASP (Figure 1a,b,e, Figure 2a,b,e and Figure 3a,b,e).
The anomalously wet and dry conditions associated with the EP and CP El Niño events differed in both amplitude and location. For KBDI, WASP, and to some extent, for PERCENT during CP El Niño, the area of negative correlation shifted to the south from Indonesia toward Australia compared to EP El Niño (Figure 1a,b,e and Figure 2a,b,e). This implied more drought risks for Australia during CP El Niños. However, the CP-ENSO-affected areas were rather different for various indices. In the case of KBDI, the driest conditions were observed in northwestern Australia, in the central and northeastern part for WASP, and in the eastern part for SPI-3. The negative correlations between the El Niño and SPI-3 indices were also observed in eastern Australia during EP events. Overall, the correlations between the ENSO and dryness indices were lower for CP El Niño than for EP El Niño.
Under La Niña, Indonesia and Australia exhibited moisture conditions that were opposite to El Niño (Figure 3): the negative ENSO index (La Niña) was associated with positive values of dryness indices (excess precipitation) that resulted in negative correlations in this area. For KBDI, WASP, and PERCENT, the maximum correlations were observed over Indonesia (Figure 3a,b,e), while for PDSI and SPI-3, the strongest correlations occurred over Australia (Figure 3c,d). Overall, the surface moisture conditions were more strongly correlated with La Niña than El Niño events.
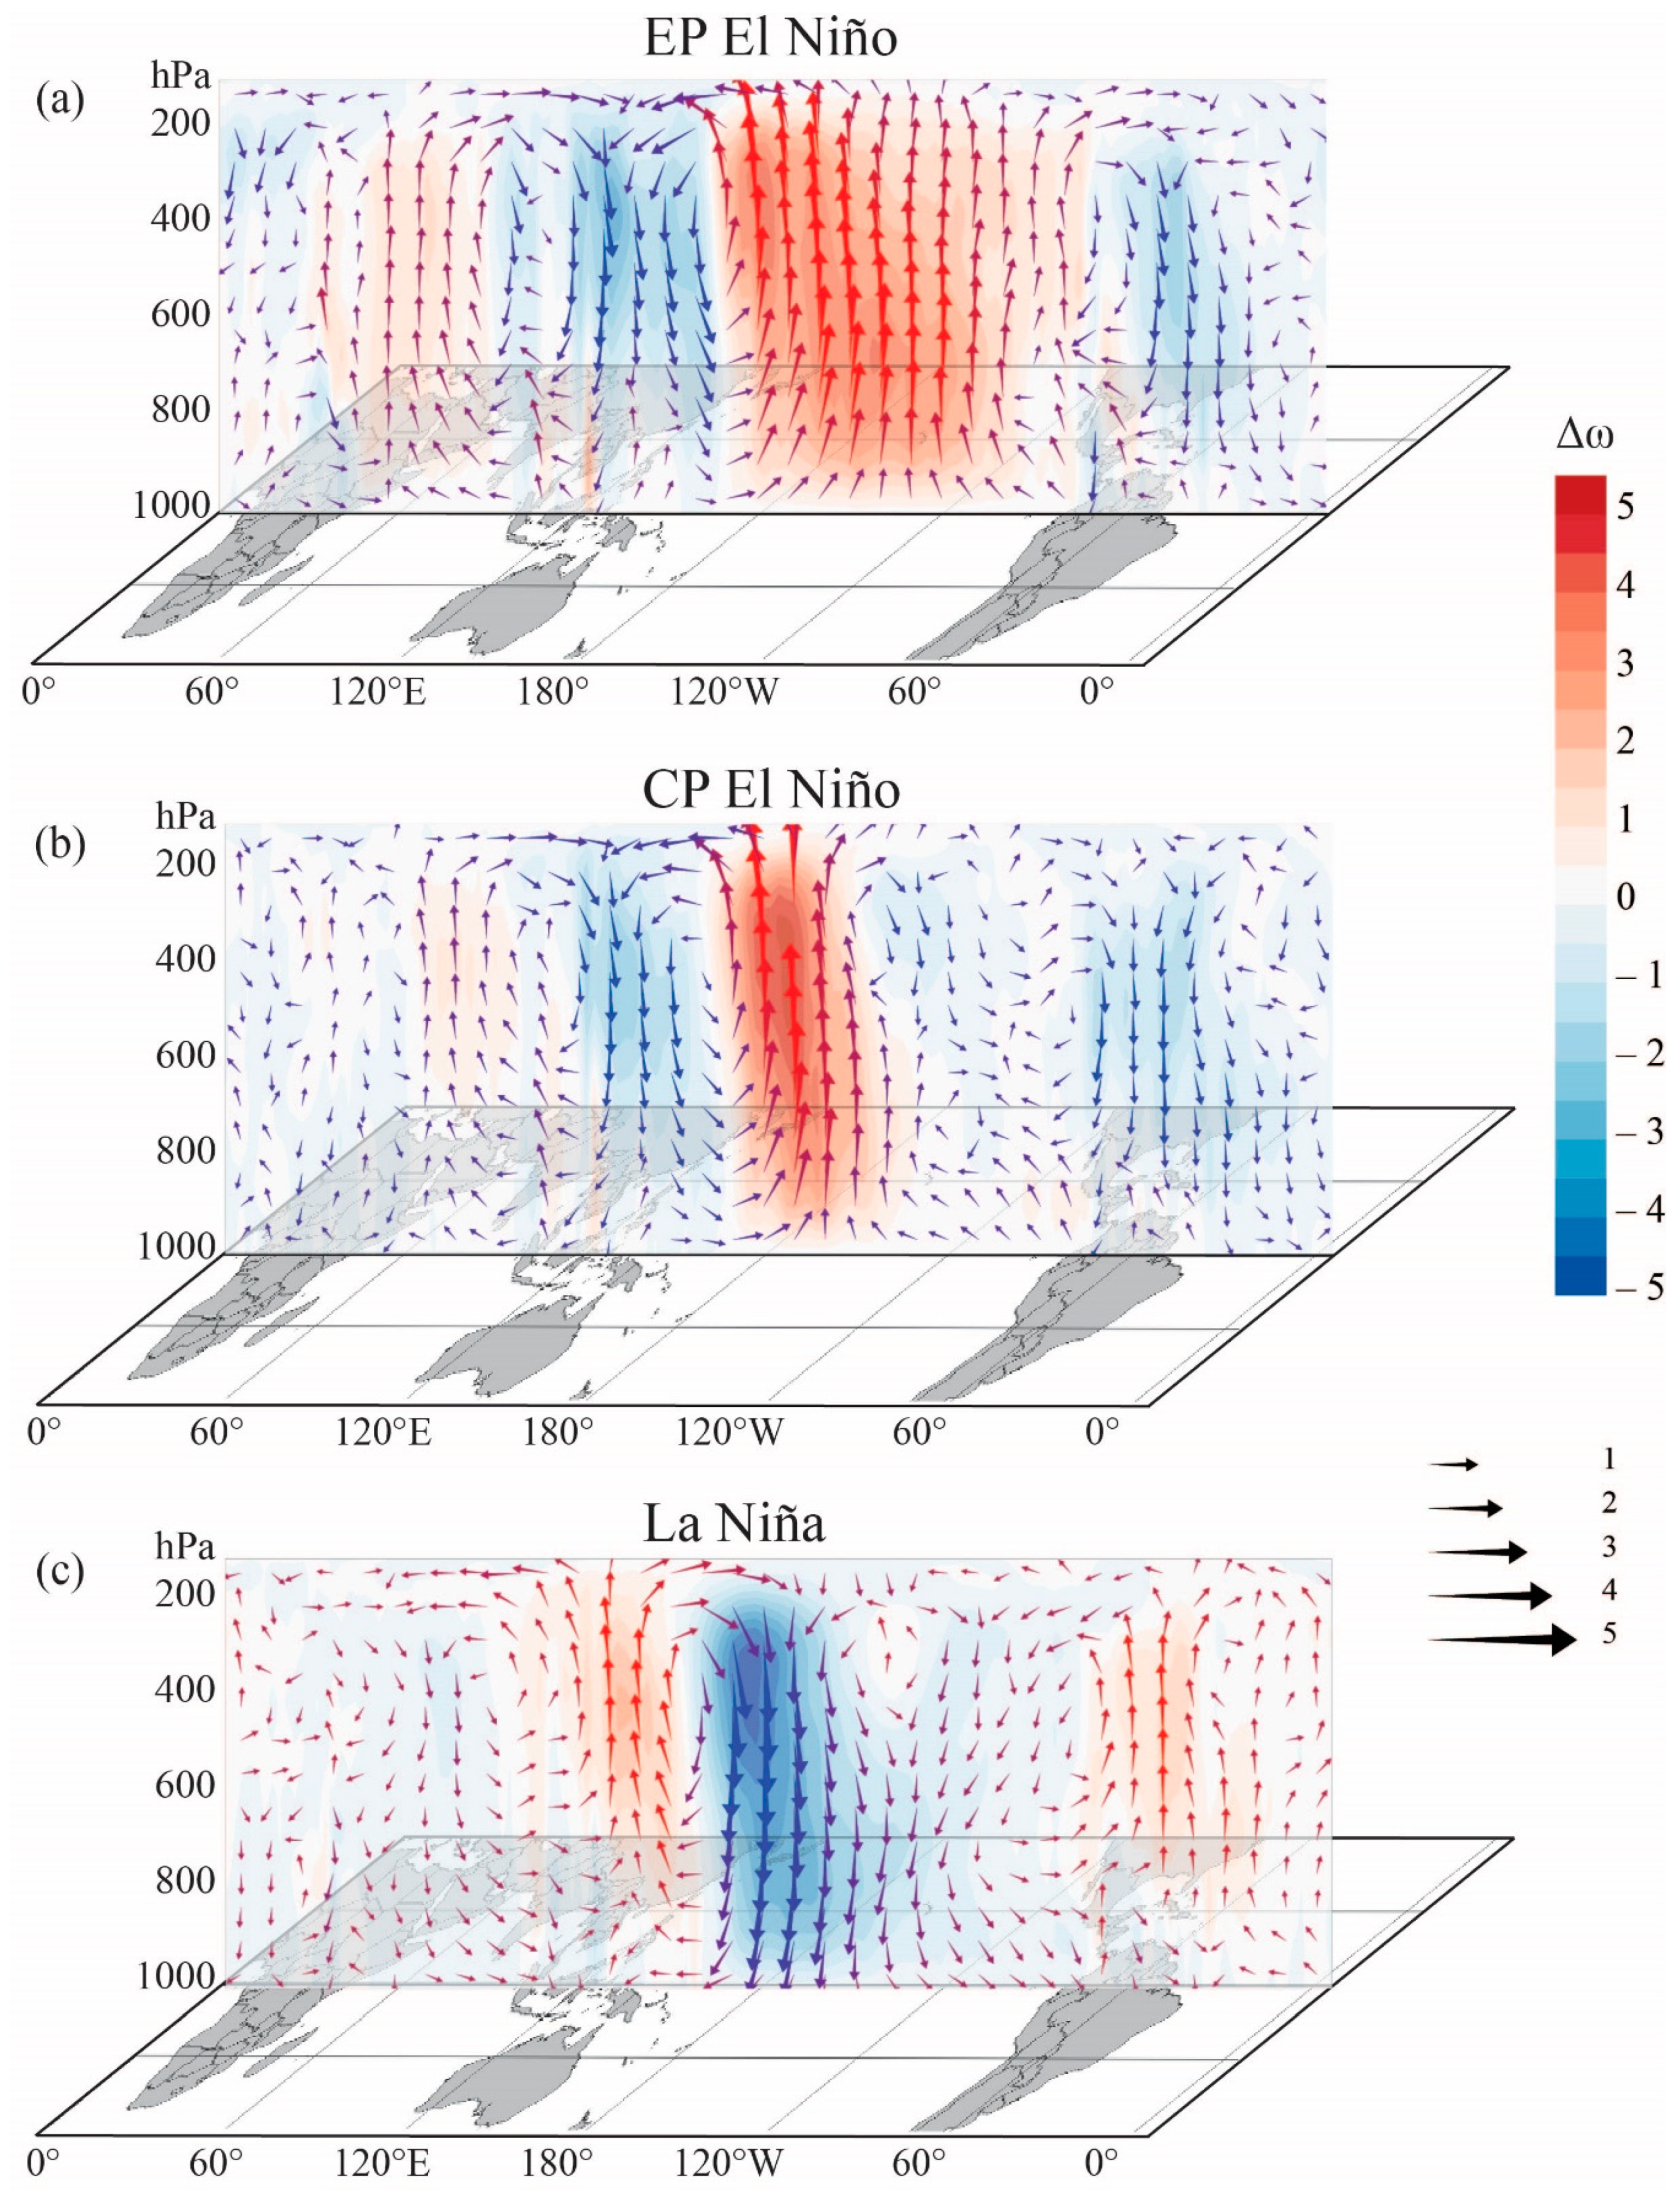
The area with anomalously dry conditions observed over Indonesian and Australian regions was associated with both types of El Niño, whereas excessive moistening was mainly associated with La Niña periods. Very dry conditions during El Niño result from an eastward shift of the convective zone and an ascending branch of a Walker cell from the western to eastern Pacific that follows the displacement of the Western Pacific Warm Pool (see [4] for a review, Figure 4a,b, and Supplementary Materials Figures S1–S3). The latter explains the smaller correlations over the continents compared with the ocean (the correlation over the ocean is not shown on the figures as dryness indices are mostly designed for characterizing moisture conditions over the continents): convection over the continents is reduced to a lesser extent during El Niño due to the continued active transpiration of tropical vegetation in the areas where sufficient soil moisture conditions remained [12,77]. The weaker response to the CP El Niño may have resulted from a smaller eastward shift of the convective zone over the equatorial Pacific during CP events compared to EP El Niño (Figure 4a,b). The maximum convection during CP events was situated over the central Pacific, while over Southeast Asia and Australia, the deep convection still also occurred [54,78,79]. The descending motions that developed between 110–160° E during CP events were almost 50% less intensive than during EP El Niño (Figure 4a,b).
The response of the moisture conditions to the ENSO signal in the Indonesian–Australian region that was evidenced by dryness index anomalies agrees well with previous studies that reported strong droughts and wildfires in Indonesia and Australia during El Niño events and floods in the region associated with La Niña [1,80,81]. As was already mentioned, most studies that assessed regional ENSO effects on surface moisture conditions remain focused on the precipitation anomalies. Meanwhile, our results suggest that the responses in dryness indices are not always identical to the ENSO-induced precipitation anomalies (Figure 1f, Figure 2f and Figure 3f). Namely, the negative correlation over Indonesia was larger for dryness indices than for precipitation during the EP El Niño (Figure 1 and Supplementary Materials Figure S4) that invoked higher drought risks for this region than those that may arise from precipitation shortages. Another region of strong difference between the dryness indices and the precipitation response was southwestern Australia, which exhibited a strong precipitation deficit during El Niño but a less pronounced response in the dryness indices (Figure S4). La Niña demonstrates the opposite difference: the correlation of precipitation rates (above normal in the Indonesian–Australian region) with the La Niña index was higher than for the dryness indices (Figure 3 and Figure S6). Differences in the correlations were likely caused by additional factors that affect regional surface moisture conditions in the dryness indices (e.g., evapotranspiration, runoff).
It is important to note that over South and East Asia, the strong positive correlation of the ENSO index with precipitation was observed during La Niña (Figure 3f), pointing to the heavy rainfalls in the region, but this signal was completely absent in the dryness indices (Figure 3a–e).

3.1.2. Africa

The surface moisture response to ENSO events within the African continent showed more spatial incoherency than in Southeast Asia, as evidenced by the wide range of correlation coefficients between ENSO events and the dryness indices. Eastern Africa was characterized by positive correlations between climate dryness and the ENSO indices: the positive dryness indices (above normal precipitation) corresponded with the warm ENSO phase (Figure 1 and Figure 2) and the negative indices (dry conditions) were associated with the cold ENSO phase (Figure 3). KBDI, WASP, PDSI, and SPI-3 exhibited significant negative correlations with La Niña in South Africa, which pointed to increased precipitation during this period (Figure 3a–d). KBDI was also positively correlated with the La Niña intensity in northern and central Africa (Figure 3a). The PDSI index was negatively correlated with the E index in Sahel and Central Africa (Figure 1d) and KBDI was negatively correlated with this index in Sahel and on the Guinea gulf coast (Figure 1a). The response of the dryness indices to the CP El Niño was negligible across the African tropical region, except for KBDI and PDSI (Figure 2a,c). They were negatively correlated with the CP El Niño over South Africa and Madagascar, while the correlation between the CP El Niño index and KBDI was higher than between the CP El Niño index and PDSI.
Precipitation anomalies over eastern Africa were due to a large-scale shift of the Walker circulation over the equator, which is associated with the ENSO cycle. The zone of ascending motions and convection during the EP El Niño and weak descending motions during CP events were situated near 40° E, while during La Niña and normal conditions, the descending air motions dominated over the entire region (Figure 4). The negative correlations between WASP and PDSI and the ENSO indices in South Africa during the CP El Niño could have been due to descending atmospheric motions that prevailed between 10–30° S (Figure 5e). Noticeably, the intensity of the vertical motion was greater during EP El Niño, while significant negative correlations were only observed during CP events, indicating that factors besides atmospheric vertical motions, such as soil moisture, solar radiation, and air temperature, may have influenced the surface dryness conditions. The above-normal precipitation in South Africa associated with La Niña was due to the ascending motions observed to the south of 20° S (Figure 5f).
Over the African continent, the precipitation response to the ENSO was rather different from the response of the dryness indices. Overall, the correlation of the ENSO/precipitation was lower during El Niño and stronger under La Niña conditions, similar to the Indonesian region. Note, the spatial patterns of correlation differences between the ENSO/precipitation and the ENSO/dryness indices (Figures S4–S6) were rather different over the entire continent due to the various locations of correlation maxima for the precipitation and dryness indices. This may have resulted from a heterogeneous surface topography and a large diversity of vegetation and soils in Africa.

3.1.3. South America

The spatial pattern of correlations between the EP El Niño index and all dryness indices had a dipole structure in South America (Figure 1). The negative values of the dryness indices (dry conditions) were associated with positive values of the E index corresponding to EP El Niño in the northeastern part of the continent (negative correlation area). The positive dryness indices (wet conditions) were observed during the EP El Niño in the eastern part of South America, spreading to the south from 20° S (positive correlation). On the western coast of South America, wet conditions prevailed during the EP El Niño events, as evidenced by the positive correlation of the E index with all dryness indices in this region, except PDSI.
The response of the moisture conditions in the region to La Niña events was the opposite of EP El Niño for WASP, SPI-3, and PERCENT (Figure 3a,d,e). For KBDI and PDSI, the dipole structure was not observed (Figure 3a,c) and negative correlations dominated over the region corresponding to wet conditions (positive dryness indices).
Analysis of possible effects of CP El Niño on the moisture conditions for different areas across South America showed very low correlations between the ENSO and dryness indices, except KBDI and PDSI (Figure 2). The latter exhibited the same relationships that were detected for the area during the episodes of EP El Niño (Figure 2c). KBDI was negatively correlated with a positive C index for all areas over the eastern part of South America (Figure 2a); thus, CP El Niño was associated with a negative KBDI (higher drought risk).
The western coast of equatorial South America is also exposed to heavy precipitation and positive anomalies of dryness indices, which result from intensive deep convection that develops over the anomalously warm ocean surface during El Niño [4].
Climate conditions over the South American continent are affected by the ENSO via so-called atmospheric bridges that consist of longitudinal shifts in thermally driven vertical circulation cells and the associated convection and precipitation zones [7]. While descending motions were localized over the northeastern part of South America during El Niño (Figure 4a,b and Figure 5a,b), La Niña exhibited enhanced convection processes within the entire area (Figure 4c and Figure 5c). This resulted in precipitation and soil moisture changes, as well as in temperature anomalies, due to variable cloudiness, yielding the dryness index deviations. To the south of Amazonia, the opposite ENSO effect, i.e., wet conditions, created a dipole distribution pattern of dryness indices. Abundant precipitation in the eastern part of South America during El Niño was associated with ascending motions located between 20–30° S (Figure 5a,b). The negative dryness indices in the northeastern part of South America under El Niño conditions were consistent with the findings of [82,83,84], which reported periodic droughts in Amazonia during El Niño events. These droughts are thought to result from the suppression of convection and reduced rainfall in northern, eastern, and western Amazonia. However, the large diversity of the response of the Amazonian climate to the ENSO mentioned in the previous studies [85] was not manifested in the dryness indices, which only exhibited negative anomalies. These differences indicated that additional studies are needed that focus on the Amazonian region.
The comparison of the ENSO’s impact on precipitation and dryness indices over South America showed that during El Niño, the dryness indices over the northeastern part of the continent were more correlated with ENSO indices than was precipitation. The higher risk of droughts and fire in Amazonian forests projected by the dryness indices compared with the effect of precipitation deficiency may have been due to the contribution of evapotranspiration in the surface water budget. The most drastic difference was observed during La Niña: the correlations with precipitation were almost opposite to the correlations with the dryness indices (Figure 3). While the correlation with the indices indicated the wet conditions in the north (negative correlation) and dry or neutral conditions over the rest of the continent, the correlation with the precipitation pointed to the abundant precipitation over most of the continent and low precipitation over northern South America and Central America.

3.1.4. Central America

All the dryness indices in Central America were negatively correlated with the ENSO indices, i.e., anomalous dryness (negative indices) was observed during El Niño (positive indices) and abnormal precipitation (positive indices) during La Niña (negative indices). This resulted from strong atmospheric descending (ascending) motions that developed between the equator and 20° S under El Niño (La Niña) conditions (Figure 5a–c).
The results showed statistically significant (p < 0.05) correlations between EP El Niño and KBDI, WASP, and PERCENT (Figure 1a,b,e), and between La Niña and WASP and PERCENT (Figure 3a,e). For CP El Niño events, no statistically significant correlations were found. KBDI exhibited similar anomalies during El Niño and La Niña events (Figure 1a and Figure 3a). It was positively correlated with La Niña and negatively with El Niño events; therefore, a negative KBDI (dry condition) was associated with both positive (El Niño) and negative (La Niña) ENSO phases in Central America.

3.2. Response of the Dryness Indices to the El Niño/La Niña Seasonal Variability

3.2.1. El Niño Responses

The seasonality of the ENSO effect on moisture conditions in the tropics was evidenced using composites of selected dryness indices for each of the four seasons (the season after the El Niño/La Niña peak was considered). The maximum values of all the indices were observed in DJF when El Niño and La Niña tended to peak. Overall, their spatial distribution in DJF was similar to the correlation distribution considered in previous sections.
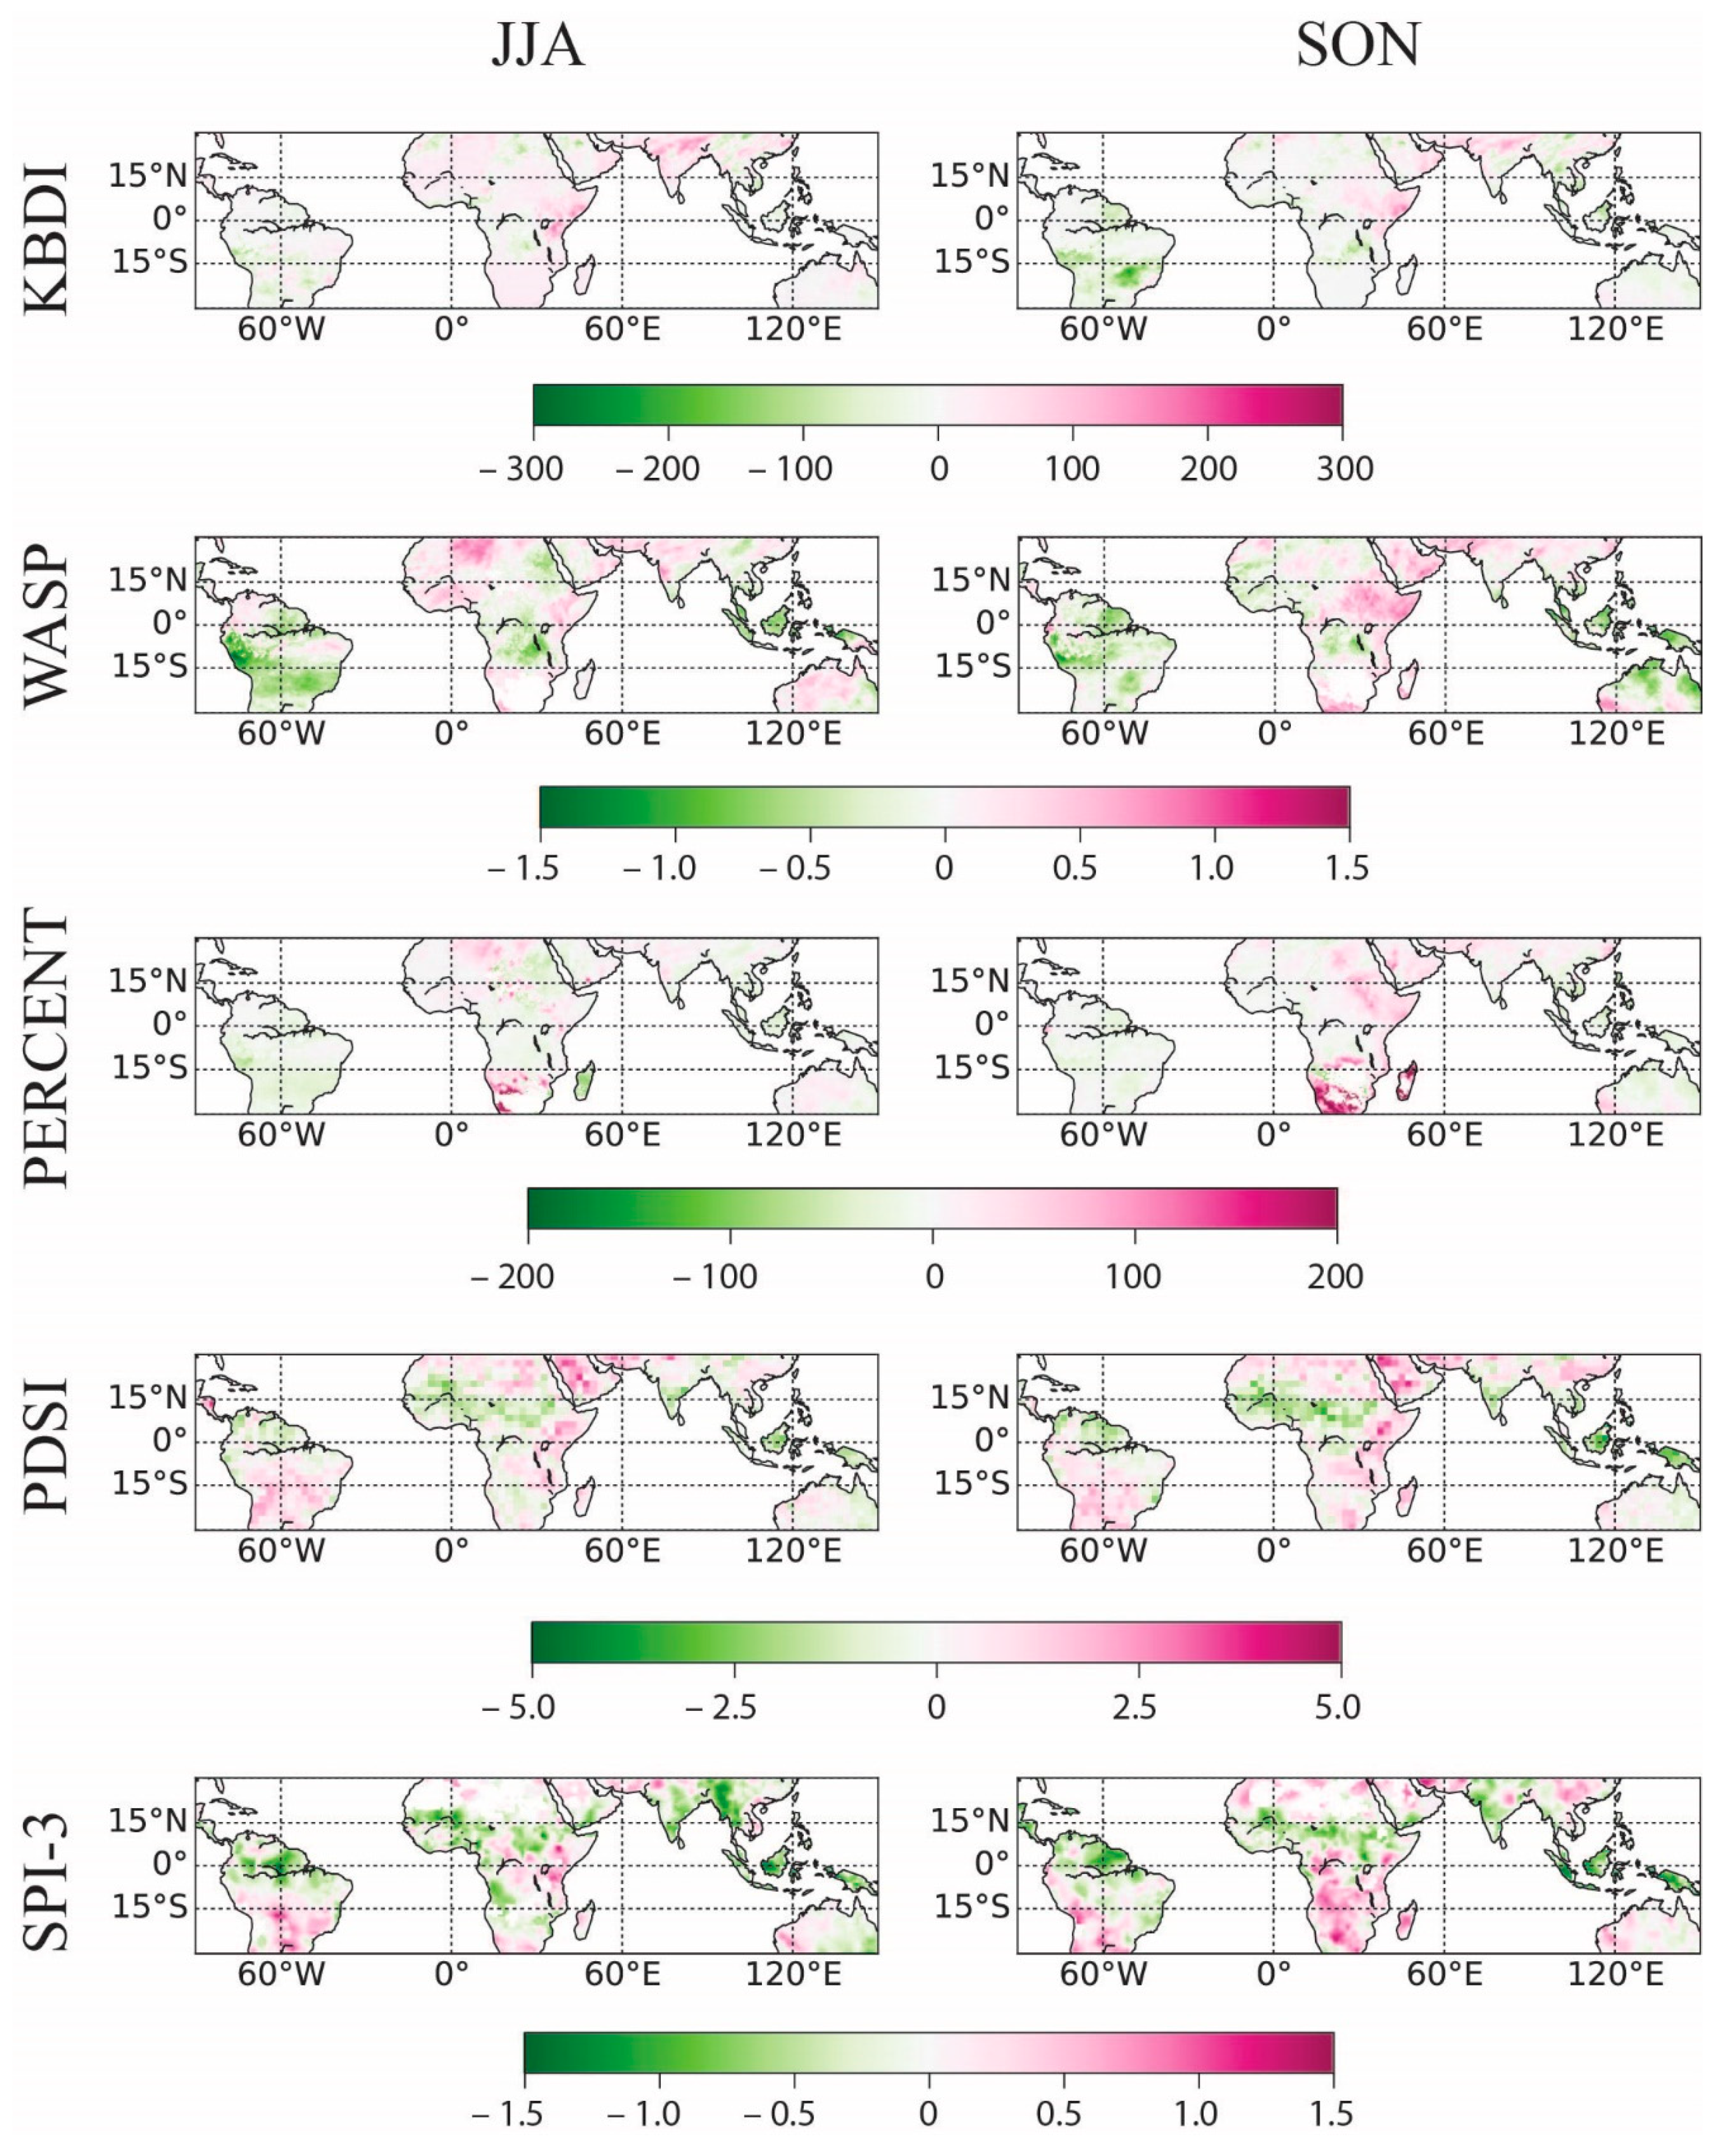
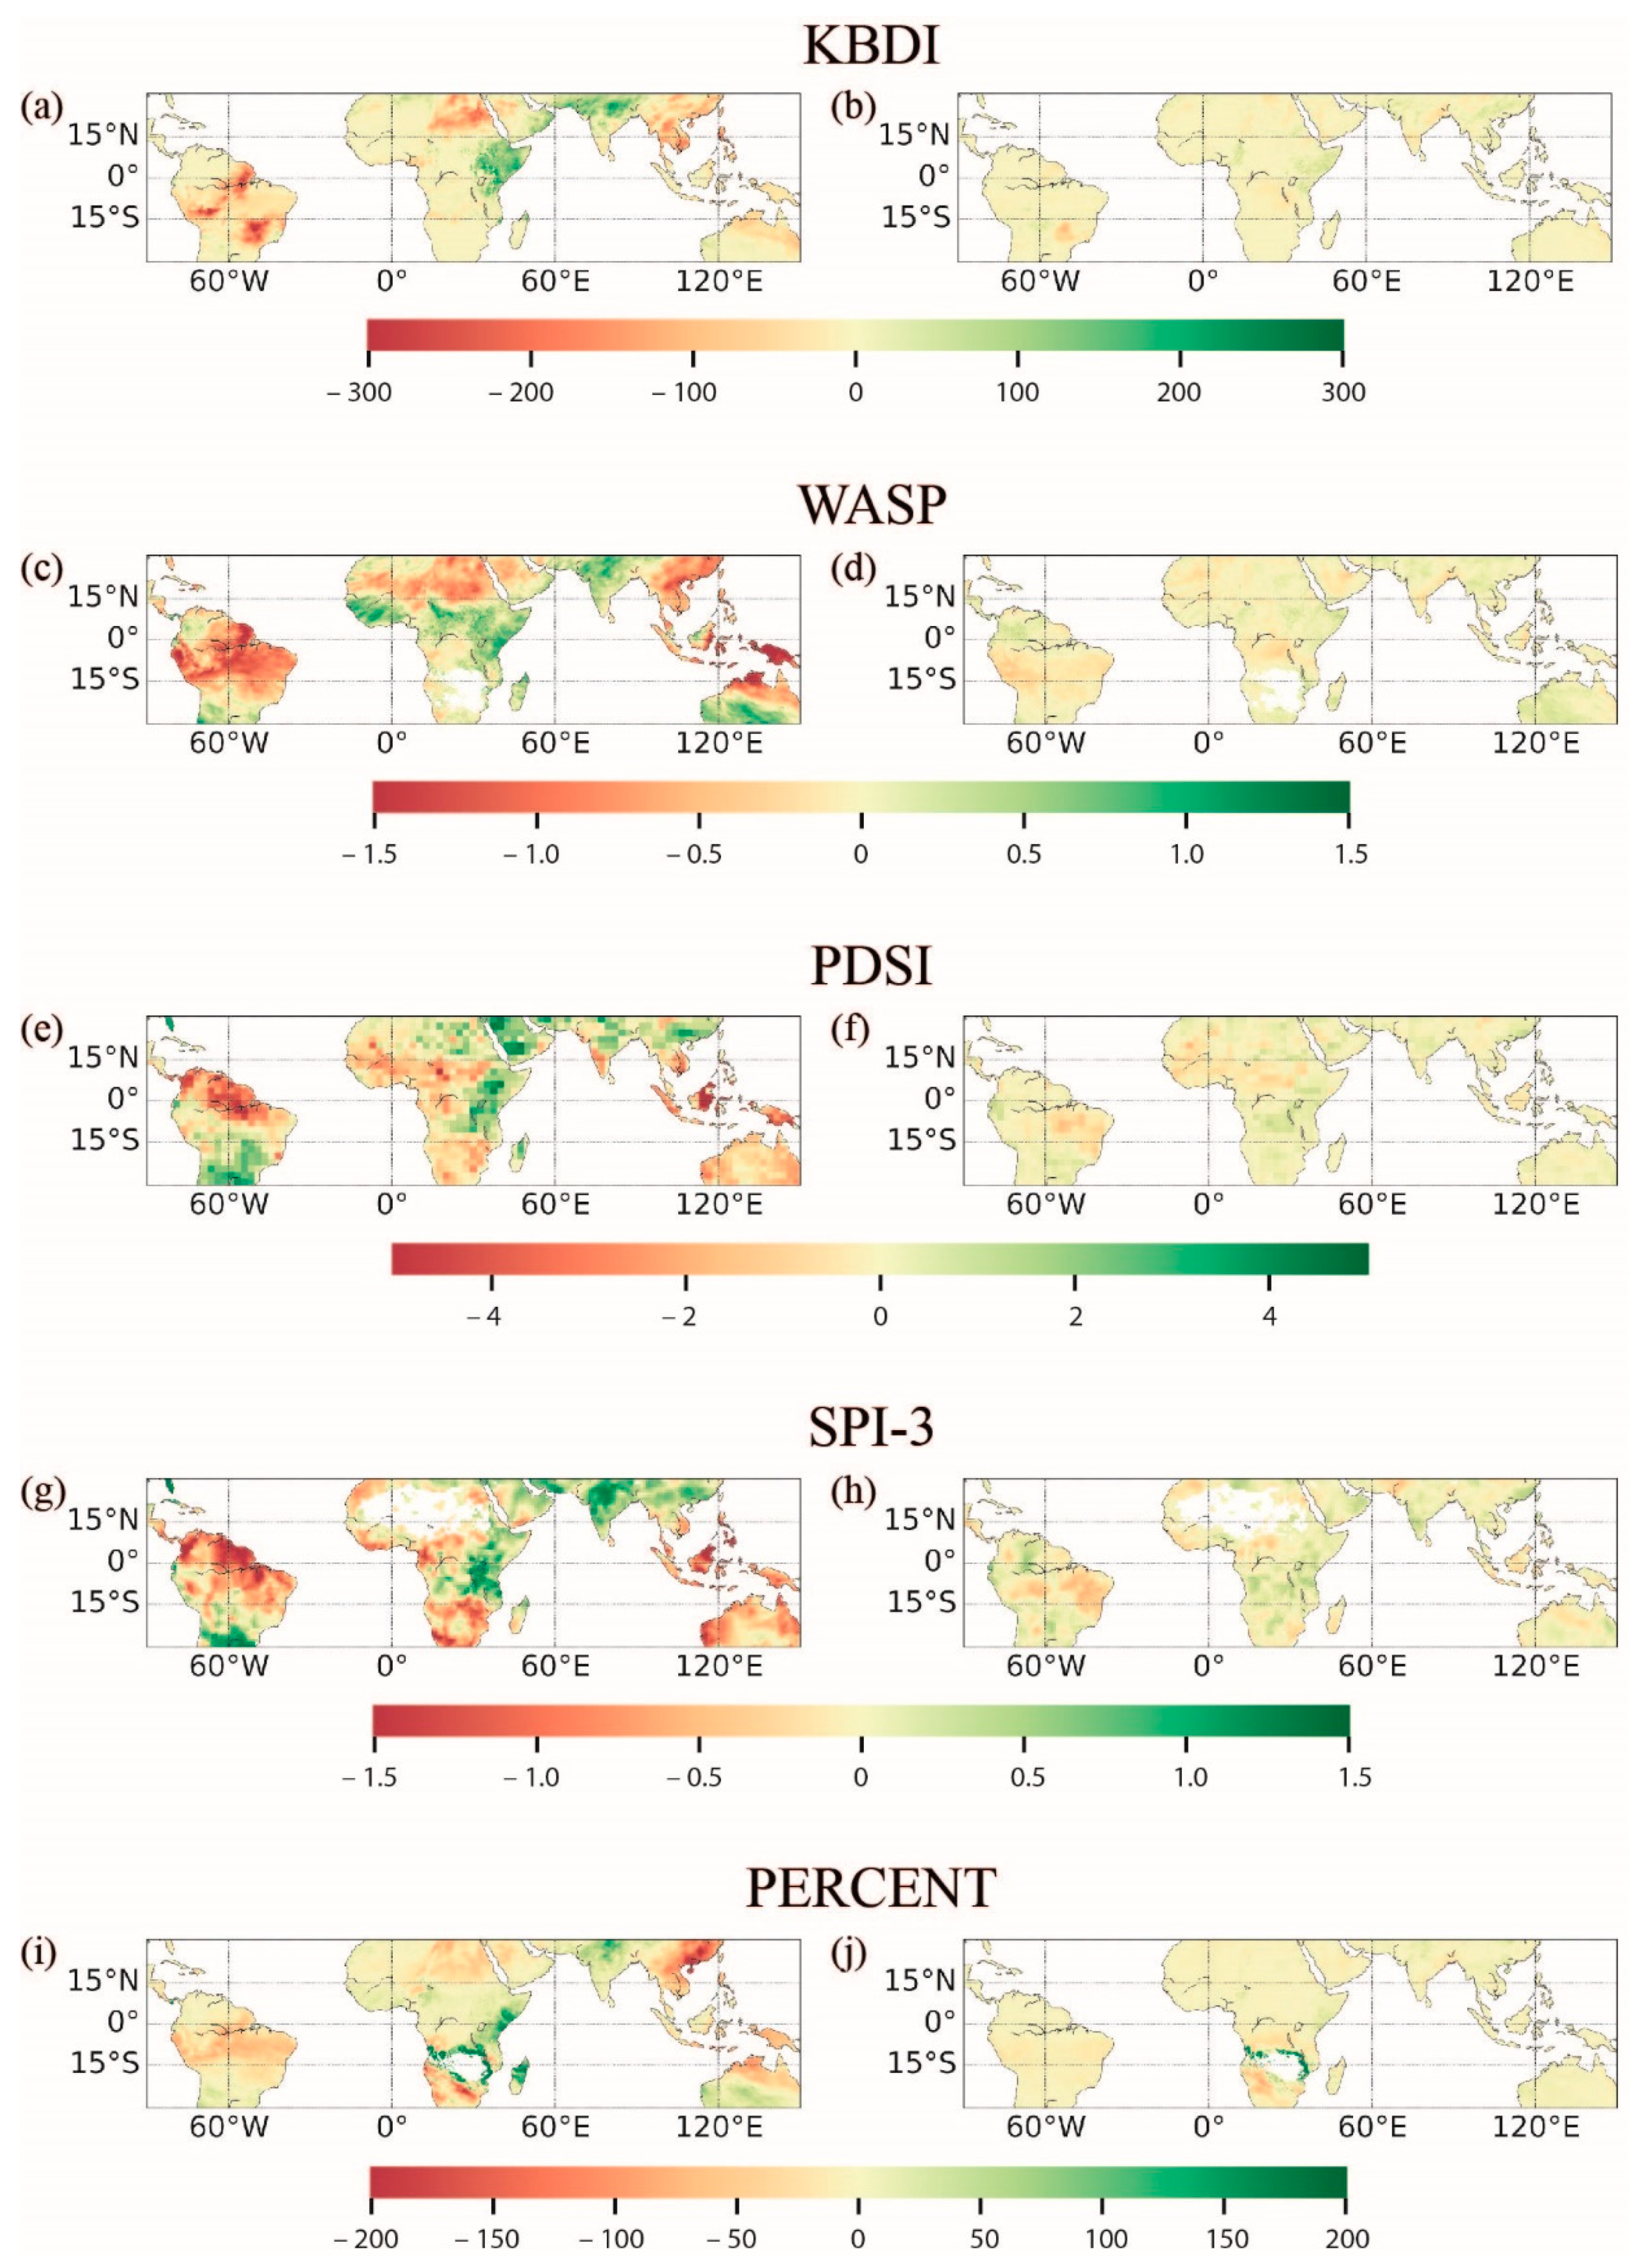
During the EP El Niño peak (DJF), negative dryness indices, which were associated with dry conditions, were situated over the entire Indonesian–Australian region, central and eastern South America, and northeastern and northern Africa. Above-normal precipitation was observed in central and western Australia, in eastern Africa, and on the western coast of equatorial South America. These features were common for all the dryness indices (Figure 6, left column). Some discrepancies between the indices occurred only in South Africa and Central America. In South Africa, while KBDI and WASP were positive during EP El Niño, PDSI and SPI-3 were negative, and PERCENT was positive near 20° S and negative to the south of 20° S. In Central America, while KBDI and SPI-3 were positive, WASP was negative and the other indices were close to zero. In boreal spring (MAM), the overall spatial pattern of the ENSO–dryness index relationships was similar to the boreal winter, while their intensity was significantly lower (Figure 6, right column). The exception was for PDSI in eastern Africa, which was negative in winter but positive in spring. In boreal summer (JJA), following EP El Niño, the largest area of negative indices with the highest absolute values was located over the Indonesian region (Figure 7, left column). For WASP, the magnitude of the boreal summer index was equal to the winter one, while for other indices, the intensity of the summer response was weaker compared to the winter period. Over South America, the boreal summer indices were smaller than in winter but had the same sign. Over the African continent, in the boreal summer, KBDI and PERCENT showed the same patterns as in the boreal winter. SPI-3 had a smaller magnitude than in winter. The boreal summer WASP index changed sign in North Africa, increased in Central Africa, and decreased in South Africa. For PDSI, the area of positive correlations appeared over the entire Somali peninsula. In the boreal fall (SON) season, the spatial patterns of the dryness indices were similar to summer, except for South Africa, where the SPI-3 index was positive in fall but negative in summer (Figure 7, right column). However, in Indonesia and South Africa, the magnitudes of WASP and PERCENT, respectively, were greater in boreal fall than in summer (Figure 7).
Considering the possible effects of various El Niño types on the spatial and temporal variability of the dryness indices, it was found that during DJF, the main difference in the CP El Niño response was characterized by a smaller magnitude of the dryness indices with a slight spatial shift of their maxima (Supplementary Materials Figure S7). In boreal spring, the difference between the two types of El Niño was more pronounced than in winter. The opposite signs of the indices during CP and EP events were observed for KBDI and WASP over South America, for WASP, PDSI, and SPI-3 over eastern Africa, for PERCENT over South Africa, and for PDSI and SPI-3 over Indonesia (Supplementary Materials Figure S7). During the boreal summer, all indices had opposite signs during the CP and EP events over eastern Africa. Over the northern part of South America, the largest area of positive WASP and PDSI were observed during summer following CP El Niño, which was not the case for the EP event (Supplementary Materials Figure S8). During boreal fall, the strongest difference between EP and CP conditions appeared over Australia: the EP events were associated with positive SPI and PDSI, i.e., extremely wet, while during CP events, an area of high negative SPI-3 and PDSI was observed over the whole continent, which corresponded to drought conditions. Over northeastern Australia, the WASP boreal fall index exhibited the opposite anomalies during CP El Niño (positive) and EP El Niño (negative) (Supplementary Materials Figure S8). A discrepancy between the indices was observed in boreal fall following CP events over South Africa: WASP and PERCENT had positive values and PDSI and SPI-3 had negative ones. Over South America, dry conditions during SON were mostly associated with CP El Niño, while during EP EL Niño, the dryness indices had different signs in different parts of the continent (Supplementary Materials Figure S8).

3.2.2. La Niña Responses

La Niña composites of the dryness indices were almost opposite to the El Niño conditions. Positive dryness indices appeared over Indonesia and Australia, South America, and northern Africa, and were characterized by above-normal precipitation, while eastern Africa exhibited a precipitation deficit. The latter anomaly did not manifest in an SPI-3 pattern, while the northern African anomalies were not described by PERCENT. The boreal spring anomalies were much weaker than in winter, while the signs of almost all the dryness indices remained unchanged. The exception was PERCENT, which changed sign over Indonesia (Supplementary Materials Figure S9). The effect of La Niña on the summer indices was comparable to winter in Indonesia and Australia but it was weaker over the African continent. Moreover, for KBDI and WASP, the summer patterns differed from the winter patterns: the positive WASPs were replaced by negative ones in summer in northern Africa, and the negative KBDI anomalies that were observed in winter over eastern Africa disappeared completely in summer. The SON anomalies were stronger than in JJA over Australia, Southeastern Asia, and Indonesia, and changed the sign from positive to negative over South Africa (Supplementary Materials Figure S10).
The seasonal variability of the ENSO effect on the dryness indices can be associated with both a strong seasonality of El Niño/La Niña peaks [86] and intra-annual migration of the Intratropical Convergence Zone (ITCZ) as the main causes of heavy precipitation in the tropics [87]. The ENSO phase locking led to the maximum effect in boreal winter, while MAM and SON weakening of the ENSO response, especially over the equator, was likely associated with ITCZ migration. In particular, when the ITCZ moved toward the equator in spring and autumn, the associated precipitation tended to compensate for the ENSO dryness effect within the equatorial belt, while in DJF and JJA, the ITCZ shifted off the equator over the continents, involving stronger sensitivity of the moisture conditions to the remote forcing. However, the latter effect did not manifest in all the climate indices and all considered areas due to the possible contributions of other factors. Moreover, despite the return of the ENSO-associated anomalous circulation to normal conditions that are usually observed in boreal summer following ENSO peaks, the anomaly of climate indices persisted over the subsequent seasons. This may have resulted from a reduced moisture supply caused by surface dryness. For example, over large parts of Indonesia, dry conditions were observed despite the ascending motions restored in JJA following El Niño (Supplementary Materials Figures S2 and S3a,b).

4. Discussion

Our correlation and composite analyses showed the significant influence of the ENSO cycles on land surface moisture conditions over the entire tropical belt. The main difference between the two types of El Niño manifested in the different intensities of the dryness index responses, with weaker correlations for CP El Niño. Previous studies emphasized that, during CP events, since the SST maximum is located near or within the warm pool where the well-developed deep convection occurs, the teleconnection patterns can be as marked as being during EP El Niño events [88]. We did not find such an amplification. This was probably because the heat and moisture release into the atmosphere from anomalous warm water mostly governs the propagation of the ENSO signal poleward rather than leading to a redistribution of precipitation within the tropics.
The warm (El Niño) and cold (La Niña) phases of the ENSO cycle exhibited almost opposite effects on the dryness indices in tropical regions, indicating the dominance of a linear response. Meanwhile, it was documented that ENSO manifests with significant convection asymmetry between the warm and cold phases [89]. To estimate the relationship between the linear and nonlinear responses of the dryness indices to ENSO, we analyzed the differences between dryness indices observed in DJF during El Niño and La Niña as a measure of the linear response (Figure 8, left column). The DJF composites of the dryness indices, which were calculated as 0.5 × (El Niño + La Niña), were used as a proxy of non-linear response (Figure 8, right column). It is clear that linear responses dominated over the continents for all considered dryness indices. The non-linear response was much weaker and manifested mostly over South and Eastern Africa and Eastern and Northern South America. Note that for KBDI and WASP, the non-linear response was lacking. The lack of non-linearity in the dryness indices’ response compared to convection may be explained by the fact that the asymmetry between the convection response to the warm and cold ENSO phases is mostly attributed to the oceans, especially to the Pacific, while in the present study, we only focused on dryness indices over the continents where the asymmetric convection response was not as evident.
The variety of the ENSO effects on the dryness indices and precipitation anomalies that we observed could be due to multiple reasons, including the different data sets that were used to compute each index, the different atmospheric parameters (air temperature, precipitation), and the different averaged different time intervals that were applied to derive the surface moisture conditions. In particular, PDSI contains many empirical parameters that strongly depend on regional geographical conditions, and therefore, requires additional calibration [67]. Moreover, the potential evapotranspiration in PDSI was derived using the simplified Thornthwaite algorithm, which may result in some overestimation of drought severity, especially in warm climates [66]. The widely used SPI is based only on precipitation data and does not account for actual or potential evapotranspiration. This can also limit its ability to capture the effect of increased temperatures on the moisture demand and availability [90].
The variations in the dryness indices associated with El Niño/La Niña conditions are assumed to impact the growth and function of tropical forest ecosystems through variations of energy and CO2 fluxes [12,77]. The links between the dryness and ENSO indices make it possible to assess the potential El Niño consequences for tropical vegetation. The ENSO-induced extremely dry or wet conditions can have dramatic impacts on the vegetation of the humid and subhumid tropics. Surface droughts very often disturb vegetation function and reduce primary production. Similar effects can also be observed in the case of floods associated with heavy rainfall. Wigneron et al. [91] analyzed the influence of extremely hot and dry conditions associated with the 2015–2016 El Niño event on tropical vegetation and showed that such anomalies can lead to larger carbon emissions from tropical ecosystems into the atmosphere due to reduced gross primary production and increased ecosystem respiration. Furthermore, the study showed [91] that the return to normal climatic conditions in 2017 led dry lands to very rapidly recover their carbon stocks to pre-El Niño levels, but African and American humid forests did not, suggesting carryover effects from enhanced forest mortality and impaired tree function. Similar results were obtained by Gushchina et al. [12] for tropical rainforests in Indonesia. Strong droughts also increase the risk of wildfires, which can result in the complete destruction of plant communities and acute changes of surface energy, water, and carbon budgets, as well as a loss of biodiversity [44,92].
Considering the possible effects of the ENSO on the growth and functioning of tropical vegetation, it is also important to take into account the plasticity of tropical plant species and their ability for biological adaptation to current environmental conditions [93,94,95]. This can be extremely important given the projected increasing frequency of extremely strong ENSO events by the end of the 21st century [96] and the need to obtain adequate projections of the possible responses to such changes of the different plant communities [93].

5. Conclusions

Five dryness indices (KBDI, WASP, PERCENT, PDSI, and SPI) were used to estimate the effects of the ENSO events on moisture conditions that are crucial for tropical vegetation function and growth. The separate effect of the ENSO on precipitation anomalies was also analyzed. The strongest variability of the dryness indices associated with the ENSO cycle was observed over Indonesia, Australia, southern and eastern Africa, eastern and northwestern South America, and Central America. During El Niño, dry conditions extended over the entire Indonesian–Australian and Amazonian regions, as well as northeastern and northern African regions. On the other hand, wetter than average conditions were observed in central and western Australia, in eastern Africa, the southeastern part of South America, and on the western coast of equatorial South America. The effects of La Niña were generally opposite to those of El Niño, which indicated the dominance of the linear response of dryness indices to the ENSO.
An important finding was that the two types of El Niño (Eastern and Central Pacific) had different impacts on the surface moisture conditions in both the humid and subhumid tropics. The response to the two types of El Niño mostly differed in the strength of the correlations and the spatial distributions of the dryness indices, with the CP El Niño effect being weaker than those of EP El Niño.
Comparisons of how the ENSO affected the dryness indices relative to precipitation anomalies showed distinct ENSO–precipitation and ENSO–dryness indices correlations that exhibited opposite patterns in some regions. These differences were due to various factors, including the use of different data sets and time intervals when computing each indicator, as well as different atmospheric parameters (e.g., air temperature, precipitation) that influence the dryness indices (e.g., KBDI, PDSI). Tropical vegetation is sensitive to various climatic factors, and thus, future efforts to examine the ENSO–vegetation interactions should consider using dryness indices in addition to precipitation data for characterizing surface moisture.
The ENSO effects on the dryness indices that we observed were likely due to the displacement of Walker and Hadley vertical circulation cells and the associated convection and precipitation zones (atmospheric bridge mechanism), as well as to effects of tropospheric warming and cooling resulting from the ENSO-associated changes in the SST that propagate along the tropics in the form of the Rossby and Kelvin waves. Our results emphasized that the observed anomalies in dryness indices corresponded with the location of ascending/descending branches of zonal (Walker) and meridional (Hadley) verticals cells that favor/stress the processes of deep convection.
We also found very strong spatial heterogeneity in the seasonal variability of the ENSO–dryness index relationships. This can occur due to the influence of the phase-locking of El Niño/La Niña events that tend to peak in boreal winter, as well as to seasonal migration of the Intratropical Convergence Zone (ITCZ).
Our present study considered the possible effects of different types of El Niño and La Niña on surface moisture and precipitation anomalies within tropical regions during a relatively short period covering only the last several decades. The wide range of possible responses of weather conditions to various ENSO events stresses the need for new studies of possible ENSO influences on regional weather conditions in the tropical and extra-tropical regions. This is especially important given the high sensitivity and vulnerability of tropical vegetation to extreme weather events and climate anomalies. New studies of the ENSO–tropical vegetation interaction can help to better understand the key mechanisms of such interactions and improve the projection of tropical vegetation’s response to future climate change.

Supplementary Materials

The following are available online at https://www.mdpi.com/2073-4433/11/12/1354/s1. Figure S1: The difference between the El Niño Southern Oscillation (ENSO)–dryness indices and ENSO–precipitation correlations for Eastern Pacific (EP) El Niño. Figure S2: The same as Figure S1 but for Central Pacific (CP) El Niño. Figure S3: The same as Figure S1 but for La Niña. Figure S4: The Walker circulation cell (averaged between 5° S–5° N) in MAM (March, April, May). The composites for (a) EP El Niños, (b) CP El Niños, and (c) La Niñas (see Table 1 for the selected events). The arrows are the vectors of wind velocity: divergent zonal wind (m/s) along the horizontal direction, pressure vertical velocity (×10−2 Pa/s) along the vertical direction; the color field is the value of the pressure vertical velocity (×10−2 Pa/s). Figure S5: The same as Figure S4 but for JJA (June, July, August). Figure S6: The same as Figure S4 but for SON (September, October, November). Figure S7: The composites of the dryness indices during the DJF (December, January, February) (left column) and MAM (right column) seasons of CP El Niño years (see Table 1 for selected events). Figure S8: The same as Figure S7 but for the JJA (left column) and SON (right column) seasons. Figure S9: The same as Figure S7 but for La Niña years (see Table 1 for the selected events). Figure S10: The same as Figure S8 but for La Niña years (see Table 1 for the selected events). Figure S11. The Hadley circulation cell over (a,d,g) Indonesia–Australia (averaged between 90–160° E); (b,e,h) Africa (averaged between 20° W–50° E); (c,f,j,i) South America (averaged between 30–80° W) in MAM. The composites for EP El Niños (upper panel), CP El Niños (middle panel), La Niñas (bottom panel) (see Table 1 for the selected events). The arrows are the vectors of wind velocity: divergent meridional wind (m/s) along the horizontal direction, pressure vertical velocity (×10−2 Pa/s) along the vertical direction; the color field is the value of the pressure vertical velocity (×10−2 Pa/s). Figure S12: The same as Figure S11 but for JJA. Figure S13: The same as Figure S11 but for SON.

Author Contributions

D.G. and I.Z. conceptualized the study; I.Z. performed statistical analysis; D.G., I.Z., and A.O. (Alexander Osipov) analyzed the data; D.G. and A.O. (Alexander Olchev) wrote the paper and edited and finalized the manuscript. All authors have read and agreed to the published version of the manuscript.

Funding

The study was funded by Lomonosov Moscow State University (grant AAAA-A16-116032810086-4) and Russian Foundation for Basic Research RFBR (grant 18-05-00767).

Acknowledgments

The authors acknowledge EcoSpatial Services L.L.C. for the English language editing.

Conflicts of Interest

The authors declare no conflict of interest.

References

  1. Trenberth, K.E.; Branstator, W.B.; Karoly, D.; Kumar, A.; Lau, N.C.; Ropelewski, C.F. Progress during TOGA in understanding and modeling global teleconnections associated with tropical sea surface temperatures. J. Geophys. Res. 1998, 103, 14291–14324. [Google Scholar] [CrossRef]
  2. Zheleznova, I.V.; Gushchina, D.Y. The response of global atmospheric circulation to two types of El Niño. Russ. Meteorol. Hydrol. 2015, 40, 170–179. [Google Scholar] [CrossRef]
  3. Gushchina, D.Y.; Petrosyants, M.A. Interaction between equatorial Pacific sea surface temperature and wind velocity circulation in atmospheric centers of action. Russ. Meteorol. Hydrol. 1998, 12, 1–14. [Google Scholar]
  4. Wang, C.; Deser, C.; Yu, J.-Y.; DiNezio, P.; Clement, A. El Niño and Southern Oscillation (ENSO): A review. In Coral Reefs of the Eastern Tropical Pacific: Persistence and Loss in a Dynamic Environment; Glynn, P.W., Manzello, D.P., Enochs, I.C., Eds.; Springer: Dordrecht, The Netherlands, 2017; Volume 8, pp. 85–106. [Google Scholar] [CrossRef]
  5. Chiang, J.C.H.; Sobel, A.H. Tropical tropospheric temperature variations caused by ENSO and their influence on the remote tropical climate. J. Clim. 2002, 15, 2616–2631. [Google Scholar] [CrossRef] [Green Version]
  6. Yulaeva, E.; Wallace, J.M. The signature of ENSO in global temperature and precipitation fields derived from the microwave sounding unit. J. Clim. 1994, 7, 1719–1736. [Google Scholar] [CrossRef] [Green Version]
  7. Yang, S.; Li, Z.; Yu, J.Y.; Hu, X.; Dong, W.; He, S. El Niño–Southern Oscillation and its impact in the changing climate. Natl. Sci. Rev. 2018, 5, 840–857. [Google Scholar] [CrossRef]
  8. Klein, S.A.; Soden, B.J.; Lau, N.C. Remote sea surface temperature variations during ENSO: Evidence for a tropical atmospheric bridge. J. Clim. 1999, 12, 917–932. [Google Scholar] [CrossRef] [Green Version]
  9. Alexander, M.A.; Blade, I.; Newman, M.; Lanzante, J.R.; Lau, N.C.; Scott, J.D. The atmospheric bridge: The influence of ENSO teleconnections on air-sea interaction over the global oceans. J. Clim. 2002, 15, 2205–2231. [Google Scholar] [CrossRef]
  10. Lau, N.C.; Nath, M.J. Atmosphere-ocean variations in the Indo-Pacific sector during ENSO episodes. J. Clim. 2003, 16, 3–20. [Google Scholar] [CrossRef]
  11. Lau, N.-C.; Nath, M.J. Impact of ENSO on the Variability of the Asian–Australian monsoons as simulated in GCM experiments. J. Clim. 2000, 13, 4287–4309. [Google Scholar] [CrossRef] [Green Version]
  12. Gushchina, D.; Heimsch, F.; Osipov, A.; June, T.; Rauf, A.; Kreilein, H.; Panferov, O.; Olchev, A.; Knohl, A. Effects of the 2015–2016 El Niño event on energy and CO2 fluxes of a tropical rainforest in Central Sulawesi. Geogr. Environ. Sustain. 2019, 12, 183–196. [Google Scholar] [CrossRef]
  13. Australian Government Bureau of Meteorology. Available online: http://www.bom.gov.au/climate/updates/articles/a008-el-nino-and-australia.shtml (accessed on 16 August 2020).
  14. Cai, W.; McPhaden, M.J.; Grimm, A.M.; Rodrigues, R.R.; Taschetto, A.S.; Garreaud, R.D.; Dewitte, B.; Poveda, G.; Ham, Y.G.; Santoso, A.; et al. Climate impacts of the El Niño–Southern Oscillation on South America. Nat. Rev. Earth Environ. 2020, 1, 215–231. [Google Scholar] [CrossRef]
  15. Plisnier, P.D.; Serneels, S.; Lambin, E.F. Impact of ENSO on East African ecosystems: A multivariate analysis based on climate and remote sensing data. Glob. Ecol. Biogeogr. 2000, 9, 481–497. [Google Scholar] [CrossRef]
  16. Obasi, G. The impacts of ENSO in Africa. In Climate Change and Africa; Low, P.S., Ed.; Cambridge University Press: Cambridge, UK, 2005; pp. 218–230. [Google Scholar] [CrossRef]
  17. Bonan, G.B. Forests and climate change: Forcings, feedbacks, and the climate benefits of forests. Science 2008, 320, 1444–1449. [Google Scholar] [CrossRef] [PubMed] [Green Version]
  18. Bush, M.B.; Flenley, J.R.; Gosling, W.D. Tropical Rainforest Responses to Climatic Change, 2nd ed.; Springer Praxis Book Series; Springer: Chichester, UK, 2011; 454p. [Google Scholar]
  19. Rowland, L.; Da Costa, A.C.L.; Galbraith, D.R.; Oliveira, R.S.; Binks, O.J.; Oliveira, A.A.R.; Pullen, A.M.; Doughty, C.E.; Metcalfe, D.B.; Vasconcelos, S.S.; et al. Death from drought in tropical forests is triggered by hydraulics not carbon starvation. Nature 2015, 528, 119–122. [Google Scholar] [CrossRef] [PubMed] [Green Version]
  20. Slik, J.W.F. El Niño droughts and their effects on tree species composition and diversity in tropical rain forests. Oecologia 2004, 141, 114–120. [Google Scholar] [CrossRef]
  21. Steinkamp, J.; Hickler, T. Is drought-induced forest dieback globally increasing? J. Ecol. 2015, 103, 31–43. [Google Scholar] [CrossRef]
  22. Nobre, C.A.; Sellers, P.J.; Shukla, J. Amazonian deforestation and regional climate change. J. Clim. 1991, 4, 957–988. [Google Scholar] [CrossRef] [Green Version]
  23. Laurance, W.F.; Cochrane, M.A.; Bergen, S.; Fearnside, P.M.; Delamonica, P.; Barber, C.; D’Angelo, S.; Fernandes, T. The future of Brazilian Amazon. Science 2001, 291, 438–439. [Google Scholar] [CrossRef] [Green Version]
  24. Lewis, S.L. Tropical forests and the changing earth system. Philos. Trans. R. Soc. B 2006, 361, 195–210. [Google Scholar] [CrossRef] [Green Version]
  25. Costa, M.H.; Foley, J.A. Trends in the hydrological cycle of the Amazon basin. J. Geophys. Res. Atmos. 1999, 104, 14189–14198. [Google Scholar] [CrossRef]
  26. Werth, D.; Avissar, R. The local and global effects of Amazon deforestation. J. Geophys. Res. Atmos. 2002, 107, LBA 55-1–LBA 55-8. [Google Scholar] [CrossRef] [Green Version]
  27. Marengo, J.A. On the hydrological cycle of the Amazon basin: A historical review and current state-of-the-art. Rev. Bras. Meteorol. 2006, 21, 1–19. [Google Scholar]
  28. Tanaka, N.; Kume, T.; Yoshifuji, N.; Tanaka, K.; Takizawa, H.; Shiraki, K.; Tantasirin, C.; Tangtham, N.; Suzuki, M. A review of evapotranspiration estimates from tropical forests in Thailand and adjacent regions. Agric. For. Meteorol. 2008, 148, 807–819. [Google Scholar] [CrossRef]
  29. Grace, J.; Lloyd, J.; McIntyre, J.; Miranda, A.C.; Meir, P.; Miranda, H.S.; Nobre, C.; Moncrieff, J.; Massheder, J.; Malhi, Y.; et al. Carbon dioxide uptake by an undisturbed tropical rain in Southwest Amazonia, 1992 to 1993. Science 1995, 270, 778–780. [Google Scholar] [CrossRef]
  30. Malhi, Y. The carbon balance of tropical forest regions, 1990–2005. Curr. Opin. Sust. 2010, 2, 237–244. [Google Scholar] [CrossRef]
  31. Phillips, O.L.; Lewis, S.L. Evaluating the tropical forest carbon sink. Glob. Chang. Biol. 2014, 20, 2039–2041. [Google Scholar] [CrossRef]
  32. Lloyd, J.; Farquhar, G.D. Effects of rising temperatures and CO2 on the physiology of tropical forest trees. Philos. Trans. R. Soc. B Biol. Sci. 2008, 363, 1811–1817. [Google Scholar] [CrossRef] [Green Version]
  33. Heskel, M.A.; O’Sullivan, O.S.; Reich, P.B.; Tjoelker, M.G.; Weerasinghe, L.K.; Penillard, A.; Egerton, J.J.; Creek, D.; Bloomfield, K.J.; Xiang, J.; et al. Convergence in the temperature response of leaf respiration across biomes and plant functional types. Proc. Natl. Acad. Sci. USA 2016, 113, 3832–3837. [Google Scholar] [CrossRef] [Green Version]
  34. Slot, M.; Winter, K. In situ temperature response of photosynthesis of 42 tree and liana species in the canopy of two Panamanian lowland tropical forests with contrasting rainfall regimes. New Phytol. 2017, 214, 1103–1117. [Google Scholar] [CrossRef] [Green Version]
  35. Phillips, O.L.; Aragão, L.E.O.C.; Lewis, S.L.; Fisher, J.B.; Lloyd, J.; López-González, G.; Malhi, Y.; Monteagudo, A.; Peacock, J.; Quesada, C.A.; et al. Drought sensitivity of the Amazon rainforest. Science 2009, 323, 1344–1347. [Google Scholar] [CrossRef] [PubMed] [Green Version]
  36. Phillips, O.L.; Van der Heijden, G.; Lewis, S.L.; López-González, G.; Aragão, L.E.; Lloyd, J.; Malhi, Y.; Monteagudo, A.; Almeida, S.; Dávila, E.A.; et al. Drought-mortality relationships for tropical forests. New Phytol. 2010, 187, 631–646. [Google Scholar] [CrossRef] [PubMed] [Green Version]
  37. Jiménez-Muñoz, J.C.; Mattar, C.; Barichivich, J.; Santamaría-Artigas, A.; Takahashi, K.; Malhi, Y.; Sobrino, J.A.; Van der Schrier, G. Record-breaking warming and extreme drought in the Amazon rainforest during the course of El Niño 2015–2016. Sci. Rep. 2016, 6, 33130. [Google Scholar] [CrossRef] [PubMed] [Green Version]
  38. Asner, G.P.; Townsend, A.; Braswell, B.H. Satellite observation of El Nino effects on Amazon forest phenology and productivity. Geophys. Res. Lett. 2000, 27, 981–984. [Google Scholar] [CrossRef] [Green Version]
  39. Chen, Y.; Morton, D.C.; Andela, N.; Van der Werf, G.R.; Giglio, L.; Randerson, J.T. A pan-tropical cascade of fire driven by El Niño/Southern Oscillation. Nat. Clim. Chang. 2017, 7, 906–911. [Google Scholar] [CrossRef]
  40. Slik, J.F.; Arroyo-Rodríguez, V.; Aiba, S.I.; Alvarez-Loayza, P.; Alves, L.F.; Ashton, P.; Balvanera, P.; Bastian, M.L.; Bellingham, P.J.; Van den Berg, E.; et al. An estimate of the number of tropical tree species. Proc. Natl. Acad. Sci. USA 2015, 112, 7472–7477. [Google Scholar] [CrossRef] [Green Version]
  41. Lagos, P.; Silva, Y.; Nickl, E.; Mosquera, K. El Nino—Related precipitation variability in Peru. Adv. Geosci. 2008, 14, 231–237. [Google Scholar] [CrossRef] [Green Version]
  42. Amaya, A.G.; Villazon, M.F.; Willems, P. Assessment of rainfall variability and its relationship to ENSO in a sub-Andean watershed in Central Bolivia. Water 2018, 10, 701. [Google Scholar] [CrossRef] [Green Version]
  43. Guo, S.; Wu, R. Contribution of El Niño amplitude change to tropical Pacific precipitation decline in the late 1990s. Atmos. Ocean. Sci. Lett. 2019, 12, 355–360. [Google Scholar] [CrossRef]
  44. Fasullo, J.T.; Otto-Bliesner, B.L.; Stevenson, S. ENSO’s changing influence on temperature, precipitation, and wildfire in a warming climate. Geophys. Res. Lett. 2018, 45, 9216–9225. [Google Scholar] [CrossRef]
  45. Iskandar, I.; Lestrai, D.O.; Nur, M. Impact of El Niño and El Niño Modoki events on Indonesian rainfall. Makara J. Sci. 2019, 23, 217–222. [Google Scholar] [CrossRef] [Green Version]
  46. Canedo-Rosso, C.; Uvo, C.B.; Berndtsson, R. Precipitation variability and its relation to climate anomalies in the Bolivian Altiplano. Int. J. Climatol. 2019, 39, 2096–2107. [Google Scholar] [CrossRef] [Green Version]
  47. Kitzberger, T.; Swetnam, T.W.; Veblen, T.T. Inter-hemispheric synchrony of forest fires and the El Niño-Southern Oscillation. Glob. Ecol. Biogeogr. 2001, 10, 315–326. [Google Scholar] [CrossRef] [Green Version]
  48. Dai, A. Characteristics and trends in various forms of the palmer drought severity index during 1900–2008. J. Geophys. Res. 2011, 116, D12. [Google Scholar] [CrossRef] [Green Version]
  49. Vega, H.M.; Lima, J.R.; Cerniak, S.N. SPEI and hurst analysis of precipitation in the Amazonian area of Brazil. Rev. Bras. Meteorol. 2019, 34, 325–334. [Google Scholar] [CrossRef] [Green Version]
  50. King, M.P.; Yu, E.; Sillmann, S. Impact of strong and extreme El Niños on European hydroclimate. Tellus A 2020, 72, 1–10. [Google Scholar] [CrossRef] [Green Version]
  51. Zhao, M.; Geruo, A.; Velicogna, I.; Kimball, J.S. A Global gridded dataset of GRACE drought severity index for 2002–14: Comparison with PDSI and SPEI and a case study of the Australia millennium drought. J. Hydrometeor. 2017, 18, 2117–2129. [Google Scholar] [CrossRef] [Green Version]
  52. Semeraro, T.; Luvisi, A.; Lillo, A.O.; Aretano, R.; Buccolieri, R.; Marwan, N. Recurrence analysis of vegetation indices for highlighting the ecosystem response to drought events: An application to the Amazon forest. Remote Sens. 2020, 12, 907. [Google Scholar] [CrossRef] [Green Version]
  53. Beguerıa, S.; Vicente-Serrano, S.M.; Reig, F.; Latorre, B. Standardized precipitation evapotranspiration index (SPEI) revisited: Parameter fitting, evapotranspiration models, tools, datasets and drought monitoring. Int. J. Climatol. 2014, 34, 3001–3023. [Google Scholar] [CrossRef] [Green Version]
  54. Ashok, K.; Behera, S.K.; Rao, S.A.; Weng, H.; Yamagata, T. El Niño Modoki and its possible teleconnection. J. Geophys. Res. 2007, 112, C11007. [Google Scholar] [CrossRef]
  55. Kug, J.S.; Jin, F.F.; An, S.I. Two types of El Niño events: Cold tongue El Niño and warm pool El Niño. J. Clim. 2009, 22, 1499–1515. [Google Scholar] [CrossRef]
  56. Capotondi, A.; Wittenberg, A.T.; Newman, M.; Di Lorenzo, E.; Yu, J.Y.; Braconnot, P.; Cole, J.; Dewitte, B.; Giese, B.; Guilyardi, E.; et al. Understanding ENSO diversity. Bull. Am. Meteorol. Soc. 2015, 96, 921–938. [Google Scholar] [CrossRef]
  57. Keetch, J.J.; Byram, G. A Drought Index for Forest Fire Control; USDA Forest Service Research Paper No. SE-38; Southeastern Forest Experiment Station: Asheville, NC, USA, 1968; 32p.
  58. Petros, G.; Antonis, M.; Marianthi, T. Development of an adapted empirical drought index to the Mediterranean conditions for use in forestry. Agric. For. Meteorol. 2011, 151, 241–250. [Google Scholar] [CrossRef]
  59. Lyon, B. The strength of El Niño and the spatial extent of tropical drought. Geophys. Res. Lett. 2004, 31, L21204. [Google Scholar] [CrossRef] [Green Version]
  60. Lyon, B.; Barnston, A.G. ENSO and the spatial extent of interannual precipitation extremes in tropical land areas. J. Clim. 2005, 18, 5095–5109. [Google Scholar] [CrossRef]
  61. McKee, T.B.; Doesken, N.J.; Kliest, J. The relationship of drought frequency and duration to time scales. In Proceedings of the 8th Conference of Applied Climatology, Anaheim, CA, USA, 17–22 January 1993. [Google Scholar]
  62. Guttman, N.B. Accepting the standardized precipitation index: A calculation algorithm. J. Am. Water Resour. Assoc. 1999, 35, 311–322. [Google Scholar] [CrossRef]
  63. Keyantash, J.; Dracup, J.A. The quantification of drought: An analysis of drought indices. Bull. Am. Meteorol. Soc. 2002, 83, 1167–1180. [Google Scholar] [CrossRef]
  64. Palmer, W.C. Meteorological Drought; Research Paper No. 45; US Weather Bureau: Washington, DC, USA, 1965; Volume 45, 58p.
  65. Thornthwaite, C.W. An approach toward a rational classification of climate. Geogr. Rev. 1948, 39, 55–94. [Google Scholar] [CrossRef]
  66. Sheffield, J.; Wood, E.F.; Roderick, M.L. Little Change in global drought over the past 60 years. Nature 2012, 491, 435–438. [Google Scholar] [CrossRef]
  67. Yu, H.Q.; Zhang, Q.; Xu, C.Y.; Du, J.; Sun, P.; Hu, P. Modified palmer drought severity index: Model improvement and application. Environ. Int. 2019, 130, 104951. [Google Scholar] [CrossRef]
  68. Percent of Normal Precipitation. Available online: https://www.droughtmanagement.info/percent-of-normal-precipitation/ (accessed on 16 August 2020).
  69. ERA5. Available online: https://www.ecmwf.int/en/forecasts/datasets/reanalysis-datasets/era5 (accessed on 16 August 2020).
  70. Global (Land) Precipitation and Temperature: Willmott & Matsuura, University of Delaware. Available online: https://climatedataguide.ucar.edu/climate-data/global-land-precipitation-and-temperature-willmott-matsuura-university-delaware (accessed on 16 August 2020).
  71. Standardized Precipitation Index (SPI) for Global Land Surface (1949–2012). Available online: https://rda.ucar.edu/datasets/ds298.0/index.html#!cgi-bin/datasets (accessed on 16 August 2020).
  72. Palmer Drought Severity Index (PDSI) from NCAR. Available online: https://psl.noaa.gov/data/gridded/data.pdsi.html (accessed on 16 August 2020).
  73. Takahashi, K.; Montecinos, A.; Goubanova, K.; Dewitte, B. ENSO regimes: Reinterpreting the canonical and Modoki El Niño. Geophys. Res. Lett. 2011, 38, L10704. [Google Scholar] [CrossRef] [Green Version]
  74. Rayner, N.A.; Parker, D.E.; Horton, E.B.; Folland, C.K.; Alexander, L.V.; Rowell, D.P.; Kent, E.C.; Kaplan, A. Global analyses of sea surface temperature, sea ice, and night marine air temperature since the late nineteenth century. J. Geophys. Res. Atmos. 2003, 108, D14. [Google Scholar] [CrossRef]
  75. Wang, C. Atmospheric circulation cells associated with the El Niño–Southern Oscillation. J. Clim. 2002, 15, 399–419. [Google Scholar] [CrossRef]
  76. Yeh, S.-W.; Kug, S.J.; Dewitte, B.; Kwon, M.H.; Kirtman, B.P.; Jin, F.F. El Niño in a changing climate. Nature 2009, 461, 511–514. [Google Scholar] [CrossRef]
  77. Olchev, A.; Ibrom, A.; Panferov, O.; Gushchina, D.; Kreilein, H.; Popov, V.; Propastin, P.; June, T.; Rauf, A.; Gravenhorst, G.; et al. Response of CO2 and H2O fluxes in a mountainous tropical rainforest in equatorial Indonesia to El Niño events. Biogeosciences 2015, 12, 6655–6667. [Google Scholar] [CrossRef] [Green Version]
  78. Weng, H.; Ashok, K.; Behera, S.K.; Rao, S.A.; Yamagata, T. Impacts of recent El Nino Modoki on dry/wet conditions in the Pacific rim during boreal summer. Clim. Dyn. 2007, 29, 113–129. [Google Scholar] [CrossRef]
  79. Zheleznova, I.V.; Gushchina, D.Y. Hadley and Walker circulation anomalies associated with the two types of El Niño. Russ. Meteorol. Hydrol. 2017, 42, 625–634. [Google Scholar] [CrossRef]
  80. Ropelewski, C.F.; Halpert, M.S. Quantifying Southern Oscillation–precipitation relationships. J. Clim. 1996, 9, 1043–1059. [Google Scholar] [CrossRef] [Green Version]
  81. Edwards, R.B.; Naylor, R.L.; Higgins, M.; Falcon, W.P. Causes of Indonesia’s forest fires. World Dev. 2020, 127, 104717. [Google Scholar] [CrossRef]
  82. Espinoza, J.C.; Ronchail, J.; Guyot, J.L.; Junquas, C.; Vauchel, P.; Lavado, W.; Drapeau, G.; Pombosa, R. Climate variability and extremes drought in the upper Solimões river (Western Amazon basin): Understanding the exceptional 2010 drought. Geophys. Res. Lett. 2011, 38, L13406. [Google Scholar] [CrossRef]
  83. Marengo, J.A.; Espinoza, J.C. Extreme seasonal droughts and floods in Amazonia: Causes, trends and impacts. Int. J. Climatol. 2016, 36, 1033–1050. [Google Scholar] [CrossRef]
  84. Malhi, Y.; Roberts, J.T.; Betts, R.A.; Killeen, T.J.; Li, W.; Nobre, C.A. Climate change, deforestation, and the fate of Amazon. Science 2008, 319, 169–172. [Google Scholar] [CrossRef] [PubMed] [Green Version]
  85. Li, W.; Zhang, P.; Ye, J.; Li, L.; Baker, P.A. Impact of two different types of El Niño events on the Amazon climate and ecosystem productivity. J. Plant Ecol. 2011, 4, 91–99. [Google Scholar] [CrossRef]
  86. Rasmusson, E.; Carpenter, T. Variations in tropical sea surface temperature and surface wind fields associated with the Southern Oscillation/El Niño. Mon. Weather Rev. 1982, 110, 354–384. [Google Scholar] [CrossRef]
  87. Smith, R.K. Lectures on Tropical Meteorology; Meteorologisches Institut München: Munich, Germany, 2003; 145p. [Google Scholar]
  88. Yeh, S.W.; Cai, W.; Min, S.K.; McPhaden, M.J.; Dommenget, D.; Dewitte, B.; Collins, M.; Ashok, K.; An, S.I.; Yim, B.Y.; et al. ENSO atmospheric teleconnections and their response to greenhouse gas forcing. Rev. Geophys. 2018, 56, 185–206. [Google Scholar] [CrossRef]
  89. Chen, M.; Li, T.; Shen, X.; Wu, B. Relative roles of dynamic and thermodynamic processes in causing evolution asymmetry between El Nino and La Nina. J. Clim. 2016, 29, 2201–2220. [Google Scholar] [CrossRef]
  90. Standardized Precipitation Index (SPI). Available online: https://climatedataguide.ucar.edu/climate-data/standardized-precipitation-index-spi (accessed on 16 August 2020).
  91. Wigneron, J.P.; Fan, L.; Ciais, P.; Bastos, A.; Brandt, M.; Chave, J.; Saatchi, S. Tropical forests did not recover from the strong 2015–2016 El Niño event. Sci. Adv. 2020, 6, eaay4603. [Google Scholar] [CrossRef] [Green Version]
  92. McLauchlan, K.; Higuera, P.; Miesel, J.R.; Rogers, B.M.; Schweitzer, J.; Shuman, J.K.; Tepley, A.J.; Varner, J.M.; Veblen, T.T.; Adalsteinsson, S.A.; et al. Fire as a fundamental ecological process: Research advances and frontiers. J. Ecol. 2020, 108, 2047–2069. [Google Scholar] [CrossRef]
  93. Olchev, A.; Gravenhorst, G. Effects of climate changes on net ecosystem exchange of CO2 and evapotranspiration of a tropical rain forest. Geogr. Rev. Jpn. Ser. B 2015, 87, 122–130. [Google Scholar] [CrossRef]
  94. Esquivel-Muelbert, A.; Baker, T.R.; Dexter, K.G.; Lewis, S.L.; Brienen, R.J.; Feldpausch, T.R.; Lloyd, J.; Monteagudo-Mendoza, A.; Arroyo, L.; Álvarez-Dávila, E.; et al. Compositional response of Amazon forests to climate change. Glob. Chang. Biol. 2019, 25, 39–56. [Google Scholar] [CrossRef] [Green Version]
  95. Esquivel-Muelbert, A.; Bennett, A.C.; Sullivan, M.J.P.; Baker, J.C.A.; Gavish, Y.; Johnson, M.O.; Wang, Y.; Chambers-Ostler, A.; Giannichi, M.L.; Gomes, L.; et al. A spatial and temporal risk assessment of the impacts of El Niño on the tropical forest carbon cycle: Theoretical framework, scenarios, and implications. Atmosphere 2019, 10, 588. [Google Scholar] [CrossRef] [Green Version]
  96. Cai, W.; Borlace, S.; Lengaigne, M.; Van Rensch, P.; Collins, M.; Vecchi, G.; Timmermann, A.; Santoso, A.; McPhaden, M.J.; Wu, L.; et al. Increasing frequency of extreme El Niño events due to greenhouse warming. Nat. Clim. Chang. 2014, 4, 111–116. [Google Scholar] [CrossRef] [Green Version]
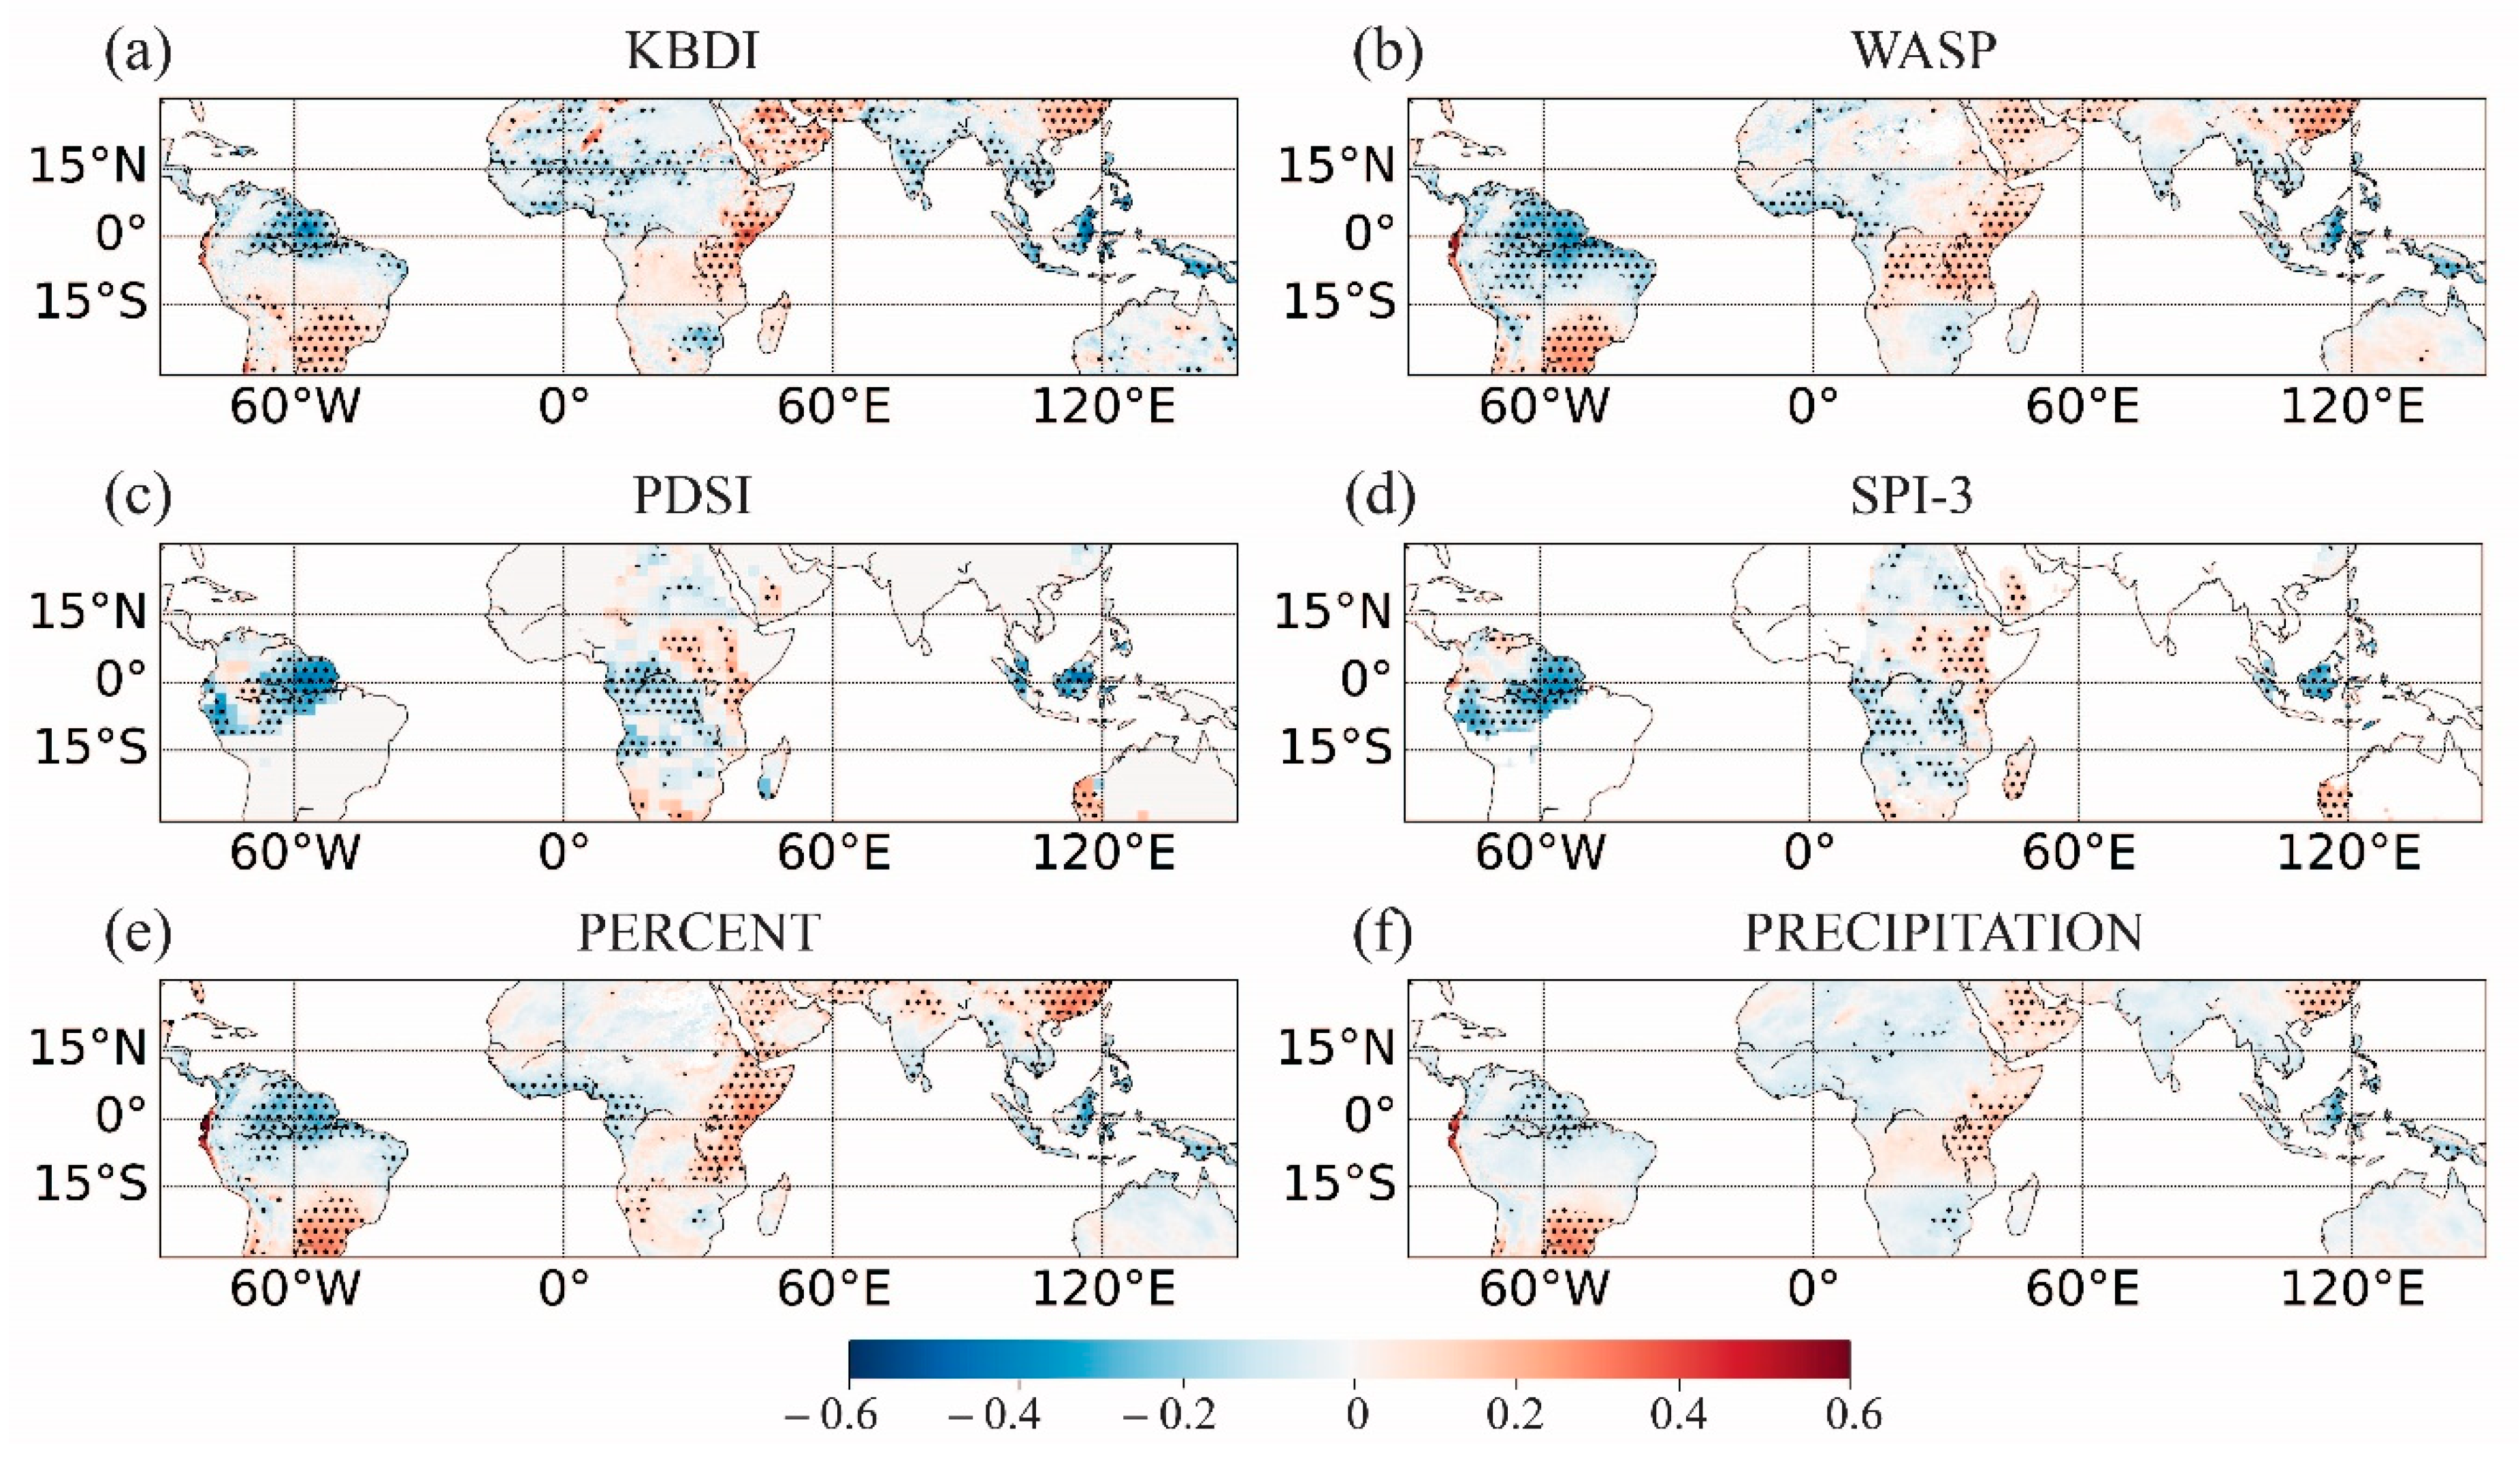
Figure 1. Correlation coefficients between the Eastern Pacific (EP) El Niño and the dryness indices: Keetch–Byram Drought Index (KBDI) (a), Weighted Anomaly Standardized Precipitation Index (WASP) (b), Palmer Drought Severity Index (PDSI) (c), Standardized Precipitation Index using 3-month averages (SPI-3) (d), Percent of Normal Precipitation (PERCENT) (e), and precipitation (f). The hatched areas correspond to a significant correlation at the 95% confidence level.
Atmosphere 11 01354 g001
Figure 2. Correlation coefficients between the Central Pacific (CP) El Niño and the dryness indices: KBDI (a), WASP (b), PDSI (c), SPI-3 (d), PERCENT (e), and precipitation (f). The hatched areas correspond to a significant correlation at the 95% confidence level.
Atmosphere 11 01354 g002
Figure 3. Correlation coefficients between La Niña and the dryness indices: KBDI (a), WASP (b), PDSI (c), SPI-3 (d), PERCENT (e), and PRECIPITATION (f). The hatched areas correspond to a significant correlation at the 95% confidence level.
Atmosphere 11 01354 g003
Figure 4. The Walker circulation cell (averaged between 5° S–5° N) in DJF (December, January, February). The composites for (a) EP El Niños, (b) CP El Niños, and (c) La Niñas (see Table 1 for the selected events). The arrows are the vectors of the wind velocity: divergent zonal wind (m/s) along the horizontal axes, pressure vertical velocity (×10−2 Pa/s) along the vertical axes; the color field is the value of the pressure vertical velocity (×10−2 Pa/s).
Atmosphere 11 01354 g004
Figure 5. The Hadley circulation cell over (a,d,g) Indonesia and Australia (averaged between 90–160° E); (b,e,h) Africa (averaged between 20° W–50° E); (c,f,i) South America (averaged between 30–80° W) in DJF. The composites are for EP El Niños (left column), CP El Niños (middle column), and La Niñas (right column) (see Table 1 for the selected events). The arrows are the vectors of wind velocity: divergent meridional wind (m/s) along the horizontal, pressure vertical velocity (×10−2 Pa/s) along the vertical; the color field is the value of the pressure vertical velocity (×10−2 Pa/s).
Atmosphere 11 01354 g005
Figure 6. The composites of dryness indices during DJF (left column) and MAM (March, April, May) (right column) seasons of the EP El Niño years (see Table 1 for selected events).
Atmosphere 11 01354 g006
Figure 7. The same as Figure 6 but for JJA (June, July, August) (left column) and SON (September, October, November) (right column) seasons.
Atmosphere 11 01354 g007
Figure 8. The composites of the linear (left column: a,c,e,g,i) and non-linear (right column: b,d,f,h,j) responses of the dryness indices to the ENSO during DJF. The linear response was estimated as El Niño − La Niña; the non-linear response as 0.5 × (El Niño + La Niña).
Atmosphere 11 01354 g008
Table 1. The time intervals of the El Niño Southern Oscillation (ENSO) events that were used in our study.
Eastern Pacific El NiñoCentral Pacific El NiñoLa Niña
1982–19831990–19911984–1985
1986–19871991–19921988–1989
1987–19881994–19951995–1996
1997–19982002–20031998–1999
2015–20162004–20052000–2001
2018–20192009–20102005–2006
2007–2008
2010–2011
2011–2012
2016–2017
Publisher’s Note: MDPI stays neutral with regard to jurisdictional claims in published maps and institutional affiliations.