Article

The Lagged Effect of Anthropogenic Aerosol on East Asian Precipitation during the Summer Monsoon Season

1
National Center for AgroMeteorology, Seoul 08826, Korea
2
Department of Marine Science and Convergent Technology, Hanyang University, Ansan 15588, Korea
*
Author to whom correspondence should be addressed.
Atmosphere 2020, 11(12), 1356; https://doi.org/10.3390/atmos11121356
Submission received: 16 November 2020 / Revised: 2 December 2020 / Accepted: 8 December 2020 / Published: 14 December 2020
(This article belongs to the Special Issue Aerosol-Climate Interaction)

Abstract

:
The authors investigated the lagged effect of anthropogenic aerosols (AAs) during the premonsoon season (April–May–June) on the East Asian precipitation during the postmonsoon season (July–August) using the aerosol optical depth (AOD) from a satellite dataset and reanalysis datasets. When the AOD is high in Eastern China during the premonsoon season, the amount of precipitation increases in the western North Pacific, including the Korean Peninsula and Japan, during the postmonsoon season. The amount of cloud in the western-to-central North Pacific in the premonsoon season increases during the high-AOD period. Subsequently, it cools the sea surface temperature until the postmonsoon season, which strengthens the North Pacific High. The strengthened North Pacific High in the postmonsoon season expands to the western North Pacific, which leads to the enhancement of the moisture flows from the ocean. This results in the increase in precipitation in the western North Pacific, including the Korean Peninsula and Japan, during the postmonsoon season.

1. Introduction

Anthropogenic aerosols (hereafter, AAs), which include sulfate, nitrate, black carbon, and organic carbon, can change atmospheric conditions in many complex ways [1]. Among them, some AAs, such as sulfate, nitrate, and organic carbon, have a radiative property that scatters incoming solar radiation, and they directly lead to a negative radiative forcing. In contrast, black carbon absorbs incoming solar radiation, which directly leads to positive radiative forcing. There is a lot of previous literature on AAs and their radiative properties [2,3,4]. While the direct effect of AAs may cause the earth’s surface cooling or atmospheric heating by scattering or absorbing solar radiation [5,6], respectively, there are complex mechanisms. For example, long-wave radiation changes due to AA forcing also matter [7]. Although low clouds can be induced by changes in lower tropospheric stability and surface heating due to AA forcing [8,9], their changes are more complicated and are not well understood [10,11]. AAs also act as cloud condensation nuclei or ice nuclei, which are associated with cloud properties, such as cloud lifetime and cloud albedo [12,13,14]. An indirect effect of AAs is being able to significantly modify the radiative balance on the earth’s surface; therefore, this leads to changes in atmospheric circulation and precipitation amount. It is also known that a reduced cloud effective radius, due to an increase in the amount of cloud condensation nuclei by a high concentration of AAs, can invigorate convection [15].
East Asia, including China, is one of the major sources of atmospheric pollutants [16,17]. While AA emissions in East Asia have increased consistently after industrialization [18,19,20], the concentration of AAs has been declining since the late 1990s because of the reduction in economic growth and strong regulations on aerosol emissions [18,21]. In detail, satellite dataset indicates that emissions in primary aerosols, SO2 and NOx, started to decline after 2011–2013 in East Asia [22]. In spite of that, there are a number of studies on the role of AA forcing on atmospheric circulation and precipitation amount in East Asia.
The trend of East Asian summer rainfall has been affected by an increase of AA concentration during the last few decades [23,24,25,26,27]. The direct effect of AAs may lead to a surface cooling trend in China, which results in a decrease in the thermal contrast between marine and intercontinental regions during summer; thus the intensity of the East Asian summer monsoon (EASM) has weakened [28,29,30,31,32]. Subsequently, a weakening of the EASM by AA forcing can cause a decrease of precipitation in northern China and an increase of precipitation in southern China, so-called “north drought and south flood” [32,33,34,35]. In addition, more absorptive dust aerosols with a stronger radiative heating effect inhibit more convective Meiyu precipitation by reducing the meridional temperature gradient, resulting in a weakening of the EASM [36]. Mu and Wang [37] also argued that aerosol forcing leads to the weakening of the EASM circulation and decreases in precipitation via upper-tropospheric cooling in the midlatitudes of East Asia by AA forcing. In contrast, Kim et al. [24] argued that surface cooling by the direct effect of AA forcing acts to decelerate the jet stream. When the jet is decelerated, subsequently, the magnitude of a zonal gradient of the zonal wind becomes smaller, and the northerly ageostrophic flow at the jet exit region also becomes weaker. Thus, anomalous upper-level divergence and lower-level convergence can be induced at the south of the jet exit region, which induce the increase of rainfall amount in East Asia during boreal summer (i.e., a strong EASM). Some studies also argued that the precipitation in northern China increases due to the enhancement of the western North Pacific subtropical high through the semidirect effect and indirect effect of AAs [38,39]. These results indicate that the issue of how AA interacts with the precipitation variability in East Asia during summer is still under debate, which requires further understanding of the effect of AA forcing.
Here, we investigate the influence of AAs in late spring and early summer (i.e., premonsoon season) on precipitation during the following late summer (i.e., postmonsoon season) in East Asia by analyzing aerosol optical depth (AOD) datasets and reanalysis datasets. Previous studies found that distinct differences exist in precipitation and atmospheric mean states between the early summer and late summer in East Asia [40,41,42]. For instance, Wang et al. [41] suggested that the summer rainfall season in East Asia can be divided into premonsoon season and postmonsoon season. In spite of a wealth of studies on the effect of AA forcing on East Asian precipitation, however, there are few studies of the lagged effect of AA on East Asian precipitation during the pre- and postmonsoon seasons. We analyzed how the East Asian precipitation in the postmonsoon season is associated with the concentration of AAs in the premonsoon season. Understanding the lagged relationship on the effect of AA forcing could be used to predict the amount of precipitation in East Asia in the postmonsoon season.
The paper is organized as follows: We describe the analyzed datasets in Section 2. Based on observations from the analyzed datasets, the influence of AAs on the East Asian precipitation during the postmonsoon season is discussed in Section 3. A summary is given in Section 4.

2. Data and Methodology

We used the monthly AOD observations at 550 nm and the cloud fraction, derived from Moderate Resolution Imaging Spectroradiometer (MODIS) Terra satellites for the years 2000–2017 (available from March 2000). AOD, which reflects an incoming shortwave radiation reaching the surface by aerosol scattering and absorption in the atmosphere, is a measurement of the integrated quantity of aerosols in the vertical column. As satellite and ground-based observations have improved, the global distribution of AOD over relatively long timescales can be obtained [43,44,45,46]. Because AOD is a proxy for the absorption feature of AAs, the indirect effects of AAs cannot be measured by AOD. In spite of this limitation, AOD is widely used to examine the role of aerosols on atmospheric phenomena because of a reliable satellite dataset for a long period of time [22,36,37,47,48].
A dataset of monthly precipitation was obtained from the Global Precipitation Climatology Project (GPCP) version 2.3 (https://www.esrl.noaa.gov/psd/data/gridded/data.gpcp.html) for the period 2000–2017 [49]. We analyzed surface net solar radiation (SSRD), 2m surface air temperature (SAT), surface latent heat flux, u- and v-component wind speed, specific humidity, and mean sea level pressure (SLP) from the European Centre for Medium-Range Weather Forecasts interim (ERA-interim) reanalysis monthly data (https://apps.ecmwf.int/datasets/) [50] to estimate their relationship with AA concentration.
To explore the variability of AA concentration in East Asia during the premonsoon season (April–May–June, hereafter, AMJ), we introduced the AOD index defined as an area-averaged AOD in East Asia (110.5–122.5° E, 22.5–40.5° N; a green box in Figure 1a). The normalized AOD index during AMJ was also used in the composite analysis to estimate the relationship with other atmospheric variables. The normalized AOD index during AMJ is defined as follows:
N o r m a l i z e d   A O D   i n d e x =   A O D   i n d e x   [ 110.5 122.5 °   E ,   22.5 40.5 °   N ]   μ   ( A O D   i n d e x )   σ   ( A O D   i n d e x )
where μ   ( A O D   i n d e x )   and σ   ( A O D   i n d e x ) indicate the time mean of the AOD index and one standard deviation of the AOD index, respectively.
We selected the high- and low-AOD years during AMJ based on a 0.75 standard deviation of the normalized AOD index to obtain a larger number of samples in a limited period. Note that the main results are little changed when one standard deviation is used to select the high- and low-AOD years (figures not shown).

3. Results

Figure 1a shows the global mean AOD during the premonsoon season (AMJ) from 2000 to 2017. It was found that AOD is high in West Africa, the Himalayas, and East Asia. In particular, the highest AOD was observed in East Asia, including Eastern China. It is noteworthy that the climatological (2000–2017) AOD in the Northwestern Pacific is also high, which may be due to the advection of AAs from Eastern China by the climatological westerlies in the midlatitudes. Figure 1b displays the time series of a normalized AOD index during AMJ with and without a linear trend for 2000–2017. Note that the climatological monthly AOD index is the highest in East Asia during AMJ (figure not shown). It was found that the AOD gradually increases until the mid-late 2000s, and then decreases until 2017, which is consistent with the findings of previous studies [51,52,53]. Therefore, a linear trend of AOD for 2000–2017 (–0.004/yr) was not statistically significant. Such a negligible trend is mostly due to the decrease of AOD since after the mid-late 2000s [54,55]. Hereafter, we used the normalized AOD index with the linear trend removed. Note that there is little change in the main results when using the AOD index with and without a linear trend.
To examine the influence of AAs during AMJ on the precipitation variability in East Asia during the postmonsoonal season (July–August, JA), we first selected the high- and low-AOD years following the method described in Section 2. The high-AOD years during AMJ include 6 years (2003, 2007, 2008, 2011, 2012, and 2014), and the low-AOD years include 5 years (2000, 2004, 2015, 2016, and 2017). Figure 1c shows the composite difference of AOD during AMJ between two periods (high-AOD years minus low-AOD years), in which its spatial structure is similar to that of the climatological AOD structure during AMJ (Figure 1a) [56,57,58].
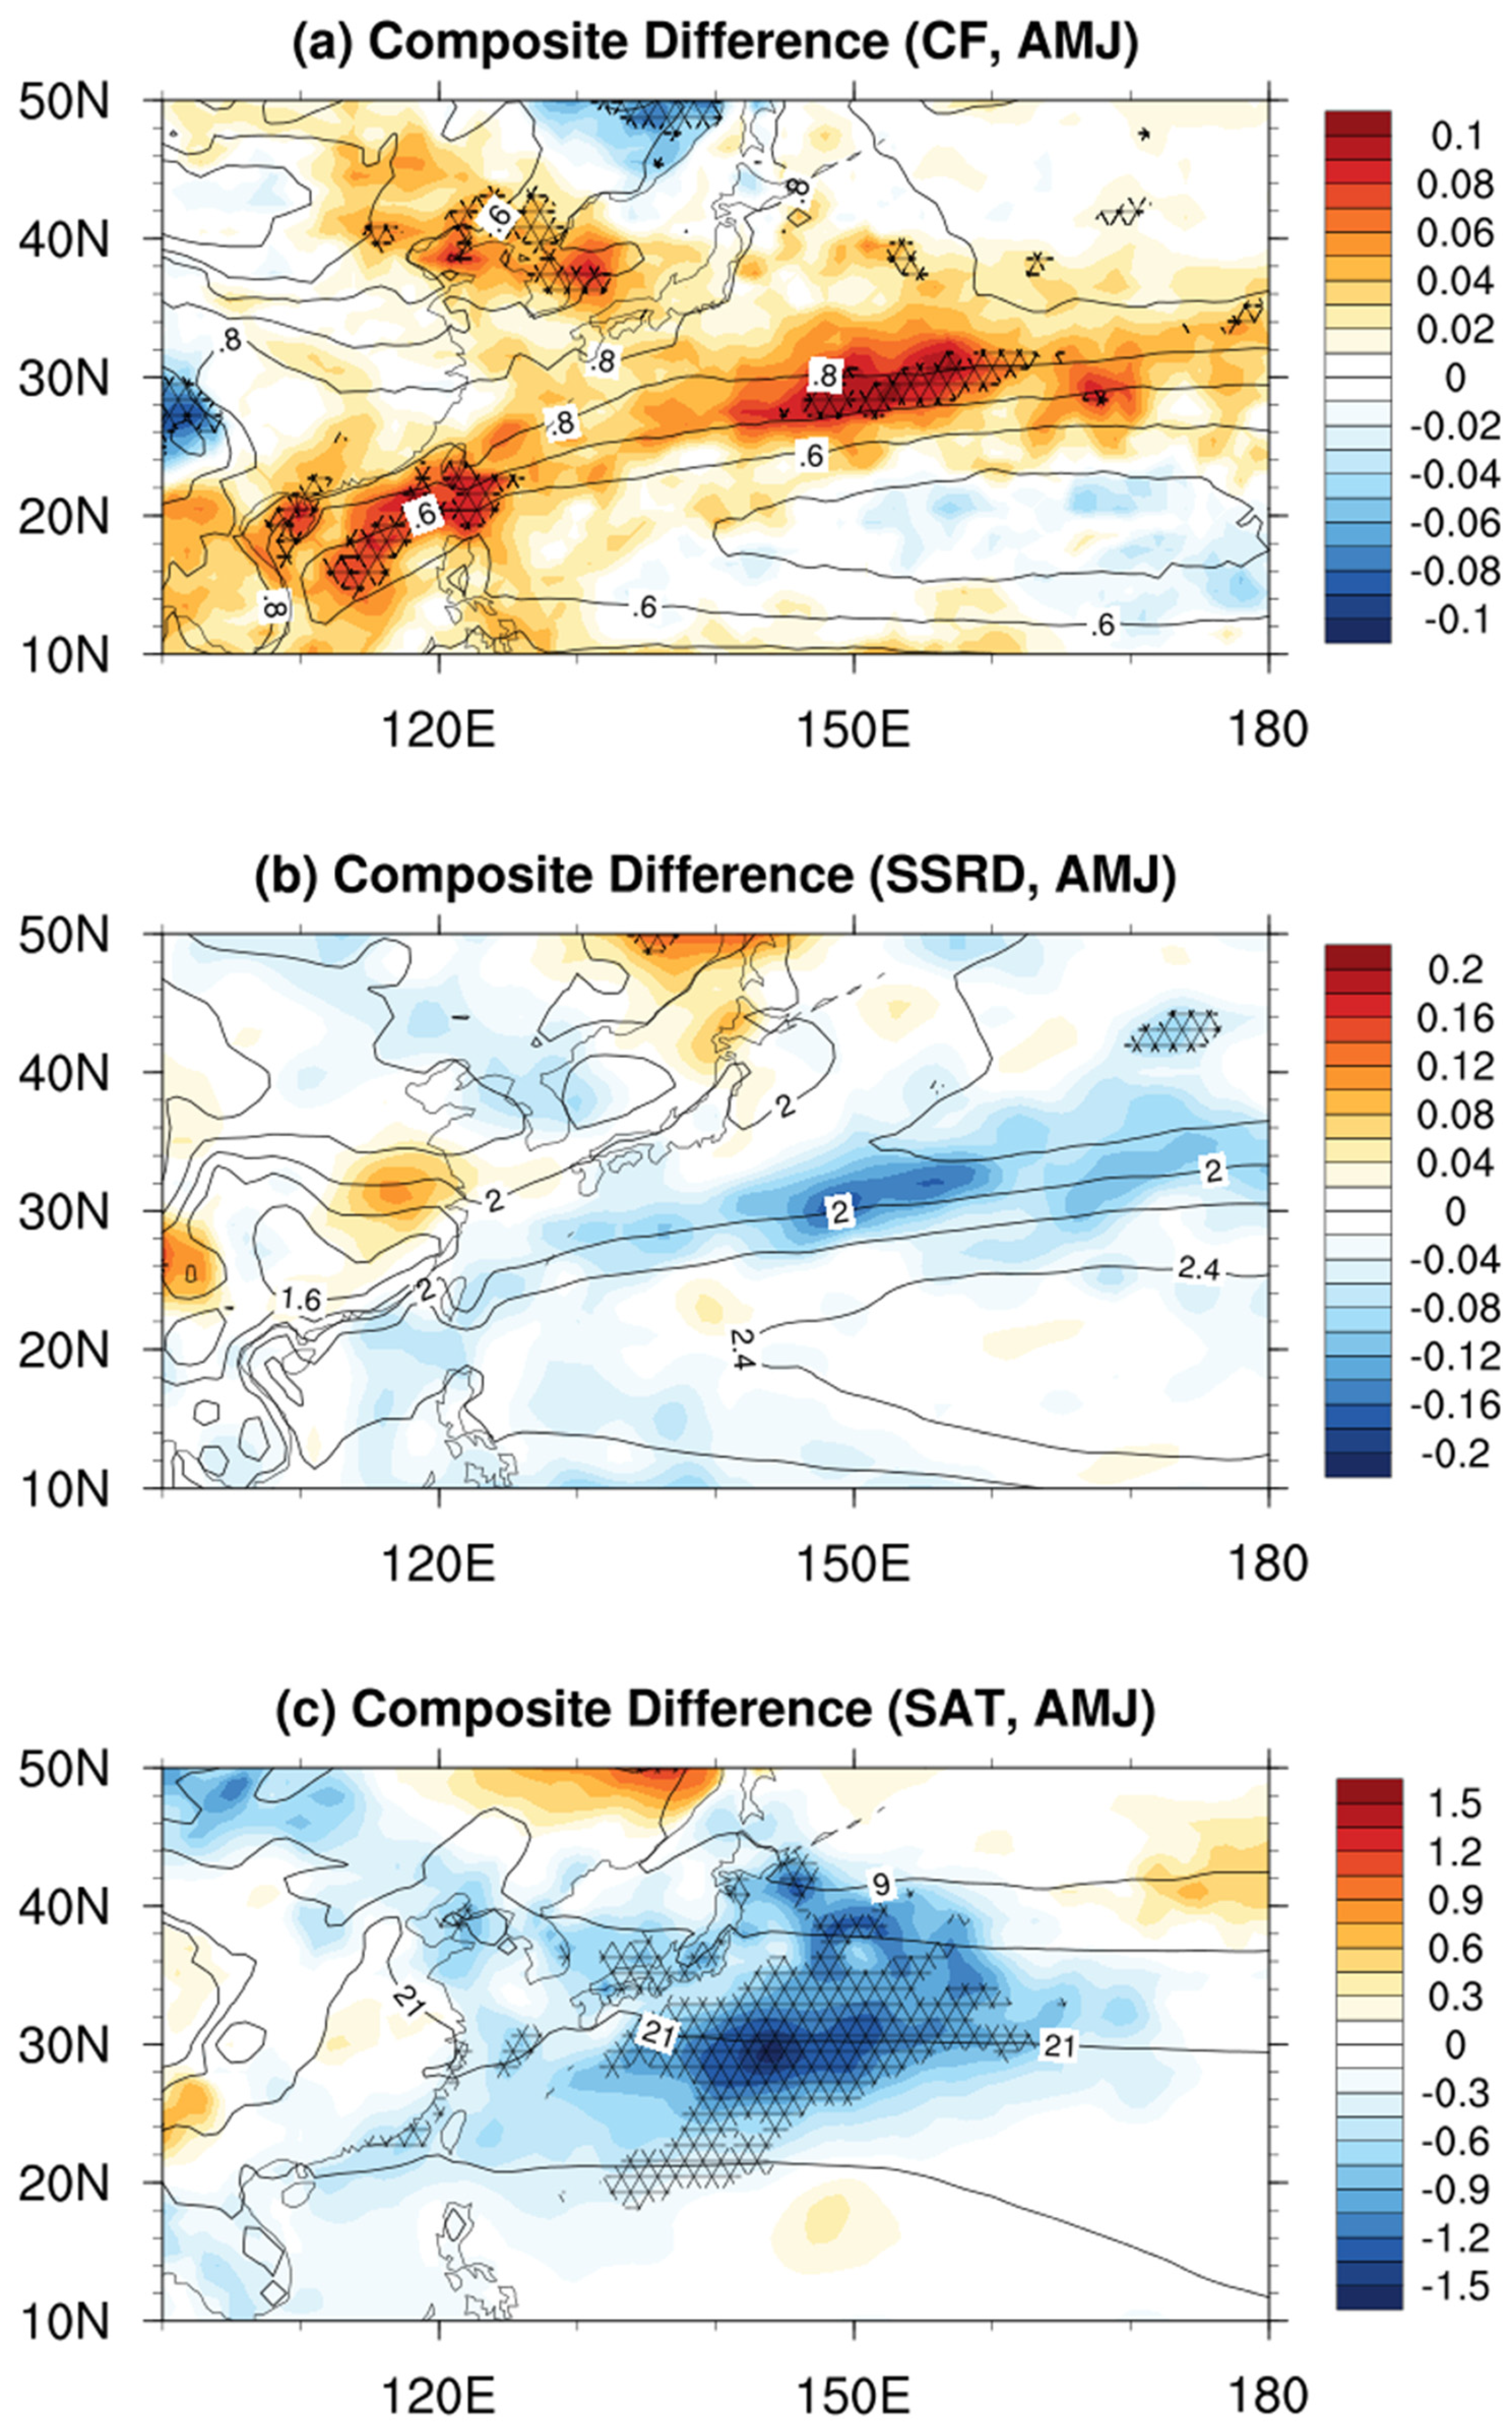
We further calculated the composite differences of several atmospheric variables in AMJ between two periods (Figure 2a–c). It was found that the cloud fraction increases in the western North Pacific with its center of maximum around 30° N during the high-AOD period compared with that during the low-AOD period (Figure 2a). The region where the cloud fraction significantly increases during the high AOD is slightly shifted to the south compared with the region where the AA concentration mainly increases (Figure 1c). This may be due to the fact that the climatological cloud fraction is high in the western North Pacific around 30° N during AMJ (Figure 2a). Despite the fact that the main region of the AOD increase is above 40° N (Figure 1c), a large increase in cloud fraction in high-AOD years was observed in the western North Pacific around 25° N–40° N, where the climatological cloud fraction is high.
We infer that an increase of AA concentration causes the enhancement of cloud fraction during AMJ through a hysteresis effect and an indirect effect of AAs [59,60,61,62]. The increase of AA concentration is able to increase the amount of cloud fraction by serving as cloud condensation nuclei, and the interaction with the microphysics [63,64]. Similarly, Zhang et al. [65] suggested that Asian pollution likely accounts for a climatically increased deep convective cloud amount in the western North Pacific on the basis of a satellite observation, which is consistent with the results in Figure 2a. The enhanced cloud amount acts to reflect more downward shortwave radiation, which can be seen in the reduction of SSRD (Figure 2b). Subsequently, it leads to cool SAT in AMJ during the high-AOD period (Figure 2c). That is, the increase in cloud fraction, which is related to AAs’ indirect effects during the high-AOD period, induces a cooling of SAT due to the reflection of incoming solar radiation.
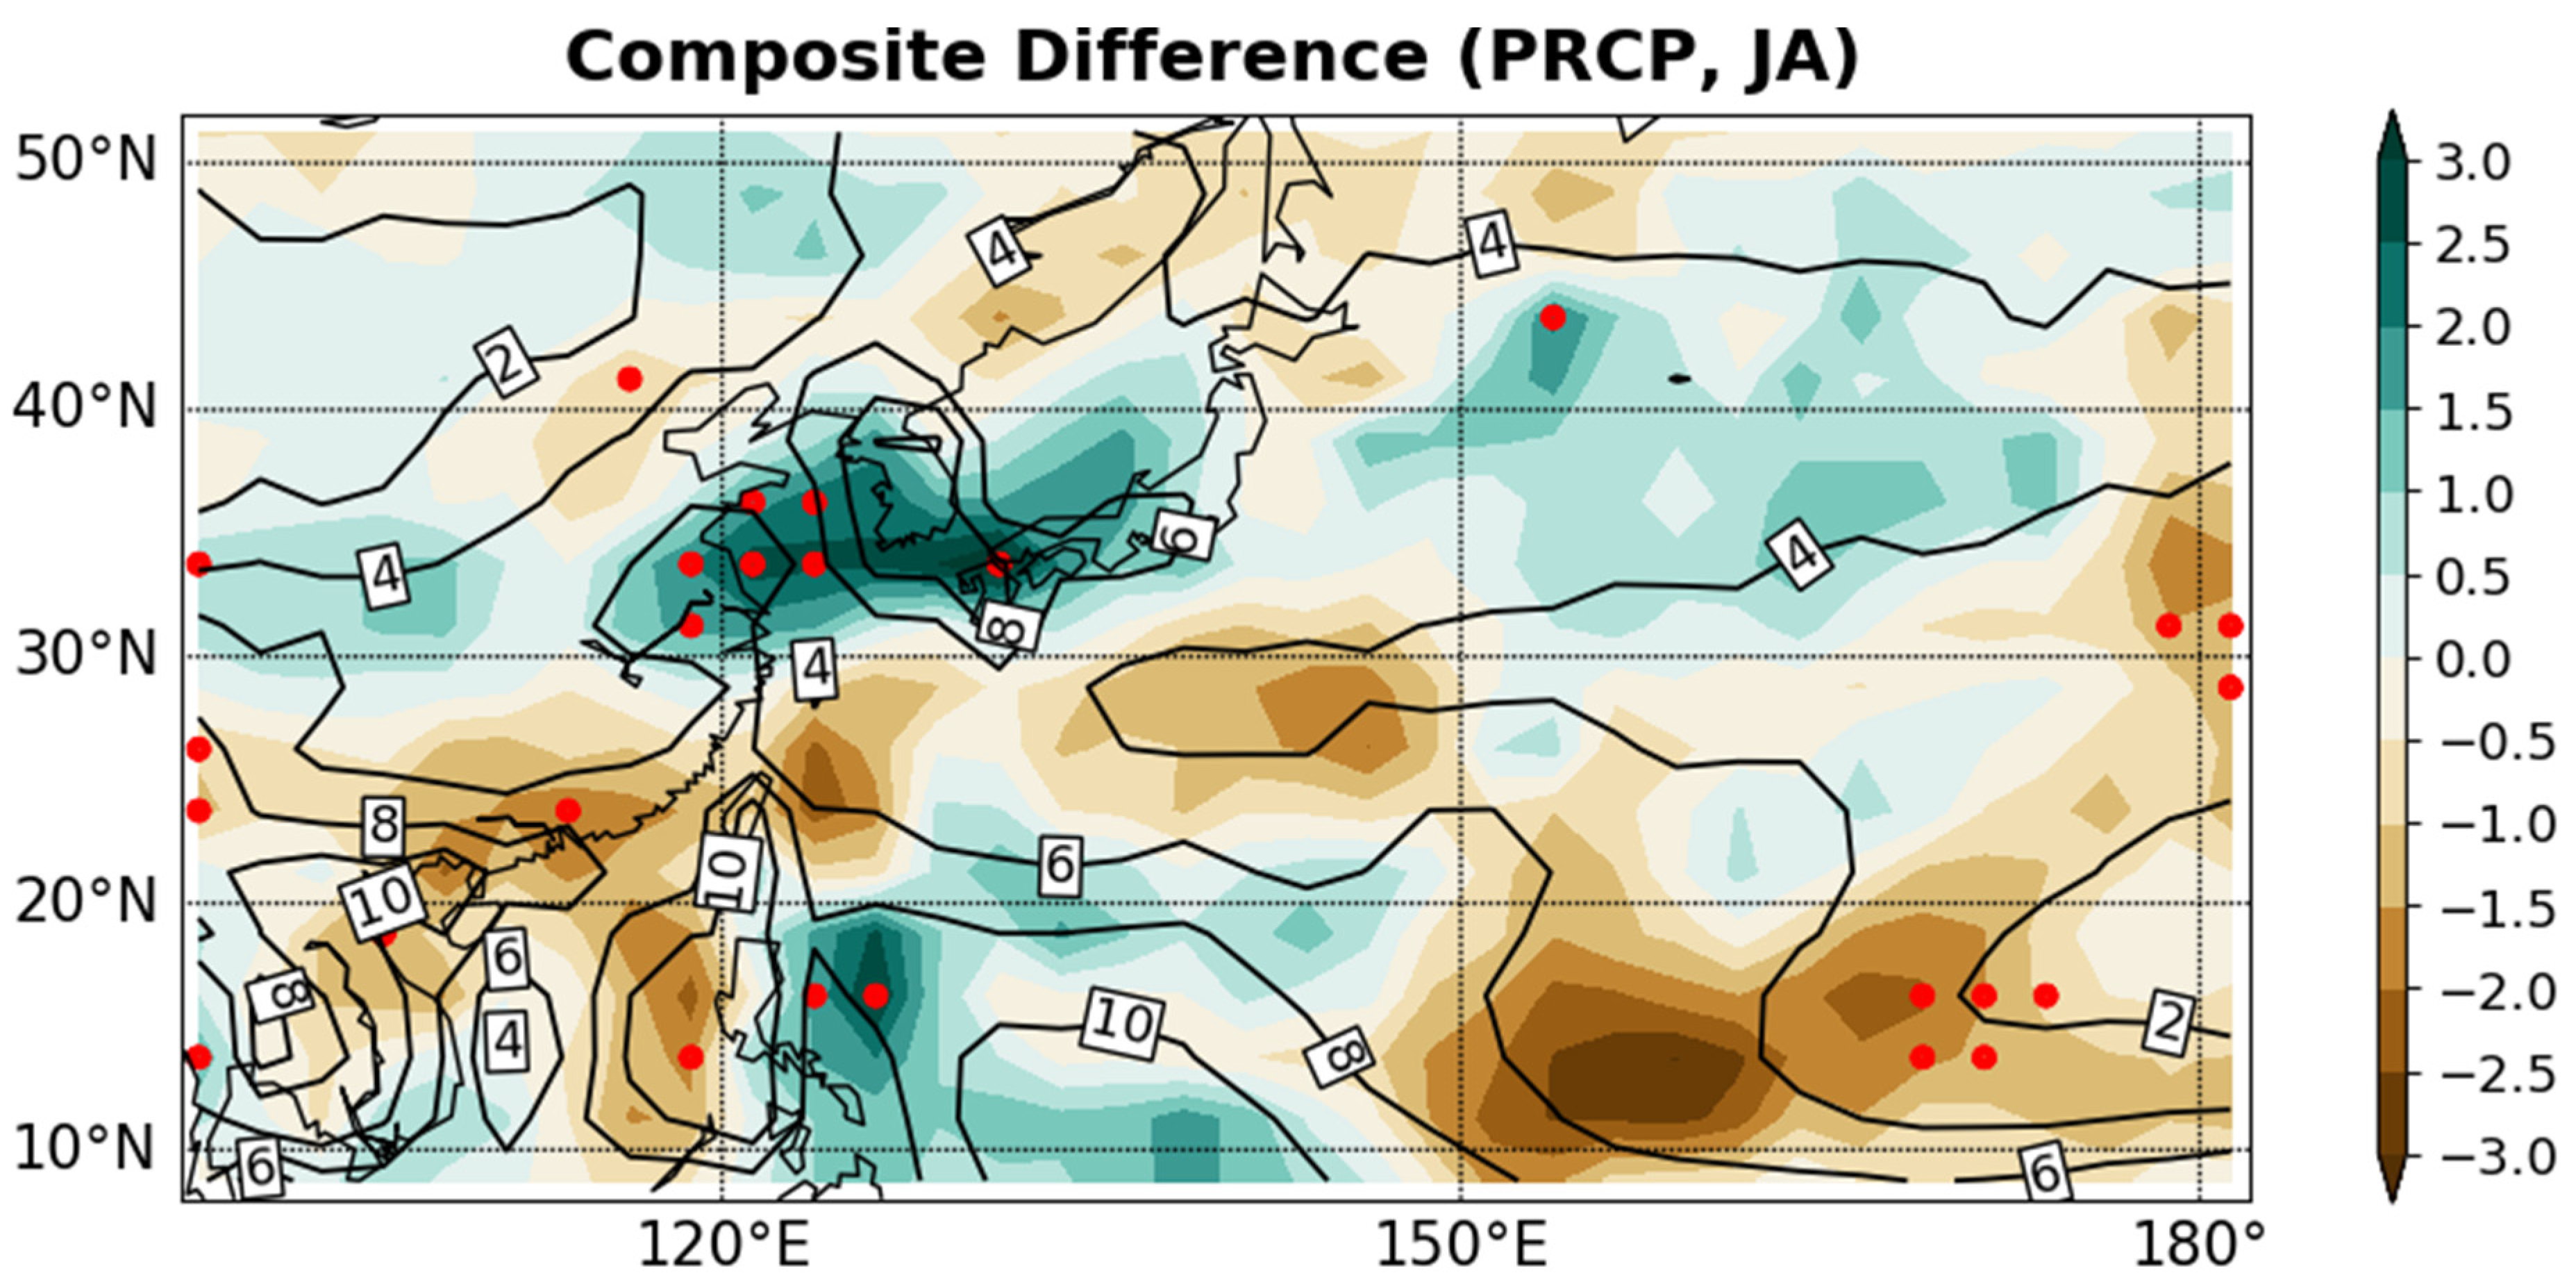
We speculate that such differences of AA concentration in the downstream region—including the western-to-central North Pacific—during the premonsoon season may influence the precipitation amount during the postmonsoon season through the changes in the atmospheric and oceanic conditions with a lagged time. Figure 3 displays the difference of composited precipitation in late summer (July–August, JA) during the high AOD and low AOD. It was found that the increase of precipitation amount during JA tends to be concentrated zonally in an elongated climatological rain belt from Eastern China to the western North Pacific.
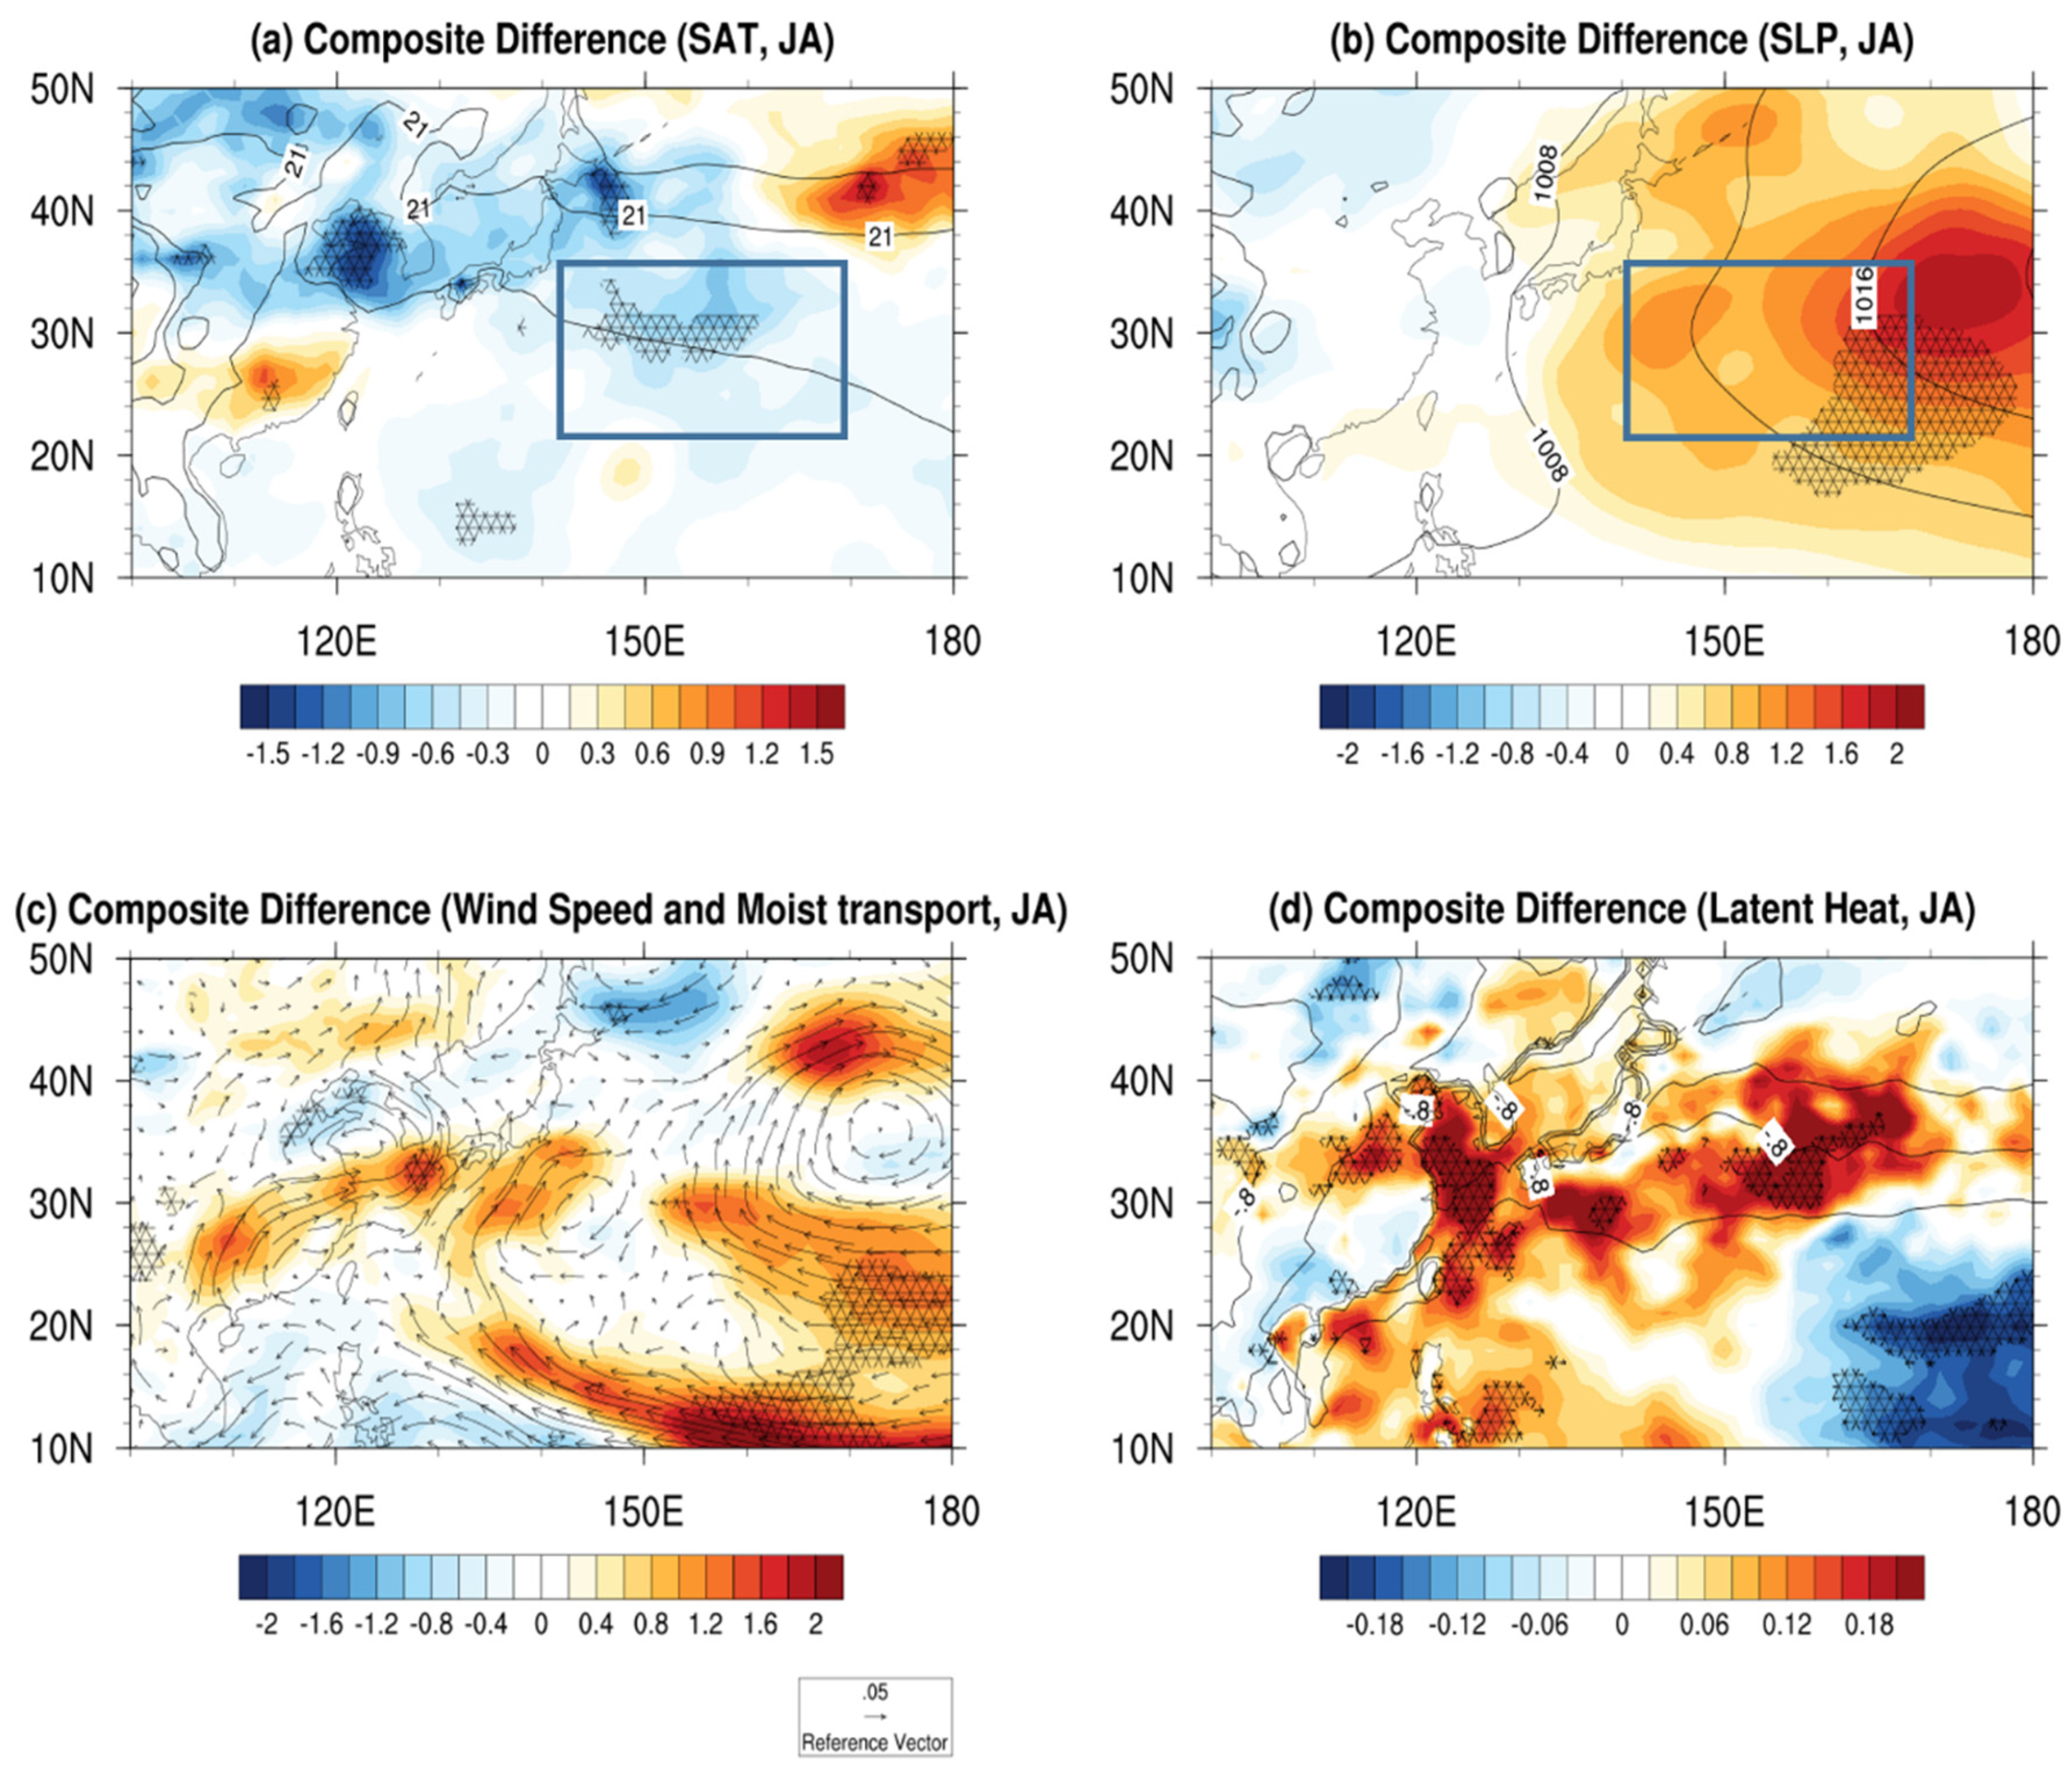
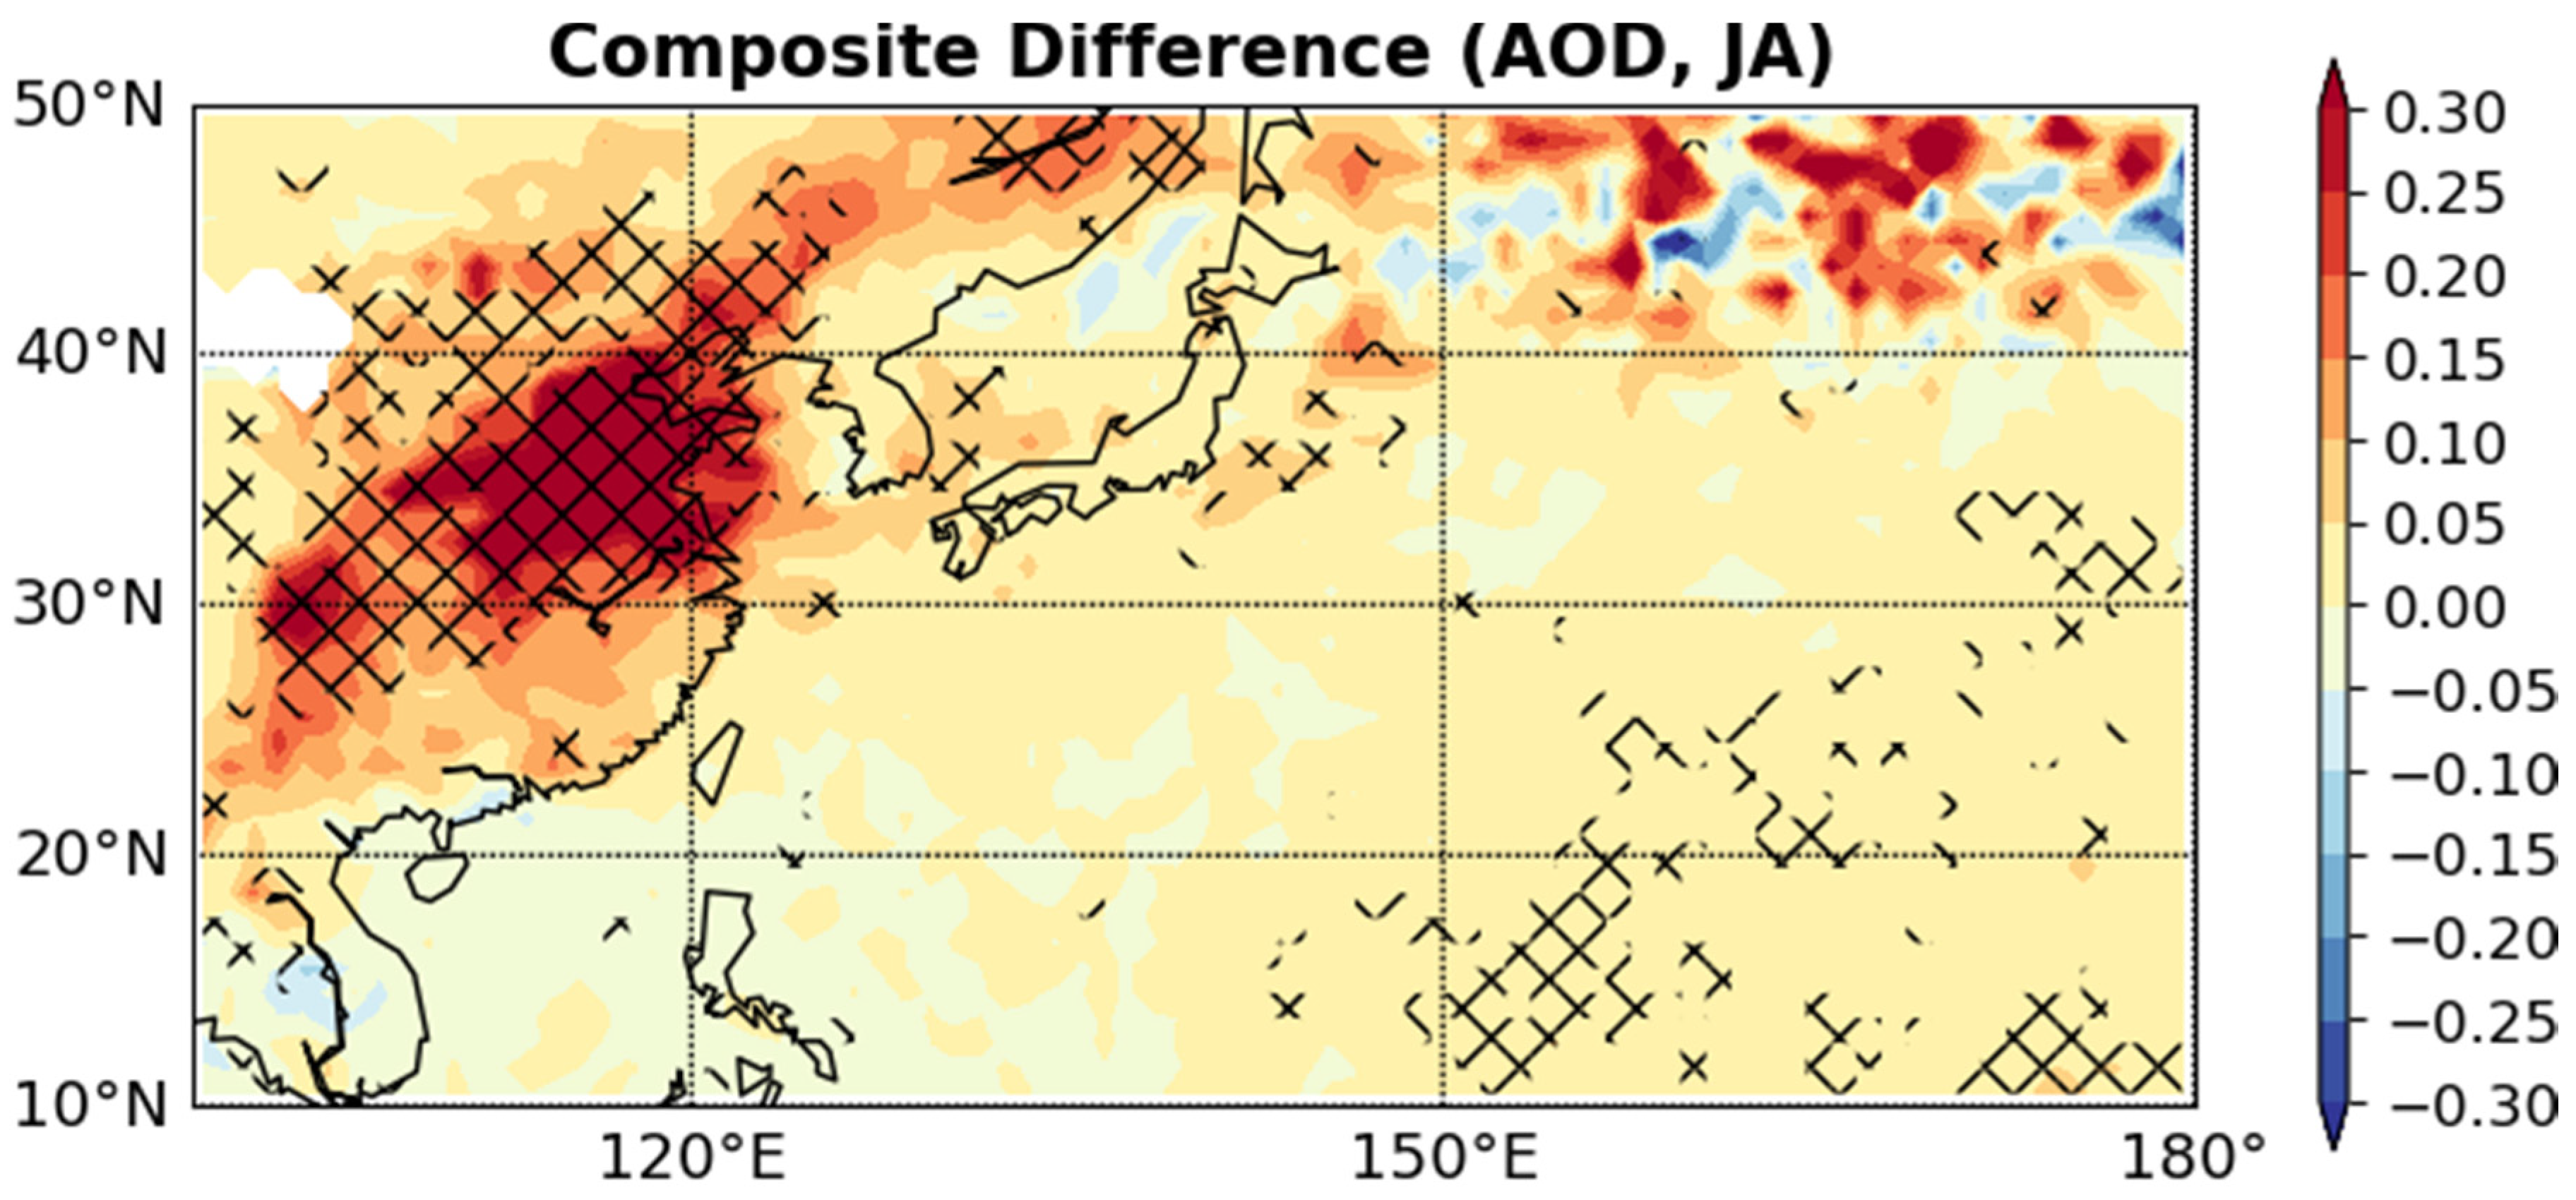
To examine the changes in atmospheric and oceanic variables associated with the difference of AA concentration, we further conducted the composite analysis of atmospheric variables, including SAT, SLP, wind speed, moisture transport, and latent heat flux in JA between two periods (Figure 4). In particular, it was found that the cooling of SAT in AMJ is still dominant until JA in the western North Pacific (Figure 4a). This is mostly due to the large heat capacity of the ocean. In other words, the cooling of SAT in AMJ (Figure 2c), which is mainly due to the reduction of SSRD, persists in JA. It is noteworthy that AOD in JA is not statistically significantly high in the western North Pacific during high-AOD period (Figure 5), which may indicate that the cooling of SAT in JA is not induced by aerosol effects.
A cooling of surface conditions acts to strengthen the intensity of the North Pacific High (Figure 4b) in the western North Pacific (box in Figure 4a,b) via the thermal effect along with the enhancement of lower static stability (figure not shown). Consequently, a center of the North Pacific High is slightly extended to the west (box in Figure 4b). Subsequently, the enhanced North Pacific High can induce stronger southerly winds from the western-to-central subtropical Pacific, which can transport more moisture into East Asia (Figure 4c). This leads to the increase of precipitation amount from Eastern China to the western North Pacific during JA (Figure 3).
Consistently, Figure 4d shows that the increase of latent heat from the ocean to the atmosphere in JA, which is due to the enhanced North Pacific High and its associated wind speed, contributes to the increase of the precipitation amount. Previous studies also argued that a strong North Pacific High causes the transportation of greater moisture flow in East Asia, leading to more precipitation [66]. We argue that the enhanced North Pacific High in JA, which is caused by a high concentration of AAs in AMJ, plays a role in transporting more moisture along with strong wind speeds into western North Pacific, where the amount of precipitation increases in JA (Figure 4c). To statistically support this notion, we also calculate the lead–lag relationship of a concentration of AAs in East Asia (i.e., AOD index, see Figure 1b) during AMJ and the precipitation amount from Eastern China to the western North Pacific (110° E–165° E, 30° N–45° N) during JA. The correlation coefficient was 0.55 for 2000–2017, which is statistically significant at a 95% confidence level. Therefore, the AOD index during AMJ could be used to predict the amount of precipitation in East Asia, including Eastern China, Korea, and Japan, during the postmonsoon season. On the other hand, we speculate that the AOD during AMJ may influence the precipitation during the boreal fall season because of a long memory of the ocean; however, this topic is beyond our scope and needs further study.

4. Summary and Discussion

It has been known that AA affects weather and global atmospheric circulation by altering cloud and precipitation processes, but the detailed physical processes associated with this phenomenon are still under debate with a large uncertainty. In particular, there is considerable attention to understanding the effects of AAs originating from East Asia on a regional climate, including the intensity of the EASM. In spite of a wealth of studies, however, there is less agreement on whether AA forcing increases the amount of precipitation in East Asia during summer or not. While there are some studies emphasizing that AA forcing acts to weaken the EASM through radiative forcing, other studies argue that AA forcing enhances the amount of precipitation in East Asia by altering the atmospheric circulation [24,38,39].
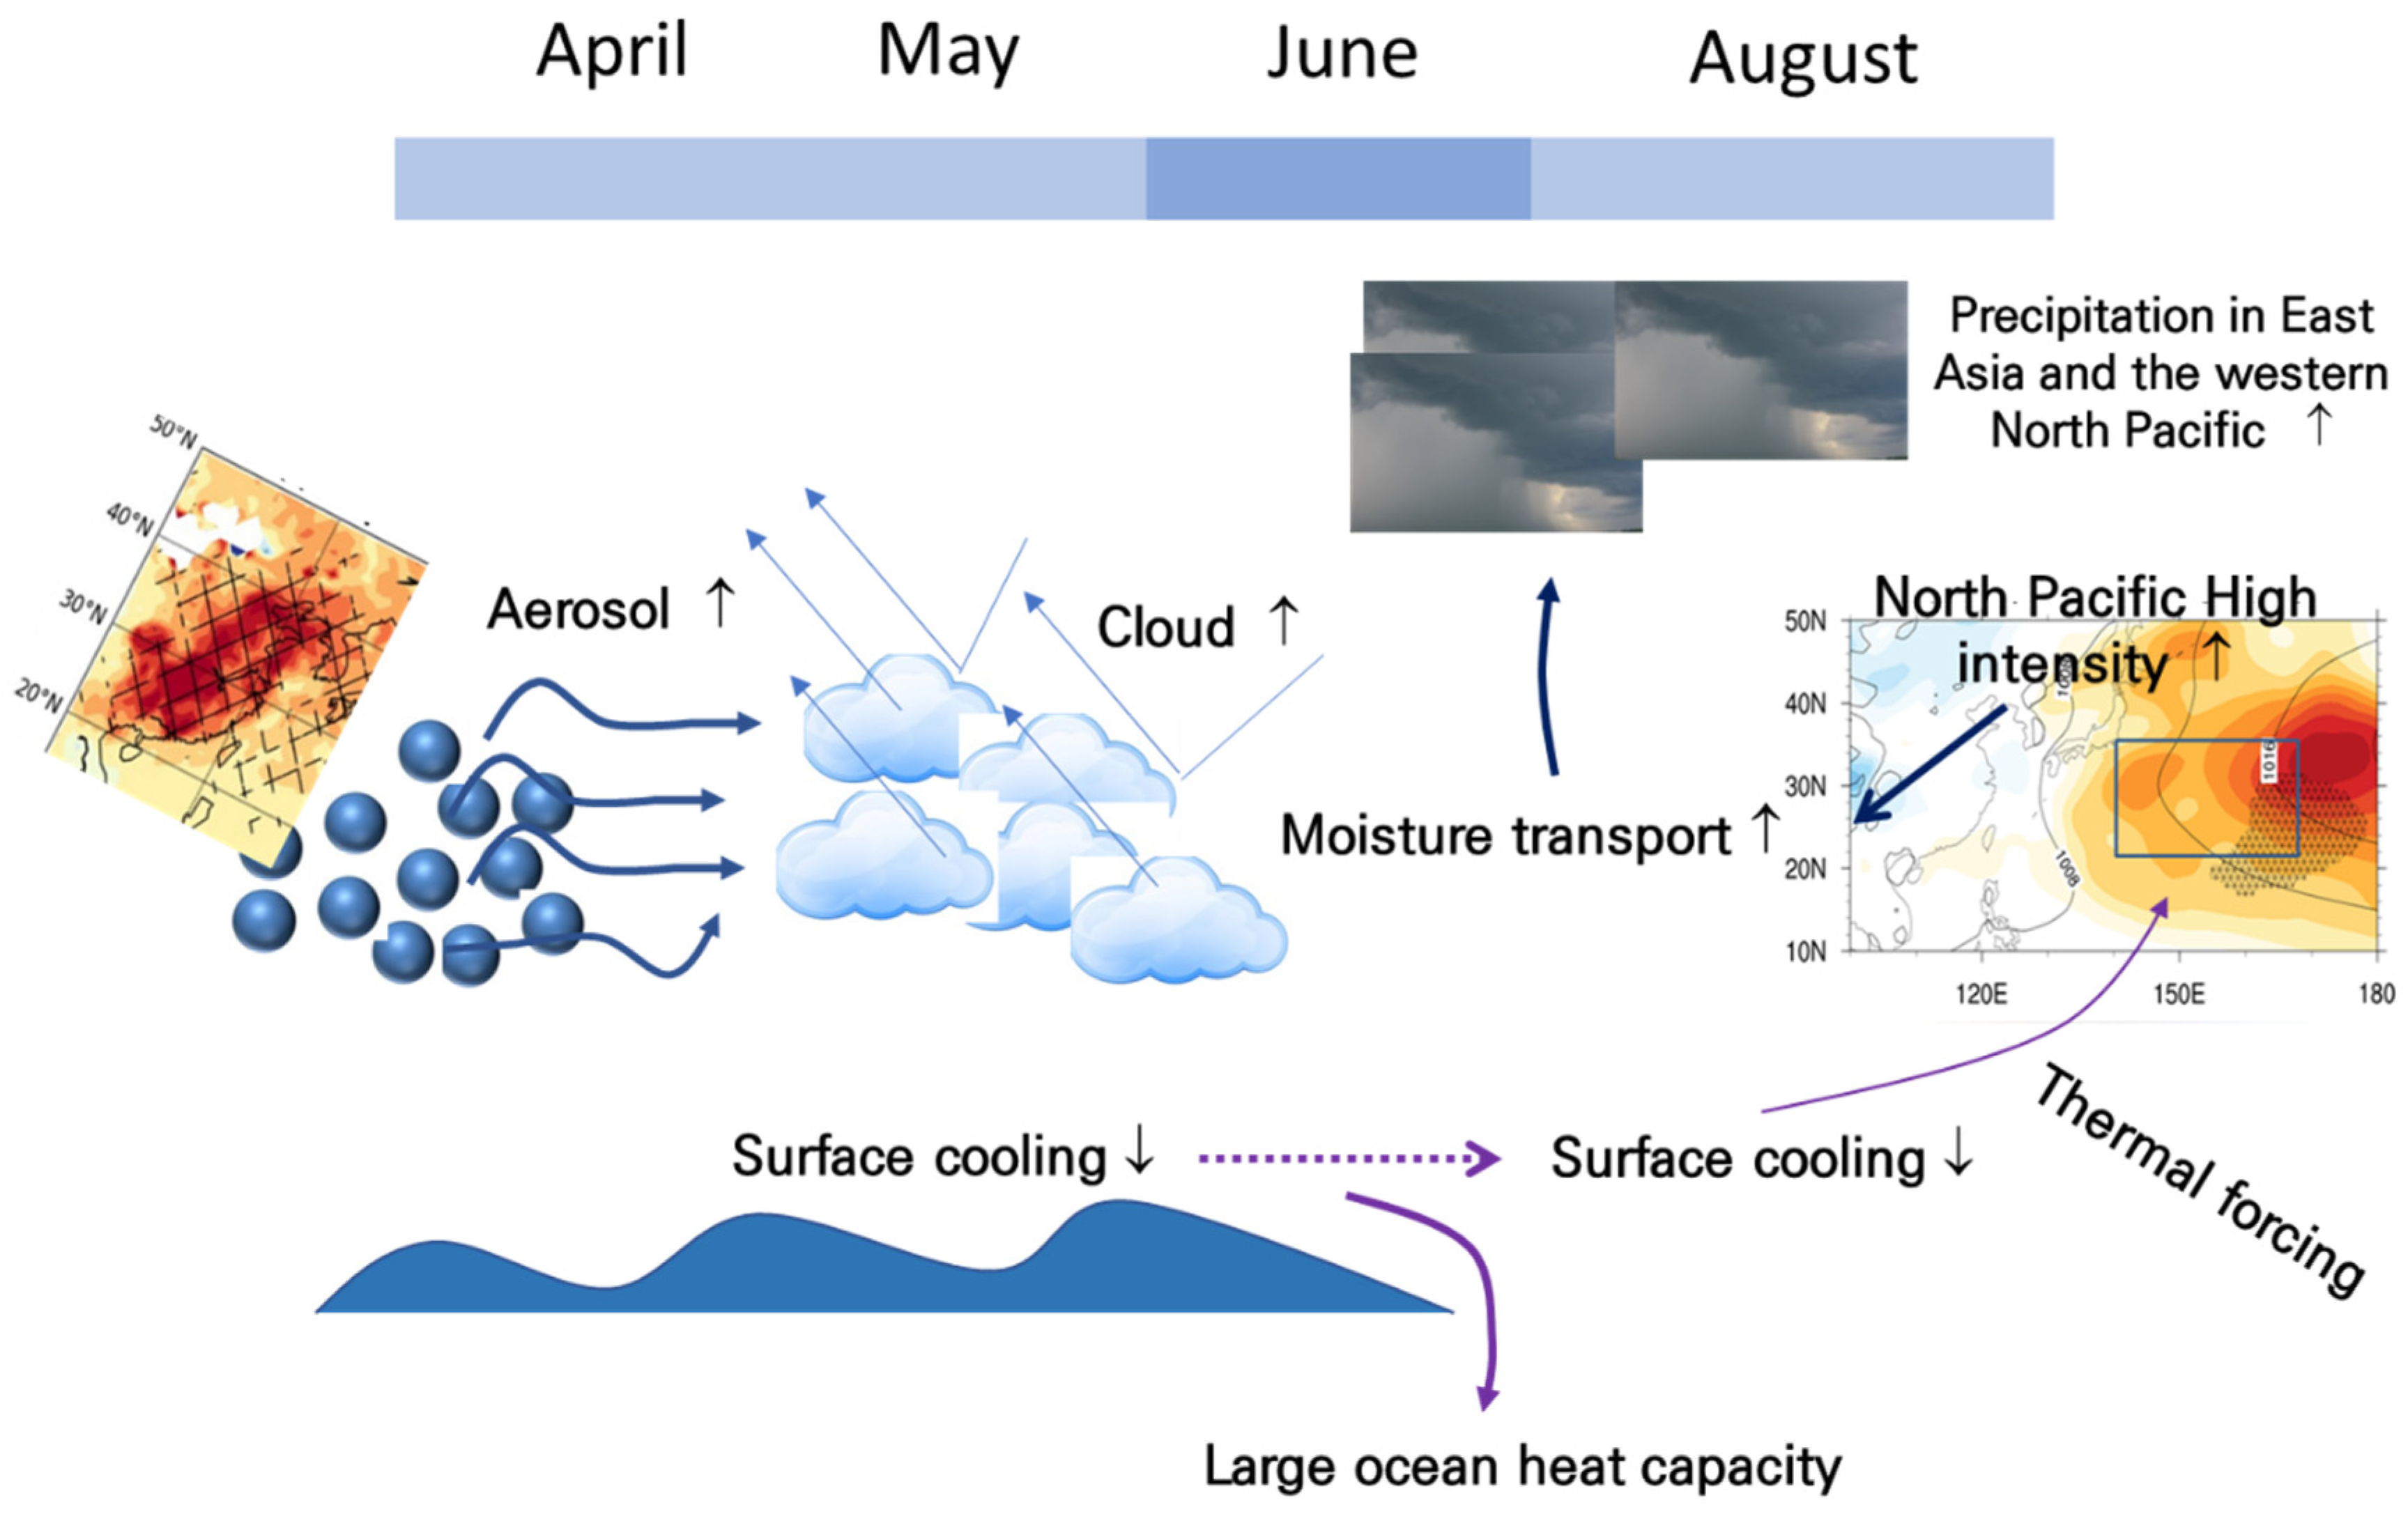
To examine the lagged effect of AAs in the premonsoon season on the precipitation in East Asia during the postmonsoon season, we analyzed two periods (high-AOD period and low-AOD period) using a satellite dataset for the years 2000–2017. We found that the precipitation in JA increases in East Asia, including the Korean Peninsula and Japan, to the western North Pacific during the high-AOD period. We proposed a possible mechanism that increased clouds over the western North Pacific during AMJ, which may be indirectly due to the increase of AA concentration, induce a cool surface temperature in the same region through the reduction of downward shortwave radiation. Such cooling persists in the same region until JA, which can cause the strengthening of the North Pacific High. An enhanced North Pacific High transports more moisture into East Asia, including the western North Pacific, leading to the increase of precipitation during the high-AOD period compared with the low-AOD period (Figure 6). Our result may support the notion that AA forcing in East Asia acts to increase the amount of precipitation in East Asia, including the western North Pacific, during the monsoon season with a lagged time.
It should be noted that the present study is limited to analyzing the observational datasets, including the satellite and reanalysis datasets, based on the composite and correlation analyses. Therefore, there are several caveats that need to be addressed in future studies. For example, the dust aerosol is also important in East Asia, especially in the premonsoon season. Because the AOD obtained from MODIS is not divided for natural dust and AAs, it is hard to identify the role of dust on the East Asian precipitation in the postmonsoon season. In other words, the variability of AOD over East China should not be due to anthropogenic emission change only, and it is partly due to the natural variability. Therefore, it is necessary to separate the natural variability of aerosols, including the dust, from the total variability of AOD. In the present study, the impacts of natural aerosol are essentially removed. It would be useful to examine how frequently in AMJ dust aerosol layers are advected in the western North Pacific using CALIPSO Lidar dataset and the HYSPLIT model [67,68]. In addition, it is useful to consider the response to non-East Asian AA forcing on the East Asian precipitation during summer. Wang et al. [69] argued that non-East Asian AA forcing significantly exacerbates the weakening of the EASM due to local aerosol forcing via the fast atmospheric processes. On the other hand, most results in the present study are based on the composite and correlation analyses, which are lacking in directly proving the physical interactions between the AAs and the precipitation by modifying the atmospheric variables, including cloud, sea surface temperature, and moisture flux with a lagged time. Therefore, a further study using a chemistry–climate interaction model is necessary to isolate the role of AA forcing, in addition to understanding the role of meteorology–chemical feedback interactions.

Author Contributions

S.-J.L. and S.-W.Y. conceived the study, S.-J.L. and Y.-C.J. conducted analysis, and S.-J.L. and S.-W.Y. wrote the paper. All authors have read and agreed to the published version of the manuscript.

Funding

NRF-2018R1A5A1024958, NIER-2020-01-02-023.

Acknowledgments

This work was supported by a National Research Foundation Grant and a grant from the National Institute of Environment Research (NIER), funded by the Ministry of Environment of the Republic of Korea.

Conflicts of Interest

The authors declare no conflict of interest.

References

  1. Li, Z.; Lau, W.M.; Ramanathan, V.; Wu, G.; Ding, Y.; Manoj, M.; Liu, J.; Qian, Y.; Li, J.; Zhou, T. Aerosol and monsoon climate interactions over Asia. Rev. Geophys. 2016, 54, 866–929. [Google Scholar] [CrossRef]
  2. Lin, N.-H.; Tsay, S.-C.; Maring, H.B.; Yen, M.-C.; Sheu, G.-R.; Wang, S.-H.; Chi, K.H.; Chuang, M.-T.; Ou-Yang, C.-F.; Fu, J.S. An overview of regional experiments on biomass burning aerosols and related pollutants in Southeast Asia: From BASE-ASIA and the Dongsha Experiment to 7-SEAS. Atmos. Environ. 2013, 78, 1–19. [Google Scholar] [CrossRef] [Green Version]
  3. Lolli, S.; Khor, W.Y.; Matjafri, M.Z.; Lim, H.S. Monsoon season quantitative assessment of biomass burning clear-sky aerosol radiative effect at surface by ground-based lidar observations in Pulau Pinang, Malaysia in 2014. Remote Sens. 2019, 11, 2660. [Google Scholar] [CrossRef] [Green Version]
  4. Nakajima, T.; Yoon, S.C.; Ramanathan, V.; Shi, G.Y.; Takemura, T.; Higurashi, A.; Takamura, T.; Aoki, K.; Sohn, B.J.; Kim, S.W. Overview of the Atmospheric Brown Cloud East Asian Regional Experiment 2005 and a study of the aerosol direct radiative forcing in east Asia. J. Geophys. Res. Atmos. 2007, 112. [Google Scholar] [CrossRef]
  5. Charlson, R.J.; Schwartz, S.; Hales, J.; Cess, R.D.; Coakley, J.J.; Hansen, J.; Hofmann, D. Climate forcing by anthropogenic aerosols. Science 1992, 255, 423–430. [Google Scholar] [CrossRef]
  6. Lau, W.K. The aerosol-monsoon climate system of Asia: A new paradigm. J. Meteorol. Res. 2016, 30, 1–11. [Google Scholar] [CrossRef]
  7. Zhou, Y.; Savijärvi, H. The effect of aerosols on long wave radiation and global warming. Atmos. Res. 2014, 135, 102–111. [Google Scholar] [CrossRef] [Green Version]
  8. Allen, R.; Sherwood, S. Aerosol-cloud semi-direct effect and land-sea temperature contrast in a GCM. Geophys. Res. Lett. 2010, 37. [Google Scholar] [CrossRef] [Green Version]
  9. Kim, M.K.; Lee, W.S. Dynamic feedbacks of troposphere aerosols on marine low cloud during boreal spring. Geophys. Res. Lett. 2006, 33. [Google Scholar] [CrossRef]
  10. Andreae, M.; Rosenfeld, D. Aerosol–cloud–precipitation interactions. Part 1. The nature and sources of cloud-active aerosols. Earth. Sci. Rev. 2008, 89, 13–41. [Google Scholar] [CrossRef]
  11. Carslaw, K.; Lee, L.; Reddington, C.; Pringle, K.; Rap, A.; Forster, P.; Mann, G.; Spracklen, D.; Woodhouse, M.; Regayre, L. Large contribution of natural aerosols to uncertainty in indirect forcing. Nature 2013, 503, 67–71. [Google Scholar] [CrossRef] [PubMed]
  12. Rosenfeld, D.; Lohmann, U.; Raga, G.B.; O’dowd, C.D.; Kulmala, M.; Fuzzi, S.; Reissell, A.; Andreae, M.O. Flood or drought: How do aerosols affect precipitation? Science 2008, 321, 1309–1313. [Google Scholar] [CrossRef] [PubMed] [Green Version]
  13. Twomey, S. The influence of pollution on the shortwave albedo of clouds. J. Atmos. Sci. 1977, 34, 1149–1152. [Google Scholar] [CrossRef] [Green Version]
  14. Albrecht, B.A. Aerosols, cloud microphysics, and fractional cloudiness. Science 1989, 245, 1227–1230. [Google Scholar] [CrossRef]
  15. Lee, S.S.; Donner, L.J.; Phillips, V.T.; Ming, Y. The dependence of aerosol effects on clouds and precipitation on cloud-system organization, shear and stability. J. Geophys. Res. Atmos. 2008, 113. [Google Scholar] [CrossRef] [Green Version]
  16. Hoesly, R.M.; Smith, S.J.; Feng, L.; Klimont, Z.; Janssens-Maenhout, G.; Pitkanen, T.; Seibert, J.J.; Vu, L.; Andres, R.J.; Bolt, R.M. Historical (1750–2014) anthropogenic emissions of reactive gases and aerosols from the Community Emission Data System (CEDS). Geosci. Model. Dev. 2018, 11, 369–408. [Google Scholar] [CrossRef] [Green Version]
  17. Ohara, T.; Akimoto, H.; Kurokawa, J.-i.; Horii, N.; Yamaji, K.; Yan, X.; Hayasaka, T. An Asian emission inventory of anthropogenic emission sources for the period 1980–2020. Atmos. Chem. Phys. Discuss. 2007. [Google Scholar] [CrossRef] [Green Version]
  18. Streets, D.G.; Wu, Y.; Chin, M. Two-decadal aerosol trends as a likely explanation of the global dimming/brightening transition. Geophys. Res. Lett. 2006, 33. [Google Scholar] [CrossRef] [Green Version]
  19. Zhang, X.; Wang, Y.; Niu, T.; Zhang, X.; Gong, S.; Zhang, Y.; Sun, J. Atmospheric aerosol compositions in China: Spatial/temporal variability, chemical signature, regional haze distribution and comparisons with global aerosols. Atmos. Chem. Phys. 2012, 12, 779–799. [Google Scholar] [CrossRef] [Green Version]
  20. Wang, Y.; Jiang, J.H.; Su, H. Atmospheric responses to the redistribution of anthropogenic aerosols. J. Geophys. Res. Atmos. 2015, 120, 9625–9641. [Google Scholar] [CrossRef]
  21. Streets, D.G.; Yu, C.; Wu, Y.; Chin, M.; Zhao, Z.; Hayasaka, T.; Shi, G. Aerosol trends over China, 1980–2000. Atmos. Res. 2008, 88, 174–182. [Google Scholar] [CrossRef]
  22. Zhao, B.; Jiang, J.H.; Gu, Y.; Diner, D.; Worden, J.; Liou, K.-N.; Su, H.; Xing, J.; Garay, M.; Huang, L. Decadal-scale trends in regional aerosol particle properties and their linkage to emission changes. Environ. Res. Lett. 2017, 12, 054021. [Google Scholar] [CrossRef]
  23. Choi, Y.-S.; Ho, C.-H.; Kim, J.; Gong, D.-Y.; Park, R.J. The impact of aerosols on the summer rainfall frequency in China. J. Appl. Meteorol. Climatol. 2008, 47, 1802–1813. [Google Scholar] [CrossRef] [Green Version]
  24. Kim, M.J.; Yeh, S.W.; Park, R.J. Effects of sulfate aerosol forcing on East Asian summer monsoon for 1985–2010. Geophys. Res. Lett. 2016, 43, 1364–1372. [Google Scholar] [CrossRef] [Green Version]
  25. Wang, T.; Zhuang, B.; Li, S.; Liu, J.; Xie, M.; Yin, C.; Zhang, Y.; Yuan, C.; Zhu, J.; Ji, L. The interactions between anthropogenic aerosols and the East Asian summer monsoon using RegCCMS. J. Geophys. Res. Atmos. 2015, 120, 5602–5621. [Google Scholar] [CrossRef]
  26. Xie, X.; Wang, H.; Liu, X.; Li, J.; Wang, Z.; Liu, Y. Distinct effects of anthropogenic aerosols on the East Asian summer monsoon between multidecadal strong and weak monsoon stages. J. Geophys. Res. Atmos. 2016, 121, 7026–7040. [Google Scholar] [CrossRef]
  27. Jeong, J.I.; Park, R.J.; Yeh, S.W. Dissimilar effects of two El Nino types on PM2.5 concentrations in East Asia. Environ. Pollut. 2018, 242, 1395–1403. [Google Scholar] [CrossRef]
  28. Giorgi, F.; Bi, X.; Qian, Y. Direct radiative forcing and regional climatic effects of anthropogenic aerosols over East Asia: A regional coupled climate-chemistry/aerosol model study. J. Geophys. Res. Atmos. 2002, 107, AAC 7-1–AAC 7-18. [Google Scholar] [CrossRef]
  29. Guo, L.; Highwood, E.; Shaffrey, L.; Turner, A. The effect of regional changes in anthropogenic aerosols on rainfall of the East Asian Summer Monsoon. Atmos. Chem. Phys. 2013, 13, 1521–1534. [Google Scholar] [CrossRef] [Green Version]
  30. Qian, Y.; Giorgi, F. Regional climatic effects of anthropogenic aerosols? The case of Southwestern China. Geophys. Res. Lett. 2000, 27, 3521–3524. [Google Scholar] [CrossRef]
  31. Song, F.; Zhou, T.; Qian, Y. Responses of East Asian summer monsoon to natural and anthropogenic forcings in the 17 latest CMIP5 models. Geophys. Res. Lett. 2014, 41, 596–603. [Google Scholar] [CrossRef]
  32. Ye, J.; Li, W.; Li, L.; Zhang, F. “North drying and south wetting” summer precipitation trend over China and its potential linkage with aerosol loading. Atmos. Res. 2013, 125, 12–19. [Google Scholar] [CrossRef]
  33. Ding, Y.; Wang, Z.; Sun, Y. Inter-decadal variation of the summer precipitation in East China and its association with decreasing Asian summer monsoon. Part I: Observed evidences. Int. J. Climatol. 2008, 28, 1139–1161. [Google Scholar] [CrossRef]
  34. Menon, S.; Hansen, J.; Nazarenko, L.; Luo, Y. Climate effects of black carbon aerosols in China and India. Science 2002, 297, 2250–2253. [Google Scholar] [CrossRef] [Green Version]
  35. Xu, Q. Abrupt change of the mid-summer climate in central east China by the influence of atmospheric pollution. Atmos. Environ. 2001, 35, 5029–5040. [Google Scholar] [CrossRef]
  36. Wang, Z.; Bi, L.; Jia, X.; Yi, B.; Lin, X.; Zhang, F. Impact of dust shortwave absorbability on the East Asian summer monsoon. Geophys. Res. Lett. 2020, 47, e2020GL089585. [Google Scholar] [CrossRef]
  37. Mu, J.; Wang, Z. Responses of the East Asian summer monsoon to aerosol forcing in CMIP5 models: The role of upper-tropospheric temperature change. Int. J. Climatol. 2020. [Google Scholar] [CrossRef]
  38. Chen, G.; Yang, J.; Bao, Q.; Wang, W.-C. Intraseasonal responses of the East Asia summer rainfall to anthropogenic aerosol climate forcing. Clim. Dyn. 2017, 1–14. [Google Scholar] [CrossRef]
  39. Zhang, H.; Wang, Z.; Guo, P.; Wang, Z. A modeling study of the effects of direct radiative forcing due to carbonaceous aerosol on the climate in East Asia. Adv. Atmos. Sci. 2009, 26, 57–66. [Google Scholar] [CrossRef]
  40. Shen, B.; Lin, Z.; Lu, R.; Lian, Y. Circulation anomalies associated with interannual variation of early-and late-summer precipitation in Northeast China. Sci. China Earth. Sci. 2011, 54, 1095–1104. [Google Scholar] [CrossRef]
  41. Wang, B.; Liu, J.; Yang, J.; Zhou, T.; Wu, Z. Distinct principal modes of early and late summer rainfall anomalies in East Asia. J. Clim. 2009, 22, 3864–3875. [Google Scholar] [CrossRef] [Green Version]
  42. Yu, R.; Zhou, T. Seasonality and three-dimensional structure of interdecadal change in the East Asian monsoon. J. Clim. 2007, 20, 5344–5355. [Google Scholar] [CrossRef]
  43. Remer, L.A.; Kaufman, Y.; Tanré, D.; Mattoo, S.; Chu, D.; Martins, J.V.; Li, R.-R.; Ichoku, C.; Levy, R.; Kleidman, R. The MODIS aerosol algorithm, products, and validation. J. Atmos. Sci. 2005, 62, 947–973. [Google Scholar] [CrossRef] [Green Version]
  44. Holben, B.N.; Eck, T.F.; Slutsker, I.; Tanre, D.; Buis, J.; Setzer, A.; Vermote, E.; Reagan, J.A.; Kaufman, Y.; Nakajima, T. AERONET—A federated instrument network and data archive for aerosol characterization. Remote Sens. Environ. 1998, 66, 1–16. [Google Scholar] [CrossRef]
  45. Martonchik, J.V.; Diner, D.J.; Kahn, R.A.; Ackerman, T.P.; Verstraete, M.M.; Pinty, B.; Gordon, H.R. Techniques for the retrieval of aerosol properties over land and ocean using multiangle imaging. IEEE. Trans. Geosci. Remote Sens. 1998, 36, 1212–1227. [Google Scholar] [CrossRef] [Green Version]
  46. Sayer, A.; Hsu, N.; Bettenhausen, C.; Jeong, M.; Holben, B.; Zhang, J. Global and regional evaluation of over-land spectral aerosol optical depth retrievals from SeaWiFS. Atmos. Meas. Tech. 2012. [Google Scholar] [CrossRef] [Green Version]
  47. Liu, Y.; Shao, T.; Hua, S.; Zhu, Q.; Luo, R. Association of anthropogenic aerosols with subtropical drought in East Asia. Int. J. Climatol. 2019. [Google Scholar] [CrossRef]
  48. Patil, N.; Venkataraman, C.; Muduchuru, K.; Ghosh, S.; Mondal, A. Disentangling sea-surface temperature and anthropogenic aerosol influences on recent trends in South Asian monsoon rainfall. Clim. Dyn. 2019, 52, 2287–2302. [Google Scholar] [CrossRef]
  49. Huffman, G.J.; Adler, R.F.; Arkin, P.; Chang, A.; Ferraro, R.; Gruber, A.; Janowiak, J.; McNab, A.; Rudolf, B.; Schneider, U. The global precipitation climatology project (GPCP) combined precipitation dataset. Bull. Am. Meteorol. Soc. 1997, 78, 5–20. [Google Scholar] [CrossRef]
  50. Dee, D.P.; Uppala, S.M.; Simmons, A.; Berrisford, P.; Poli, P.; Kobayashi, S.; Andrae, U.; Balmaseda, M.; Balsamo, G.; Bauer, D.P. The ERA-Interim reanalysis: Configuration and performance of the data assimilation system. Q. J. R. Meteorol. Soc. 2011, 137, 553–597. [Google Scholar] [CrossRef]
  51. Pozzer, A.; De Meij, A.; Yoon, J.; Tost, H.; Georgoulias, A.; Astitha, M. AOD trends during 2001–2010 from observations and model simulations. Atmos. Chem. Phys. 2015, 15, 5521–5535. [Google Scholar] [CrossRef] [Green Version]
  52. Feng, Y.; Chen, D.; Ouyang, X.; Zhang, X. Variability of satellite-based total aerosols and the relationship with emission, meteorology and landscape in North China during 2000–2016. Environ. Earth. Sci. 2018, 77, 499. [Google Scholar] [CrossRef]
  53. Ma, Q.; Li, Y.; Liu, J.; Chen, J.M. Long Temporal Analysis of 3-km MODIS Aerosol Product Over East China. IEEE J. Sel. Top. Appl. Earth Obs. Remote Sens. 2017, 10, 2478–2490. [Google Scholar] [CrossRef]
  54. Guo, J.-P.; Zhang, X.-Y.; Wu, Y.-R.; Zhaxi, Y.; Che, H.-Z.; La, B.; Wang, W.; Li, X.-W. Spatio-temporal variation trends of satellite-based aerosol optical depth in China during 1980–2008. Atmos. Environ. 2011, 45, 6802–6811. [Google Scholar] [CrossRef]
  55. Jin-Tai, L.; Da, P.; Rui-Xiong, Z. Trend and interannual variability of Chinese air pollution since 2000 in association with socioeconomic development: A brief overview. Atmos. Ocean. Sci. Lett. 2013, 6, 84–89. [Google Scholar] [CrossRef]
  56. Wang, Y.; Zhang, R.; Saravanan, R. Asian pollution climatically modulates mid-latitude cyclones following hierarchical modelling and observational analysis. Nat. Commun. 2014, 5, 3098. [Google Scholar] [CrossRef] [Green Version]
  57. Uematsu, M.; Yoshikawa, A.; Muraki, H.; Arao, K.; Uno, I. Transport of mineral and anthropogenic aerosols during a Kosa event over East Asia. J. Geophys. Res. Atmos. 2002, 107. [Google Scholar] [CrossRef]
  58. Takemura, T.; Uno, I.; Nakajima, T.; Higurashi, A.; Sano, I. Modeling study of long-range transport of Asian dust and anthropogenic aerosols from East Asia. Geophys. Res. Lett. 2002, 29, 11-1–11-4. [Google Scholar] [CrossRef]
  59. Brennan, J.I.; Kaufman, Y.J.; Koren, I.; Li, R.R. Aerosol-cloud interaction-misclassification of MODIS clouds in heavy aerosol. IEEE Trans. Geosci. Remote Sens. 2005, 43, 911. [Google Scholar] [CrossRef]
  60. Kaufman, Y.J.; Koren, I.; Remer, L.A.; Rosenfeld, D.; Rudich, Y. The effect of smoke, dust, and pollution aerosol on shallow cloud development over the Atlantic Ocean. Proc. Natl. Acad. Sci. USA 2005, 102, 11207–11212. [Google Scholar] [CrossRef] [Green Version]
  61. Lohmann, U.; Feichter, J. Global indirect aerosol effects: A review. Atmos. Chem. Phys. 2005, 5, 715–737. [Google Scholar] [CrossRef] [Green Version]
  62. Wang, Y.; Wang, M.; Zhang, R.; Ghan, S.J.; Lin, Y.; Hu, J.; Pan, B.; Levy, M.; Jiang, J.H.; Molina, M.J. Assessing the effects of anthropogenic aerosols on Pacific storm track using a multiscale global climate model. Proc. Natl. Acad. Sci. USA 2014, 111, 6894–6899. [Google Scholar] [CrossRef] [PubMed] [Green Version]
  63. Rosenfeld, D.; Woodley, W.L.; Khain, A.; Cotton, W.R.; Carrió, G.; Ginis, I.; Golden, J.H. Aerosol effects on microstructure and intensity of tropical cyclones. Bull. Am. Meteorol. Soc. 2012, 93, 987–1001. [Google Scholar] [CrossRef]
  64. Zhang, R. Getting to the critical nucleus of aerosol formation. Science 2010, 328, 1366–1367. [Google Scholar] [CrossRef] [Green Version]
  65. Zhang, R.; Li, G.; Fan, J.; Wu, D.L.; Molina, M.J. Intensification of Pacific storm track linked to Asian pollution. Proc. Natl. Acad. Sci. USA 2007, 104, 5295–5299. [Google Scholar] [CrossRef] [Green Version]
  66. Baek, H.J.; Kim, M.K.; Kwon, W.T. Observed short-and long-term changes in summer precipitation over South Korea and their links to large-scale circulation anomalies. Int. J. Climatol. 2017, 37, 972–986. [Google Scholar] [CrossRef]
  67. Jing, Y.; Zhang, P.; Chen, L.; Xu, N. Integrated analysis of dust transport and budget in a severe Asian dust event. Aerosol. Air. Qual. Res. 2017, 17, 2390–2400. [Google Scholar] [CrossRef] [Green Version]
  68. Liu, D.; Zhao, T.; Boiyo, R.; Chen, S.; Lu, Z.; Wu, Y.; Zhao, Y. Vertical structures of dust aerosols over East Asia based on CALIPSO retrievals. Remote Sens. 2019, 11, 701. [Google Scholar] [CrossRef] [Green Version]
  69. Wang, Z.; Mu, J.; Yang, M.; Yu, X. Reexamining the Mechanisms of East Asian Summer Monsoon Changes in Response to Non–East Asian Anthropogenic Aerosol Forcing. J. Clim. 2020, 33, 2929–2944. [Google Scholar] [CrossRef]
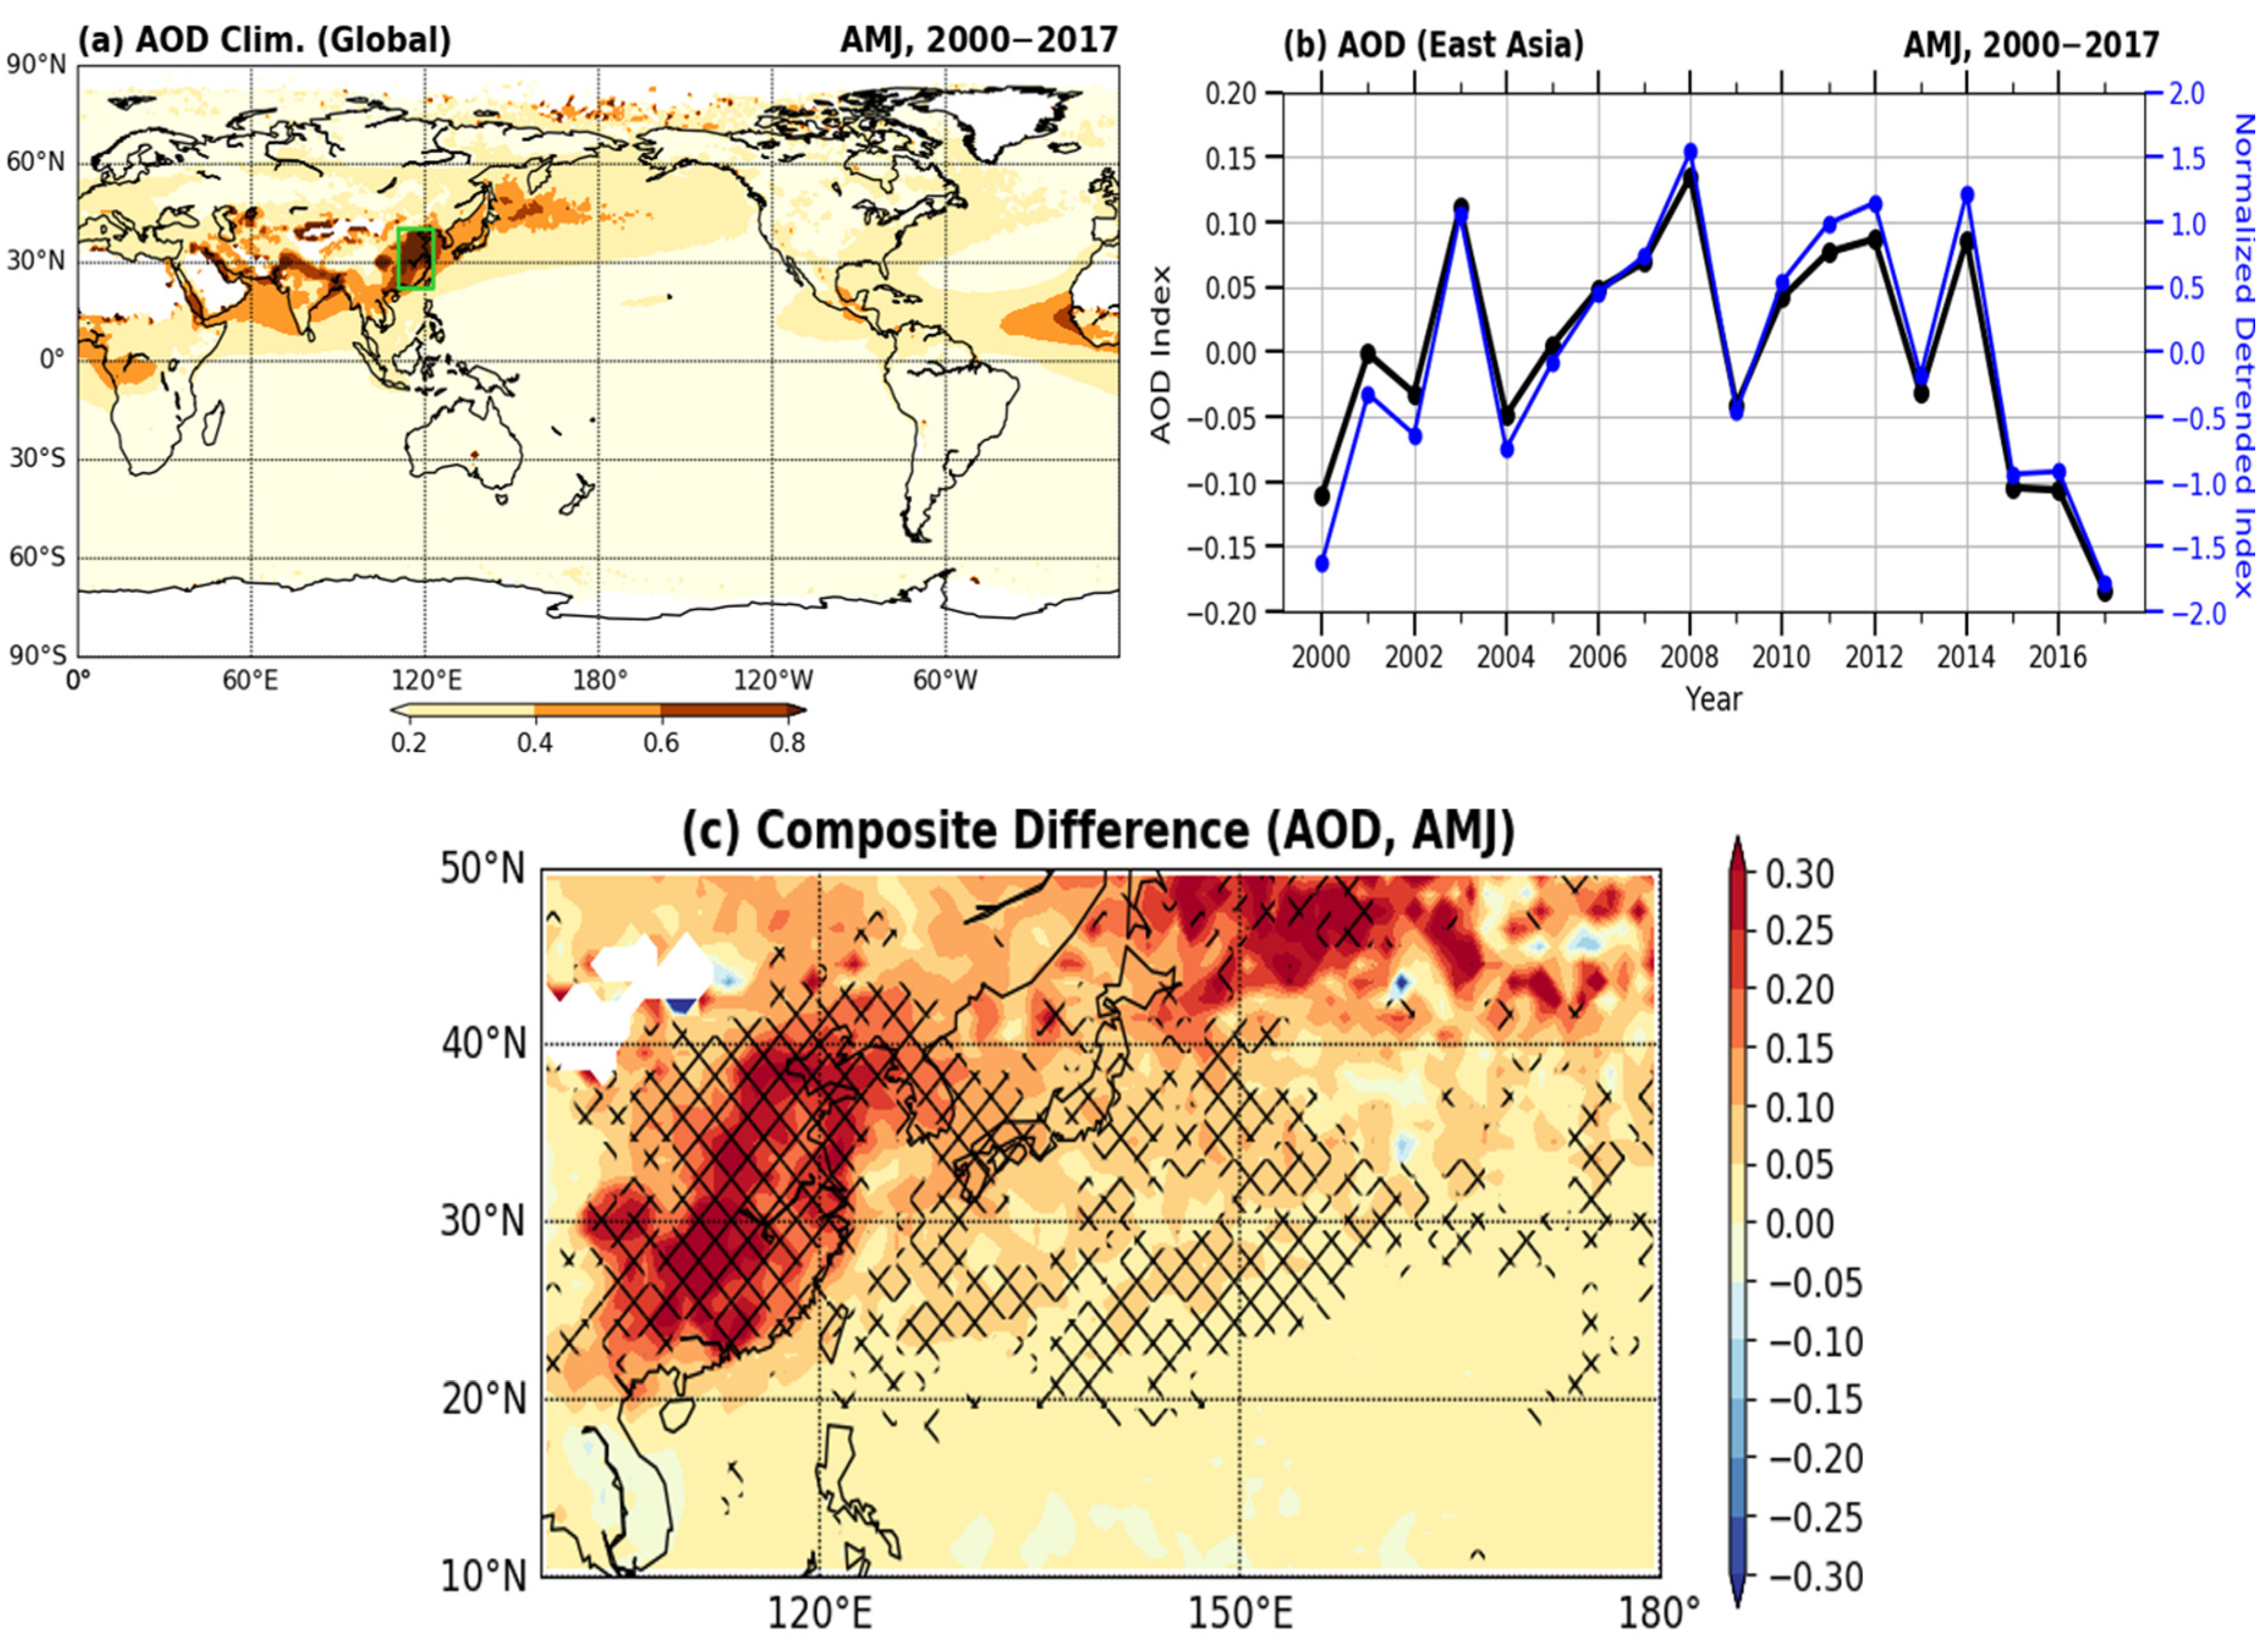
Figure 1. (a) Distribution of climatological (2000–2017) aerosol optical depth (AOD). The green box indicates the East Asian region (110.5–122.5° E, 22.5–40.5° N), where AOD is the highest. (b) The black line denotes time series data of the AOD index, averaged over the green box area shown in (a). The blue line denotes normalized time series data with the linear trend removed from the black line. (c) The composite difference of AOD during April–May–June (AMJ; high AOD minus low AOD). Regions with black cross-hatching indicate a statistical significance at a 95% confidence level.
Atmosphere 11 01356 g001
Figure 2. The composite difference between high AOD and low AOD of (a) AMJ cloud fraction (CF), (b) AMJ surface net solar radiation (SSRD; 10−7 J/m2), and (c) AMJ surface air temperature (SAT; ℃). Regions with black cross-hatching indicate a statistical significance at a 95% confidence level. Solid black lines denote the climatological (2000–2017) mean.
Atmosphere 11 01356 g002
Figure 3. The difference (high AOD minus low AOD) of composited precipitation from the Global Precipitation Climatology Project (GPCP) between the high AOD and the low AOD in July–August (JA). Regions with a red dot indicate a statistical significance at a 95% confidence level. The unit is mm/day.
Atmosphere 11 01356 g003
Figure 4. The composite difference between high AOD and low AOD of (a) JA surface air temperature (SAT; ℃), (b) JA sea level pressure (SLP; hPa), (c) JA wind speed (shading) (m/s) and moisture transport (vector) (kg*m/s), and (d) JA latent heat flux (10−6 J/m2). Regions with black cross-hatching indicate a statistical significance at a 95% confidence level. Solid black lines denote the climatological (2000–2017) mean.
Atmosphere 11 01356 g004
Figure 5. The composite difference of AOD during JA (high AOD minus low AOD). Regions with black cross-hatching indicate a statistical significance at a 95% confidence level.
Atmosphere 11 01356 g005
Figure 6. Schematic diagram showing the process through which AA variability in AMJ affects precipitation in JA.
Atmosphere 11 01356 g006
Publisher’s Note: MDPI stays neutral with regard to jurisdictional claims in published maps and institutional affiliations.