Next Issue
Volume 7, March
Previous Issue
Volume 6, September


Hydrology, Volume 6, Issue 4 (December 2019) – 14 articles

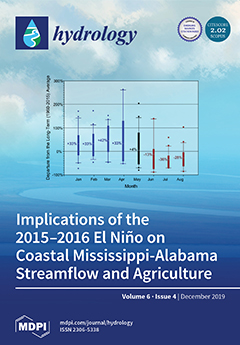
Cover Story (view full-size image): In coastal Mississippi–Alabama (MS–AL), the anticipated physical association is that El Niño events result in greater precipitation (streamflow). Current research reveals the expected increased moisture associated with El Niño conditions is misleading. Coastal MS–AL unimpaired gages revealed that while January through April, cumulative streamflow volumes increased by ~30% during El Niño events as compared to long-term average, June through August cumulative streamflow volumes resulted in a decreased streamflow of ~20%. The agricultural industry produces a variety of crops (e.g., cotton, peanuts), with the typical planting season ending in mid-June with harvesting occurring in early September. Given the lack of impoundments and irrigated lands in coastal MS-AL, the agricultural sector may be severely impacted by El Niño. View this paper.
  • Issues are regarded as officially published after their release is announced to the table of contents alert mailing list.
  • You may sign up for e-mail alerts to receive table of contents of newly released issues.
  • PDF is the official format for papers published in both, html and pdf forms. To view the papers in pdf format, click on the "PDF Full-text" link, and use the free Adobe Reader to open them.
Order results
Result details
Section
Select all
Export citation of selected articles as:
10 pages, 1938 KiB  
Article
Implications of the 2015–2016 El Niño on Coastal Mississippi-Alabama Streamflow and Agriculture
by Sahar T. Sadeghi, Glenn Tootle, Emily Elliott, Venkat Lakshmi, Matthew Therrell and Ajay Kalra
Hydrology 2019, 6(4), 96; https://doi.org/10.3390/hydrology6040096 - 19 Nov 2019
Cited by 3 | Viewed by 2364
Abstract
In this paper, we evaluate the impacts of historic strong El Niño events on the coastal Mississippi-Alabama (MS-AL) hydroclimate. The normal physical association is that the increase in soil moisture, as a result of greater precipitation, is also associated with increased streamflow. When [...] Read more.
In this paper, we evaluate the impacts of historic strong El Niño events on the coastal Mississippi-Alabama (MS-AL) hydroclimate. The normal physical association is that the increase in soil moisture, as a result of greater precipitation, is also associated with increased streamflow. When compared to the historic (1960–2015) long-term average, January through August streamflow volumes for five unimpaired streamflow gages located in coastal MS-AL exhibit an average increase of ~20% following a strong El Niño event. This overall increase was due to above-average precipitation during the winter-spring (January through April) season, with the corresponding average increase in streamflow volume for the five gages ~32%. In evaluating the temporal (monthly) variability of streamflow, we observe that the summer (June through August) season was dry following strong El Niño events, with streamflow volumes for the five gages decreasing by an average of ~21%. The agricultural industry in coastal MS-AL produces a variety of crops including cotton and peanuts. The typical planting season for these crops ends in mid-June with harvesting occurring in early September. Thus, the primary growing season for these crops is June–August. Given the lack of impoundments and irrigated lands in coastal MS-AL, the agricultural sector would be severely impacted by an El Niño driven drier summer. When evaluating the influence of the 2015–2016 El Niño on January through August 2016 streamflow, a similar pattern was observed in which high winter–spring streamflow was followed by diminished summer streamflow. Full article
Show Figures

Figure 1

19 pages, 3592 KiB  
Article
Application of Satellite Rainfall Products for Flood Inundation Modelling in Kelantan River Basin, Malaysia
by Tze Huey Tam, Muhammad Zulkarnain Abd Rahman, Sobri Harun, Muhammad Nassir Hanapi and Ismaila Usman Kaoje
Hydrology 2019, 6(4), 95; https://doi.org/10.3390/hydrology6040095 - 06 Nov 2019
Cited by 21 | Viewed by 7429
Abstract
The advent of satellite rainfall products can provide a solution to the scarcity of observed rainfall data. The present study aims to evaluate the performance of high spatial-temporal resolution satellite rainfall products (SRPs) and rain gauge data in hydrological modelling and flood inundation [...] Read more.
The advent of satellite rainfall products can provide a solution to the scarcity of observed rainfall data. The present study aims to evaluate the performance of high spatial-temporal resolution satellite rainfall products (SRPs) and rain gauge data in hydrological modelling and flood inundation mapping. Four SRPs, Integrated Multi-satellitE Retrievals for Global Precipitation Measurement (GPM) - Early, - Late (IMERG-E, IMERG-L), Global Satellite Mapping of Precipitation-Near Real Time (GSMaP-NRT), and Precipitation Estimation from Remotely Sensed Information using Artificial Neural Networks- Cloud Classification System (PERSIANN-CCS) and rain gauge data were used as the primary input to a hydrological model, Rainfall-Runoff-Inundation (RRI) and the simulated flood level and runoff were compared with the observed data using statistical metrics. GSMaP showed the best performance in simulating hourly runoff with the lowest relative bias (RB) and the highest Nash-Sutcliffe efficiency (NSE) of 4.9% and 0.79, respectively. Meanwhile, the rain gauge data was able to produce runoff with −12.2% and 0.71 for RB and NSE, respectively. The other three SRPs showed acceptable results in daily discharge simulation (NSE value between 0.42 and 0.49, and RB value between −23.3% and −31.2%). The generated flood map also agreed with the published information. In general, the SRPs, particularly the GSMaP, showed their ability to support rapid flood forecasting required for early warning of floods. Full article
Show Figures

Graphical abstract

20 pages, 4412 KiB  
Article
Deterministic Methodology for Determining the Optimal Sampling Frequency of Water Quality Monitoring Systems
by Mahmoud Saleh Al-Khafaji
Hydrology 2019, 6(4), 94; https://doi.org/10.3390/hydrology6040094 - 30 Oct 2019
Cited by 1 | Viewed by 2639
Abstract
This paper proposes a novel deterministic methodology for estimating the optimal sampling frequency (SF) of water quality monitoring systems. The proposed methodology is based on employing two-dimensional contaminant transport simulation models to determine the minimum SF, taking into consideration all the potential changes [...] Read more.
This paper proposes a novel deterministic methodology for estimating the optimal sampling frequency (SF) of water quality monitoring systems. The proposed methodology is based on employing two-dimensional contaminant transport simulation models to determine the minimum SF, taking into consideration all the potential changes in the boundary conditions of a water body. Two-dimensional contaminant transport simulation models (RMA4) were implemented to estimate the distribution patterns of some effective physiochemical parameters within the Al-Hammar Marsh in the southern part of Iraq for 30 cases of potential boundary conditions. Using geographical information system (GIS) tools, a spatiotemporal analysis approach was applied to the results of the RMA4 models to determine the minimum SF of the monitoring stations with a monitoring accuracy (MA) level of detectable change in contaminant concentration ranging from the standard level to 50% (stepwise 5%). For the study area, the proposed methodology specified a minimum and maximum SF for each monitoring station (MS) that ranged between 12 and 33 times per year, respectively. An exponential relationship between SF and MA was obtained. This relationship shows that increasing the MA to ±10%, ±25%, and ±50% increases the SF by approximately 14%, 28%, and 93%, respectively. However, the proposed methodology includes all the potential values and cases of flow and contaminant transport boundary conditions, which increases the certainty of monitoring the system and the efficiency of the SF schedule. Moreover, the proposed methodology can be effectively applied to all types of surface water resources. Full article
Show Figures

Figure 1

23 pages, 3260 KiB  
Article
The Storage and Water Quality Characteristics of Rungiri Quarry Reservoir in Kiambu, Kenya, as a Potential Source of Urban Water
by Winfred Kilonzo, Patrick Home, Joseph Sang and Beatrice Kakoi
Hydrology 2019, 6(4), 93; https://doi.org/10.3390/hydrology6040093 - 29 Oct 2019
Cited by 5 | Viewed by 5133
Abstract
Urbanization has caused limitations on water resources, while climate change has reduced amounts of surface water in some parts of the world. Kikuyu, a suburban area in Kiambu county, Kenya, is facing this challenge. The major challenge in the study is scarcity of [...] Read more.
Urbanization has caused limitations on water resources, while climate change has reduced amounts of surface water in some parts of the world. Kikuyu, a suburban area in Kiambu county, Kenya, is facing this challenge. The major challenge in the study is scarcity of potable water, resulting in inadequate water supply to Kikuyu residents. Currently, only 63.6% of the population is being supplied with water by Kikuyu Water Company, the company mandated to supply water to the area. Water demand was 2972 m3/day in 2015 and was projected to be 3834 m3/day by 2025. This has put pressure on the already exploited clean water resources, making it necessary to seek additional sources of domestic water. Storage capacity and water quality of surface water bodies, especially small reservoirs whose water can be used to ease the demand, need to be assessed for supplemental water supply. This study aimed at assessing the suitability of the abandoned quarry reservoir as a source of potable urban water by determining its storage capacity characteristics and water quality status. Volume characteristics were determined using bathymetry survey in January 2019. Water samples were collected in January and August 2019 and analyzed for chemical, physical, and bacteriological quality, as per the American Public Health Association (APHA) standard methods for water and wastewater. Parameters were evaluated based on World Health Organization (WHO) and Kenya Bureau of Standards (KEBS) guidelines for drinking water, and rated based on the drinking water quality index (WQI). The reservoir’s maximum storage capacity was found to be 128,385 m3, the surface area was 17,699 m2, and the maximum depth was 15.11 m. Nineteen of the twenty-five investigated parameters were within the acceptable standards. However, the concentrations of manganese (Mn), cadmium (Cd), iron (Fe), turbidity, total coliforms, and Escherichia coli (E. coli) were above the acceptable limits. Manganese and iron levels increased with depth. The overall WQI of the reservoir was 82.51 and 85.85 in January and August, respectively. Therefore, based on WQI rating, the water scored a good quality rating and could be used for domestic supply upon treatment. The original achievement of this study is establishment of the volume of the water in the quarry as an additional source of water to the nearby community, along with water quality status. Full article
Show Figures

Figure 1

19 pages, 1595 KiB  
Article
‘Teflon Basin’ or Not? A High-Elevation Catchment Transit Time Modeling Approach
by Jan Schmieder, Stefan Seeger, Markus Weiler and Ulrich Strasser
Hydrology 2019, 6(4), 92; https://doi.org/10.3390/hydrology6040092 - 22 Oct 2019
Cited by 5 | Viewed by 3251
Abstract
We determined the streamflow transit time and the subsurface water storage volume in the glacierized high-elevation catchment of the Rofenache (Oetztal Alps, Austria) with the lumped parameter transit time model TRANSEP. Therefore we enhanced the surface energy-balance model ESCIMO to simulate the ice [...] Read more.
We determined the streamflow transit time and the subsurface water storage volume in the glacierized high-elevation catchment of the Rofenache (Oetztal Alps, Austria) with the lumped parameter transit time model TRANSEP. Therefore we enhanced the surface energy-balance model ESCIMO to simulate the ice melt, snowmelt and rain input to the catchment and associated δ18O values for 100 m elevation bands. We then optimized TRANSEP with streamflow volume and δ18O for a four-year period with input data from the modified version of ESCIMO at a daily resolution. The median of the 100 best TRANSEP runs revealed a catchment mean transit time of 9.5 years and a mobile storage of 13,846 mm. The interquartile ranges of the best 100 runs were large for both, the mean transit time (8.2–10.5 years) and the mobile storage (11,975–15,382 mm). The young water fraction estimated with the sinusoidal amplitude ratio of input and output δ18O values and delayed input of snow and ice melt was 47%. Our results indicate that streamflow is dominated by the release of water younger than 56 days. However, tracers also revealed a large water volume in the subsurface with a long transit time resulting to a strongly delayed exchange with streamflow and hence also to a certain portion of relatively old water: The median of the best 100 TRANSEP runs for streamflow fraction older than five years is 28%. Full article
(This article belongs to the Special Issue Snow Hydrology: Monitoring and Modelling)
Show Figures

Figure 1

15 pages, 1281 KiB  
Article
Hydrological Model for Sustainable Development in the Aral Sea Region
by Vladimir F. Krapivin, Ferdenant A. Mkrtchyan and Gilbert L. Rochon
Hydrology 2019, 6(4), 91; https://doi.org/10.3390/hydrology6040091 - 22 Oct 2019
Cited by 7 | Viewed by 7426
Abstract
Possible scenarios of the Aral Sea crisis solution are discussed, and a new scenario is proposed. Previous scenarios have provided for the transfer of water from Siberian Rivers to Central Asia and the restriction of unsustainable expansion of irrigation in this region. The [...] Read more.
Possible scenarios of the Aral Sea crisis solution are discussed, and a new scenario is proposed. Previous scenarios have provided for the transfer of water from Siberian Rivers to Central Asia and the restriction of unsustainable expansion of irrigation in this region. The scenario proposed in this paper is partly based on the use of Caspian water evaporators located on the eastern coast of the Caspian Sea. Engineering realization of this scenario needs only the construction of the drainage system for the runoff of Caspian waters to the natural evaporators, between which Kara-Bogaz-Gol is the functioning evaporator. This paper shows that realization of this scenario allows the rescue of the Aral Sea and normalization of the water balance in Central Asia. Under this, as the simulation modeling results show, there exist different versions of the scenario depending on the area of evaporators and restrictions for the runoff of Amu Darya and Syr Darya waters to the irrigation systems. Calculation results show that the Aral Sea could be restored within 90–240 years depending on the scenario versions. With only Kara-Bogaz-Gol as the evaporator, the Aral Sea cannot be restored within a century. Additionally, if the anthropogenic runoff of river waters was decreased by 10 percent, the Aral Sea would be restored over about 90 years. Possible versions of the recovery scenario are discussed and assessed. Full article
Show Figures

Figure 1

12 pages, 697 KiB  
Article
Flood Frequency Analysis Using Participatory GIS and Rainfall Data for Two Stations in Narok Town, Kenya
by Eva Audrey Yessito Houessou-Dossou, John Mwangi Gathenya, Mugwima Njuguna and Zachary Abiero Gariy
Hydrology 2019, 6(4), 90; https://doi.org/10.3390/hydrology6040090 - 19 Oct 2019
Cited by 12 | Viewed by 5307
Abstract
Flood management requires in-depth computational modelling through assessment of flood return period and river flow data in order to effectively analyze catchment response. The participatory geographic information system (PGIS) is a tool which is increasingly used for collecting data and decision making on [...] Read more.
Flood management requires in-depth computational modelling through assessment of flood return period and river flow data in order to effectively analyze catchment response. The participatory geographic information system (PGIS) is a tool which is increasingly used for collecting data and decision making on environmental issues. This study sought to determine the return periods of major floods that happened in Narok Town, Kenya, using rainfall frequency analysis and PGIS. For this purpose, a number of statistical distribution functions were applied to daily rainfall data from two stations: Narok water supply (WS) station and Narok meteorological station (MS). The first station has a dataset of thirty years and the second one has a dataset of fifty-nine (59) years. The parameters obtained from the Kolmogorov–Smirnov (K–S) test and chi-square test helped to select the appropriate distribution. The best-fitted distribution for WS station were Gumbel L-moment, Pareto L-moment, and Weibull distribution for maximum one day, two days, and three days rainfall, respectively. However, the best-fitted distribution was found to be generalized extreme value L-moment, Gumbel and gamma distribution for maximum one day, two days, and three days, respectively for the meteorological station data. Each of the selected best-fitted distribution was used to compute the corresponding rainfall intensity for 5, 10, 25, 50, and 100 years return period, as well as the return period of the significant flood that happened in the town. The January 1993 flood was found to have a return period of six years, while the April 2013, March 2013, and April 2015 floods had a return period of one year each. This study helped to establish the return period of major flood events that occurred in Narok, and highlights the importance of population in disaster management. The study’s results would be useful in developing flood hazard maps of Narok Town for different return periods. Full article
Show Figures

Figure 1

20 pages, 4801 KiB  
Article
Calibration of NSRP Models from Extreme Value Distributions
by Davide Luciano De Luca and Luciano Galasso
Hydrology 2019, 6(4), 89; https://doi.org/10.3390/hydrology6040089 - 16 Oct 2019
Cited by 5 | Viewed by 3194
Abstract
In this work, the authors investigated the feasibility of calibrating a model which is suitable for the generation of continuous high-resolution rainfall series, by using only data from annual maximum rainfall (AMR) series, which are usually longer than continuous high-resolution data, or they [...] Read more.
In this work, the authors investigated the feasibility of calibrating a model which is suitable for the generation of continuous high-resolution rainfall series, by using only data from annual maximum rainfall (AMR) series, which are usually longer than continuous high-resolution data, or they are the unique available data set for many locations. In detail, the basic version of the Neyman–Scott Rectangular Pulses (NSRP) model was considered, and numerical experiments were carried out, in order to analyze which parameters can mostly influence the extreme value frequency distributions, and whether heavy rainfall reproduction can be improved with respect to the usual calibration with continuous data. The obtained results were highly promising, as the authors found acceptable relationships among extreme value distributions and statistical properties of intensity and duration for the pulses. Moreover, the proposed procedure is flexible, and it is clearly applicable for a generic rainfall generator, in which probability distributions and shape of the pulses, and extreme value distributions can assume any mathematical expression. Full article
Show Figures

Figure 1

25 pages, 6755 KiB  
Article
The Temporal Variability of Rainfall and Streamflow into Lake Nakuru, Kenya, Assessed Using SWAT and Hydrometeorological Indices
by Alice Nyawira Kimaru, John Mwangi Gathenya and Charles K. Cheruiyot
Hydrology 2019, 6(4), 88; https://doi.org/10.3390/hydrology6040088 - 14 Oct 2019
Cited by 15 | Viewed by 5525
Abstract
Temporal variability analysis of rainfall and river discharges is useful in determining the likelihood of the occurrence of extreme events such as drought or flooding for the purposes of developing policies to mitigate their effects. This study investigated the temporal variability of rainfall [...] Read more.
Temporal variability analysis of rainfall and river discharges is useful in determining the likelihood of the occurrence of extreme events such as drought or flooding for the purposes of developing policies to mitigate their effects. This study investigated the temporal variability of rainfall and discharges into Lake Nakuru, Kenya using meteorological drought indicators and hydrological drought indicators from 1981 to 2018. The standardized precipitation index (SPI) and standardized precipitation evaporation index (SPEI) were used to characterize meteorological drought, while the streamflow drought index (SDI) was used to characterize hydrological drought. A SWAT model was applied for the prediction of streamflow on five tributaries of Lake Nakuru (Njoro, Ngosur, Nderit, Larmudiac, and Makalia Rivers). The model was successfully calibrated on Njoro River at the upstream of river gauging station 2FCO5 from 1984 to 1996, and the parameters were validated from 1997 to 2007. The SUFI-2 algorithm was applied in SWATCup to perform the calibration of the model. The model performance was considered satisfactory in daily time step (NSE = 0.58, R2 = 0.58 during calibration and NSE = 0.52, R2 = 0.68 during validation). The average annual water balance revealed that out of 823 mm received annual precipitation, 154 mm was surface runoff and 178 mm was the annual average water yield. The average annual actual evapotranspiration (ET) was 607 mm. The results for the temporal variation of the SPI and SDI for the five subcatchments indicated that the drought events identified by the 12-month SPI/SPEI were almost all identified by the 12-month SDI. At the catchment scale, SPI showed an equal distribution of wet and dry periods, with 50.00% of positive anomalies and 50.00% of negative anomalies being observed from 1981 to 2018, while SDI observes a high frequency of dry periods (52.63%) and a lower frequency of wet periods (47.37%). There is a higher frequency of wet periods compared to dry periods for both indices from 2009 to 2010 at 60.00% and 40.00% for SPI and 90.00% and 10.00% for SDI, respectively. Both indices observed that 1984 and 2000 were severely dry years (SPI/SPEI < −2.00), while 2018 was severely wet (SPI/SPEI > 2.00). The results for the variability in rainfall and streamflow indices revealed that the last 10 years (2009–2018) were wetter than the period from 1981 to 2008. Full article
Show Figures

Figure 1

20 pages, 3435 KiB  
Article
A Case Study of Rainfall and Temperature Trends in San Diego Region, 1985–2017
by Esther Mosase, Laurent Ahiablame, Fritz Light and Francis Dwomoh
Hydrology 2019, 6(4), 87; https://doi.org/10.3390/hydrology6040087 - 14 Oct 2019
Cited by 3 | Viewed by 3707
Abstract
Prolonged and frequent droughts in Southern California present hazards and uncertainty for the region’s increasing population, resulting in proactive and aggressive water management strategies. The goal of this study is to present a case study of the San Diego region’s rainfall and temperature [...] Read more.
Prolonged and frequent droughts in Southern California present hazards and uncertainty for the region’s increasing population, resulting in proactive and aggressive water management strategies. The goal of this study is to present a case study of the San Diego region’s rainfall and temperature time series analysis in order to determine annual and seasonal trends and their significance. Rainfall and temperature data from 20 rain-gauged stations were analyzed for the period 1985–2017. A project database was set up for data compilation and quality control, and a Mann-Kendall test for trend analysis was used. Results indicated that rainfall in the region decreased both annually and during the rainy season (November–April) by up to 0.14 mm between 1985 and 2017, although not in a statistically significant manner, except at two rainfall observation stations. Rainfall appears to have increased in many of the stations examined during the dry season (May–October), with an average magnitude of 0.09 mm. Analysis of daily minimum and maximum temperature reveals overall average annual and seasonal increases of 0.07 °C and 0.04 °C, respectively, with statistically significant increases at 10 of 17 for minimum temperature, and 0.27 °C and −0.25 °C with statistically significant increases at 9 of 16 for maximum temperature. Temperature tends to have increased more during the dry season compared to the rainy season. This study reveals an overall decreasing tendency in rainfall and an increasing tendency in minimum and maximum temperatures (although not statistically significant) in the San Diego region between 1985 and 2017, which likely contributed to important management implications for the region’s water resources. Full article
Show Figures

Figure 1

17 pages, 2981 KiB  
Article
Analysis of Land Use Change and Its Impact on the Hydrology of Kakia and Esamburmbur Sub-Watersheds of Narok County, Kenya
by Nzitonda Marie Mireille, Hosea M. Mwangi, John K. Mwangi and John Mwangi Gathenya
Hydrology 2019, 6(4), 86; https://doi.org/10.3390/hydrology6040086 - 09 Oct 2019
Cited by 19 | Viewed by 5277
Abstract
Narok town is one of the places in Kenya which experience catastrophic floods. Many lives have been lost and valuable property destroyed in recent years. Change in land use/land cover upstream of the town area may have contributed significantly to the severity and [...] Read more.
Narok town is one of the places in Kenya which experience catastrophic floods. Many lives have been lost and valuable property destroyed in recent years. Change in land use/land cover upstream of the town area may have contributed significantly to the severity and frequency of flooding events. Runoff, which contributes to floods in Narok town, comes from Kakia and Esamburmbur sub-catchments of Enkare Narok watershed. The objective of this study was to assess the impact of land use/land cover change on the hydrology of Kakia and Esamburmbur sub-watersheds. To detect land use/land cover change, Landsat satellite images from 1985 to 2019 were used. Using supervised classification in Erdas Imagine 2014, land use of the study area was classified into four classes, i.e., forest, rangeland, agriculture and built-up areas. Five land use maps (1985, 1995, 2000, 2010, and 2019) were developed and used to perform land use change analysis. There was rampart conversion of forest to other land uses. Between 1985 and 2019, the forest and rangeland declined by 40.3% and 25.6% of the study area, respectively, while agriculture and built-up areas increased by 55.2% and 10.6% of the study area respectively. Analysis of soil hydrological properties indicate that the infiltration rate and soil hydraulic conductivity were greatest in forest than in other land use types. The basic infiltration rate in forest land was 89.1 cm/h while in rangeland and agricultural land, it was 7.9 cm/h and 15 cm/h respectively. At the top-soil layer, average soil hydraulic conductivity under forest was 46.3 cm/h, under rangeland, 2.6 cm/h and under agriculture, 4.9 cm/h. The low hydraulic conductivity in rangeland and agriculture was attributed to compaction by farm machinery (tractors) and livestock respectively. An interesting observation was made in rangelands where the top layer (0–20 cm) had a higher bulk density and a lower hydraulic conductivity as compared to the next deeper layer (20–40 cm). This was attributed to the combined impact of compaction and localised pressure by hooves of livestock which only have an impact on the top layer. The findings of this study show that land use has a major impact on soil hydrological properties and imply that the observed land use changes negatively affected the soil hydrological properties of the watershed. The decreased infiltration in the increasing areas of degraded land (mainly agriculture and rangeland) and increase in built-up area in Narok town are the possible causes of the increased flood risk in Narok town. It is recommended that flood risk management strategies in Narok town include watershed management to enhance water infiltration. Full article
Show Figures

Figure 1

22 pages, 1239 KiB  
Article
Doing Hydrology Backwards—Analytic Solution Connecting Streamflow Oscillations at the Basin Outlet to Average Evaporation on a Hillslope
by Morgan Fonley, Ricardo Mantilla and Rodica Curtu
Hydrology 2019, 6(4), 85; https://doi.org/10.3390/hydrology6040085 - 04 Oct 2019
Cited by 4 | Viewed by 3055
Abstract
The concept of doing hydrology backwards, introduced in the literature in the last decade, relies on the possibility to invert the equations relating streamflow fluctuations at the catchment outlet to estimated hydrological forcings throughout the basin. In this work, we use a recently [...] Read more.
The concept of doing hydrology backwards, introduced in the literature in the last decade, relies on the possibility to invert the equations relating streamflow fluctuations at the catchment outlet to estimated hydrological forcings throughout the basin. In this work, we use a recently developed set of equations connecting streamflow oscillations at the catchment outlet to baseflow oscillations at the hillslope scale. The hillslope-scale oscillations are then used to infer the pattern of evaporation needed for streamflow oscillations to occur. The inversion is illustrated using two conceptual models of movement of water in the subsurface with different levels of complexity, but still simple enough to demonstrate our approach. Our work is limited to environments where diel oscillations in streamflow are a strong signal in streamflow data. We demonstrate our methodology by applying it to data collected in the Dry Creek Experimental Watershed in Idaho and show that the hydrology backwards principles yield results that are well within the order of magnitude of daily evapotranspiration fluctuations. Our analytic results are generic and they encourage the development of experimental campaigns to validate integrated hydrological models and test implicit parameterization assumptions. Full article
Show Figures

Figure 1

18 pages, 2867 KiB  
Article
A Counting Process Approach for Trend Assessment of Drought Condition
by Edmondo Di Giuseppe, Massimiliano Pasqui, Ramona Magno and Sara Quaresima
Hydrology 2019, 6(4), 84; https://doi.org/10.3390/hydrology6040084 - 27 Sep 2019
Cited by 7 | Viewed by 4069
Abstract
This paper discusses some methodological aspects of the historical analysis of drought, particularly the trend assessment. The Standardized Evapotranspiration Index (SPEI) is widely used as a measure of drought condition. Since different SPEI thresholds allow classifying the risk into moderate, severe, and extreme, [...] Read more.
This paper discusses some methodological aspects of the historical analysis of drought, particularly the trend assessment. The Standardized Evapotranspiration Index (SPEI) is widely used as a measure of drought condition. Since different SPEI thresholds allow classifying the risk into moderate, severe, and extreme, the drought occurrence becomes a counting process. In this framework, would a statistical trend test based on a Non-Homogeneous Poisson Process (NHPP) give a similar result of the nonparametric Mann–Kendall (M-K) test? In this paper, we demonstrate that the NHPP approach is able to characterize the information given by the classical M-K approach in term of drought risk classes. Furthermore, we show how it can be used to reinforce the framework of drought trend analysis in combination with a standard non-parametric approach. At a global scale, we find that: (1) areas under increasing risk of drought identified by the NHPP approach are considerably larger in comparison to those identified by M-K; and (2) the results of the two tests are different during crucial periods such as hydrological droughts in winter and spring. Full article
Show Figures

Figure 1

21 pages, 8707 KiB  
Article
Evolution of Acid Mine Drainage from a Coal Waste Rock Pile Reclaimed with a Simple Soil Cover
by Murugan Ramasamy and Christopher Power
Hydrology 2019, 6(4), 83; https://doi.org/10.3390/hydrology6040083 - 23 Sep 2019
Cited by 11 | Viewed by 3382
Abstract
Waste rock piles (WRPs) are commonly remediated with cover systems to limit water and oxygen influx and mitigate the impacts of acid mine drainage (AMD) on the environment. While numerous types of cover systems exist, simple, single-layer soil covers remain an attractive option [...] Read more.
Waste rock piles (WRPs) are commonly remediated with cover systems to limit water and oxygen influx and mitigate the impacts of acid mine drainage (AMD) on the environment. While numerous types of cover systems exist, simple, single-layer soil covers remain an attractive option due to their low cost and simplicity of installation. Since knowledge of their long-term performance in humid climates is limited, this study was undertaken to assess and predict a single-layer cover system at a WRP in Nova Scotia, Canada. A two-dimensional finite element model was developed to simulate variably saturated flow and solute transport at the WRP and surrounding area. Key parameters collected during five years of field monitoring, including moisture contents, groundwater levels and dissolved metal concentrations, were used to produce a well-calibrated and verified model. Early results confirm that the cover system has already decreased AMD into both groundwater (reduced water infiltration/seepage in the WRP) and surface water (eliminated contaminated surface water runoff). Long-term acidity depletion rates indicate that all sulphidic minerals within the pile will be oxidized within 34 years, but due to the slow leaching rates into water, it will take over 9000 years to deplete all acidity. Numerical simulations predict the evolution of groundwater and surface water quality over time until full acidity depletion. Current work involves kinetic tests on waste rock samples to more accurately access the annual generation and release of AMD. Full article
Show Figures

Figure 1

Previous Issue
Next Issue
Back to TopTop