Article

Implications of the 2015–2016 El Niño on Coastal Mississippi-Alabama Streamflow and Agriculture

1
Department of Civil, Construction and Environmental Engineering, University of Alabama, Tuscaloosa, AL 35487, USA
2
Department of Geography, University of Alabama, Tuscaloosa, AL 35487, USA
3
School of Earth Ocean and the Environment, University of South Carolina, Columbia, SC 29440, UAS
4
Department of Civil and Environmental Engineering, Southern Illinois University Carbondale, Carbondale, IL 62901, UAS
*
Author to whom correspondence should be addressed.
Hydrology 2019, 6(4), 96; https://doi.org/10.3390/hydrology6040096
Submission received: 27 July 2019 / Revised: 14 September 2019 / Accepted: 30 September 2019 / Published: 19 November 2019

Abstract

:
In this paper, we evaluate the impacts of historic strong El Niño events on the coastal Mississippi-Alabama (MS-AL) hydroclimate. The normal physical association is that the increase in soil moisture, as a result of greater precipitation, is also associated with increased streamflow. When compared to the historic (1960–2015) long-term average, January through August streamflow volumes for five unimpaired streamflow gages located in coastal MS-AL exhibit an average increase of ~20% following a strong El Niño event. This overall increase was due to above-average precipitation during the winter-spring (January through April) season, with the corresponding average increase in streamflow volume for the five gages ~32%. In evaluating the temporal (monthly) variability of streamflow, we observe that the summer (June through August) season was dry following strong El Niño events, with streamflow volumes for the five gages decreasing by an average of ~21%. The agricultural industry in coastal MS-AL produces a variety of crops including cotton and peanuts. The typical planting season for these crops ends in mid-June with harvesting occurring in early September. Thus, the primary growing season for these crops is June–August. Given the lack of impoundments and irrigated lands in coastal MS-AL, the agricultural sector would be severely impacted by an El Niño driven drier summer. When evaluating the influence of the 2015–2016 El Niño on January through August 2016 streamflow, a similar pattern was observed in which high winter–spring streamflow was followed by diminished summer streamflow.

1. Introduction

The impact of the El Niño-Southern Oscillation (ENSO) on water resources [1,2,3,4,5] and agricultural production [6,7] has been evaluated globally. In the continental US, several studies have evaluated ENSO impacts on Western U.S. water resources while a limited number of studies have examined the impact of ENSO in the Southeastern United States for agriculture [8] and streamflow [9]. However, these studies have been either (a) dated [8] or (b) do not include the recent ENSO events [9]. The Mississippi River basin (MRB) covers roughly 3.2 million km2 and contributes around $100 billion per year in economic gains through agriculture [10]. In 2011, ENSO modulated the drought over the United States. The high probability of drought occurred during cold ENSO phenomena over the Mississippi River Forecast Centers, whereas the low probability of drought occurred during warm ENSO phenomena for the Pacific Northwest River Forecast Centers [11]. In 2014, studies indicated that the storage of water in soil is affected by ENSO precipitation anomalies. Both Central Pacific (CP) El Niño and Eastern Pacific (EP) El Niño events influence the spring hydrological cycle, and therefore soil moisture in the MRB. EP El Niño events caused an increase in soil moisture, while CP El Niño years led to decreases in soil moisture for the region [12].
Although there is no ENSO signal observed for streamflow at the outlet of the MRB, water balance components are affected by inconsistencies in certain regions within the basin. Evapotranspiration in the western half of the basin, and runoff in the eastern half, are affected by anomalies of ENSO precipitation [13]. In 1998, the economic consequences of ENSO for crop yields were assessed [14]. Based on the results of this study, a single El Niño year relative to a non-event year had roughly a $2.5 billion lower yield. In North and South America, the studied crops include soybeans, maize, and wheat. In South America, the growing seasons for maize and wheat were concurrent with the peak ENSO sea surface temperature (SST) teleconnections. In the US, Iowa, Illinois, and Indiana are good locations for growing corn and corn-fed livestock. ENSO has the greatest impact on corn yields in the summer. The studies showed that the main reason for the lowered corn yield in La Niña years (lower SST anomalies) was water stress in July and August [15]. In 1997, the influence of ENSO phases, El Niño, La Niña, and neutral, were analyzed on six crops (peanut, tomato, cotton, tobacco, corn, and soybean), and their total value, area harvested, and yield in the Southeastern United States (Alabama, Florida, Georgia, and South Carolina) were assessed during these various phases [16]. Based on the results, due to the impact of ENSO on June rainfall, yields of corn during La Niña years were high, whereas in the years that followed La Niña, yields were low. Tobacco and peanut yields in La Niña and neutral years resulted in low productivity but, in El Niño years, these crops yielded higher productivity. Because of greater residual soil moisture, in the years following neutral years, the yields were higher than years following La Niña [8]. The influence of one of the ENSO phases, El Niño, on fresh vegetables and melons was also evaluated in Florida, Texas, and California [16]. According to the studies, Florida fall squash were negatively impacted by El Niño conditions and decreased by 15% [16].
In the Southeastern US (e.g., Alabama, Florida, and Georgia) one of the most essential crops is cotton. ENSO phases (La Niña, El Niño, and neutral years) have been shown to affect the water use efficiency (WUE) of rainfed cotton. During El Niño and neutral years, spatial dependence of WUE was weaker than during La Niña years. Hence, when planning for rainfed cotton during La Niña years, this information should have been taken into consideration [17]. For vegetation, the ideal climate conditions were provided by neutral phase conditions, whereas El Niño had a negative impact on vegetation [18]. In Georgia, the studies showed that the probability of gaining higher net returns under irrigated conditions increased when the date of planting was delayed for El Niño years. In contrast, when the date of planting peanuts was after June 5, the likelihood diminished. During La Niña years, if peanut growers plant in mid- to late April, the chance to gain $493–988 per hectare greatly increases. Under rainy conditions, if the date of planting peanuts was between April 16 and May 8, the profitability of dryland peanut production during La Niña years was slight [19]. Although it is not the main crop in the southeast, the mid-Atlantic (Virginia through the Carolinas), and the southwest, the peanut is economically the most important crop in these regions. Woli et al. (2013; [20]) found that ENSO had a weak effect at the sub-regional level, but an evident effect at the regional scale. Based on these investigations, in La Niña years, for crops which were planted preceding May 1, larger peanut yields were observed at the regional level. In contrast, in El Niño years, for crops that were planted following May 29, larger peanut yields were observed. For peanut crops which were grown in light soils and planted at the beginning and end of the season, the influence of soil type along with ENSO was significant, whereas in heavy soils in the middle of the season the impact of ENSO was negligible [20].
Agriculture in coastal MS-AL provides a vital economic thrust for many small, rural communities throughout the region (Figure 1). Cotton and peanuts are two important staples that have long been cultivated in this region. In 2015, the cotton and peanut industries of MS-AL generated over $575M in agricultural revenue [21]. In 2015, the nine top AL peanut producing counties (Baldwin, Covington, Dale, Escambia, Geneva, Houston, Henry, Mobile, and Monroe) produced over 227M kg (500 M pounds) of peanuts [21]. This generated approximately $90M in sales revenue [21]. In 2015, the AL coastal counties of Baldwin, Barbour, Coffee, Conecuh, Covington, Dale, Escambia, Geneva, Henry, Houston, Monroe, and Pike produced over 263,000 bales of cotton, accounting for over $78M in revenue [21]. Typically, these crops are planted in mid-June, and harvested in early September [22]. Thus, the primary growing season for these crops is June, July, and August. The challenge for many of these small, rural communities is the lack of irrigated lands, and the inability to save winter-spring streamflow due to a lack of impoundments in this region. Thus, agriculture strongly depends on precipitation during the growing season months of June–August.
Prior to the recent 2015–2016 El Niño, the last El Niño event was in 2009–2010 [23]. As noted in the 2011 USDA bulletin [22], “Peanuts yielded 2600 pounds per acre, down from the previous year of 3300 pounds. Similar to other crops, late planted peanuts suffered from the dry conditions in parts of the state causing scattered yields along with quality issues.” Thus, peanut production in AL declined immediately after the 2009–2010 El Niño event due to dry conditions. The 2011 USDA bulletin further states—“Wet, dry and prolonged hot weather severely impacted major crops during and the 2010 crop year. Alabama saw some rainfall in the spring but mainly a prolonged hot and dry summer…delayed planting caused by cool, wet, spring…weather wet weather slowed planting.” Thus, the 2009–2010 El Niño was associated with both excessive spring moisture that delayed the planting of crops, in addition to the ENSO impact of an unusually dry summer (growing season). The link between the El Niño-Southern Oscillation (ENSO) and Southeastern US streamflow is well-established [24,25,26]. ENSO indicators have been linked to streamflow and forecasting in the Western United States [27], Australia [28,29], and Colombia [30]. A more recent study evaluated the effects of ENSO on annual precipitation and streamflow discharges in the Southeastern United States [31]. While these studies detected an ENSO signal in coastal MS-AL streamflow, the temporal variability of the streamflow response to ENSO is not well understood. A study of ENSO impacts on the Chattahoochee-Flint River Basin (Alabama, Florida, Georgia) evaluated monthly variability [32]. However, the relevant hydrologic response variable was groundwater levels and not streamflow. Specifically, while the yearly volume of streamflow exhibits an increase (decrease) in response to El Niño (La Niña) events, there is a need to understand the temporal (monthly) variability of the streamflow, and whether this temporal variability would impact the agricultural planting and subsequent growing seasons in coastal MS-AL. Thus, the current research will replicate previous efforts, which focused on continental US streamflow and western U.S. snowpack [26], to identify historic El Niño events that were statistically similar to the 2015–2016 El Niño. This 2015–2016 “super” El Niño event impacted water resources globally [33,34,35]. Utilizing statistically similar El Niño events, forecasts of winter-spring (January–April, or JFMA) and summer (June–August, or JJA) streamflow for coastal MS-AL gaging stations were developed for two- and seven-month lead-times, respectively. These seasons were selected as they represent the wet season (JFMA) and the summer growing season (JJA) for coastal MS-AL cotton and peanut crops. The current research reveals the temporally variable (monthly and seasonal) response of coastal MS-AL streamflow to El Niño. Finally, 2016 streamflow data were collected and compared to the forecasts of both winter-spring and summer seasons. The current research provides a better understanding of the potential impacts of El Niño on coastal MS-AL agriculture.

2. Data and Methods

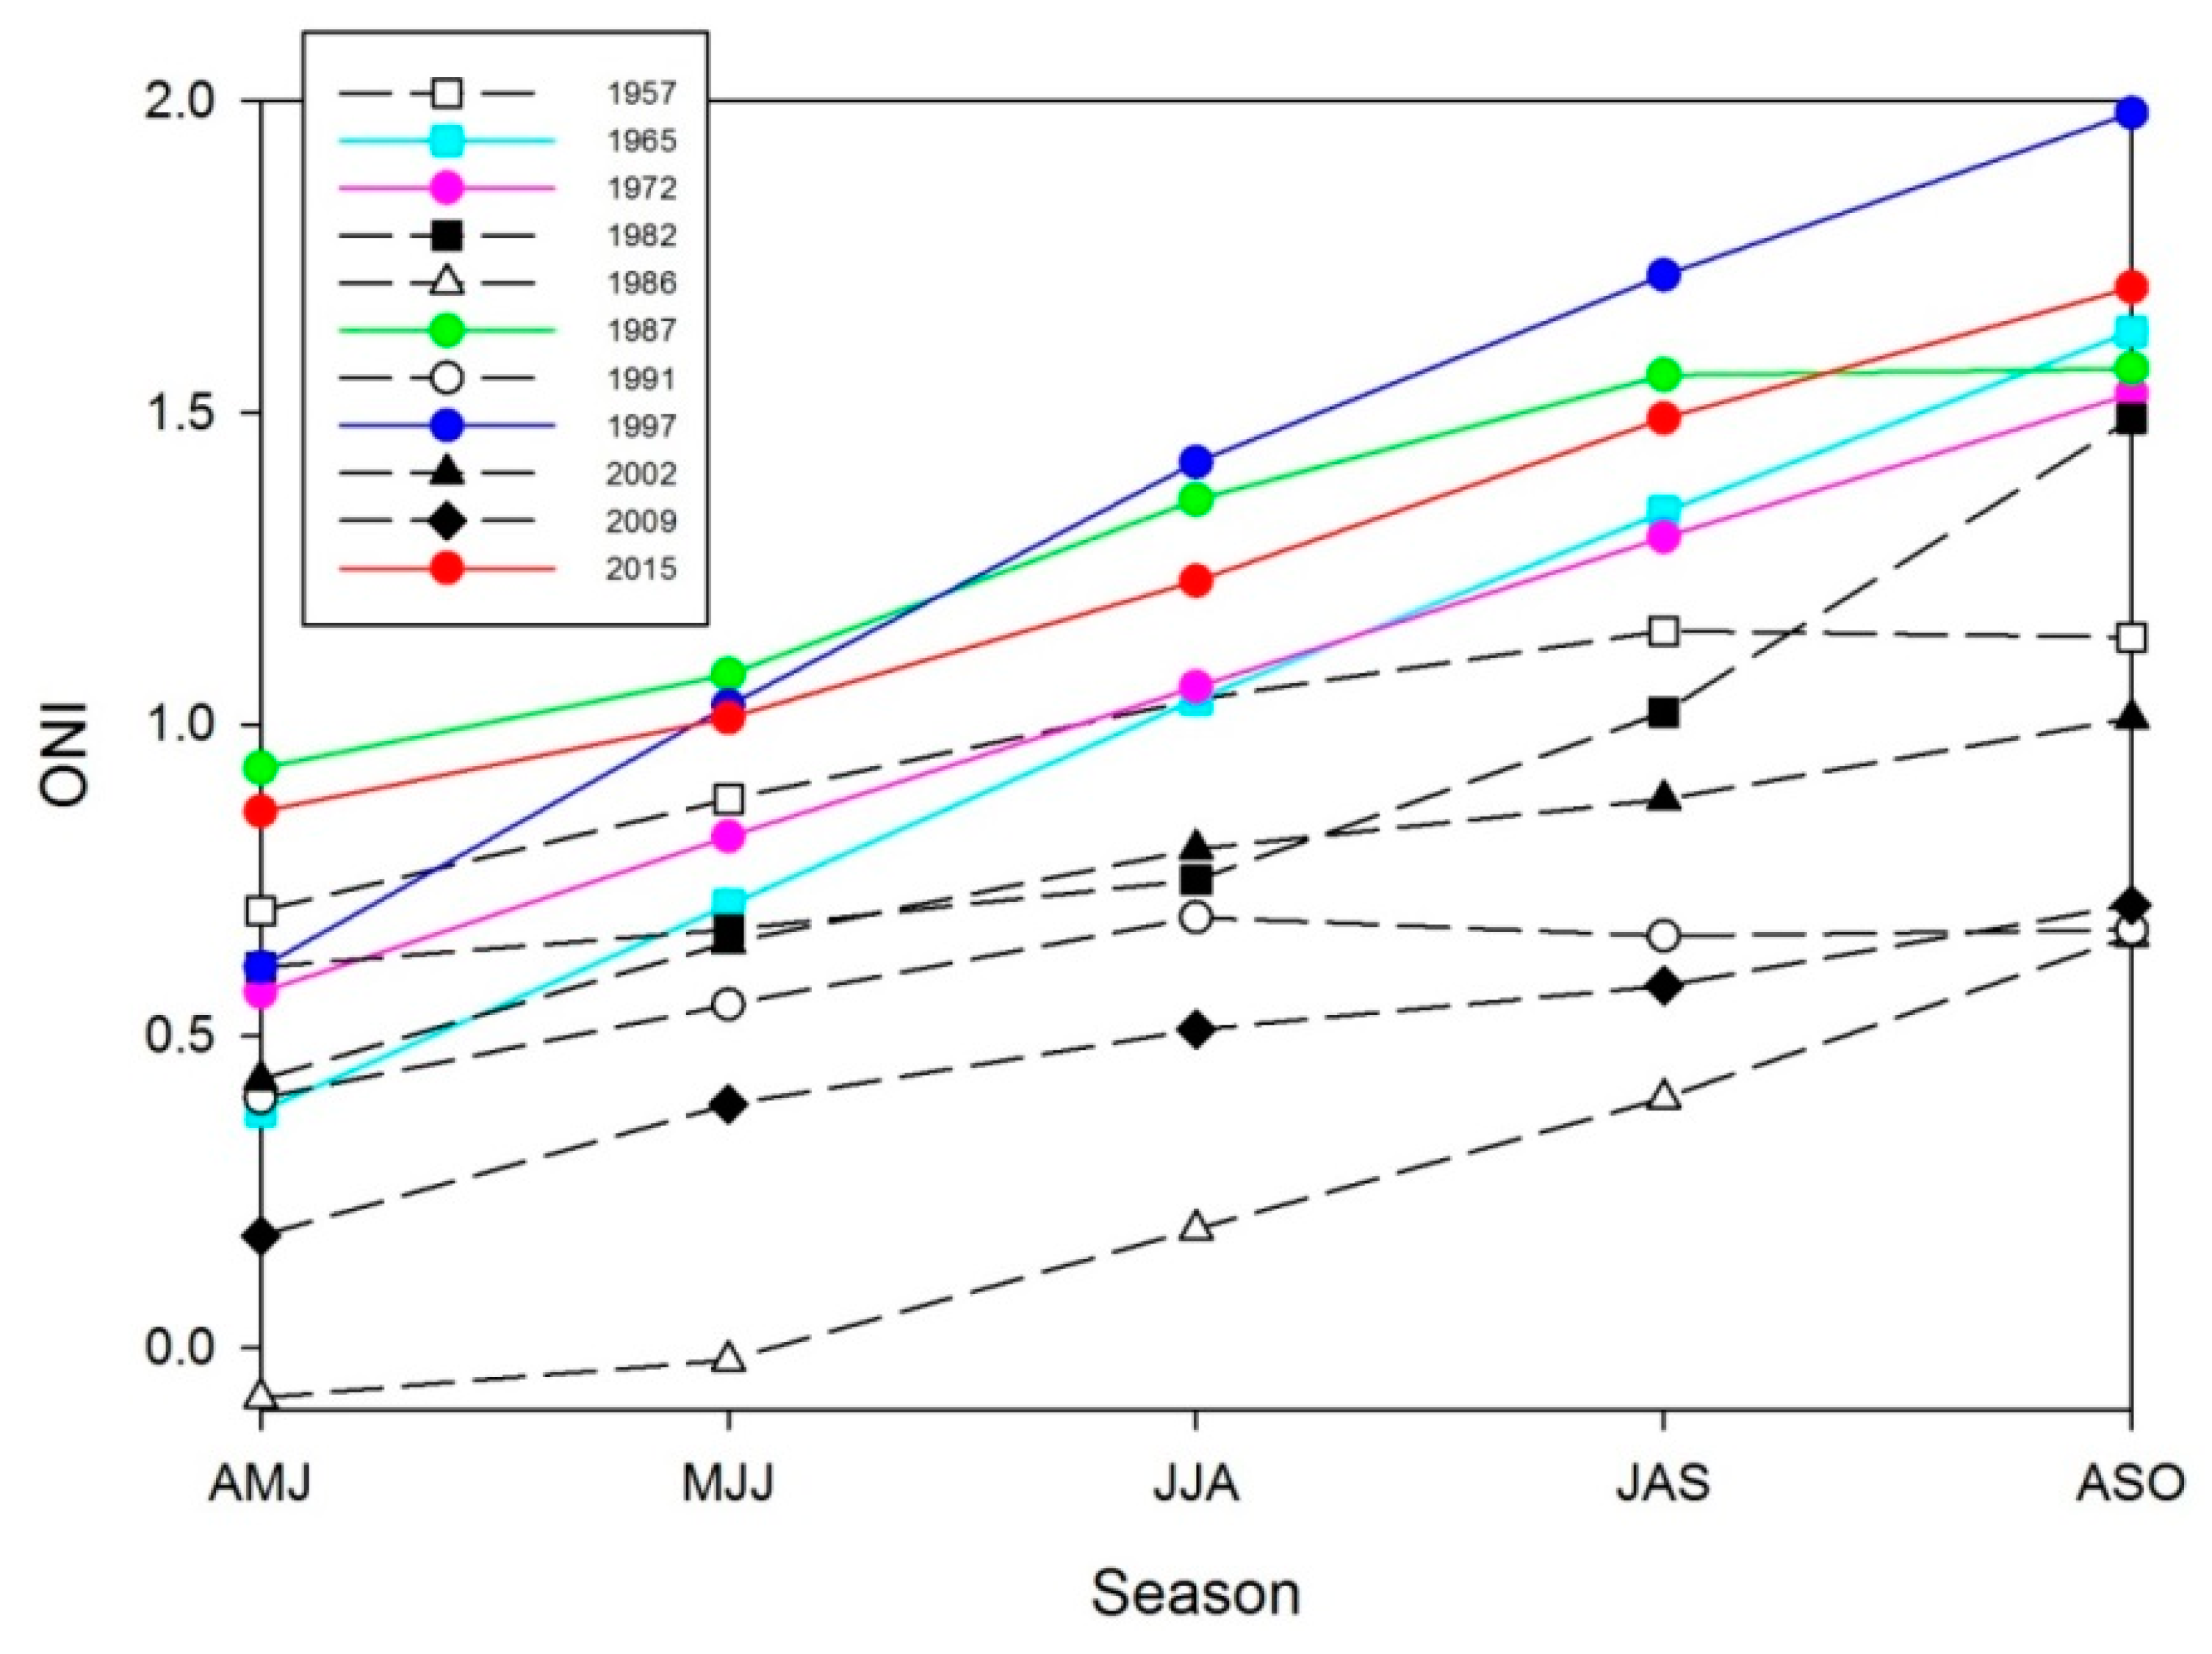
The Oceanic Niño Index (ONI) is one of the primary indices used to monitor the El Niño-Southern Oscillation (ENSO). The ONI uses the same Pacific Ocean region as the Niño-3.4 region (5°S–5°N; 170°W–120°W) and is calculated by averaging sea surface temperature anomalies for a 3-month time average (running mean) to better isolate variability closely related to the ENSO phenomenon [36]. Ten El Niño events (1957, 1965, 1972, 1982, 1986, 1987, 1991, 1997, 2002, and 2009) were identified and the seasonal ONI (April–June (AMJ), May–July (MJJ), June–August (JJA), July–September (JAS), August–October (ASO) for each of these events were correlated with seasonal ONI for the 2015 El Niño. Historic El Niño’s which correlated (significance greater than 99%) with the 2015 El Niño were retained [26]. A two-sample t-test of the means (significance greater than 99%) was then performed with the retained historic El Niño’s and 2015 El Niño events [26]. This resulted in four El Niño events (1965, 1972, 1987, and 1997) being statistically similar to the 2015 El Niño (Figure 2).
The United States Geological Survey’s (USGS) Hydro-Climatic Data Network 2009 is an updated list of stream gaging stations where discharge primarily reflects prevailing meteorological conditions (unimpaired streamflow gaging stations hereon referred to as gages) [37]. These gages have been screened to exclude those where human activities, such as artificial diversions, storage, and other activities in or near the stream channel, affect the natural flow patterns. The purpose of the network is to provide a streamflow data set suitable for analyzing hydrologic variations and trends in a climatic context [37]. Thirty-two (32) unimpaired gages were identified in MS-AL. The USGS National Water Information System (NWIS) was accessed to determine the availability of historic monthly streamflow for the 32 gages [38]. Five coastal MS-AL gages were identified that had a minimum of 50 years of continuous data (Figure 1 and Table 1).
For each of the five gages, monthly (January through August) volume (million cubic meters (MCM) and acre feet (AF)) was determined for a 57-year (1960–2016) period of record. The historic long-term average flow was based on 56 years (1960–2015) of record. Streamflow data were selected for this study based on the historic length of the record and the unimpaired flows represent basin wide response to precipitation.
Initially, an evaluation was performed to compare the historic long-term average to years (1966, 1973, 1988, and 1998) following a statistically significant El Niño event. To accomplish this, the departure (percentage difference) between each post-El Niño year and the historic long-term average was calculated monthly for each gage. Thus, for each month, 20 departure values (four post-El Niño years and five gages) were calculated. The results can be used to predict the monthly trends in 2016 coastal MS-AL streamflow based on the statistical similarity of the selected El Niño events to the 2015 El Niño event.
From these results, two seasonal forecasts (winter-spring (JFMA) and summer (JJA)) were developed, similar to the ensemble streamflow prediction (ESP) [26]. Given that the evaluation of the ONI ended in October of 2015, the lead-times of these predictions were two months and seven months, respectively. To accomplish this, the departure (percentage difference) between each post-El Niño year and the historic long-term average was calculated for each season (JFMA and JJA), for each gage. Thus, for each season, 20 departure values (four post-El Niño years and five gages) were calculated. The seasonal trends were then compared to 2016 observations.
Finally, winter-spring and summer season exceedance probabilities were determined for each gage [39]. To calculate the historic long-term exceedance probability, yearly flows were ranked (largest to smallest) and a Weibull distribution (probability equals n divided by m + 1) where m is the number of years (e.g., 56) and n is the ranking (e.g., n = 1 for the largest value while n = 56 for the smallest value) was used. The same procedure was applied to post-El Niño years to develop an exceedance probability to predict 2016. Both exceedance probabilities were compared to 2016 observations.

3. Results

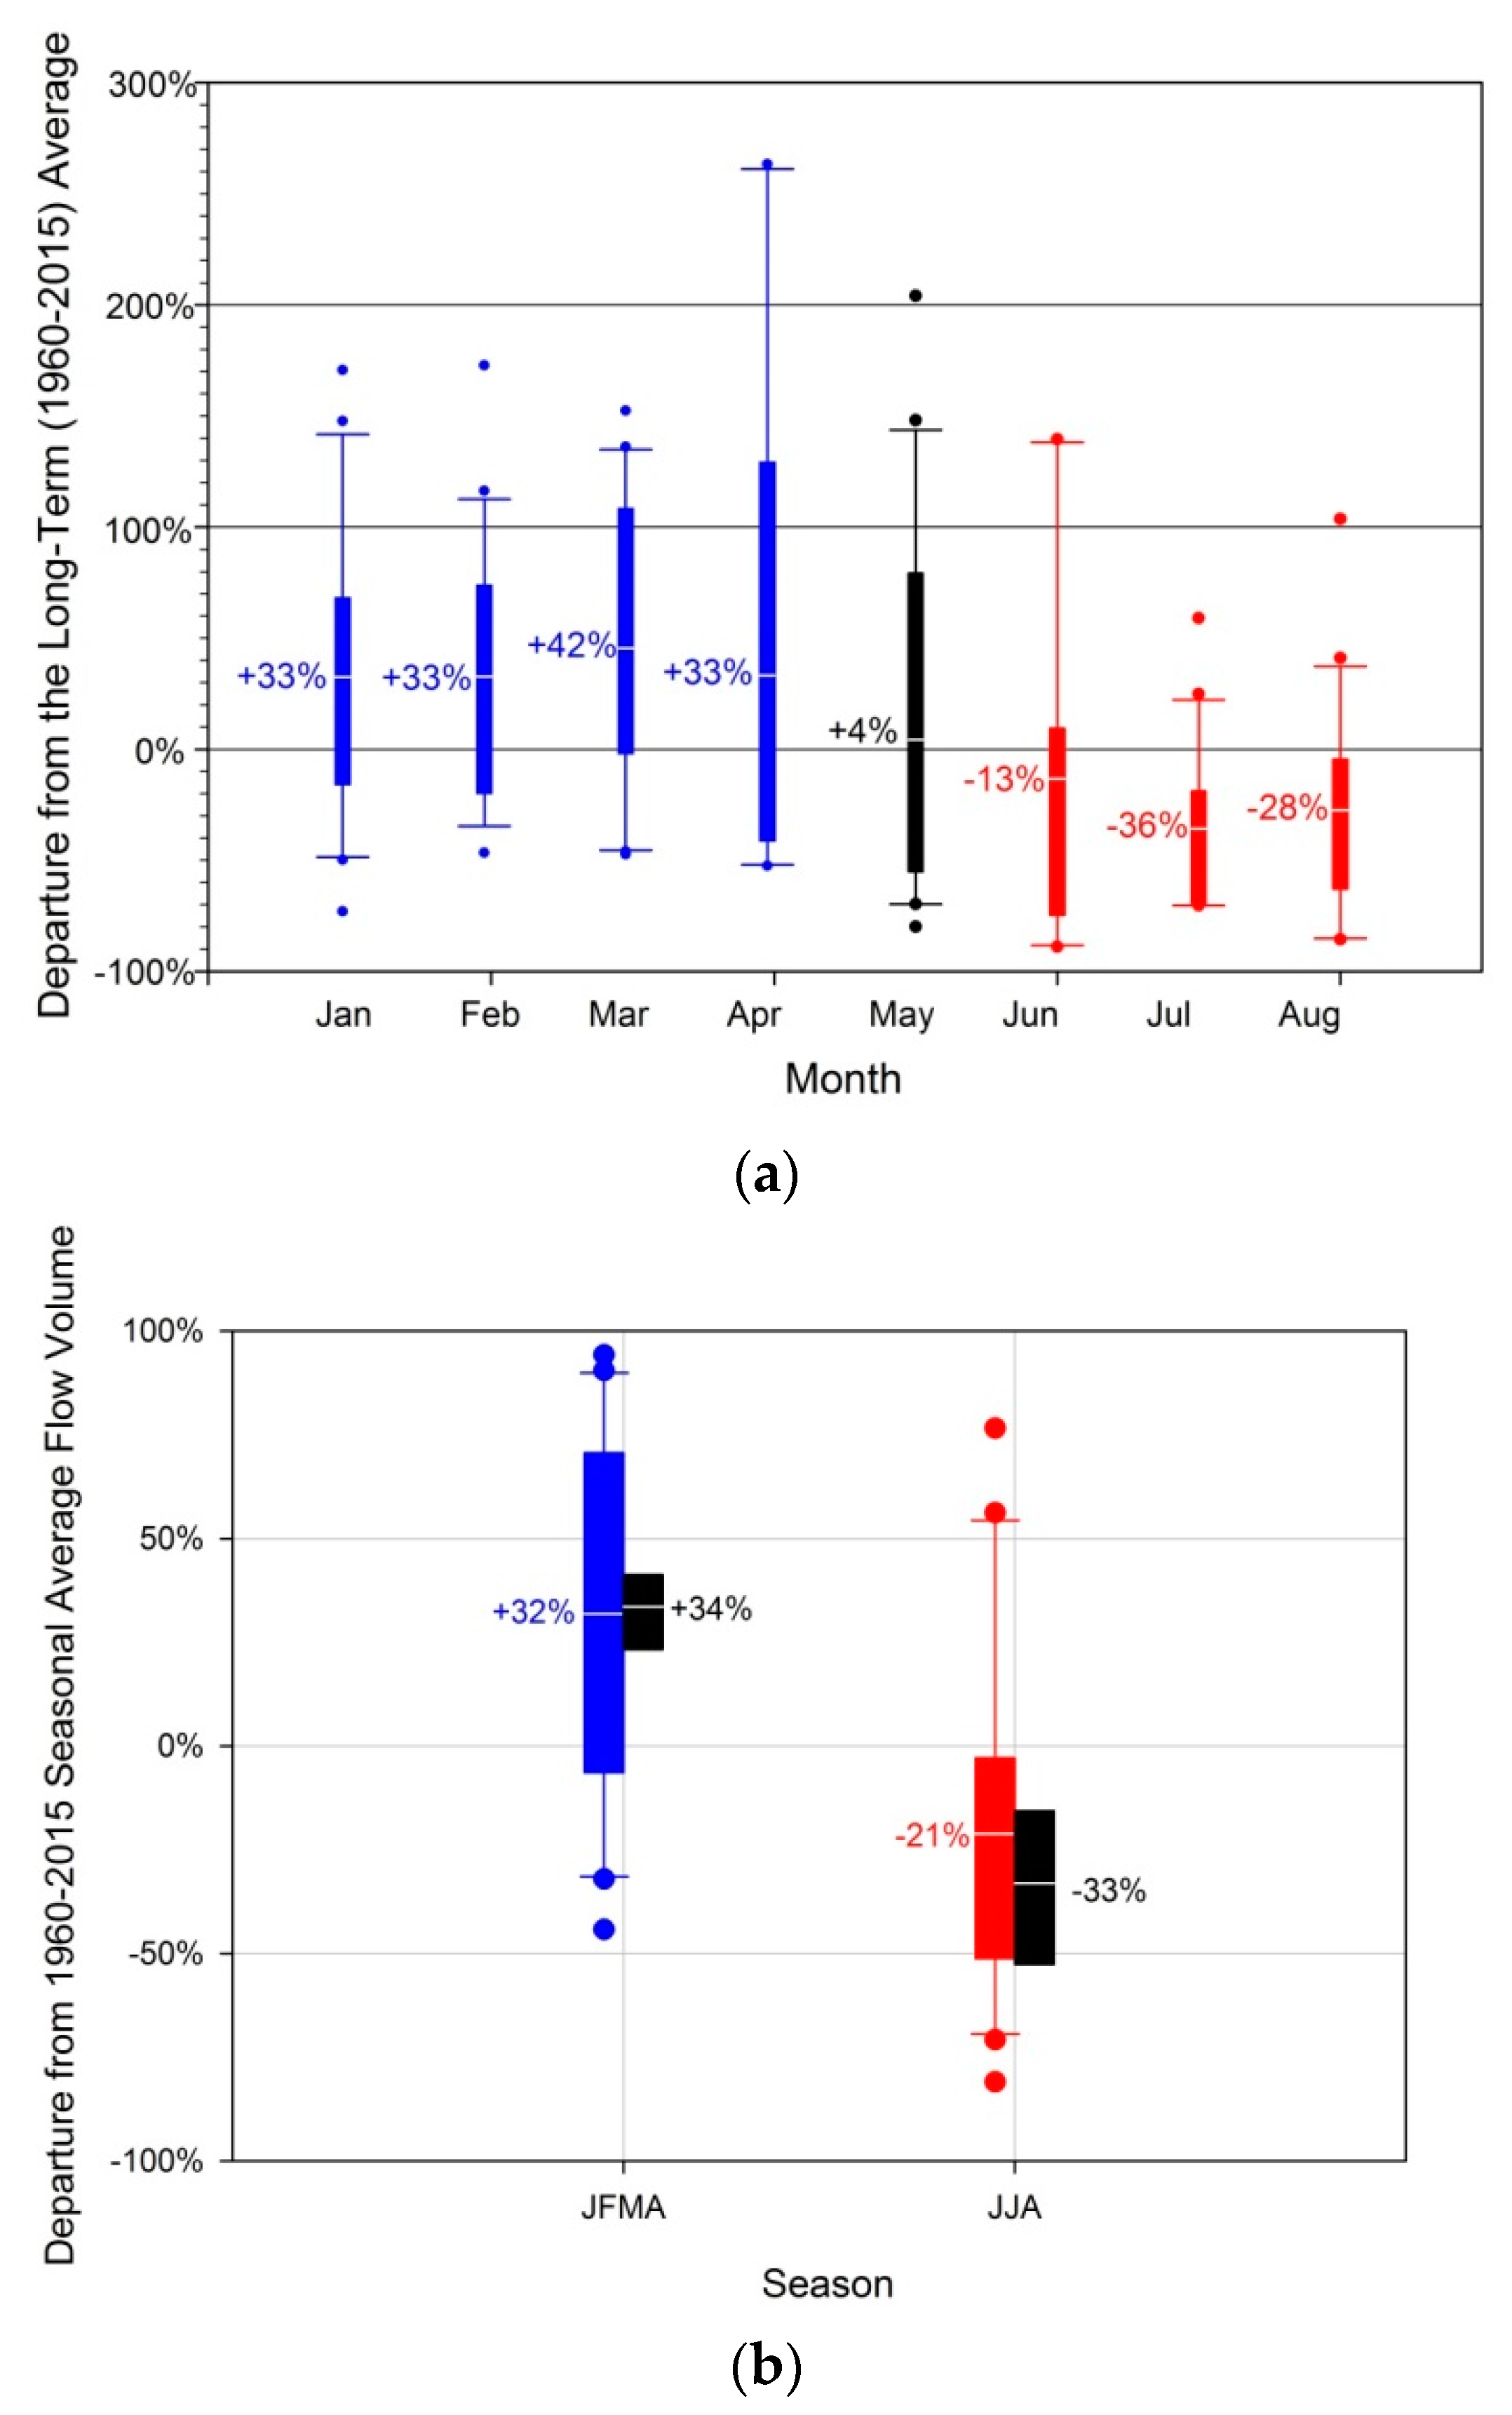
When compared to the long-term average (1960–2015), post-El Niño (1966, 1973, 1988, and 1998) January through August increases in streamflow for the five gages ranged from 7% to 27% with an average increase of 20%. However, this increase during the eight-month period was entirely due to unusually high (~32% greater) streamflow during the winter-spring season (January through April; Figure 3a). The month of May appears to be a turning point, as post-El Niño streamflow was similar to the long-term average (Figure 3a).
However, summer season (JJA) post-El Niño streamflow decreased substantially (~21%), compared to the long-term average (Figure 3b). For 2016, winter-spring streamflow had an average increase of ~34%, while summer streamflow volumes had an average decrease of ~33%. Thus, the 2016 seasonal observations compared very favorably with the seasonal predictions (Figure 3b).
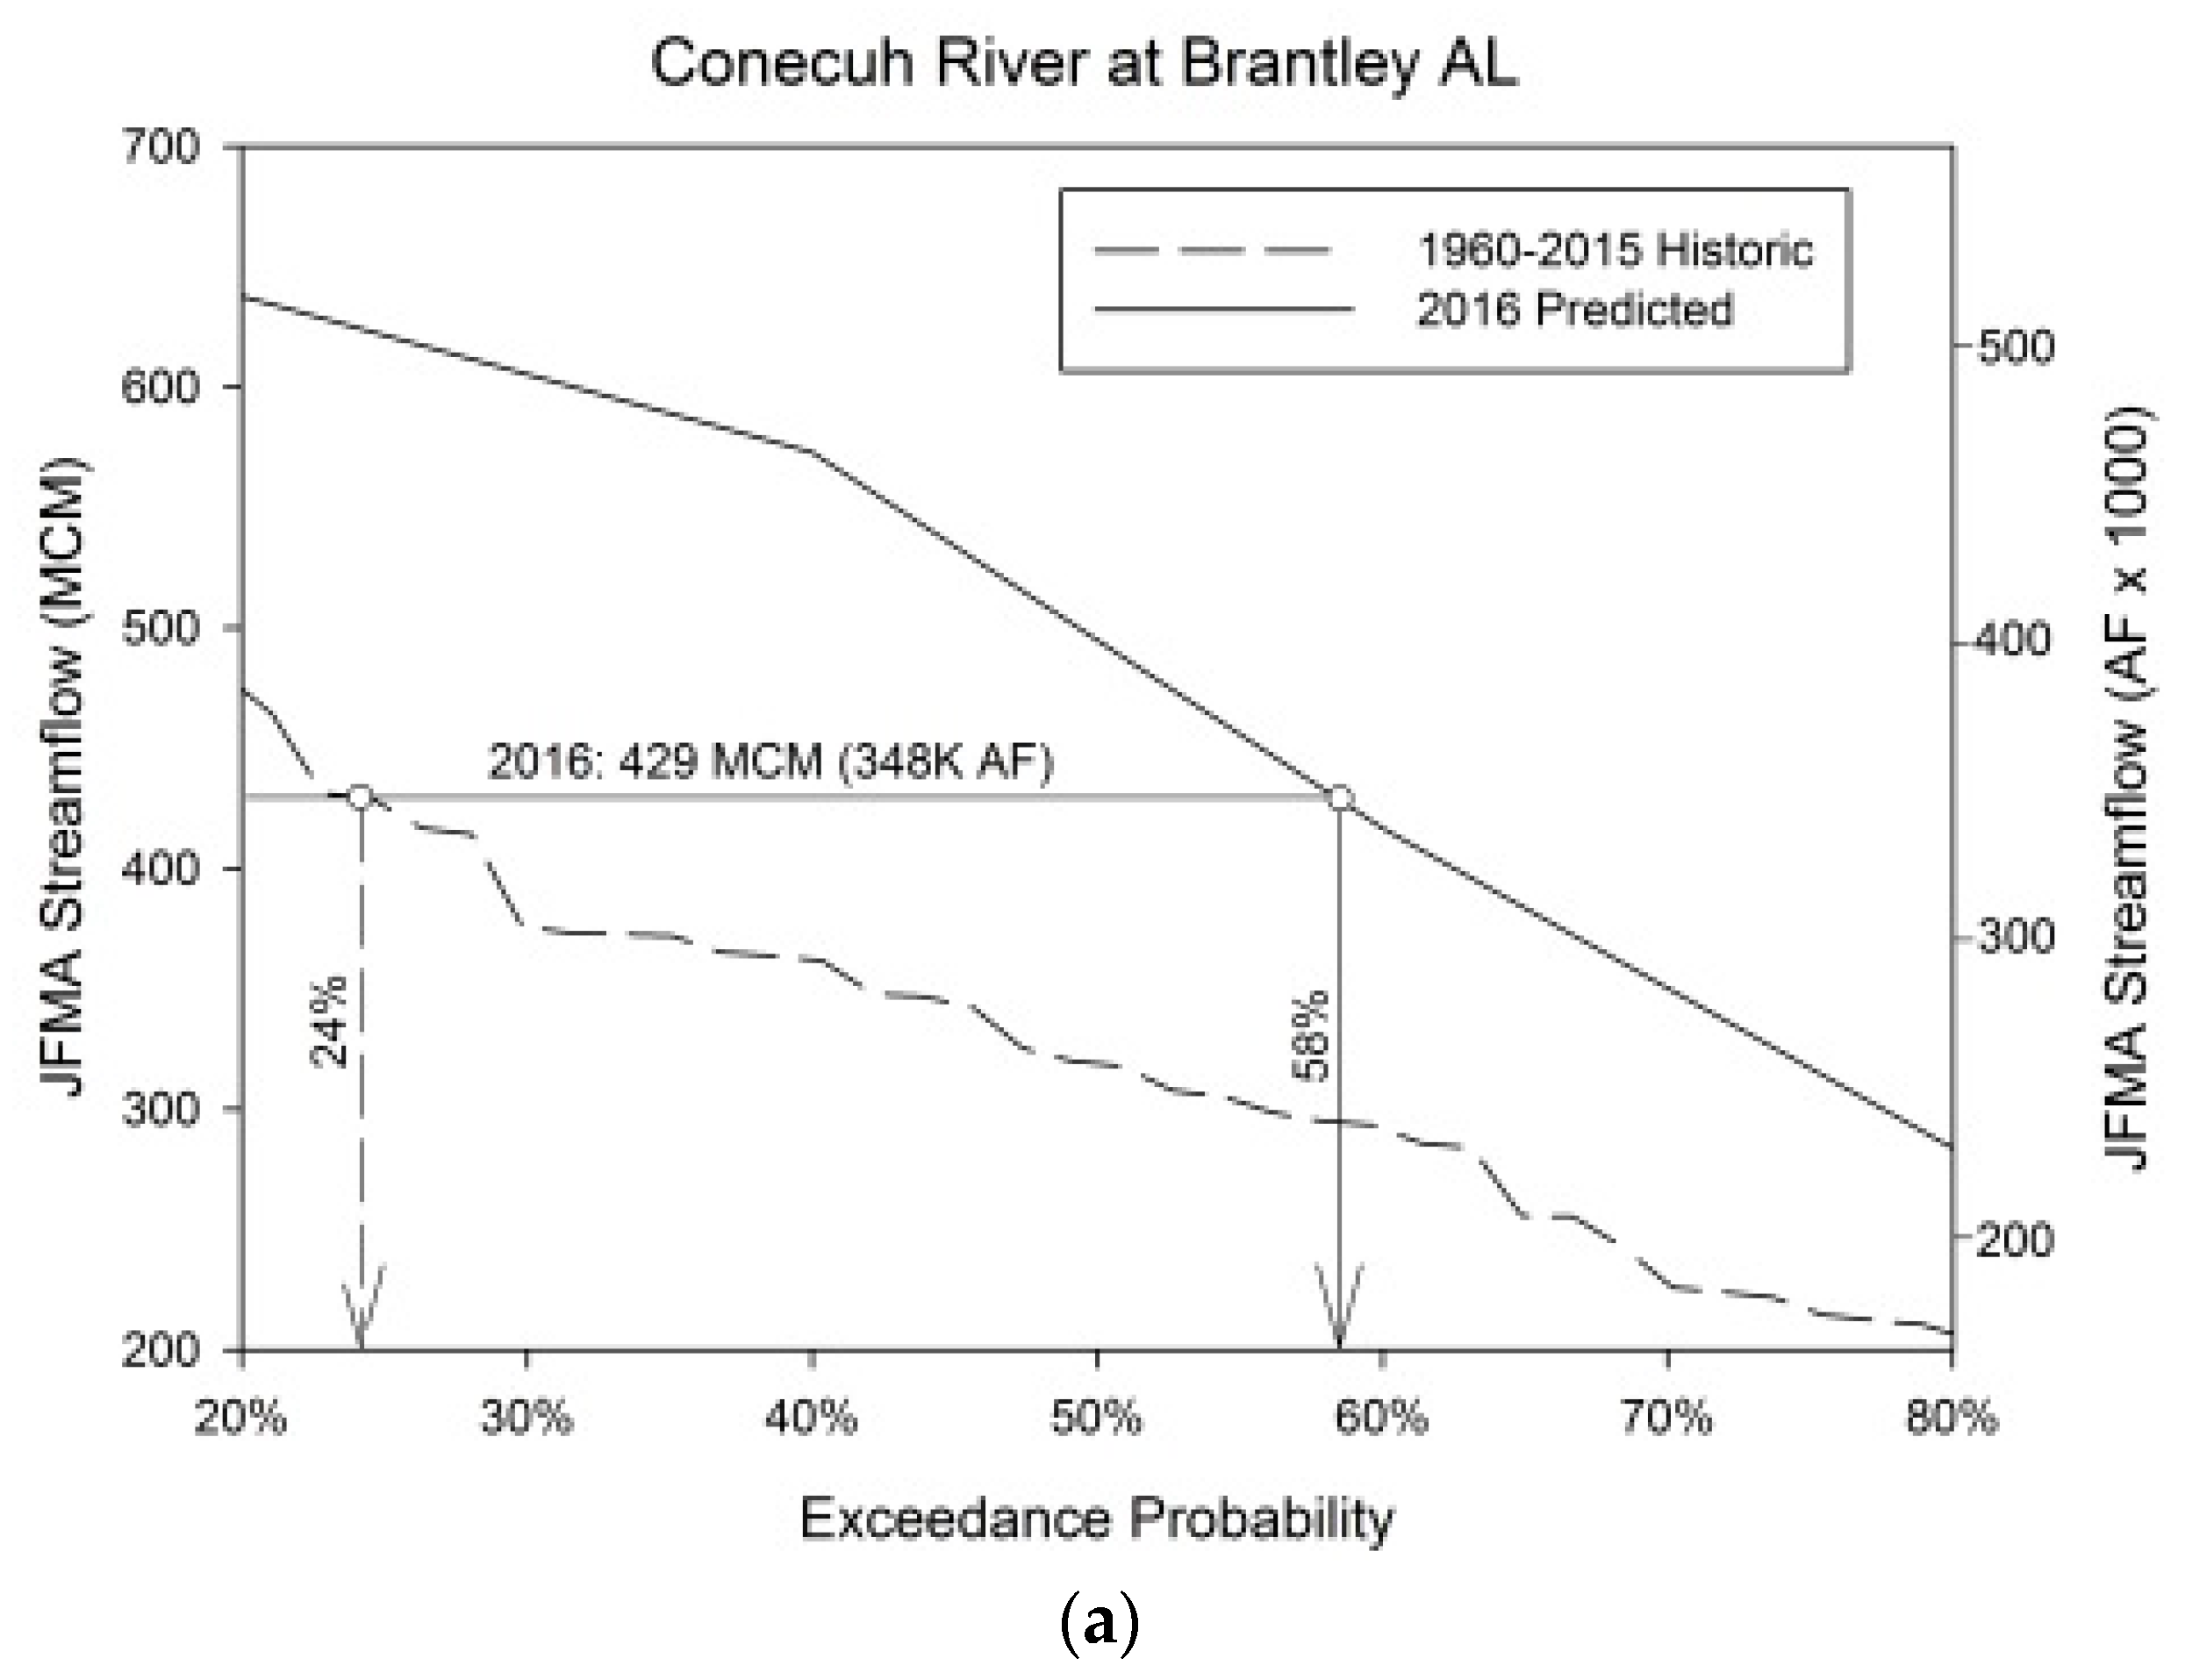
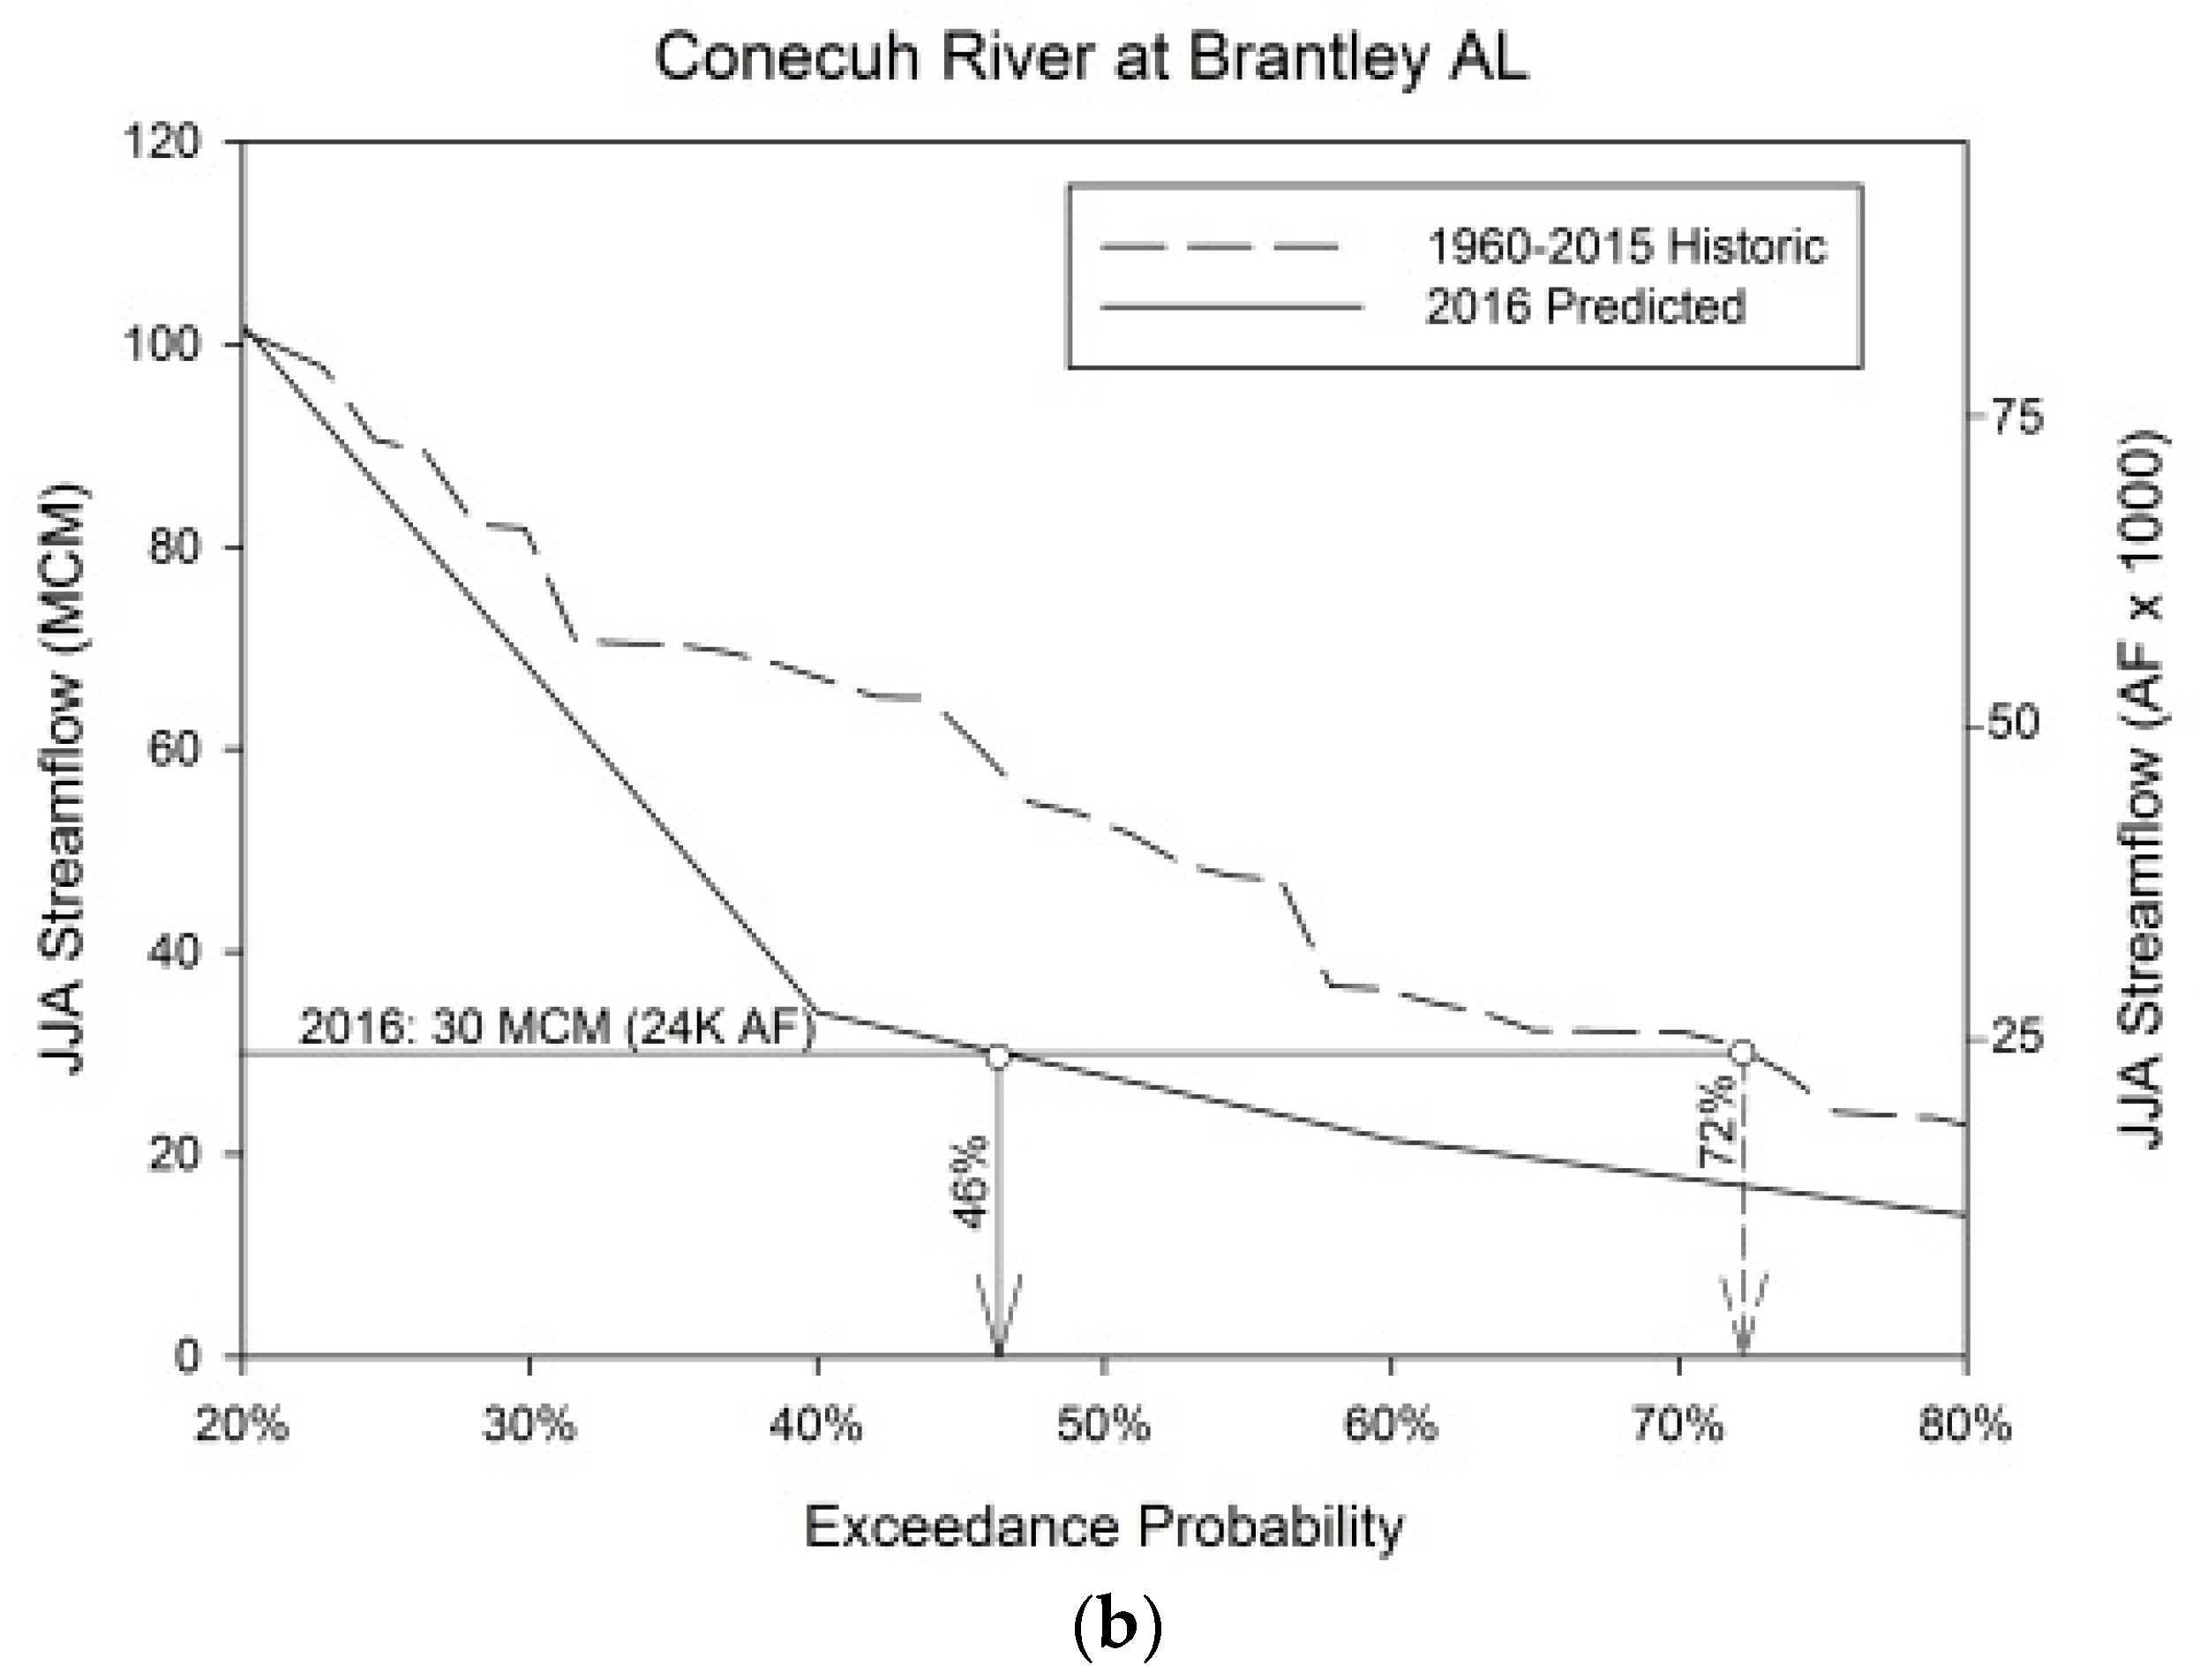
In evaluating individual gages using exceedance probabilities, the need to consider El Niño in long lead-time predictions of seasonal streamflow volumes was clearly identified. Exceedance probabilities for winter-spring season post-El Niño years displayed substantially greater streamflow than the exceedance probabilities for the winter-spring season based on long-term streamflow. The opposite was generally observed for the summer season post-El Niño years, with streamflow less than the exceedance probabilities for the summer season relative to historic long-term streamflow volumes. When evaluating the 2016 El Niño impact on streamflow, winter-spring season streamflow exceedance probabilities ranged from 42% to 63% with an average of 53% when utilizing the predicted El Niño exceedance probability curve for each gage. When using the long-term average exceedance probability curve for each gage, exceedance probabilities ranged from 14% to 30% with an average of 21%. Thus, when El Niño was considered, the predicted 2016 winter-spring season streamflow volumes (average of 53% exceedance) were nearly equal to what was expected. However, if El Niño was not considered and the prediction was based on the long-term average, the predicted 2016 winter-spring season streamflow volumes (average of 21% exceedance) were far greater than expected. When evaluating the 2016 El Niño impact on streamflow, summer season streamflow exceedance probabilities ranged from 35% to 90% with an average of 53% when utilizing the predicted El Niño exceedance probability curve for each gage. When using the long-term average exceedance probability curve for each gage, exceedance probabilities ranged from 50% to 80% with an average of 66%. Thus, when El Niño was considered, the predicted 2016 summer season streamflow volumes (average of 53% exceedance) were consistent with expected values. However, if El Niño was not considered and the prediction was based on the long-term average, the predicted 2016 summer season streamflow volumes (average of 66% exceedance) were less than expected. An example is provided for the Conecuh River (Figure 4).

4. Discussion and Conclusions

This research indicates that expected moisture associated with El Niño conditions is misleading in the SE US. As previous research indicates, El Niño conditions are expected to increase moisture (e.g., precipitation, streamflow) throughout the SE US. While generally for the calendar year there is an increase in moisture, this research indicates that moisture associated with El Niño conditions increases during winter to early spring months (JFMA), but transitions in May, with dryer than normal conditions during the summer (JJA). These results are validated by Wang et al. (2000; [40]), which showed precipitation anomalies throughout the SE US in the late winter, with increased precipitation that develops in January and persists through February and March. Furthermore, Wang et al. (2012; [41]) showed that for the summer following an El Niño, precipitation in coastal MS-AL was below normal, due to the eastward shift of the tropical forcing associated with sea surface temperature (SST) anomalies.
Increased moisture in the late winter/early spring and dry conditions during the summer presents quite a double-edged sword to the agricultural industry of the SE US. Based on the present research, the JFMA period, which is associated with spring planting, would have overall increased precipitation and result in over saturated soil conditions, making planting difficult, as reflected in the 2009–2010 El Niño event [22]. On the other hand, dryer than normal conditions during the growing season (JJA) would result in far lower crop yields [42]. Contrary to previously perceived notions by the agricultural industry that El Niño events were associated with an increase in moisture throughout the year and therefore greater crop yields, this research indicates that the timing of the associated soil moisture during the year would result in an overall decrease in crop yields, especially for moisture-sensitive plants like those grown in the SE US (e.g., peanuts, corn, soybeans, cotton).
According to the Alabama Peanut Producers Association, a division of the Alabama Farmers Association (ALFA), approximately half the peanuts produced in the United States are grown within a 150 km (100-mile) radius of Dothan, Alabama [42]. This highlights the economic importance that the peanut industry represents to communities in coastal Alabama. On October 14, 2016, an article entitled “Dry Weather, Low Prices Hurt Farmers” [43] stated—“Alabama Cooperative Extension System specialists said they expect lower-than-normal yields for corn and average yields for soybeans and cotton across the stat”. Thus, the 2016 El Niño, which resulted in abnormally dry summer conditions, appears to have significantly impacted crop production. The ability to provide farmers predictive information about seasonal precipitation, including monthly and seasonal variability is critical. To this point, there has been limited research on the seasonal signal of streamflow and associated moisture, specifically during the summer season, in coastal MS-AL, which is quite important for agricultural yields in these states. The current research shows the importance of considering the ENSO signal in coastal MS-AL agricultural practices and provides the agricultural industry a better understanding of what to expect from the planting season (i.e., winter–spring season) through the growing season (i.e., summer season), and how to better plan for climatic variability during the growth period of these economically vital crops.

Author Contributions

All analytical work was conducted by lead author S.T.S., with direct advisement and manuscript preparation by co-authors G.T. and E.E.. Further assistance in analytical review, as well manuscript preparation and review were provided by co-authors V.L., M.T. and A.K.

Funding

Support provided by the Mississippi Alabama Sea Grant Consortium, United States (U(R/RCE-05), the United States Environmental Protection Agency Gulf of Mexico Program (EPA-MX-00D67718-0) and the National Science Foundation Paleo Perspectives on Climate Change, United States (18059590). The authors gratefully acknowledge use of the resources of the Alabama Water Institute at The University of Alabama.

Conflicts of Interest

The authors declare no conflict of interest. The funders had no role in the design of the study; in the collection, analyses, or interpretation of data; in the writing of the manuscript, or in the decision to publish the results.

References

  1. Xue, Z.; Liu, P.; Qian, G. Changes in hydrology and sediment delivery of Mekong River in the last 50 years: Connections to damming and Monsoon and ENSO. Earth Surf. Process. Landf. 2011, 36, 296–308. [Google Scholar] [CrossRef]
  2. Drexler, J.; Ewel, K. Effect of the 1997–1998 ENSO-related drought on hydrology and salinity in a Micronesian wetland complex. Estuaries 2001, 24, 347–356. [Google Scholar] [CrossRef]
  3. Hamlet, A.; Lettenmaier, D. Columbia River streamflow forecasting based on ENSO and PDO climate signals. J. Water Resour. Plan. Manag. Sci. 1999, 125, 333–341. [Google Scholar] [CrossRef]
  4. Hamlet, A.; Mote, P.; Clark, M.; Lettenmaier, D. Effect of temperature and precipitation variability on snowpack trends in the western United States. J. Clim. 2005, 18, 4545–4561. [Google Scholar] [CrossRef]
  5. Scanlon, B.; Keese, K.; Flint, A.; Flint, L.; Gaye, C.; Edmunds, W.; Simmers, I. Global synthesis of groundwater recharge in arid and semi-arid regions. Hydrol. Process. 2006, 20, 3335–3370. [Google Scholar] [CrossRef]
  6. Hansen, J. Realizing the potential benefits of climate prediction to agriculture: Issues, approaches, challenges. Agric. Syst. 2002, 74, 309–330. [Google Scholar] [CrossRef]
  7. Reilly, J. US Agriculture and climate change: New Results. Clim. Chang. 2003, 57, 43–69. [Google Scholar] [CrossRef]
  8. Hansen, J.W.; Hodges, A.W.; Jones, J.W. Enso Influences on Agriculture in the Southeastern United States. J. Clim. 1998, 11, 404–411. [Google Scholar] [CrossRef]
  9. Nag, B.; Misra, V.; Bastola, S. Validating ENSO teleconnections on Southeastern US Winter hydrology. Earth Interact. 2014, 18, 1–23. [Google Scholar] [CrossRef]
  10. Goolsby, D.A.; Battaglin, W.A.; Lawrence, G.B.; Artz, R.S.; Aulenbach, B.T.; Hooper, R.P.; Stensland, G.J. Flux and sources of nutrients in the Mississippi-Atchafalaya River Basin: Topic 3 Report for the Integrated Assessment on Hypoxia in the Gulf of Mexico; National Oceanic and Atmospheric Administration National Ocean Service Coastal Ocean Program: Silver Spring, MD, USA, 1999.
  11. Mo, C.K. Drought onset and recovery over the United State. Geophys. Res. 2011, 116, 1–14. [Google Scholar] [CrossRef]
  12. Liang, Y.C.; Lo, M.H.; Yu, J. Asymmetric responses of land hydroclimatology to two types of El Niño in the Mississippi River Basin. Geophys. Res. Lett. 2014, 41, 582–587. [Google Scholar] [CrossRef]
  13. Twine, T.E.; Kucharik, J.C.; Foley, J.A. Effects of El Niño–Southern Oscillation on the Climate, Water Balance, and Streamflow of the Mississippi River Basin. J. Clim. 2005, 18, 4840–4861. [Google Scholar] [CrossRef]
  14. Solow, A.R.; Adams, R.F.; Bryant, K.J.; Legler, D.M.; O’Brien, J.J.; Bruce, A.M.; Nayda, W.; Weiher, D. The Value of Improved ENSO Prediction to U.S. Agriculture. Clim. Change 1998, 39, 47–60. [Google Scholar] [CrossRef]
  15. Phillips, J.; Rajagopalan, B.; Cane, M.; Rosenzweiga, C. The Role of Enso in Determining Climate and Maize Yield Variability in the U.S. Cornbelt. Int. J. Clim. 1999, 19, 877–888. [Google Scholar] [CrossRef]
  16. Park, J.; Mjelde, J.W.; Fuller, S.W.; Malaga, J.E.; Rosson, C.P.; Dainello, F.J. An Assessment of the Effects of ENSO Events on Fresh Vegetable and Melon Supplies. Publ. Am. Soc. Hortic. Sci. 2002, 37, 287–291. [Google Scholar] [CrossRef]
  17. Garcia, A.G.; Persson, T.; Paz, J.O.; Fraisse, C.; Hoogenboom, G. ENSO-based climate variability affects water use efficiency of rainfed cotton grown in the southeastern USA. Agric. Ecosyst. Environ. 2010, 139, 629–635. [Google Scholar] [CrossRef]
  18. Peters, A.J.; Lei Ji, L.; Walter-Shea, E.; Southeastern, U.S. Vegetation Response to Enso Events. Clim. Chang. 2003, 60, 175–188. [Google Scholar] [CrossRef]
  19. Paz, J.O.; Fraisse, C.W.; Hatch, L.U.; Garcia, A.; Guerra, L.C.; Uryasev, O.; Bellowd, J.G.; Jones, J.W.; Hoogenbooma, G. Development of an ENSO-based irrigation decision support tool for peanut production in the southeastern US. Comput. Electron. Agric. 2007, 55, 28–35. [Google Scholar] [CrossRef]
  20. Woli, P.; Paz, J.O.; Hoogenboom, G.; Garcia, A.; Fraisse, W.C. The ENSO effect on peanut yield as influenced by planting date and soil type. Agric. Syst. 2013, 121, 1–8. [Google Scholar] [CrossRef]
  21. United States Department of Agriculture (USDA). 2016. Available online: https://www.nass.usda.gov/index.php (accessed on 4 November 2017).
  22. United States Department of Agriculture (USDA). 2011. Available online: https://www.nass.usda.gov/Statistics_by_State/Alabama/Publications/Annual_Statistical_Bulletin/2011/2011AlabamaAgricultureStatistics.pdf (accessed on 4 November 2017).
  23. National Oceanic and Atmospheric Administration (NOAA). 2016A. Available online: http://www.esrl.noaa.gov/psd/enso/past_events.html (accessed on 4 November 2017).
  24. Kahya, E.; Dracup, J.A. U.S. streamflow patterns in relation to the El Niño/Southern Oscillation. Water Resour. Res. 1993, 29, 2491–2503. [Google Scholar] [CrossRef]
  25. Tootle, G.A.; Piechota, T.C.; Singh, A. Coupled oceanic-atmospheric variability and U.S. streamflow. Water Resour. Res. 2005, 41, 1–11. [Google Scholar] [CrossRef]
  26. Tootle, G.A.; Piechota, T.C.; Aziz, O.; Miller, W.P.; Lakshmi, V.; Dracup, J.A.; Jerla, C. The 2009–2010 El Niño: Hydrologic Relief to U.S. Regions. Am. Geophys. Union EOS Trans. 2009, 90, 481–482. [Google Scholar] [CrossRef]
  27. Piechota, T.; Dracup, J.; Fovell, R. Western US streamflow and atmospheric circulation patterns during El Niño Southern Oscillation. J. Hydrol. 1997, 201, 249–271. [Google Scholar] [CrossRef]
  28. Chiew, F.; Piechota, T.; Dracup, J.; McMahon, T. El Niño Southern Oscillation and Australian rainfall, streamflow and drought: Links and potential for forecasting. J. Hydrol. 1998, 204, 138–149. [Google Scholar] [CrossRef]
  29. Piechota, T.; Chiew, F.; Dracup, J.; McMahon, T. Streamflow forecasting in eastern Australia and El Niño Southern Oscillation. Water Res. Res. 1998, 34, 3035–3044. [Google Scholar] [CrossRef]
  30. Gutierrez, F.; Dracup, J. An analysis of the feasibility of long-range streamflow forecasting for Columbia using El Niño Southern Oscillation indicators. J. Hydrol. 2001, 246, 181–196. [Google Scholar] [CrossRef]
  31. Clark, C.; Nnaji, G.; Huang, W. Effects of El-Nino and La-Nina Sea Surface Temperature Anomalies on Annual Precipitations and Streamflow Discharges in the Southeastern United States. J. Coast. Res. 2014, 68, 113–120. [Google Scholar] [CrossRef]
  32. Mitra, S.; Srivastava, P.; Singh, S.; Yates, D. Effect of Enso-Induced Climate Variability on Groundwater Levels in the Lower Apalachicola-Chattahoochee-Flint River Basin. Trans. Am. Soc. Agric. Biol. Eng. 2014, 57, 1393–1403. [Google Scholar]
  33. Rao, J.; Ren, R. Parallel comparison of the 1982/83, 1997/98 and 2015/16 super El Niños and their effects on the extratropical stratospher. Adv. Atmos. Sci. 2017, 34, 121–1133. [Google Scholar] [CrossRef]
  34. Zhai, P.; Yu, R.; Guo, Y.; Li, Q.; Ren, X.; Wang, Y.; Xu, W.; Liu, Y.; Ding, Y. The strong El Niño of 2015/16 and its dominant impacts on global and China’s climate. J. Meteorol. Res. 2016, 30, 283–297. [Google Scholar] [CrossRef]
  35. Zhao, X.; Rao, J.; Mao, J. The salient differences in China summer rainfall response to ENSO: Phases, intensities and flavors. Clim. Res. 2019, 78, 51–67. [Google Scholar] [CrossRef]
  36. National Oceanic and Atmospheric Administration (NOAA). 2016b. Available online: https://catalog.data.gov/dataset/climate-prediction-center-cpcoceanic-Niño-index (accessed on 4 November 2017).
  37. Lins, H.F. USGS Hydro-Climatic Data Network, 2009 (HCDN–2009); United States Geological Survey: Reston, VA, USA, 2012; p. 4.
  38. United States Geological Survey (USGS). 2016. Available online: http://waterdata.usgs.gov/nwis (accessed on 4 November 2017).
  39. Helsel, D.R.; Hirsch, R.M. Statistical Methods in Water Resources Techniques of Water Resources Investigations; United States Geological Survey: Reston, VA, USA, 2002; pp. 1–522.
  40. Wang, H.; Fu, R. Winter monthly mean atmospheric anomalies over the North Pacific and North America associated with El Nino SSTs. J. Clim. 2000, 13, 3435–3447. [Google Scholar] [CrossRef]
  41. Wang, H.; Kumar, A.; Wang, W.; Jha, B.U.S. summer precipitation and temperature patterns following the peak phase of El Nino. J. Clim. 2012, 25, 7204–7215. [Google Scholar] [CrossRef]
  42. Alabama Farmers Federation (ALFA). 2016. Available online: http://alfafarmers.org/stories/news-detail/dry-weather-low-prices-hurt-farmers#.WBK95ZUzXIU (accessed on 4 November 2017).
  43. Alabama Farmers Federation (ALFA). 2016. Available online: http://alfafarmers.org/programs/divisions/commodities/peanuts/ (accessed on 4 November 2017).
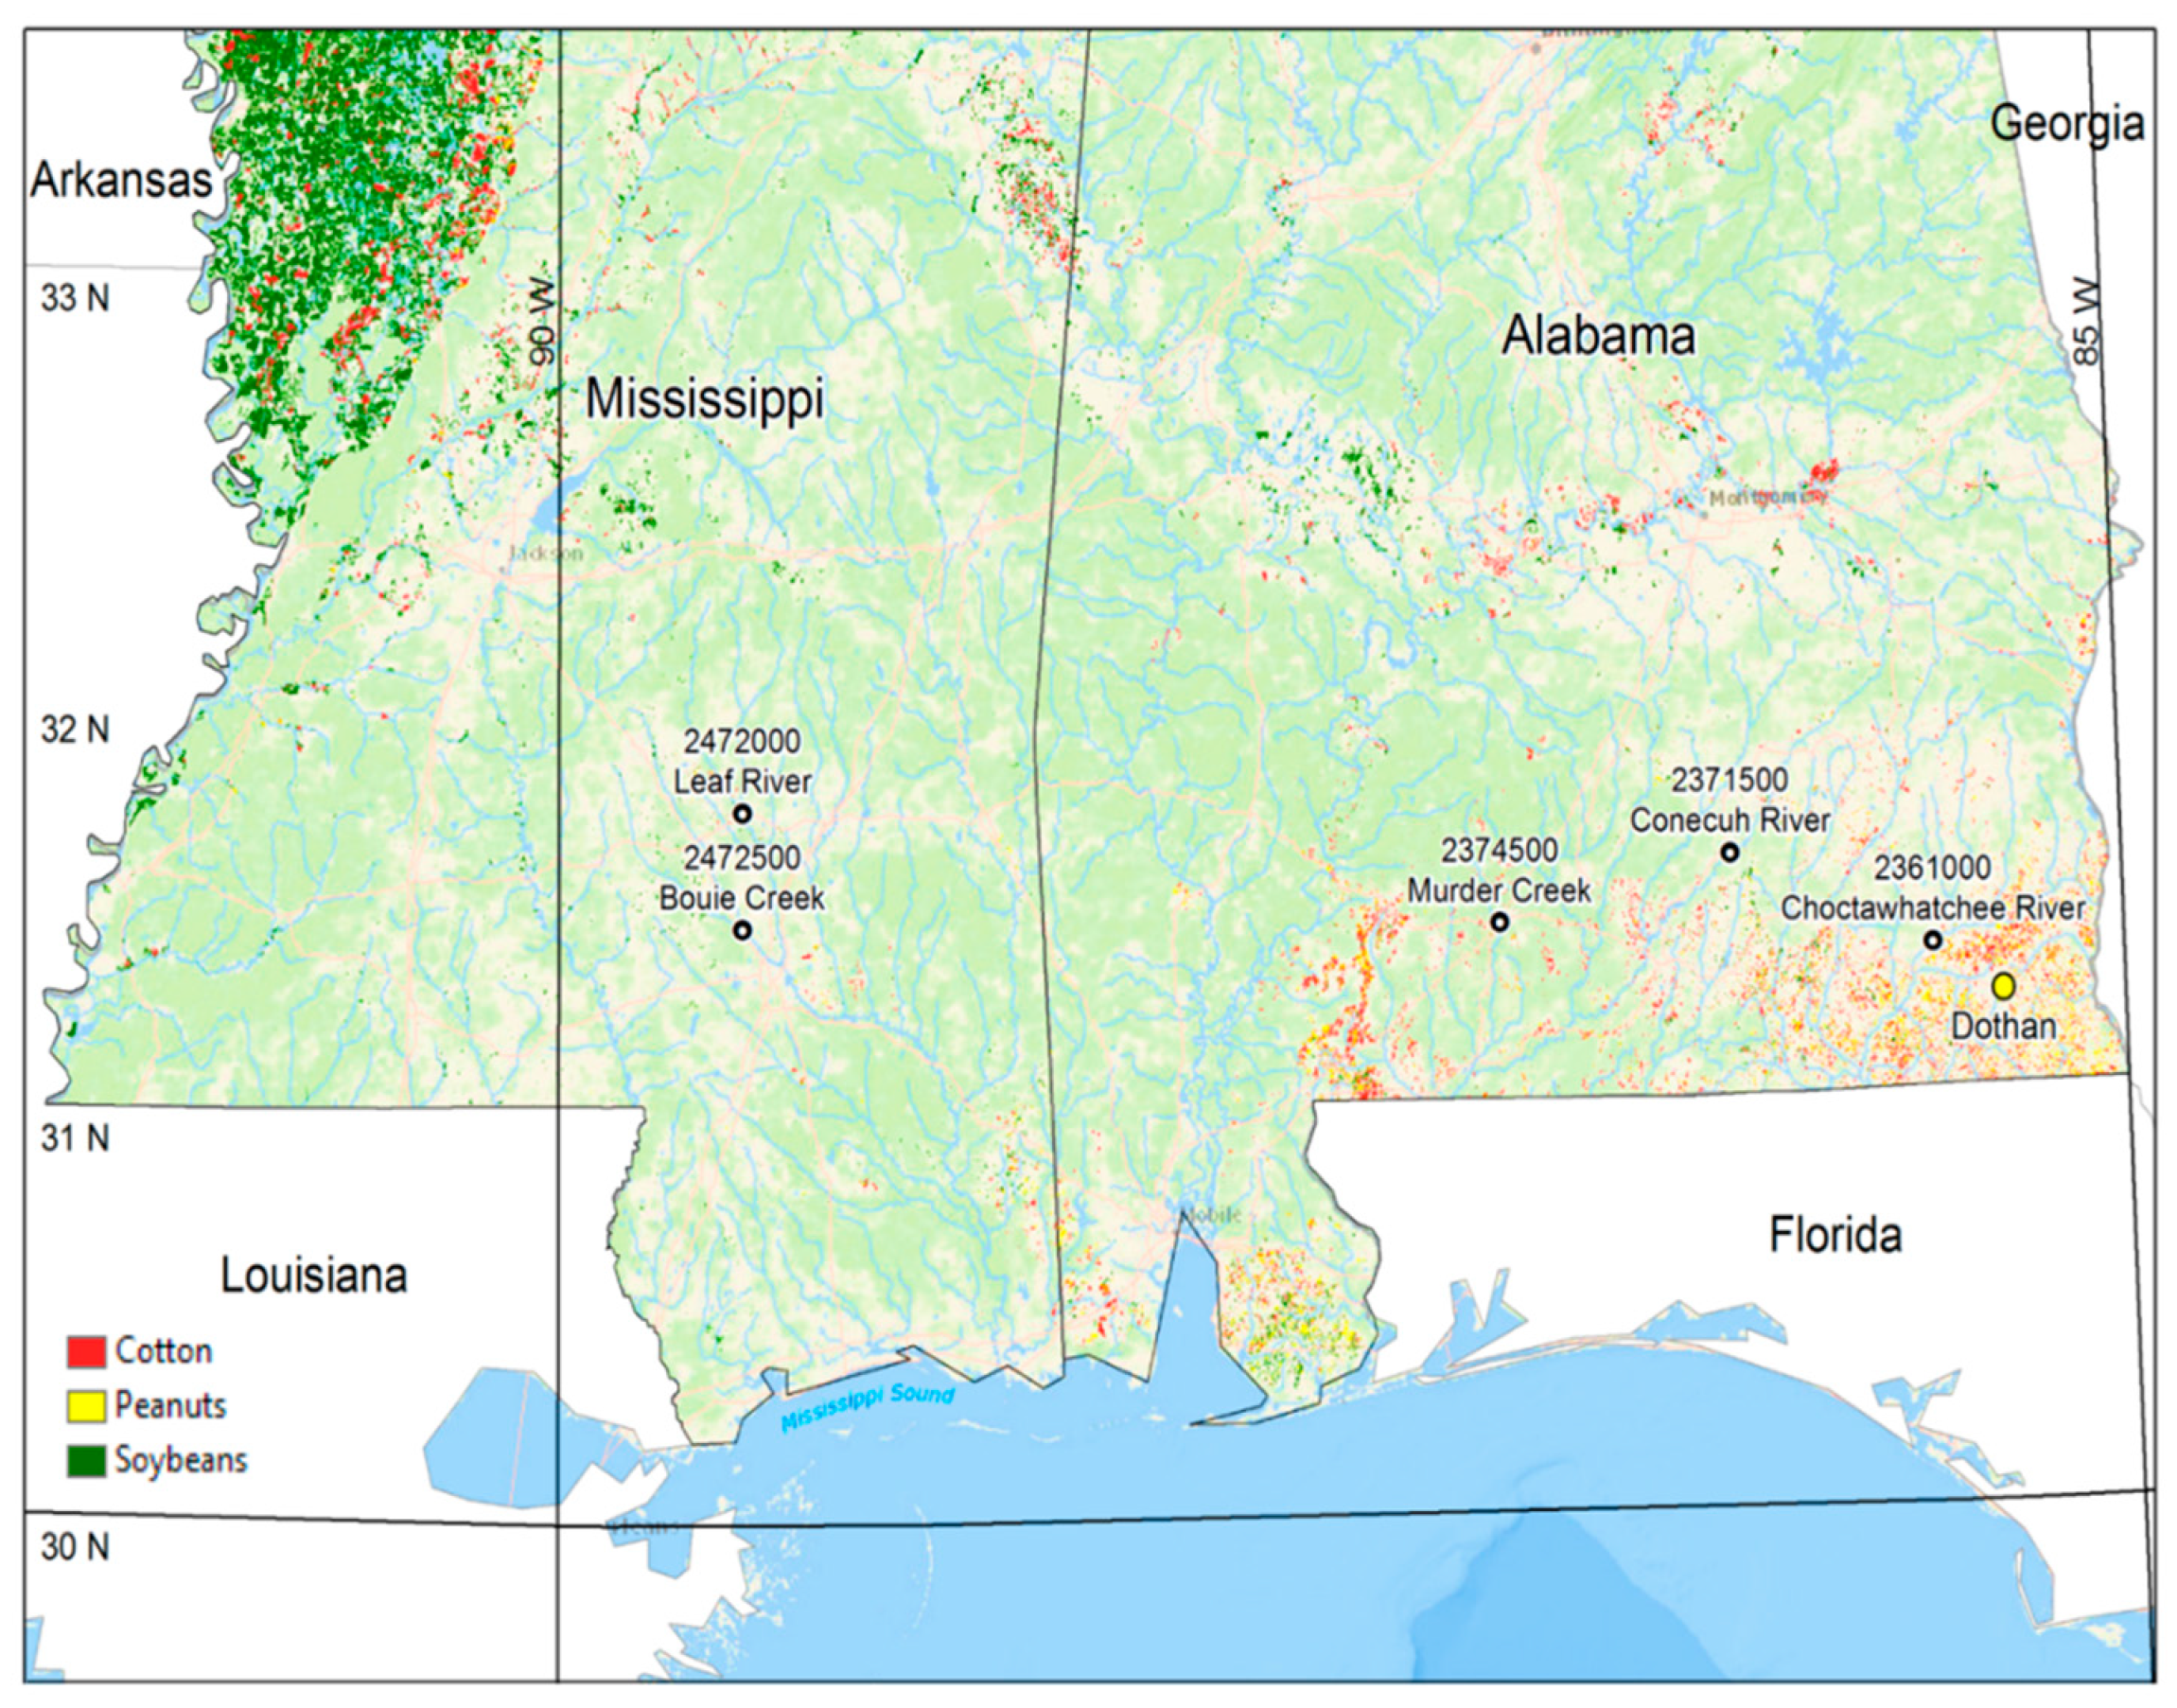
Figure 1. Map of coastal MS-AL showing the location of coastal streamflow gages along with areas where cotton, peanuts, and soybeans are grown. The crop data was acquired from the USDA Cropland Data Layer (2015).
Hydrology 06 00096 g001
Figure 2. Recent (historic) and the 2015 observed El Niño events, based on Niño 3.4 sea surface temperature (SST) anomalies as quantified by the ONI. The x-axis shows three-month average (running mean) periods. Solid (colored) lines represent the four El Niño events similar to and the observed 2015 event. Dashed (black) lines represent dissimilar El Niño events.
Hydrology 06 00096 g002
Figure 3. (a) Monthly departure (%) for post-El Niño year streamflow when compared to the long-term average for five gages in coastal MS-AL. (b) Seasonal (JFMA (blue) and JJA (red)) departure (%) for post-El Niño year streamflow when compared to the long-term average for five gages in coastal MS-AL and seasonal (JFMA (black) and JJA (black)) departure (%) for 2016 streamflow when compared to the historic long-term average for five gages in coastal MS-AL. The lower boundary of the solid box represents the 25th percentile while the upper boundary of the solid box represents the 75th percentile. The lower whisker represents the 10th percentile while the upper whisker represents the 90th percentile. Outliers are displayed as dots.
Hydrology 06 00096 g003
Figure 4. Observed (long-term average) and predicted (using historic El Niño events) exceedance probability curves for (a) winter-spring (JFMA) and (b) summer (JJA) seasonal streamflows for the Conecuh River. The observed 2016 streamflow for each season and corresponding exceedance probability is provided.
Hydrology 06 00096 g004aHydrology 06 00096 g004b
Table 1. The five unimpaired streamflow gages used in this study.
River/LocationUSGS Gage NumberLatitudeLongitude
Choctawhatchee River near Newton, AL2,361,00031.34°N85.61°W
Conecuh River at Brantley AL2,371,50031.57°N86.25°W
Murder Creek near Evergreen AL2,374,50031.42°N86.99°W
Leaf River near Collins, MS2,472,00031.71°N89.41°W
Bouie Creek near Hattiesburg, MS2,472,50031.43°N89.41°W