Application of Satellite Rainfall Products for Flood Inundation Modelling in Kelantan River Basin, Malaysia

 ,
,
Abstract
1. Introduction
2. Materials and Methods
2.1. Description of the Study Area
2.2. Data Sources
2.2.1. Rain Rauge and Streamflow Data
2.2.2. River Geometry
2.2.3. Digital Elevation Model (DEM)
2.2.4. Land Cover and Soil Map
2.2.5. Satellite Rainfall Products
3. Methodology
3.1. RRI Model
3.2. Evaluation Methods
4. Results and Discussion
5. Conclusions
Author Contributions
Funding
Acknowledgments
Conflicts of Interest
References
- Shaluf, I.M.; Ahmadun, F.l.-R. Disaster types in Malaysia: An overview. Disaster Prev. Manag. 2006, 15, 286–298. [Google Scholar] [CrossRef]
- Yahaya, N.S.; Lim, C.-S.; Jamaluddin, U.A.; Pereira, J.J. The December 2014 Flood in Kelantan: A Post-Event Perspective. War. Geol. 2015, 41, 54–57. [Google Scholar]
- Alias, N.E.; Mohamad, H.; Chin, W.Y.; Yusop, Z. Rainfall analysis of the Kelantan big yellow flood 2014. J. Teknol. 2016, 78, 83–90. [Google Scholar] [CrossRef]
- Osman, S.; Abustan, I. Estimating the Clark Instantaneous Unit Hydrograph Parameters for Selected Gauged Catchments in The West Coast of Peninsular Malaysia. ASEAN Eng. J. Part C. 2011, 13, 126–141. [Google Scholar]
- Patrick, M.; Mah, Y.S.; Putuhena, F.J.; Wang, Y.C.; Selaman, O.S. TRMM Satellite Algorithm Estimates to Represent the Spatial Distribution of Rainstorms. MATEC Web Conf. 2017, 87. [Google Scholar] [CrossRef]
- Stisen, S.; Sandholt, I. Evaluation of remote-sensing-based rainfall products through predictive capability in hydrological runoff modelling. Hydrol. Process. 2010, 24, 879–891. [Google Scholar] [CrossRef]
- Bui, H.T.; Ishidaira, H.; Shaowei, N. Evaluation of the use of global satellite–gauge and satellite-only precipitation products in stream flow simulations. Appl. Water Sci. 2019, 9, 53. [Google Scholar] [CrossRef]
- Ma, J.; Sun, W.; Yang, G.; Zhang, D. Hydrological Analysis Using Satellite Remote Sensing Big Data and CREST Model. IEEE Access 2018, 6, 9006–9016. [Google Scholar] [CrossRef]
- Yuan, F.; Zhang, L.; Soe, K.M.W.; Ren, L.; Zhao, C.; Zhu, Y.; Jiang, S.; Liu, Y. Applications of TRMM- and GPM-Era Multiple-Satellite Precipitation Products for Flood Simulations at Sub-Daily Scales in a Sparsely Gauged Watershed in Myanmar. Remote Sens. 2019, 11, 140. [Google Scholar] [CrossRef]
- Huffman, G.J.; Bolvin, D.T.; Nelkin, E.J.; Wolff, D.B.; Adler, R.F.; Gu, G.; Hong, Y.; Bowman, K.P.; Stocker, E.F. The TRMM Multisatellite Precipitation Analysis (TMPA): Quasi-Global, Multiyear, Combined-Sensor Precipitation Estimates at Fine Scales. J. Hydrometeorol. 2007, 8, 38–55. [Google Scholar] [CrossRef]
- Skofronick-Jackson, G.; Petersen, W.A.; Berg, W.; Kidd, C.; Stocker, E.F.; Kirschbaum, D.B.; Kakar, R.; Braun, S.A.; Huffman, G.J.; Iguchi, T.; et al. The Global Precipitation Measurement (GPM) Mission for Science and Society. Bull. Am. Meteorol. Soc. 2017, 98, 1679–1695. [Google Scholar] [CrossRef] [PubMed]
- Hsu, K.L.; Gupta, H.V.; Gao, X.; Sorooshian, S. Estimation of physical variables from multichannel remotely sensed imagery using a neural network: Application to rainfall estimation. Water Resour. Res. 1999, 35, 1605–1618. [Google Scholar] [CrossRef]
- Okamoto, K.i.; Ushio, T.; Iguchi, T.; Takahashi, N.; Iwanami, K. The global satellite mapping of precipitation (GSMaP) project. In Proceedings of the 2005 IEEE International Geoscience and Remote Sensing Symposium, Seoul, Koera, 29 July 2005; pp. 3414–3416. [Google Scholar]
- Bajracharya, S.R.; Shrestha, M.S.; Shrestha, A.B. Assessment of high-resolution satellite rainfall estimation products in a streamflow model for flood prediction in the Bagmati basin, Nepal. J. Flood Risk Manag. 2014, 10, 5–16. [Google Scholar] [CrossRef]
- Casse, C.; Gosset, M.; Peugeot, C.; Pedinotti, V.; Boone, A.; Tanimoun, B.A.; Decharme, B. Potential of satellite rainfall products to predict Niger River flood events in Niamey. Atmos. Res. 2015, 163, 162–176. [Google Scholar] [CrossRef]
- Harris, A.; Rahman, S.; Hossain, F.; Yarborough, L.; Bagtzoglou, A.C.; Easson, G. Satellite-based Flood Modeling Using TRMM-based Rainfall Products. Sensors 2007, 7, 3416–3427. [Google Scholar] [CrossRef]
- Nikolopoulos, E.I.; Anagnostou, E.N.; Borga, M. Using High-Resolution Satellite Rainfall Products to Simulate a Major Flash Flood Event in Northern Italy. J. Hydrometeorol. 2013, 14, 171–185. [Google Scholar] [CrossRef]
- Valeriano, O.C.S.; Koike, T.; Yang, D.; Nyunt, C.T.; Van Khanh, D.; Chau, N.L. Flood simulation using different sources of rainfall in the Huong River, Vietnam. Hydrol. Sci. J. 2009, 54, 909–917. [Google Scholar] [CrossRef]
- Tan, M.; Ibrahim, A.; Duan, Z.; Cracknell, A.; Chaplot, V. Evaluation of Six High-Resolution Satellite and Ground-Based Precipitation Products over Malaysia. Remote Sens. 2015, 7, 1504. [Google Scholar] [CrossRef]
- Tan, M.L.; Santo, H. Comparison of GPM IMERG, TMPA 3B42 and PERSIANN-CDR satellite precipitation products over Malaysia. Atmos. Res. 2018, 202, 63–76. [Google Scholar] [CrossRef]
- Varikoden, H.; Samah, A.A.; Babu, C.A. Spatial and temporal characteristics of rain intensity in the peninsular Malaysia using TRMM rain rate. J. Hydrol. 2010, 387, 312–319. [Google Scholar] [CrossRef]
- Semire, F.A.; Mohd-Mokhtar, R.; Ismail, W.; Mohamad, N.; Mandeep, J.S. Ground validation of space-borne satellite rainfall products in Malaysia. Adv. Space Res. 2012, 50, 1241–1249. [Google Scholar] [CrossRef]
- Soo, E.Z.X.; Jaafar, W.Z.W.; Lai, S.H.; Islam, T.; Srivastava, P. Evaluation of satellite precipitation products for extreme flood events: Case study in Peninsular Malaysia. J. Water Clim. Chang. 2018. [Google Scholar] [CrossRef]
- Sun, W.; Ma, J.; Yang, G.; Li, W. Statistical and Hydrological Evaluations of Multi-Satellite Precipitation Products over Fujiang River Basin in Humid Southeast China. Remote Sens. 2018, 10, 1898. [Google Scholar] [CrossRef]
- Bajracharya, S.R.; Palash, W.; Shrestha, M.S.; Khadgi, V.R.; Duo, C.; Das, P.J.; Dorji, C. Systematic Evaluation of Satellite-Based Rainfall Products over the Brahmaputra Basin for Hydrological Applications. Adv. Meteorol. 2015, 2015, 17. [Google Scholar] [CrossRef]
- Alho, P.; Aaltonen, J. Comparing a 1D hydraulic model with a 2D hydraulic model for the simulation of extreme glacial outburst floods. Hydrol. Process. 2008, 22, 1537–1547. [Google Scholar] [CrossRef]
- Bonnifait, L.; Delrieu, G.; Lay, M.L.; Boudevillain, B.; Masson, A.; Belleudy, P.; Gaume, E.; Saulnier, G.-M. Distributed hydrologic and hydraulic modelling with radar rainfall input: Reconstruction of the 8–9 September 2002 catastrophic flood event in the Gard region, France. Adv. Water Resour. 2009, 32, 1077–1089. [Google Scholar] [CrossRef]
- Nguyen, P.; Thorstensen, A.; Sorooshian, S.; Hsu, K.; AghaKouchak, A.; Sanders, B.; Koren, V.; Cui, Z.; Smith, M. A high resolution coupled hydrologic–hydraulic model (HiResFlood-UCI) for flash flood modeling. J. Hydrol. 2016, 541, 401–420. [Google Scholar] [CrossRef]
- Zin, W.W.; Kawasaki, A.; Takeuchi, W.; San, Z.M.L.T.; Htun, K.Z.; Aye, T.H.; Win, S. Flood Hazard Assessment of Bago River Basin, Myanmar. J. Disaster Res. 2018, 13, 14–21. [Google Scholar] [CrossRef]
- Teng, J.; Jakeman, A.J.; Vaze, J.; Croke, B.F.W.; Dutta, D.; Kim, S. Flood inundation modelling: A review of methods, recent advances and uncertainty analysis. Environ. Model. Softw. 2017, 90, 201–216. [Google Scholar] [CrossRef]
- Sayama, T.; Ozawa, G.; Kawakami, T.; Nabesaka, S.; Fukami, K. Rainfall–runoff–inundation analysis of the 2010 Pakistan flood in the Kabul River basin. Hydrol. Sci. J. 2012, 57, 298–312. [Google Scholar] [CrossRef]
- Yoshimoto, S.; Amarnath, G. Applications of Satellite-Based Rainfall Estimates in Flood Inundation Modeling—A Case Study in Mundeni Aru River Basin, Sri Lanka. Remote Sens. 2017, 9, 998. [Google Scholar] [CrossRef]
- Nastiti, K.D.; An, H.; Kim, Y.; Jung, K. Large-scale rainfall–runoff–inundation modeling for upper Citarum River watershed, Indonesia. Environ. Earth Sci. 2018, 77, 640. [Google Scholar] [CrossRef]
- Sayama, T.; Tatebe, Y.; Iwami, Y.; Tanaka, S. Hydrologic sensitivity of flood runoff and inundation: 2011 Thailand floods in the Chao Phraya River basin. Nat. Hazards Earth Syst. Sci. 2015, 15, 1617–1630. [Google Scholar] [CrossRef]
- Try, S.; Lee, G.; Yu, W.; Oeurng, C.; Jang, C. Large-Scale Flood-Inundation Modeling in the Mekong River Basin. J. Hydrol. Eng. 2018, 23. [Google Scholar] [CrossRef]
- Ushiyama, T.; Sayama, T.; Tatebe, Y.; Fujioka, S.; Fukami, K. Numerical Simulation of 2010 Pakistan Flood in the Kabul River Basin by Using Lagged Ensemble Rainfall Forecasting. J. Hydrometeorol. 2014, 15, 193–211. [Google Scholar] [CrossRef]
- Yoshimoto, S.; Amarnath, G. Application of a flood inundation model to analyze the potential impacts of a flood control plan in Mundeni Aru river basin, Sri Lanka. Nat. Hazards 2018, 91, 491–513. [Google Scholar] [CrossRef]
- Barasa, B.N.; Perera, E.D.P. Analysis of land use change impacts on flash flood occurrences in the Sosiani River basin Kenya. Int. J. River Basin Manag. 2018, 16, 179–188. [Google Scholar] [CrossRef]
- Iwami, Y.; Hasegawa, A.; Miyamoto, M.; Kudo, S.; Yamazaki, Y.; Ushiyama, T.; Koike, T. Comparative study on climate change impact on precipitation and floods in Asian river basins. Hydrol. Res. Lett. 2017, 11, 24–30. [Google Scholar] [CrossRef]
- Greifeneder, F.; Wagner, W.; Sabel, D.; Naeimi, V. Suitability of SAR imagery for automatic flood mapping in the Lower Mekong Basin. Int. J. Remote Sens. 2014, 35, 2857–2874. [Google Scholar] [CrossRef]
- Li, L.; Chen, Y.; Yu, X.; Liu, R.; Huang, C. Sub-pixel flood inundation mapping from multispectral remotely sensed images based on discrete particle swarm optimization. ISPRS J. Photogramm Remote Sens. 2015, 101, 10–21. [Google Scholar] [CrossRef]
- Schumann, G.J.P.; Moller, D.K. Microwave remote sensing of flood inundation. Phys. Chem. Earthparts A/B/C 2015, 83–84, 84–95. [Google Scholar] [CrossRef]
- Twele, A.; Cao, W.; Plank, S.; Martinis, S. Sentinel-1-based flood mapping: A fully automated processing chain. Int. J. Remote Sens. 2016, 37, 2990–3004. [Google Scholar] [CrossRef]
- Lin, C.-H.; Tsai, P.-H.; Lai, K.-H.; Chen, J.-Y. Cloud removal from multitemporal satellite images using information cloning. IEEE Trans Geosci. Remote Sens. 2012, 51, 232–241. [Google Scholar] [CrossRef]
- Laborde, H.; Douzal, V.; Ruiz Piña, H.A.; Morand, S.; Cornu, J.-F. Landsat-8 cloud-free observations in wet tropical areas: A case study in South East Asia. Remote Sens. Lett. 2017, 8, 537–546. [Google Scholar] [CrossRef]
- Markert, K.N.; Chishtie, F.; Anderson, E.R.; Saah, D.; Griffin, R.E. On the merging of optical and SAR satellite imagery for surface water mapping applications. Results Phys. 2018, 9, 275–277. [Google Scholar] [CrossRef]
- Uddin, K.; Matin, M.A.; Meyer, F.J. Operational Flood Mapping Using Multi-Temporal Sentinel-1 SAR Images: A Case Study from Bangladesh. Remote Sens. 2019, 11, 1581. [Google Scholar] [CrossRef]
- Shen, X.; Wang, D.; Mao, K.; Anagnostou, E.; Hong, Y. Inundation Extent Mapping by Synthetic Aperture Radar: A Review. Remote Sens. 2019, 11, 879. [Google Scholar] [CrossRef]
- Schumann, G.J.-P.; Brakenridge, G.R.; Kettner, A.J.; Kashif, R.; Niebuhr, E. Assisting Flood Disaster Response with Earth Observation Data and Products: A Critical Assessment. Remote Sens. 2018, 10, 1230. [Google Scholar] [CrossRef]
- Denis, G.; de Boissezon, H.; Hosford, S.; Pasco, X.; Montfort, B.; Ranera, F. The evolution of Earth Observation satellites in Europe and its impact on the performance of emergency response services. ACTA Astronaut. 2016, 127, 619–633. [Google Scholar] [CrossRef]
- Voigt, S.; Giulio-Tonolo, F.; Lyons, J.; Kučera, J.; Jones, B.; Schneiderhan, T.; Platzeck, G.; Kaku, K.; Hazarika, M.K.; Czaran, L.; et al. Global trends in satellite-based emergency mapping. Science 2016, 353, 247–252. [Google Scholar] [CrossRef]
- World Meteorological Organization. Manual on Stream Gauging, Volume 1–Fieldwork; World Meteorological Organization: Geneva, Switzerland, 2010. [Google Scholar]
- BrÁZdil, R.; Kundzewicz, Z.W.; Benito, G. Historical hydrology for studying flood risk in Europe. Hydrol. Sci. J. 2006, 51, 739–764. [Google Scholar] [CrossRef]
- Wong, C.L.; Liew, J.; Yusop, Z.; Ismail, T.; Venneker, R.; Uhlenbrook, S. Rainfall Characteristics and Regionalization in Peninsular Malaysia Based on a High Resolution Gridded Data Set. Water 2016, 8, 500. [Google Scholar] [CrossRef]
- Chan, N.W.; Parker, D.J. Response to dynamic flood hazard factors in peninsular Malaysia. Geogr. J. 1996, 162, 313–325. [Google Scholar] [CrossRef]
- Sayama, T. Rainfall-Runoff-Inundation Model User’s Manual; Disaster Prevention Research Institute (DPRI), Kyoto University: Kyoto, Japan, 2017. [Google Scholar]
- Lehner, B.; Verdin, K.; Jarvis, A. New Global Hydrography Derived From Spaceborne Elevation Data. Eos. Trans. Agu. 2008, 89, 93–94. [Google Scholar] [CrossRef]
- Tateishi, R.; Hoan, N.T.; Kobayashi, T.; Alsaaideh, B.; Tana, G.; Phong, D.X. Production of global land cover data-GLCNMO2008. J. Geogr. Geol. 2014, 6, 99. [Google Scholar] [CrossRef]
- Tateishi, R.; Uriyangqai, B.; Al-Bilbisi, H.; Ghar, M.A.; Tsend-Ayush, J.; Kobayashi, T.; Kasimu, A.; Hoan, N.T.; Shalaby, A.; Alsaaideh, B. Production of global land cover data–GLCNMO. Int. J. Digit. Earth 2011, 4, 22–49. [Google Scholar] [CrossRef]
- Fischer, G.; Nachtergaele, F.; Prieler, S.; Van Velthuizen, H.; Verelst, L.; Wiberg, D. Global Agro-Ecological Zones Assessment for Agriculture (GAEZ 2008); IIASA, Laxenburg, Austria and FAO: Rome, Italy, 2008. [Google Scholar]
- Huffman, G.J.; Bolvin, D.T.; Braithwaite, D.; Hsu, K.; Joyce, R.; Xie, P.; Yoo, S.-H. NASA global precipitation measurement (GPM) integrated multi-satellite retrievals for GPM (IMERG). 2015; p. 30. Available online: https://pmm.nasa.gov/sites/default/files/document_files/IMERG_ATBD_V4.5.pdf (accessed on 6 November 2019).
- Hong, Y.; Hsu, K.-L.; Sorooshian, S.; Gao, X. Precipitation Estimation from Remotely Sensed Imagery Using an Artificial Neural Network Cloud Classification System. J. Appl. Meteorol. 2004, 43, 1834–1853. [Google Scholar] [CrossRef]
- Aonashi, K.; Awaka, J.; Hirose, M.; Kozu, T.; Kubota, T.; Liu, G.; Shige, S.; Kida, S.; Seto, S.; Takahashi, N.; et al. GSMaP Passive Microwave Precipitation Retrieval Algorithm: Algorithm Description and Validation. J. Meteorol. Soc. Jpn. Ser. Ii 2009, 87A, 119–136. [Google Scholar] [CrossRef]
- Kubota, T.; Shige, S.; Hashizume, H.; Aonashi, K.; Takahashi, N.; Seto, S.; Hirose, M.; Takayabu, Y.N.; Ushio, T.; Nakagawa, K.; et al. Global Precipitation Map Using Satellite-Borne Microwave Radiometers by the GSMaP Project: Production and Validation. IEEE Trans. Geosci. Remote Sens. 2007, 45, 2259–2275. [Google Scholar] [CrossRef]
- Ushio, T.; Sasashige, K.; Kubota, T.; Shige, S.; Okamoto, K.i.; Aonashi, K.; Inoue, T.; Takahashi, N.; Iguchi, T.; Kachi, M.; et al. A Kalman Filter Approach to the Global Satellite Mapping of Precipitation (GSMaP) from Combined Passive Microwave and Infrared Radiometric Data. J. Meteorol. Soc. Jpn. Ser. Ii. 2009, 87A, 137–151. [Google Scholar] [CrossRef]
- Nash, J.; Sutcliffe, J. River forcasting using conceptual models, 1. A discussion of principles. J. Hydrol. 1970, 10, 280–290. [Google Scholar] [CrossRef]
- Moriasi, D.N.; Arnold, J.G.; Van Liew, M.W.; Bingner, R.L.; Harmel, R.D.; Veith, T.L. Model Evaluation Guidelines for Systematic Quantification of Accuracy in Watershed Simulations. Trans. Asabe 2007, 50, 885–900. [Google Scholar] [CrossRef]
- Awange, J.L.; Ferreira, V.G.; Forootan, E.; Andam-Akorful, S.A.; Agutu, N.O.; He, X.F. Uncertainties in remotely sensed precipitation data over Africa. Int. J. Climatol. 2016, 36, 303–323. [Google Scholar] [CrossRef]
- Krakauer, N.; Pradhanang, S.; Lakhankar, T.; Jha, A. Evaluating satellite products for precipitation estimation in mountain regions: A case study for Nepal. Remote Sens. 2013, 5, 4107–4123. [Google Scholar] [CrossRef]
- Satgé, F.; Xavier, A.; Pillco Zolá, R.; Hussain, Y.; Timouk, F.; Garnier, J.; Bonnet, M.-P. Comparative Assessments of the Latest GPM Mission’s Spatially Enhanced Satellite Rainfall Products over the Main Bolivian Watersheds. Remote Sens. 2017, 9, 369. [Google Scholar] [CrossRef]
- Pakoksung, K.; Takagi, M. Effect of satellite based rainfall products on river basin responses of runoff simulation on flood event. Model Earth Syst. Environ. 2016, 2, 143. [Google Scholar] [CrossRef]
- Mohd Zad, S.; Zulkafli, Z.; Muharram, F. Satellite Rainfall (TRMM 3B42-V7) Performance Assessment and Adjustment over Pahang River Basin, Malaysia. Remote Sens. 2018, 10, 388. [Google Scholar] [CrossRef]
- Tan, M.; Samat, N.; Chan, N.; Roy, R. Hydro-Meteorological Assessment of Three GPM Satellite Precipitation Products in the Kelantan River Basin, Malaysia. Remote Sens. 2018, 10, 1011. [Google Scholar] [CrossRef]
- Radhi, A.M.; Rohasliney, H.; Zarul, H. Fish composition and diversity in Perak, Galas and Kelantan rivers (Malaysia) after the major flood of 2014. Transylv. Rev. Syst. Ecol. Res. 2017, 19, 41–56. [Google Scholar] [CrossRef][Green Version]
- Dai, Q.; Bray, M.; Zhuo, L.; Islam, T.; Han, D. A Scheme for Rain Gauge Network Design Based on Remotely Sensed Rainfall Measurements. J. Hydrometeorol. 2017, 18, 363–379. [Google Scholar] [CrossRef]
- Gosset, M.; Viarre, J.; Quantin, G.; Alcoba, M. Evaluation of several rainfall products used for hydrological applications over West Africa using two high-resolution gauge networks. QJRMS 2013, 139, 923–940. [Google Scholar] [CrossRef]
- Bitew, M.M.; Gebremichael, M. Evaluation of satellite rainfall products through hydrologic simulation in a fully distributed hydrologic model. Water Resour. Res. 2011, 47. [Google Scholar] [CrossRef]
- Yi, L.; Zhang, W.; Li, X. Assessing Hydrological Modelling Driven by Different Precipitation Datasets via the SMAP Soil Moisture Product and Gauged Streamflow Data. Remote Sens. 2018, 10, 1872. [Google Scholar] [CrossRef]
- Yuan, F.; Zhang, L.; Win, K.W.W.; Ren, L.; Zhao, C.; Zhu, Y.; Jiang, S.; Liu, Y. Assessment of GPM and TRMM Multi-Satellite Precipitation Products in Streamflow Simulations in a Data-Sparse Mountainous Watershed in Myanmar. Remote Sens. 2017, 9, 302. [Google Scholar] [CrossRef]
- McCollum, J.R.; Gruber, A.; Ba, M.B. Discrepancy between Gauges and Satellite Estimates of Rainfall in Equatorial Africa. J. Appl. Meteorol. 2000, 39, 666–679. [Google Scholar] [CrossRef]
- Dinku, T.; Ruiz, F.; Connor, S.J.; Ceccato, P. Validation and Intercomparison of Satellite Rainfall Estimates over Colombia. J. Appl. Meteorol. Climatol. 2010, 49, 1004–1014. [Google Scholar] [CrossRef]
- Hong, Y.; Gochis, D.; Cheng, J.-t.; Hsu, K.-l.; Sorooshian, S. Evaluation of PERSIANN-CCS Rainfall Measurement Using the NAME Event Rain Gauge Network. J. Hydrometeorol. 2007, 8, 469–482. [Google Scholar] [CrossRef]
- Saber, M.; Yilmaz, K.K. Evaluation and Bias Correction of Satellite-Based Rainfall Estimates for Modelling Flash Floods over the Mediterranean region: Application to Karpuz River Basin, Turkey. Water 2018, 10, 657. [Google Scholar] [CrossRef]
- Hirpa, F.A.; Gebremichael, M.; Hopson, T. Evaluation of High-Resolution Satellite Precipitation Products over Very Complex Terrain in Ethiopia. J. Appl. Meteorol. Climatol. 2010, 49, 1044–1051. [Google Scholar] [CrossRef]
- Bitew, M.M.; Gebremichael, M.; Ghebremichael, L.T.; Bayissa, Y.A. Evaluation of High-Resolution Satellite Rainfall Products through Streamflow Simulation in a Hydrological Modeling of a Small Mountainous Watershed in Ethiopia. J. Hydrometeorol. 2012, 13, 338–350. [Google Scholar] [CrossRef]
- Habib, E.; Haile, A.T.; Sazib, N.; Zhang, Y.; Rientjes, T. Effect of Bias Correction of Satellite-Rainfall Estimates on Runoff Simulations at the Source of the Upper Blue Nile. Remote Sens. 2014, 6, 6688–6708. [Google Scholar] [CrossRef]
- Sun, W.; Sun, Y.; Li, X.; Wang, T.; Wang, Y.; Qiu, Q.; Deng, Z. Evaluation and Correction of GPM IMERG Precipitation Products over the Capital Circle in Northeast China at Multiple Spatiotemporal Scales. Adv. Meteorol. 2018, 2018, 14. [Google Scholar] [CrossRef]
- Tesfagiorgis, K.; Mahani, S.E.; Krakauer, N.Y.; Khanbilvardi, R. Bias correction of satellite rainfall estimates using a radar-gauge product—A case study in Oklahoma (USA). Hydrol. Earth Syst. Sci. 2011, 15, 2631–2647. [Google Scholar] [CrossRef]
- Valdés-Pineda, R.; Demaría, E.M.C.; Valdés, J.B.; Wi, S.; Serrat-Capdevilla, A. Bias correction of daily satellite-based rainfall estimates for hydrologic forecasting in the Upper Zambezi, Africa. Hydrol. Earth Syst. Sci. Discuss. 2016, 2016, 1–28. [Google Scholar] [CrossRef]
- Kimani, M.; Hoedjes, J.; Su, Z. Bayesian Bias Correction of Satellite Rainfall Estimates for Climate Studies. Remote Sens. 2018, 10, 1074. [Google Scholar] [CrossRef]
- Hashemi, H.; Nordin, M.; Lakshmi, V.; Huffman, G.J.; Knight, R. Bias Correction of Long-Term Satellite Monthly Precipitation Product (TRMM 3B43) over the Conterminous United States. J. Hydrometeorol. 2017, 18, 2491–2509. [Google Scholar] [CrossRef]
- Douville, H.; Chauvin, F.; Broqua, H. Influence of Soil Moisture on the Asian and African Monsoons. Part I: Mean Monsoon and Daily Precipitation. JCli 2001, 14, 2381–2403. [Google Scholar] [CrossRef]
- Brocca, L.; Pellarin, T.; Crow, W.T.; Ciabatta, L.; Massari, C.; Ryu, D.; Su, C.-H.; Rüdiger, C.; Kerr, Y. Rainfall estimation by inverting SMOS soil moisture estimates: A comparison of different methods over Australia. J. Geophys. Res. Atmos. 2016, 121, 12062–12079. [Google Scholar] [CrossRef]
- Zeng, J.; Li, Z.; Chen, Q.; Bi, H.; Qiu, J.; Zou, P. Evaluation of remotely sensed and reanalysis soil moisture products over the Tibetan Plateau using in-situ observations. RSEnv 2015, 163, 91–110. [Google Scholar] [CrossRef]
- Su, C.-H.; Zhang, J.; Gruber, A.; Parinussa, R.; Ryu, D.; Crow, W.T.; Wagner, W. Error decomposition of nine passive and active microwave satellite soil moisture data sets over Australia. Remote Sens. Environ. 2016, 182, 128–140. [Google Scholar] [CrossRef]
- Zhan, W.; Pan, M.; Wanders, N.; Wood, E.F. Correction of real-time satellite precipitation with satellite soil moisture observations. Hydrol. Earth Syst. Sci. 2015, 19, 4275–4291. [Google Scholar] [CrossRef]
- Crow, W.T.; van den Berg, M.J.; Huffman, G.J.; Pellarin, T. Correcting rainfall using satellite-based surface soil moisture retrievals: The Soil Moisture Analysis Rainfall Tool (SMART). Water Resour. Res. 2011, 47. [Google Scholar] [CrossRef]
- Zhang, Z.; Wang, D.; Wang, G.; Qiu, J.; Liao, W. Use of SMAP Soil Moisture and Fitting Methods in Improving GPM Estimation in Near Real Time. Remote Sens. 2019, 11, 368. [Google Scholar] [CrossRef]
- Sharma, S.K.; Kwak, Y.-J.; Kumar, R.; Sarma, B. Analysis of Hydrological Sensitivity for Flood Risk Assessment. ISPRS Int. J. Geo-Inf. 2018, 7, 51. [Google Scholar] [CrossRef]


| Dataset | Dates | Version | Spatial/Temporal | Latency |
|---|---|---|---|---|
| GPM (IMERG-E, -L) | March 2014–present | V05B | 0.1° (≈11 km)/30 min | 4 h/12 h |
| GSMaP-NRT | October 2008–present | V6 | 0.1° (≈11 km)/1 h | 4 h |
| PERSIANN-CCS | March 2003–present | - | 0.04° (≈4 km)/1 h | 2 days |
| SRPs | RMSE (m3/s) | RB (%) | NSE | r | |
|---|---|---|---|---|---|
| IMERG-E | 4293.1 | −23.7 | 0.46 | 0.68 | Significant (p = 1.4 × 10⁻⁴) |
| IMERG-L | 4462.4 | −31.2 | 0.42 | 0.75 | Significant (p = 1.6 × 10⁻⁵) |
| GSMaP-NRT | 2674.7 | 4.9 | 0.79 | 0.83 | Not Significant (p = 0.082) |
| PERSIANN-CCS | 4181.7 | −23.3 | 0.49 | 0.77 | Significant (p = 6.8 × 10⁻⁷) |
| Gauges | 3177.8 | −12.2 | 0.71 | 0.85 |
| Towns | Kota Bharu | Pasir Mas | Tanah Merah | Tumpat | Wakaf Bunut | Kadok | Peringat |
|---|---|---|---|---|---|---|---|
| Gauge | 0.4 | 2.4 | 4.6 | 0.3 | 1.9 | 1.8 | 0.4 |
| IMERG-E | 0.4 | 2 | 3.2 | 0.4 | 1.3 | 1.3 | 0.3 |
| IMERG-L | 0.4 | 1.8 | 2.9 | 0.4 | 1.1 | 1.2 | 0.3 |
| GSMaP | 0.8 | 3 | 5.9 | 0.6 | 2.4 | 2.5 | 1 |
| PERSIANN-CCS | 0.3 | 1.9 | 3 | 0.3 | 1.2 | 1.2 | 0.3 |
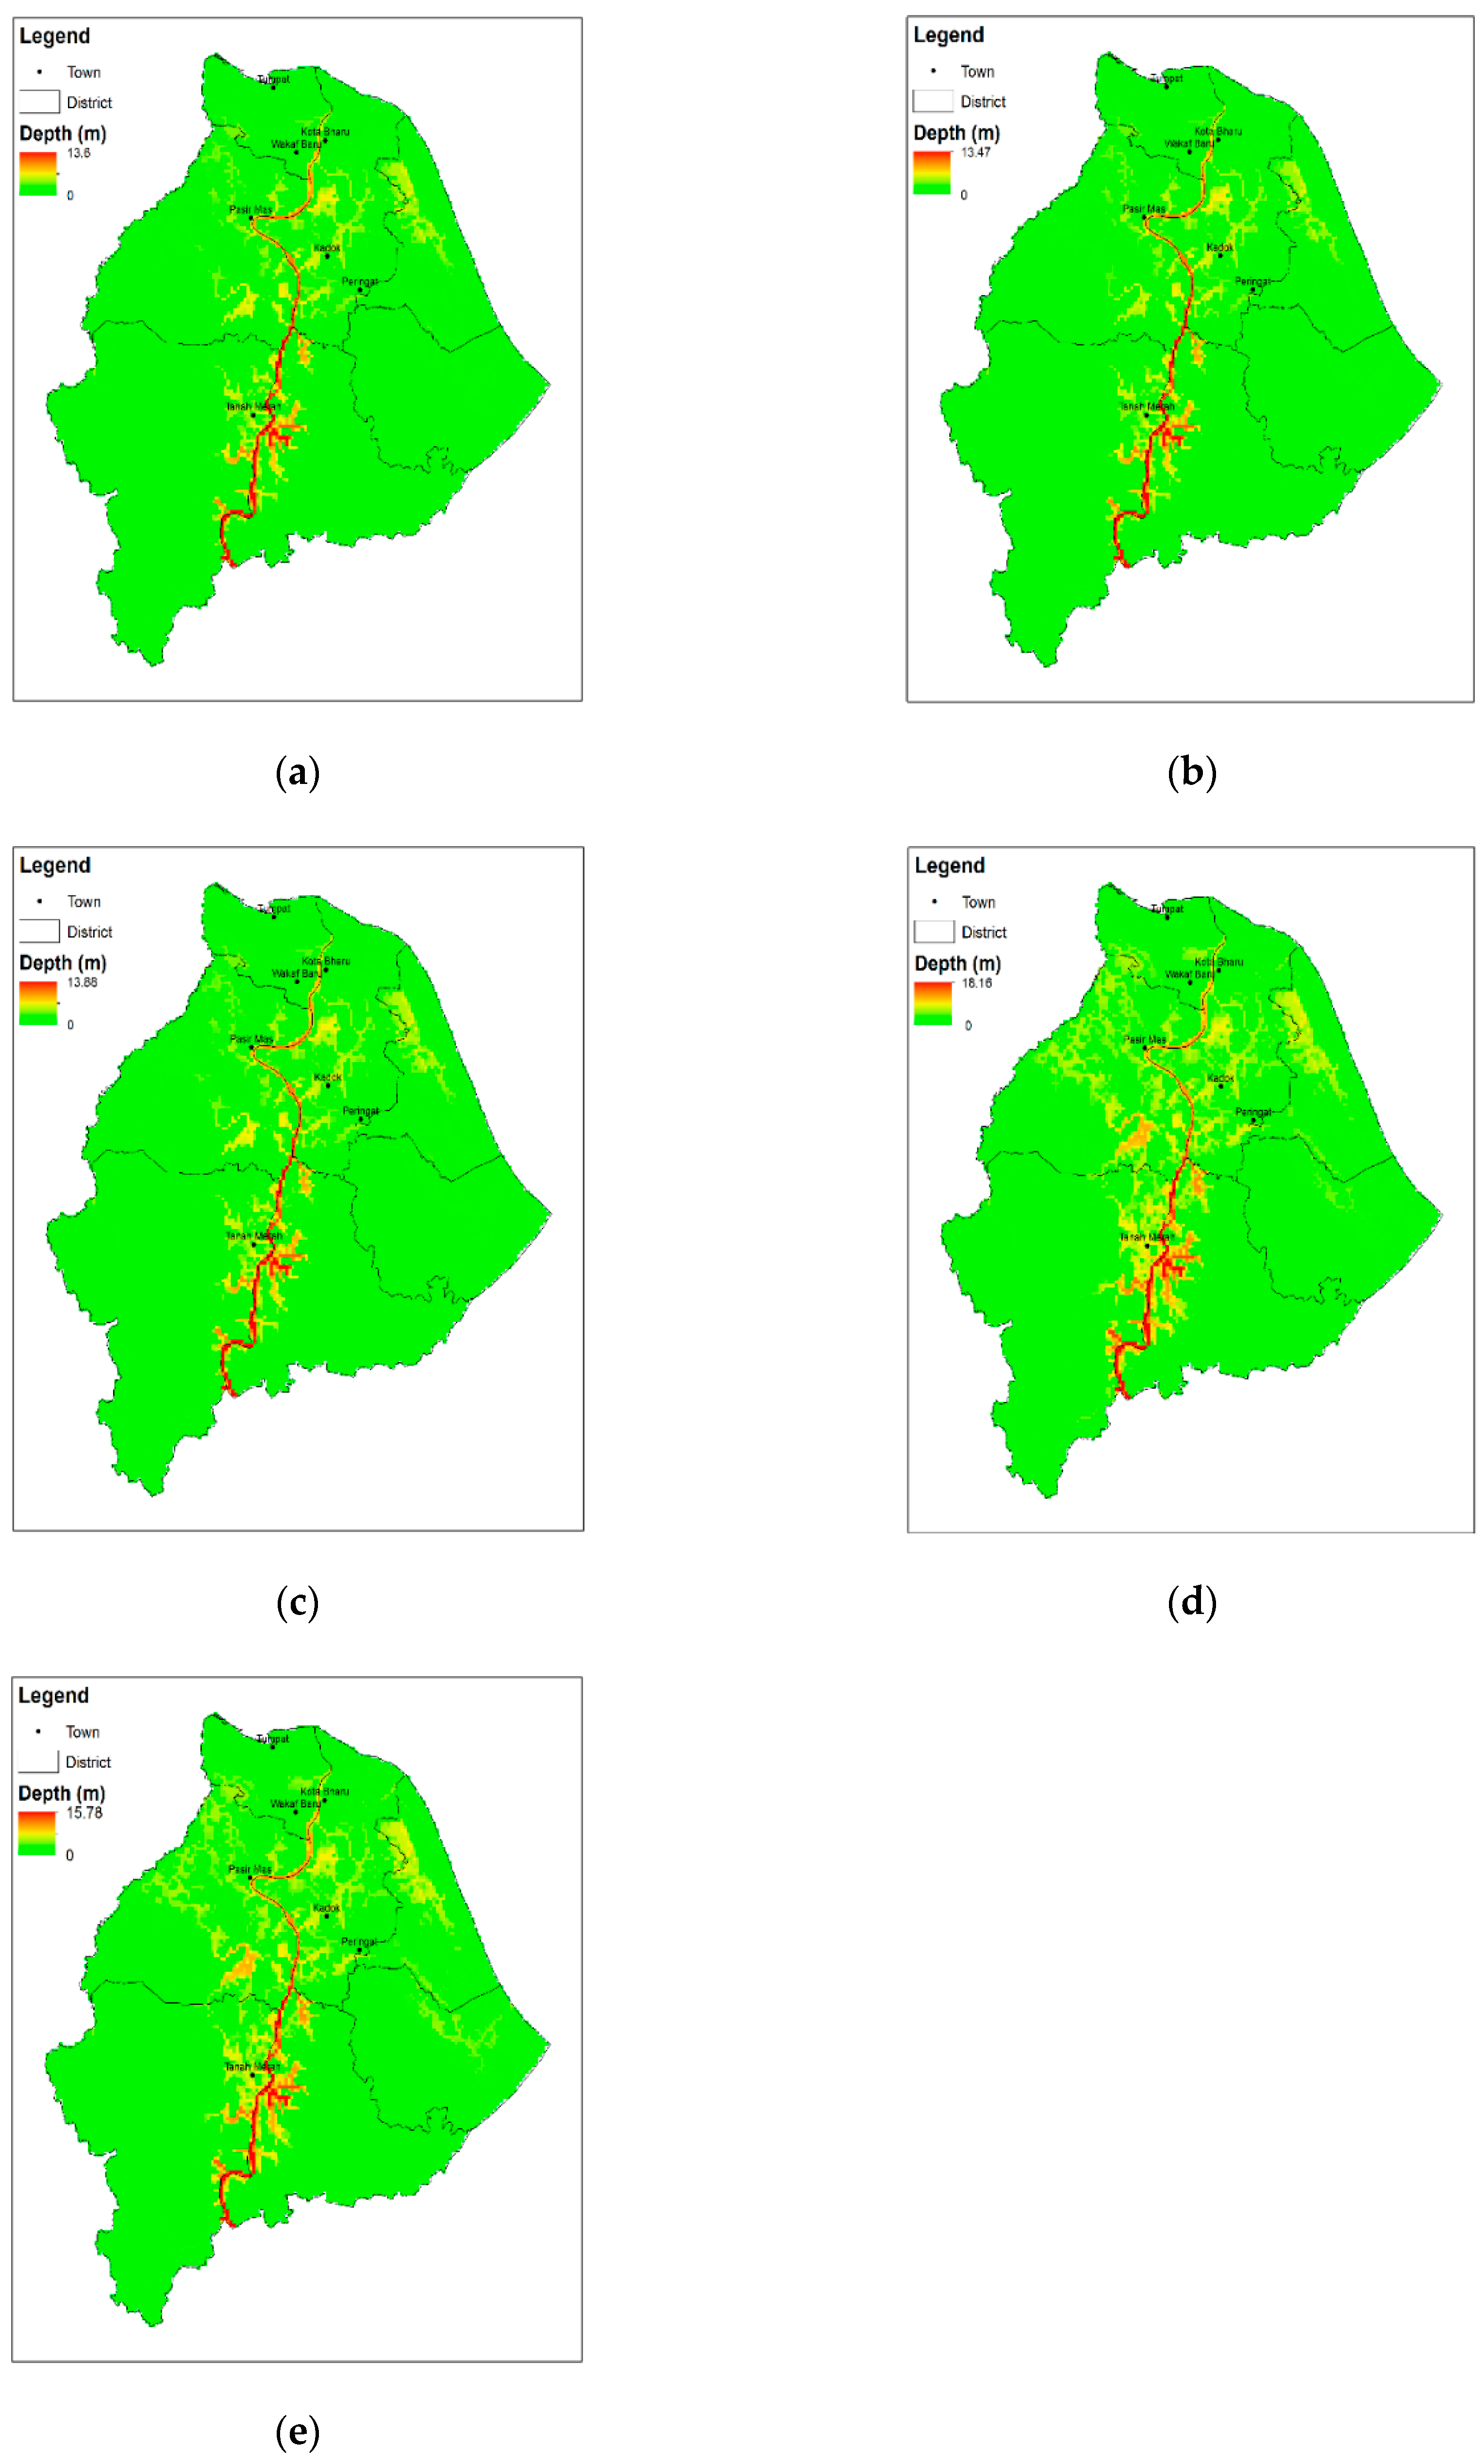
| Source | [2] | PERSIANN-CCS | IMERG-L | IMERG-E | GSMaP | Gauge |
|---|---|---|---|---|---|---|
| Maximum depth (m) (Difference) | 15 | 8.8 (6.2) | 8.6 (6.4) | 9.1 (5.9) | 13.6 (1.4) | 11.2 (3.8) |
© 2019 by the authors. Licensee MDPI, Basel, Switzerland. This article is an open access article distributed under the terms and conditions of the Creative Commons Attribution (CC BY) license (http://creativecommons.org/licenses/by/4.0/).
Share and Cite
Tam, T.H.; Abd Rahman, M.Z.; Harun, S.; Hanapi, M.N.; Kaoje, I.U. Application of Satellite Rainfall Products for Flood Inundation Modelling in Kelantan River Basin, Malaysia. Hydrology 2019, 6, 95. https://doi.org/10.3390/hydrology6040095
Tam TH, Abd Rahman MZ, Harun S, Hanapi MN, Kaoje IU. Application of Satellite Rainfall Products for Flood Inundation Modelling in Kelantan River Basin, Malaysia. Hydrology. 2019; 6(4):95. https://doi.org/10.3390/hydrology6040095
Chicago/Turabian StyleTam, Tze Huey, Muhammad Zulkarnain Abd Rahman, Sobri Harun, Muhammad Nassir Hanapi, and Ismaila Usman Kaoje. 2019. "Application of Satellite Rainfall Products for Flood Inundation Modelling in Kelantan River Basin, Malaysia" Hydrology 6, no. 4: 95. https://doi.org/10.3390/hydrology6040095
APA StyleTam, T. H., Abd Rahman, M. Z., Harun, S., Hanapi, M. N., & Kaoje, I. U. (2019). Application of Satellite Rainfall Products for Flood Inundation Modelling in Kelantan River Basin, Malaysia. Hydrology, 6(4), 95. https://doi.org/10.3390/hydrology6040095