Abstract
Temporal variability analysis of rainfall and river discharges is useful in determining the likelihood of the occurrence of extreme events such as drought or flooding for the purposes of developing policies to mitigate their effects. This study investigated the temporal variability of rainfall and discharges into Lake Nakuru, Kenya using meteorological drought indicators and hydrological drought indicators from 1981 to 2018. The standardized precipitation index (SPI) and standardized precipitation evaporation index (SPEI) were used to characterize meteorological drought, while the streamflow drought index (SDI) was used to characterize hydrological drought. A SWAT model was applied for the prediction of streamflow on five tributaries of Lake Nakuru (Njoro, Ngosur, Nderit, Larmudiac, and Makalia Rivers). The model was successfully calibrated on Njoro River at the upstream of river gauging station 2FCO5 from 1984 to 1996, and the parameters were validated from 1997 to 2007. The SUFI-2 algorithm was applied in SWATCup to perform the calibration of the model. The model performance was considered satisfactory in daily time step (NSE = 0.58, R2 = 0.58 during calibration and NSE = 0.52, R2 = 0.68 during validation). The average annual water balance revealed that out of 823 mm received annual precipitation, 154 mm was surface runoff and 178 mm was the annual average water yield. The average annual actual evapotranspiration (ET) was 607 mm. The results for the temporal variation of the SPI and SDI for the five subcatchments indicated that the drought events identified by the 12-month SPI/SPEI were almost all identified by the 12-month SDI. At the catchment scale, SPI showed an equal distribution of wet and dry periods, with 50.00% of positive anomalies and 50.00% of negative anomalies being observed from 1981 to 2018, while SDI observes a high frequency of dry periods (52.63%) and a lower frequency of wet periods (47.37%). There is a higher frequency of wet periods compared to dry periods for both indices from 2009 to 2010 at 60.00% and 40.00% for SPI and 90.00% and 10.00% for SDI, respectively. Both indices observed that 1984 and 2000 were severely dry years (SPI/SPEI < −2.00), while 2018 was severely wet (SPI/SPEI > 2.00). The results for the variability in rainfall and streamflow indices revealed that the last 10 years (2009–2018) were wetter than the period from 1981 to 2008.
1. Introduction
Changes in the spatial configuration of runoff can occur as a result of changes in the spatial distribution and temporal variability of atmospheric precipitation, which are linked to climate change. Runoff, therefore, becomes a product of the interaction between climate and changes in land use in a basin [1]. A water balance study of the Volta Basin in West Africa confirmed that runoff was extremely sensitive to precipitation [2]. Rainfall exhibits high spatial and temporal variability globally and is one of the climatic factors affecting temporal patterns of water availability. The variability of rainfall can pose a major risk to water resources and reservoirs due to flooding, which impacts the population and properties in the basin [3].The variability is attributed to climate variability, whose impact on water resources in terms of flooding or drought is felt globally [4]. The likelihood of extreme drought or flooding is determined by a temporal variability analysis of rainfall and river discharges at defined timescales. This becomes necessary for enhancing water resource management, agriculture production, planning and designing hydraulic structures, and mitigating the negative effects of flooding [5,6]. Information on the temporal patterns of rainfall runoff is obtained by carrying out an analysis of historical datasets, which gives timely warnings to allow people to cope with or mitigate the negative effects of floods and droughts caused by climate change.
Hydrological models such as the hydrologic modeling system (HEC-HMS) [7,8], the Australian water balance model (AWBM) [9], the soil moisture accounting and routing (SMAR) model [10], the topography-based hydrological model (TOPMODEL) [11,12] and the soil and water assessment tool (SWAT) [13] are useful for simulating the runoff from ungauged catchment based on the data availability and complexity of the hydrological system. Many studies have demonstrated that SWAT is an effective and promising tool to use for simulating flows and sediments for large-scale watersheds and complex basins with different land uses and various soil types (Access et al. [14], Brouziyne et al. [15], Palani et al. [16], Amatya et al. [17], and Tri et al. [18], among others). The advantages of using SWAT include its applicability to larger watersheds with more than 100 km2, its interface with a geographic information system (GIS), its ability to perform continuous simulations, and its ability to characterize a watershed in high spatial detail [19].
Drought is categorized into four major types: agricultural, hydrological, meteorological, and socioeconomic. Meteorological drought occurs when precipitation is below normal based on its long-term average, while hydrological drought occurs when the surface water level or groundwater is low compared to the long-term average [20]. Various indices are used to assess meteorological drought and hydrological drought, such as the rainfall anomaly index (RAI), deciles index (DI), drought area index (DAI), standardized precipitation index (SPI), standardized precipitation evaporation index (SPEI), surface humidity index, Palmer drought severity index (PDSI), and streamflow drought index (SDI) [21,22,23]. Among the indices, SPI and SPEI are two outstanding meteorological drought indices used as descriptor(s) of rainfall variability, while SDI is a hydrological drought index. SPI and SPEI are described by Gurrapu et al. [24] as multi-scale indices with the advantage of identifying the multitemporal nature of droughts. Okpara and Tarhule rank SPI first among the three drought indices evaluated in the Niger Basin of West Africa, describing it as robust and sensitive to dryness [25]. SPI, developed by Mckee [26], has the advantage of providing early warning of drought; it can be computed at different timescales, helps in assessing drought severity, and is not as complex as the Palmer index [27]. The index also gives better spatial standardization in comparison to other drought indices such as PDSI [28]. The SPI at one- and three-month timescales reflects short-term moisture conditions, while the six- and nine-month timescales reflect medium trends in rainfall. The SPI of the 12-month timescale reflects long-term precipitation patterns and is possibly tied to streamflow, reservoir levels, and groundwater levels [29]. SPI is solely based on precipitation and ignores the role of evaporation; due to this limitation, SPEI was developed to complement the SPI drought index since it incorporates the effect of potential evaporation [30]. SDI makes similar calculations to SPI and is widely used due to its simplicity and efficiency [22].
Lake Nakuru undergoes major fluctuations, sometimes drying up completely [31]. The lake experienced a prolonged drying period and falling water levels from the mid-1980s through 1996, and had associated increases in water salinity. The lake dried up completely in 1995 and 1996, resulting in most birds disappearing and tourism being greatly diminished. Following extreme El Niño-driven flooding in 1997 and 1998, the lake levels rebounded. Flamingoes returned in 2000, but were fewer in number than before [32]. According to [33], the lake has shown increasing water levels since 2011. This resulted in an increase in its flood area from a low area of 31.8 km2 in January 2010 to a high of 54.67 km2 in September 2013, corresponding to a 71.92% increase in area. Landsat images were used to determine the lake’s surface variations from 1984 to 2013 [34]. The lake surface area had a steady increase of between 30.48 km2 in November 2009 to 57.55 km2 in January 2014—an increase of 27.09 km2 or 88.94%. The lake swelled in 2013, submerging old buildings that had been abandoned. The negative effects of flooding translate to economic losses due to reduced tourism following reduced numbers of flamingoes and the loss of constructed buildings. There is limited information on rainfall variability within the Lake Nakuru Basin, and no study has investigated the variability in the streamflow into the lake.
The objectives of the study were: (i) to simulate flow from the gauged subcatchment (Njoro) and ungauged subcatchments (Ngosur, Nderit, Larmudiac, and Makalia); (ii) to calculate the meteorological (SPI and SPEI) and hydrological (SDI) drought indices for the description of rainfall and streamflow variability at the 12-month scale; and (iii) to compare the results of SPI and SDI at the catchment scale and in individual subcatchments.
2. Materials and Methods
2.1. Description of the Study Area
Lake Nakuru is located in Nakuru County, about 140 km northwest of Nairobi in the Rift Valley at 1759 m above sea level. Lake Nakuru Basin is a closed drainage system of 1800 km2 located between 0019′-0024′S and 36004′-36007E and approximately 3 km south of Nakuru town [35]. The lake is bounded to the north by Menengai Crater (8060–2040 m a.s.l), to the northeast by Bahati Highlands, to the west by Mau Escarpment (3000 m a.s.l), to the south by Eburru Crater, and to the east by the grasslands between Lake Nakuru and Lake Elementatita [36].
Located in the modified tropical climate of the Highland climatic zone, the basin experiences considerable variation in climate depending on the altitude. The climate ranges from cold and humid to arid and semi-arid, which are typical characteristics of the Rift Valley floor [37]. The basin receives a mean annual rainfall of 1060 mm, with the first peak occurring in May; the second peak coincides with rain in the month of August. The basin also has a mean annual evaporation of 1292 mm. The catchment area has a variety of land use systems that include small-scale and large-scale intensive agriculture, urban and industrial centers, ranching, forestry, and wildlife conservation [36]. The alkaline lake is fed by five tributaries, Makalia, Nderit, Naishi, Njoro, and Larmudiac, as shown in Figure 1, and is a home to millions of flamingoes.
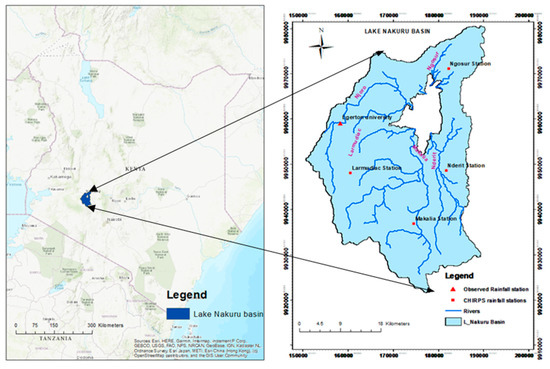
Figure 1.
Location of Lake Nakuru.
2.2. Climate Data and Validation
Historical daily rainfall data for River Njoro subcatchment from 1977 to 2018 was obtained from Egerton University Station (KE0863) at Latitude –0.37 and longitude 35.93 and altitude 2335.42 m a.s.l. Other rainfall stations within the Lake Nakuru catchment such as Bahati Forest Station had data from as early as the 1950s, but only a few had records from 1981 to the present. These data was not used to run the SWAT model; instead, additional gridded daily rainfall data from the Climate Hazards group Infrared Precipitation with Station data (CHIRPS) for the period of 1981 to 2018 was used. A study done by Ayugi et al. [38] evaluates the performance of four satellite-derived precipitation estimates (SPE) over four distinct climatic zones in Kenya from 1998 to 2016. Daily observed data from rain gauge stations are validated using the satellite precipitation estimate datasets. CHIRPS data was recommended for use in the examination of long-term precipitation trends such as at the seasonal and annual scale for monitoring drought events. The data was freely downloaded from (http://dx.doi.org/10.15780/G2RP4Q). The additional stations were distributed to represent the four subcatchments without observed rainfall records for the Makalia, Nderit, Larmudiac, and Ngosur Rivers, as shown in Figure 1. Validation of CHIRPS rainfall data was performed on an annual scale for the KE0863 station by comparing the observed data and extracted point-based CHIRPs data. The performance was assessed using Pearson correlation (r) and percentage bias (PBIAS) to verify the consistency between the observed and gridded data for further use in the analysis and SWAT model run.
The relative humidity, wind speed, solar radiation, and minimum and maximum temperature data were obtained from the National Aeronautics and Space Administration Prediction of Worldwide Energy Resource (NASA POWER) project (https://power.larc.nasa.gov/data-access-viewer/) for the station coordinates shown in Table 1.

Table 1.
Rainfall and temperature data used for SWAT modeling from 1981 to 2018.
2.3. River Discharge Data
Discharge data for Station 2FC05 along River Njoro was obtained from the Water Resources Authority in Kenya. The data was in daily time steps from 1941 to 2007. The periods from 1987 to 1995 and from 2000 to 2004 had several missing days in the observed data records. The Australian water balance model (AWBM) [9] was used to simulate the flow at 2FCO5 and calibrate against the observed data to fill in the gaps and therefore generate a continuous time series of flow data from 1977 to 2007 for SWAT calibration, as shown in Figure 2. The AWBM model allows for calibration using the flow duration curve (FDC) as given in Figure 3a, which gave a high correlation between the observed and simulated daily runoff, as shown in Figure 3b, with the coefficient of determination (R2) being 0.9911. The simulated daily time series data for Njoro River was used to calibrate and validate the SWAT model using SWAT CUP. The simulated flows for the five rivers in the catchment were used to calculate the time series values for the streamflow drought index (SDI).

Figure 2.
Observed and simulated daily runoff for station (2FCO5) from 1977 to 2007 using AWBM.
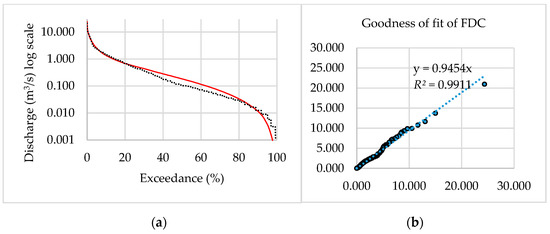
Figure 3.
Flow duration curve (FDC) for the observed and simulated daily runoff at station 2FCO5 from 1977 to 2007 (a); the correlation between observed and simulated daily runoff (b).
2.4. Drought Indicators
The study characterizes meteorological and hydrological drought indices.
2.4.1. Meteorological Drought Indicator
The standardized precipitation index (SPI) utilizes the monthly time series of rainfall data to investigate the frequency of dry and wet years (preferably 30 years) to compute its value. The index is used as a descriptor of rainfall variability and indicates the number of standard deviations by which a rainfall event deviates from the average. The computation was performed separately for each month and for each station by fitting the probability density function (pdf) to the frequency distribution of rainfall from 1981 to 2018. Each pdf was then transformed into the standardized normal distribution. Bayissa et al. [28] describes the calculation procedure for SPI in detail. The standardized precipitation evaporation index (SPEI) differs from SPI by incorporating the effect of potential evaporation, which is calculated based on temperature in addition to rainfall data. The calculation procedure is similar to that of SPI [39]. Rainfall data for the observed station and gridded data were used for the analysis at the 12-month timescale. SPI and SPEI values are classified according to different levels of severity, as given in Table 2 [22,23,26].

Table 2.
Classification of drought Indices.
2.4.2. Hydrological Drought Indicator
The streamflow drought index (SDI) was used to characterize the drought. Drought occurs when the level of surface water and the groundwater table are lower than the long-term average. The indicator include the level of lakes, streams, and groundwater [20]. The SDI was based on daily simulated data from SWAT (1981 to 2018) at a timescale of 12 months. The computation is similar to that of SPI, and gamma distribution was used to fit the river discharge data [39].
2.5. SWAT Model
2.5.1. Description of SWAT Model
The SWAT model was developed by the U.S. Department of Agriculture in order to predict the impact of land management practices on water, sediment, and agricultural chemical yields in large and complex watersheds with varying soils, land use, and management conditions over a long period of time. The model operates on a daily time step, with monthly or annual output frequency [40,41,42]. The model operates by dividing the catchment into sub-basins; each sub-basin is connected to others through a stream channel and further divided into hydrological response units (HRUs) composed of homogenous land cover, soil type, and terrain features [43]. The model estimates the relevant hydrologic components such as evapotranspiration, surface runoff and peak rate of runoff, groundwater flow, and sediment yield for each HRU. The method calculates surface runoff as a function of soil type, use of the soil, slope, initial soil humidity, and type of management practice. The water balance of the soil profile simulated by SWAT is based on the water balance equation (Equation (1)), as found in several studies [13,40,41,42,44].
where SWt is the final soil water content (mm water), SWo is the initial soil water content on day i (mm water), t is the time (days), Rday is the amount of precipitation on day i (mm water), Qsurf is the amount of surface runoff on day i (mm water), Ea is the amount of evapotranspiration on day i (mm water), Wseep is the amount of water entering the vadose zone from the soil profile on day i (mm water), and Qgw is the amount of return flow on day i (mm water).
2.5.2. SWAT Model Input Data
The data required to run SWAT include a digital elevation model (DEM), land use map, soil map, and weather data.
Digital Elevation Model (DEM)
A DEM with a resolution of 90 m was used to define the topography of Lake Nakuru Basin, as shown in Figure 4a. The DEM was freely downloaded from the SRTM (Shuttle Radar Topography Mission) website in March 2019. The same resolution has been applied by several studies such as Ghoraba [41], Gonzaga et al. [40], Adeogun et al. [44], and Access et al. [14], among others, and the desired objectives were achieved. The DEM was used to generate the flow direction, flow accumulation, and stream network grids and delineation of the watershed into sub-basins, as shown in Figure 4b.
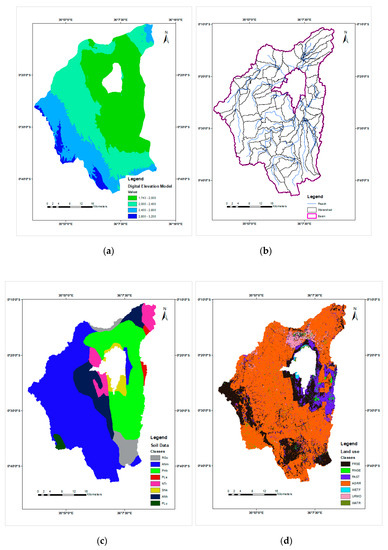
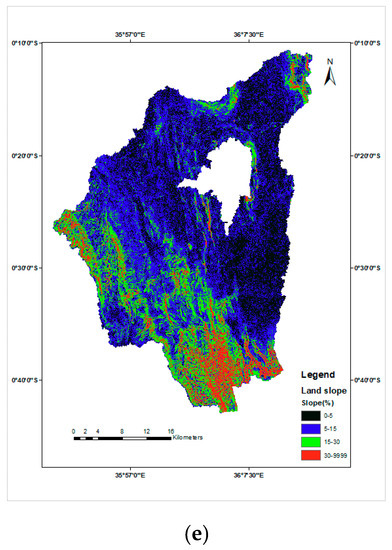
Figure 4.
The digital elevation model (a) sub-basins (b); soil type (c), land use map (d), and slopes (e) for Lake Nakuru catchment.
Soil Data
The soil map and characteristics were obtained from ISRIC’s Soil and Terrain Database for Kenya (KENSOTER) and used to generate Figure 4c. The data described the physical and chemical properties of the soil such as soil texture, water-holding capacity, bulk density, depth of horizon, number of soil layers, organic carbon, electrical conductivity, etc. [45]. Other parameters needed by SWAT, such as hydraulic conductivity, were estimated using the USDA’s Soil Water Characteristics tool.
Land Use/Cover
Land use affects surface erosion, runoff, and evapotranspiration in the watershed [14]. A land use map from the Global Land Cover Characterization (GLCC) database was used to estimate vegetation and other parameters representing the Lake Nakuru Watershed (https://www.esa-landcover-cci.org). Conversion was done from the original land use classes to SWAT classes, as shown in Figure 4d, and was defined using a look-up table like that shown in Table 3.

Table 3.
Actual and SWAT land use land cover class, land use codes, and their percentage land coverage.
Lake Evaporation Data
Lake Nakuru is an enclosed lake where water loss only takes place through high evaporation, rendering the lake a hydrologically-impacted ecosystem [46]. The Penman method was used to estimate evaporation from 1981 to 2018 since it gives reasonably accurate evaporation estimates under any climatic conditions and for a timescale as long as one month [47]. The method does not underestimate evaporation when compared to the Thornthwaite method, as illustrated by [48]. The Penman equation is based on the combination of a surface energy balance equation and an aerodynamic equation, which is an advantage [49]. Datasets used to solve the Penman equation included elevation data, wind speed, humidity, net solar insolation, and temperature [50]. These data were obtained from the National Aeronautics and Space Administration Prediction of Worldwide Energy Resource (NASA POWER) project (https://power.larc.nasa.gov/data-access-viewer/). The calculated daily potential evapotranspiration data (ETo) were read in the SWAT model.
2.5.3. SWAT Model Setup
The SWAT model setup involves five steps: data preparation, delineation of watershed, defining HRUs, running the model, analyzing the parameter sensitivity, and calibration and validation of the model. The configuration of the model started with the projection of all the datasets to the same projection called UTM zone 37S Southern Hemisphere for Lake Nakuru catchment. The DEM was used to delineate the watershed. The process included five major steps: DEM setup, stream definition, outlet and inlet definition, watershed outlets selection, and definition and calculation of sub-basin parameters. In HRUs, there are four classes of slopes, as shown in Figure 4e, with large ranges: 0–5% (45.99% of the study area), 5–15% (35.29% of the study area), 15–30% (14.58% of the study area) and >30%, which is 4.14% of the defined study area. The catchment area was 1391 km2, with 88 subcatchments, and was delineated into 629 hydrological response units (HRUs). Runoff was predicted separately for each HRU and combined to obtain the total runoff for the watershed. This provides a much better physical description of the water balance and increases the accuracy of the load predictions according to Ghoraba [41]. The model was run using the prepared weather input data from January 1981 to December 2018, and all the necessary files needed to simulate SWAT were written at this level.
2.5.4. Model Calibration and Validation
The sequential uncertainty fitting algorithm (SUFI-2) was applied in SWAT Cup to perform the calibration of the model. The algorithm accounts for different types of uncertainties arising from model conceptualization, parameters, and observed data. The uncertainty of the input parameter was represented by a uniform distribution, while the output uncertainty was computed at 95% prediction uncertainty (95PPU) [43,51]. Calibration was done on Njoro River upstream of the 2FC05 gauge. The area of the watershed contributing runoff to the gauge station was measured as 122 km2. The watershed configuration is shown in Figure 5. Calibration was done on daily time series from 1884 to 1996, and parameters were validated from 1997 to 2007. Calibration and validation were carried out by comparing the measured daily discharge values for Njoro River with the simulated stream flows, and the model performance assessment was in accordance with Moriasi et al. [52]. Based on previous studies, the parameters most sensitive for hydrological modeling are CN2, ESCO, SOL_AWC, and GWQMN [15,40,44]. During calibration, 14 parameters were chosen, with the focus being on the four most sensitive parameters. The final fitted parameter values are as shown in Table 4.
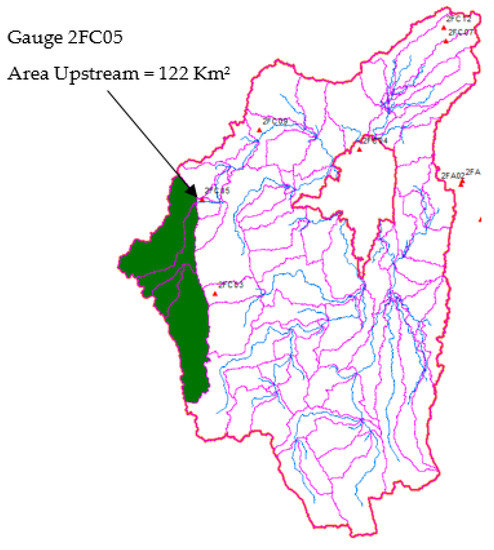
Figure 5.
Watershed contributing runoff to 2FC05.

Table 4.
Final fitted parameters.
Regionalization was used for predicting the streamflow from the ungauged subcatchments. This involves the transfer of parameters from a gauged (donor) catchment to ungauged (target) catchments. There are three widely used regionalization methods: spatial proximity, physical similarity and integrated similarity [53,54,55]. Oudin et al. [56] compared the three regionalization approaches over a wide range of hydroclimates in France. The study used two lumped rainfall–runoff models applied to daily data over a large set of 913 French catchments and the results indicated that spatial proximity provides the best regionalization solution, regression is the least satisfactory, and the physical similarity approach is intermediary. This is because spatial proximity uses parameter values calibrated for geographic neighbors, with an underlying assumption that the neighboring catchments have homogenous physical and climatic characteristics and therefore the hydrological responses are similar. The regression approach is the worst compared to the other two since the cross-correlation between parameters is seldom taken into account and model calibrations can produce vastly different sets of parameter values that give a similar model performance. In this study, regionalization by spatial proximity was applied since Zhang et al. and Merz et al. [53,57] also demonstrated that the use of this approach offers the best model performance on ungauged catchments. The fitted parameters for the River Njoro subcatchment were transferred to simulate the flows for the Makalia, Ngosur, Nderit, and Larmudiac Rivers since their subcatchments are ungauged.
2.5.5. Model Performance Evaluation
Evaluation of the model performance is necessary for the verification of the robustness of the model [44]. In this study, performance evaluation of the model was carried out based on the coefficient of determination method (R2), given as Equation (2), and the Nash–Sutcliffe efficiency (NSE), given as Equation (3). We used the model evaluation guidelines provided by Moriasi et al. [52]. R2 ranges from 0 to 1; values greater than 0.5 are considered acceptable [41]. NSE values are considered very good between 0.75 and 1, good between 0.65 and 0.75, satisfactory between 0.5 and 0.65, and unsatisfactory below 0.5 [52]:
where is the discharge measured on the ith day of the simulation, is the simulated discharge, is the average measured discharge, and is the average simulated discharge.
3. Results and Discussion
3.1. Rainfall Analysis for Lake Nakuru Catchment
3.1.1. Station (KE0863) and CHIRPS Rainfall Data Comparison
Figure 6 shows the results for a comparison between the CHIRPS gridded rainfall data and KE0863 station data at an annual scale for 1981 to 2017. The percentage bias (PBIAS) indicated an overestimation of the rainfall data at the station (2.4%), which is acceptable since it is within the range of ± 25). The Pearson correlation coefficient (r) value was 0.67, which is fulfills the requirement of r > 0.5 [58]. The results agreed with Ayugi et al.’s study [38], in which CHIRPS data overestimated precipitation in both a low-altitude, humid climate and in arid and semi-arid land (ASAL) for annual analysis. A high correlation was also seen when comparing the annual patterns of CHIRPS data with ground-based observation stations for all the regions, with the value of (r) being greater than 0.91. The mean annual rainfall was 1029 mm and 1059 mm for the observed data at the station and the gridded CHIRPS data, respectively. In general, the observed statistical results for the comparison between CHIRPS data and observed data at the station showed a high agreement, and therefore the gridded data were used for further analysis.
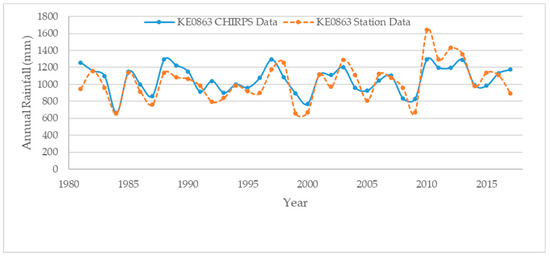
Figure 6.
Comparison between CHIRPS and observed rainfall data on annual time series.
3.1.2. Standardized Precipitation Index (SPI) and Standardized Precipitation Standardized Precipitation Evaporation Index (SPEI)
The results of both SPI and SPEI indices for the five subcatchments in Lake Nakuru Basin are as shown in Figure 7a–e and summarized in Table 5. The results in Table 5 are from 1981 to 2018, with an emphasis on the 10-year period from 2009 to 2018. The results are very similar, with a higher frequency of wetter periods than drier periods being observed at Ngosur, Larmudiac, Makalia, and Nderit stations from 1981 to 2018. Egerton station (KE0863) recorded an equal distribution of wet and dry periods, with 50.00% positive anomalies and 50.00% negative anomalies. Ngosur station recorded 57.89% positive anomalies and 42.11% negative anomalies, while Nderit station recorded 55.26% wet periods and 44.74% dry periods. Larmudiac and Makalia stations experienced similar results, with 55.26% positive anomalies versus 44.74% negative anomalies. An analysis was also done for the last 10 years, which yielded similar recordings of the higher frequency of wet periods compared to dry periods. Egerton, Ngosur, Larmudiac, and Nderit stations recorded 70.00% wet periods and 30.00% dry periods, while Makalia station recorded 60.00% wet and 40.00% dry. The years 1984 and 2000 were seen as severely dry (SPI/SPEI < −2.00), while 2018 was observed to be severely wet (SPI/SPEI > 2.00) for the Ngosur, Nderit, Makalia, and Larmudiac subcatchments. The year 2010 was a severely wet year for Egerton University station. From the SPEI and SPI results shown in Figure 7, 2010 to 2018 represented a period of wetter than normal rainfall and is the longest continuous wet period in the history of the data analyzed.
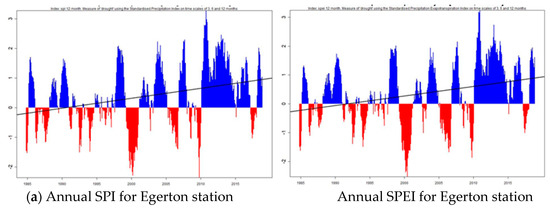
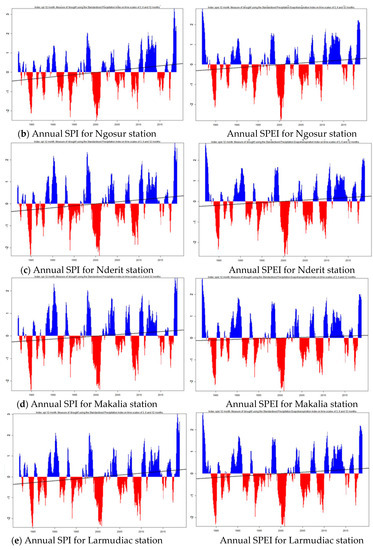
Figure 7.
Annual standardized precipitation index (SPI) and standardized precipitation standardized precipitation evaporation index (SPEI) from 1981 to 2018 for (a) Egerton station, (b) Ngosur station, (c) Nderit station, (d) Makalia station, and (e) Larmudiac station.

Table 5.
Distribution of wet and dry periods for 12-month SPI for Lake Nakuru catchment from 1981 to 2018 and from 2009 to 2018.
3.2. Model Performance
The model performance as shown in Figure 8a–c was considered satisfactory for both calibration and validation period since the values of fullfilled the requirement of and NSE > 0.5 [41,52] The values of R2 for the two periods indicated that there was a good correlation between the observed and simulated flow as shown in Figure 9. The NSE and R2 values were 0.58 for the calibration period and 0.52 and 0.67, respectively, for the validation period in the daily time series, as given in Table 6.
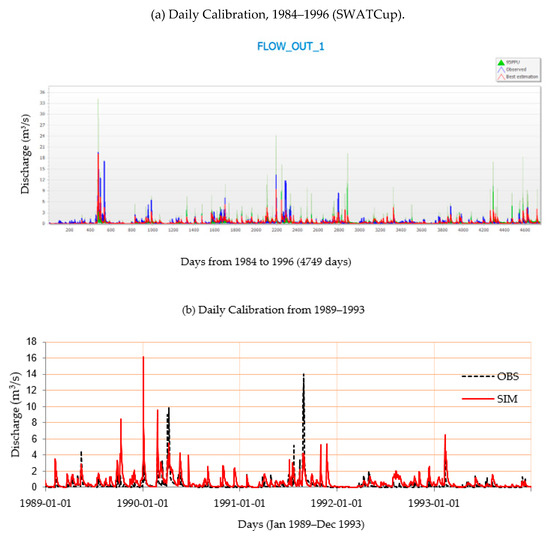
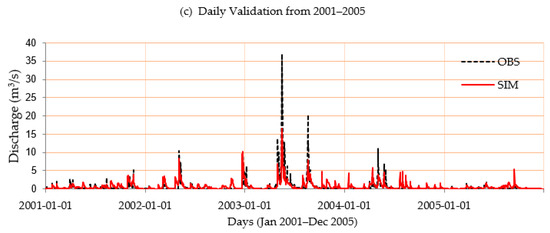
Figure 8.
(a) Observed and simulated daily discharge for River Njoro (2FCO5) during the calibration period 1984–1996, (b) a section of observed and simulated daily flow for the calibration period 1989–1993, and (c) a section of observed and simulated flow for the validation period 2001–2005.
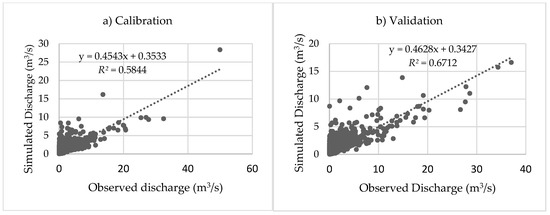
Figure 9.
Correlation between observed and simulated daily river discharge for Njoro River at 2FC05 station for the calibration period (1984–1996) and the validation period (1997–2007).

Table 6.
Model performance assessment based on daily river discharge, as guided by Moriasi et al. [52].
The generated streamflow from each subcatchment was used for the calculations of the streamflow drought index (SDI).
3.3. Long-Term Water Balance of Lake Nakuru Catchment from 1981 to 2018
Figure 10 represent the annual averages for the Lake Nakuru watershed for the daily simulation period, 1981 to 2018, carried out with SWAT model. Results show that actual evapotranspiration (ET) dominates the water balance, with a percentage of 73.75% of the average annual precipitation received in the watershed. The total water yield simulated by the SWAT model as the sum of surface runoff and the net contribution of groundwater and lateral flow was 21.62% of the average annual precipitation.
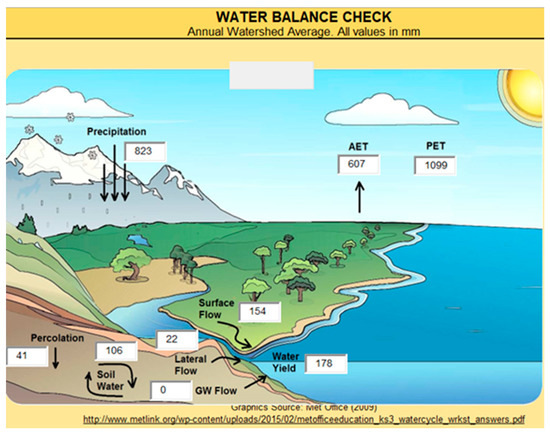
Figure 10.
Annual water balance components from 1981 to 2018 for Lake Nakuru Basin.
3.4. The Streamflow Drought Index (SDI)
The temporal variation of the 12-month SDI, implying a long-term drought, is shown in Figure 11 from 1981 to 2018 for the five streams in the catchment. Table 7 summarizes the frequency of dry years in comparison to wet years from 1981 to 2018 and emphasizes the 10-year results from 2009 to 2018. The results for Njoro River give 47.37% positive anomalies in comparison with 52.63% negative anomalies. Ngosur and Nderit Rivers have similar results, with 44.74% wet periods in comparison to 55.26% dry periods. Makalia River records an equal distribution of wet and dry periods at 50.00%, while Larmudiac River has a higher frequency of wet years (52.63%) than dry years (47.37%). The years 1984 and 2000 experienced the most severe long-term drought with SDI < −2.00. A prolonged dry period was experienced from 1981 to 1987, as indicated in Figure 11. The period between 1988 and 1996 received streamflow at a normal threshold, which alternated between wet and dry periods except for 1993 for Ngosur River, which was a moderately dry year. The observations made from 2009 to 2018 show a higher frequency of wet periods compared to dry periods, with more than 60.00% positive anomalies.
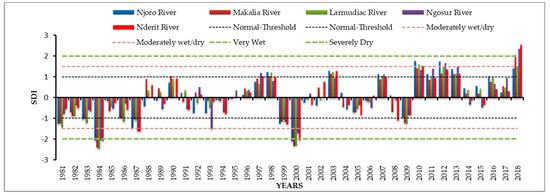
Figure 11.
Annual (12–month) streamflow drought index (SDI) for streams in the Lake Nakuru subcatchment from 1981 to 2018.

Table 7.
Distribution of wet and dry periods for 12-month SDI for Lake Nakuru catchment from 1981 to 2018 and from 2009 to 2018.
3.5. Comparison between 12-Month SPI and SDI at the Catchment Scale and in Individual Subcatchments
The results for the temporal variation of the SPI and SDI at the catchment scale and for the five individual subcatchments indicate that the drought events identified by the 12-month SPI are almost all identified by the 12-month SDI. There is thus a relationship between the hydrological drought indices and the meteorological indices.
The temporal variation for the 12-month SPI and SDI is shown in Figure 12 and summarized in Table 8. The period from 1981 to 2018 is subdivided into four sections for the analysis. A prolonged dry period is experienced from 1981 to 1987, with the SDI values for all subcatchments having 100.00% negative anomalies. Unlike Ngosur subcatchment, which observed 57.14% positive anomalies and 42.86% negative anomalies for SPI, the frequency of wet periods is less than 45.00% compared with the frequency for dry periods for Njoro, Larmudiac, Makalia, and Nderit subcatchments. For 1988 to 1996, the observations made for Ngosur and Nderit subcatchments are similar for both SPI and SDI, with the frequency of wet periods being 44.44% while that for dry periods was 55.56%. Njoro subcatchment observed 33.33% positive anomalies versus 66.67% negative anomalies for both SPI and SDI. An equal distribution of wet and dry periods was observed at 55.56% and 44.44%, respectively, for SPI and SDI for Larmudiac and Makalia subcatchments.
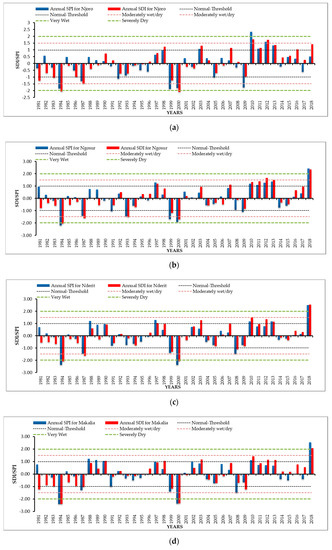
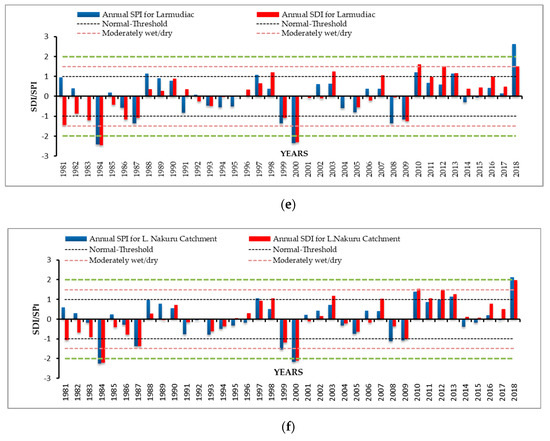
Figure 12.
Changes in annual SPI and SDI index (12–month timescale) for Lake Nakuru catchment from 1981 to 2018 for Njoro (a), Ngosur (b), Nderit (c), Makalia (d), Larmudiac (e), and Lake Nakuru (f) subcatchments.

Table 8.
Distribution of wet and dry periods for 12-month SDI and SPI for Lake Nakuru subcatchments and the entire catchment.
For the period between 1997 and 2009, an equal distribution of positive anomalies and negative anomalies was observed at 53.85% and 46.15%, respectively, for SPI and 46.15% and 53.85% for SDI for Njoro, Ngosur, and Nderit subcatchments. Larmudiac subcatchment observed 46.15% positive anomalies and 53.85% negative anomalies for SPI and 38.46% positive anomalies and 61.54% negative anomalies for SDI. Makalia subcatchment observed 53.85% and 46.15% positive and negative anomalies, respectively, for SPI, and a 38.46% and 61.54% frequency of wet and dry periods, respectively, for SDI.
The period 2010 to 2018 saw a higher frequency of wet periods compared to dry periods for all subcatchments, with Njoro, Larmudiac, and Makalia subcatchments having 100.00% positive anomalies for the SDI. Unlike Makalia subcatchment, which observed 66.67% positive anomalies and 33.33% negative anomalies for the SPI indices, the other four subcatchments observed a 77.78% frequency of wet periods and 22.22% frequency of dry periods. Nderit and Ngosur subcatchments recorded a higher frequency of wet periods compared with dry periods at 77.78% and 22.22%, respectively, for SDI. The years 1984 and 2004 experienced severe drought (SPI and SDI < −2), while 2010 was very wet for Njoro subcatchment (SPI and SDI > 2). The year 2018 was very wet (SPI and SDI > 2) for Makalia, Ngosur, Nderit, and Larmudiac subcatchments.
4. Conclusions
In this study, the temporal variability of rainfall and discharges into Lake Nakuru was analyzed using meteorological (SPI and SPEI) and hydrological (SDI) drought indices for a 38-year study period (1981–2018) and for a 10-year study period (2009–2018) for five subcatchments of Lake Nakuru. The major findings and conclusion were as follows:
(1) Gridded CHIRPS precipitation data showed high agreement with the observed data for Egerton station (KE0863) and were therefore used for the calculation of the meteorological drought indices (SPEI and SPI) for the four subcatchments without recorded data.
(2) The results showed that the SWAT model can be applied for the simulation of streamflow for the gauged and ungauged subcatchments for the study area, with satisfactory performance for both the calibration and the validation period. The results were used for the calculation of the hydrological drought index (SDI) for the study area.
(3) The results of temporal variation of the SPI and SDI at the catchment scale and for the five individual subcatchments indicate that there is a relationship between the hydrological drought indices and meteorological indices. The temporal variation for the 12-month SPI and SDI for all the subcatchments shows a higher frequency of prolonged dry periods from 1981 to 1996. A prolonged wet period was also experienced from 2010 to 2018. Severe drought was experienced in 1984 and 2000 while 2018 was a very wet year for the Larmudiac, Nderit, Ngosur, and Nderit subcatchments. The year 2010 was a very wet year for Njoro subcatchment.
(4) The results are similar to those obtained by Coppock et al. [32]; in their study, the lake experienced prolonged drying and falling water levels from the mid-1980s through 1996, along with an associated increases in water salinity. According to the study, the lake dried up completely in 1995 and 1996, resulting in most birds disappearing and tourism being greatly diminished. From Figure 12, its observed that the SPI and SDI indices for 1995 and 1996 are below the normal threshold (–0.5 < SPI/SDI < 0.5) and agree with the study. However, in 1997, a positive anomaly was observed for both the SPI and SDI indices (SPI/SDI > 0.5) for all the subcatchments, which could be a result of the El Niño-driven flooding in 1997 and 1998, during which the lake levels rebounded [32]. The results of the SPI, SPEI, and SDI indices indicate that, from 2010 to 2018, there was a higher frequency of wet periods than dry periods, which could be why the lake has shown increasing levels since 2011, according to Onywere et al. [33].
The results of the variability in rainfall and streamflow indices presented in this research provide a useful baseline for additional work on the impacts of climate change and climate variability on rainfall and stream flows for Lake Nakuru Basin. This will help with preparedness in planning for the infrastructure around the lake to avoid further losses caused by flooding.
In the future, it is recommended that research be conducted on the possible causes of the variability in Lake Nakuru’s water levels, which could be as a result of climate change, groundwater recharge, increased sedimentation, hydrological forcing, or tectonic uplifting of the Rift Valley floor. Coppock et al. [32] calibrated a monthly water balance using available data for Lake Nakuru Basin from 1958 to 1976. The results indicated that rainfall was the largest source of water for the lake, followed by tributary inflows and then groundwater seepage. It is recommended that a lake water balance model be developed from 1980 to the present using the latest bathymetry survey to investigate whether hydrometeorological data can fully explain the variability in lake levels.
Author Contributions
A.N.K. designed and conducted the study as part of her master’s thesis. J.M.G. and C.K.C. co-designed the study, reviewed the manuscript, and gave comments and suggestions.
Funding
This research received no external funding.
Acknowledgments
My sincere appreciation goes to Pan African University Institute for Basic Sciences Technology and Innovation (PAUSTI), Nairobi, Kenya for funding the research work.
Conflicts of Interest
The authors declare no conflict of interest.
References
- Shang, X.; Jiang, X.; Jia, R.; Wei, C. Land use and climate change effects on surface runoff variations in the upper Heihe River basin. Water 2019, 11, 344. [Google Scholar] [CrossRef]
- Friesen, J.A.N.; Andreini, M.; Andah, W.; Amisigo, B.; van de Giesen, N. Storage capacity and long-term water balance of the Volta Basin, West Africa. Phys. Chem. Earth 2015, 2, 138–145. [Google Scholar]
- Muchuru, S.; Botai, J.O.; Botai, C.M.; Landman, W.A.; Adeola, A.M. Variability of rainfall over Lake Kariba catchment area in the Zambezi river basin, Zimbabwe. Theor. Appl. Climatol. 2016, 124, 325–338. [Google Scholar] [CrossRef]
- Rustum, R.; Adeloye, A.J.; Mwale, F. Spatial and temporal Trend Analysis of Long Term rainfall records in data-poor catchments with missing data, a case study of Lower Shire floodplain in Malawi for the Period 1953–2010. Hydrol. Earth Syst. Sci. 2017, 1–30. [Google Scholar] [CrossRef]
- Langat, P.K.; Kumar, L.; Koech, R. Temporal variability and trends of rainfall and streamflow in Tana River Basin, Kenya. Sustainability 2017, 9, 1963. [Google Scholar] [CrossRef]
- Taxak, A.K.; Murumkar, A.R.; Arya, D.S. Long term spatial and temporal rainfall trends and homogeneity analysis in Wainganga basin, Central India. Weather Clim. Extrem. 2014, 4, 50–61. [Google Scholar] [CrossRef]
- Al-Mukhtar, M.; Al-Yaseen, F. Modeling water quality parameters using data-driven models, a case study Abu-Ziriq marsh in south of Iraq. Hydrology 2019, 6, 24. [Google Scholar] [CrossRef]
- Fleming, M.; Brauer, T. Hydrologic Modeling System, HEC-HMS, Quick Start Guide. US Army Corps of Engineers Institute for Water Resources Hydrologic Engineering Center, 2016. Available online: https://www.hec.usace.army.mil/software/hec-hms/documentation/HEC-HMS_QuickStart_Guide_4.2.pdf (accessed on 14 October 2019).
- Boughton, W. The Australian water balance model. Environ. Model Softw. 2004, 19, 943–956. [Google Scholar] [CrossRef]
- Goswami, M.; O’Connor, K.M. Flow simulation in an ungauged basin: An alternative approach to parameterization of a conceptual model using regional data. IAHS-AISH Publ. 2006, 307, 149–158. [Google Scholar]
- Arenas-Bautista, M.C.; Arboleda Obando, P.F.; Duque-Gardeazábal, N.; Guadagnini, A.; Riva, M.; Donado-Garzón, L.D. Hydrological Modelling the Middle Magdalena Valley (Colombia). Am. Geophys. Union. 2017. [Google Scholar] [CrossRef]
- Nourani, V.; Roughani, A.; Gebremichael, M. Topmodel capability for rainfall-runoff modeling of the Ammameh watershed at different time scales using different terrain algorithms. J. Urban Environ. Eng. 2011, 5, 1–14. [Google Scholar] [CrossRef]
- Mishra, H.; Mario, D.; Shakti, D.; Mukesh, S.; Kumar, S.; Anjelo, S.; Denis, F.; Kumar, R. Hydrological simulation of a small ungauged agricultural watershed Semrakalwana of Northern India. Appl. Water Sci. 2017, 7, 2803–2815. [Google Scholar] [CrossRef]
- Access, O.; Setegn, S.G.; Srinivasan, R.; Dargahi, B. Hydrological Modelling in the Lake Tana Basin, Ethiopia Using SWAT Model. Open Hydrol. J. 2008, 2, 49–62. [Google Scholar]
- Brouziyne, Y.; Abouabdillah, A.; Bouabid, R.; Benaabidate, L. SWAT streamflow modeling for hydrological components’ understanding within an agro-sylvo-pastoral watershed in Morocco. J. Mater. Environ. Sci. 2018, 9, 128–138. [Google Scholar] [CrossRef]
- Palani, B. Hydrology modeling to assess soil water balance in Dal Lake basin using SWAT Hydrology modeling to assess soil water balance in Dal Lake basin using SWAT. Res. Rev. J. 2018, 3. [Google Scholar] [CrossRef]
- Amatya, D.M.; Jha, M.; Edwards, A.E.; Williams, T.M.; Hitchcock, D.R. SWAT-Based streamflow and embayment modeling of karst-affected chapel branch watershed, South Carolina. ASABE ISSN 2011, 54, 1311–1323. [Google Scholar] [CrossRef]
- Tri, D.Q.; Dat, T.T.; Truong, D.D. Application of Meteorological and Hydrological Drought Indices to Establish Drought Classification Maps of the Ba River Basin in Vietnam. Hydrology 2019, 6, 49. [Google Scholar] [CrossRef]
- Desta, H.; Lemma, B. Journal of Hydrology: Regional Studies SWAT based hydrological assessment and characterization of Lake. J. Hydrol. Reg. Stud. 2017, 13, 122–137. [Google Scholar] [CrossRef]
- Eslamian, S.; Ostad-ali-askari, K.; Singh, V.P.; Dalezios, N.R. A Review of Drought Indices. Int. J. Construct. Res. Civil Eng. (IJCRCE) 2017. [Google Scholar] [CrossRef]
- Loukas, A.; Vasiliades, L. Probabilistic analysis of drought spatiotemporal characteristics in Thessaly region, Greece. Nat. Hazard. Erath Sys. 2004. [Google Scholar] [CrossRef]
- Boudad, B.; Sahbi, H.; Manssouri, I. Analysis of meteorological and hydrological drought based in SPI and SDI index in the Inaouen Basin (Northern Morocco). J. Mater Environ. Sci. 2018, 9, 219–227. [Google Scholar] [CrossRef]
- Jang, D. Assessment of meteorological drought indices in Korea using RCP 8.5 scenario. Water 2018, 10, 283. [Google Scholar] [CrossRef]
- Gurrapu, S.; Chipanshi, A.; Sauchyn, D.; Howard, A. Comparison of the SPI and SPEI on predicting drought conditions and streamflow in the Canadian prairies. In Proceedings of the 28th Conference Hydrology, Atlanta, GA, USA, 2–6 February 2014. [Google Scholar]
- Okpara, J.N.; Tarhule, A. Evaluation of Drought Indices in the Niger Basin, West Africa1. J. Geogr. Earth Sci. 2015, 3, 1–32. [Google Scholar]
- Mckee, T.B.; Doesken, N.J.; Kleist, J. The relationship of drought frequency and duration to time scales. In Proceedings of the Eighth Conference on Applied Climatology, Anaheim, CA, USA, 17–22 January 1993; pp. 17–22. [Google Scholar]
- Agwata, J.F. A Review of Some Indices used for Drought Studies. Civil Environ. Res. 2014, 6, 14–21. [Google Scholar]
- Bayissa, Y.A.; Moges, S.A.; Xuan, Y.; Van Andel, S.J.; Maskey, S.; Solomatine, D.P.; Van Griensven, A.; Tadesse, T. Spatio-temporal assessment of meteorological drought under the influence of varying record length: The case of Upper Blue Nile Basin, Ethiopia. Hydrol. Sci. J. 2015, 60, 1–16. [Google Scholar] [CrossRef]
- Svoboda, M.; Hayes, M.; Wood, D. Standardized Precipitation Index User Guide. WMO 2012, 1090, 1333–1348. [Google Scholar]
- Stagge, J.H.; Kingston, D.G.; Tallaksen, L.M.; Hannah, D.M. Observed drought indices show increasing divergence across Europe. Sci. Rep. 2017, 7, 1–10. [Google Scholar] [CrossRef]
- Daniel, O.; Alfred, O.; Justus, B. Holocene palaeohydrology, groundwater and climate change in the lake basins of the Central Kenya Rift. Hydrol. Sci. J. 2009, 54, 765–780. [Google Scholar]
- Jenkins, M.W.; Mccord, S.A.; Edebe, J. Sustaining Lake Levels in Lake Nakuru, Kenya: Development of a Water Balance Model for Decision Making; Global Livestock CRSP. Utah State Univ. Digit. @USU.: Davis, CA, USA, 2009. [Google Scholar]
- Onywere, M.S.; Shisanya, C.; Obando, J.; Masiga, D.; Irura, Z.; Mariita, N.; Maragia, H.; Oduya, A.N. Understanding the Environment, Promoting Health in Lake Baringo and Bogoria Drainage Basin. 2013. Available online: https://www.semanticscholar.org/paper/Understanding-the-Environment%2C-Promoting-Health-in-Onywere-Shisanya/d597aee12ff7ec125b4178c4f261ccf9451fd37b (accessed on 14 October 2019).
- Waithaka, H.; Gichuru, G. Analysis of lake nakuru surface water area variations using geospatial technologies. In Proceedings of the JKUAT Scientific Conference, Nairobi, Kenya, November 2015; pp. 308–322. [Google Scholar]
- Mbote, B.W.; Alfred, O.; John, M.; Githaiga, F.K.K. Assessing the impacts of climate variability and climate change on biodiversity in Lake Nakuru, Kenya. Bonorowo Wetl. 2018, 8, 13–24. [Google Scholar]
- Jackson, R.A.; Kulecho, A. Lake Nakuru-Kenya: A review of Environmental Impacts of Landuse Changes. In Proceedings of the Taal2007: The 12th World Lake Conference, Jaipur, Rajasthan, India, 28 October–2 November 2007; pp. 2241–2245. [Google Scholar]
- Odada, O.E.; Raini, J.; Ndetei, R. Lake Nakuru: Experience and Lessons Learned Brief. Lake Basin Management Initiative: Main Report. 2006. Available online: https://www.semanticscholar.org/paper/Lake-Nakuru%3A-experience-and-lessons-learned-brief-Odada-Raini/7e6ad81b8d594f78e5b7262b2d2b029e72f49767 (accessed on 14 October 2019).
- Ayugi, B.; Tan, G.; Ullah, W.; Boiyo, R.; Ongoma, V. Inter-comparison of remotely sensed precipitation datasets over Kenya during 1998–2016. Atmos. Res. 2019, 225, 96–109. [Google Scholar] [CrossRef]
- Bayissa, Y.; Maskey, S.; Tadesse, T.; van Andel, S.; Moges, S.; van Griensven, A.; Solomatine, D. Comparison of the Performance of Six Drought Indices in Characterizing Historical Drought for the Upper Blue Nile Basin, Ethiopia. Geosciences 2018, 8, 81. [Google Scholar] [CrossRef]
- Gonzaga, M.; De Oliveira, A.; Netto, D.A.; Joaquim, R.; Neves, D.J.; Nascimento, A.; Almeida, C. Sensitivity Analysis and Calibration of Hydrological Modeling of the Watershed Northeast Brazil. J. Environ. Prot. 2015, 6, 837–850. [Google Scholar]
- Ghoraba, S.M. Hydrological modeling of the Simly Dam watershed (Pakistan) using GIS and SWAT model. Alexandria Eng. J. 2015, 54, 583–594. [Google Scholar] [CrossRef]
- Watershed, N.; Shrestha, N.K.; Shakti, P.C.; Gurung, P. Calibration and Validation of SWAT Model for Low Lying Watersheds: A Case Calibration and Validation of SWAT Model for Low Lying Watersheds: A Case Study on the Kliene Nete Watershed, Belgium. Hydro Nepal J. Water Energy Environ. 2011. [Google Scholar] [CrossRef]
- Change, C. Assessing Variation in Water Balance Components in Mountainous Inland River Basin Experiencing Climate Change. Water 2016, 8, 472. [Google Scholar] [CrossRef]
- Adeogun, A.G.; Sule, B.F.; Salami, A.W.; Daramola, M.O. Validation of SWAT Model for Prediction of Water Yield and Water Balance: Case Study of Upstream Catchment of Jebba Dam in Nigeria. Int. J. Civil Environ. Eng. 2014, 8, 264–270. [Google Scholar]
- Batjes, N.H.; Gicheru, P. Soil Data Derived from SOTER for Studies of Carbon Stocks and Change in Kenya. ISRIC World Soil Information Report, 2004. Available online: https://www.isric.org/sites/default/files/isric_report_2004_01.pdf (accessed on 14 October 2019).
- Nurmi, L. Buffer Zone Plans for Lake Nakuru National Park and for Njoro River in Kenya. Master’s Thesis, Laurea University of Applied Sciences, Vantaa, Finland, May 2010. [Google Scholar]
- Kebede, S.; Travi, Y.; Alemayehu, T.; Marc, V. Water balance of Lake Tana and its sensitivity to fluctuations in rainfall, Blue Nile basin, Ethiopia. J. Hydrol. 2006, 316, 233–247. [Google Scholar] [CrossRef]
- Chebud, Y.A.; Melesse, A.M. Modelling lake stage and water balance of Lake Tana, Ethiopia. Hydrol. Processes Int. J. 2009, 23, 3534–3544. [Google Scholar] [CrossRef]
- Taylor, P. Chapter 2, Literature Review. 1998, pp. 15–41. Available online: https://shodhganga.inflibnet.ac.in/bitstream/10603/161726/3/12.%20chapter-2.pdf (accessed on 1 October 2019).
- Deganovsky, A.M.; Getahun, B.A. Water Balance and Level Regime of Ethiopian Lakes as Integral Indicators of Climate Change. In Proceedings of the Taal2007: The 12th World Lake Conference, Jaipur, Rajasthan, India, 28 October–2 November 2007. [Google Scholar]
- Thavhana, M.P.; Savage, M.J.; Moeletsi, M.E. SWAT model uncertainty analysis, calibration and validation for runo ff simulation in the Luvuvhu River catchment, South Africa. Phys. Chem. Earth 2018, 105, 115–124. [Google Scholar] [CrossRef]
- Moriasi, D.N.; Arnold, J.G.; Van Liew, M.W.; Bingner, R.L.; Harmel, R.D.; Veith, T.L. Model Evaluation Guidelines for Systematic Quantification of Accuracy in Watershed Simulations. Trans ASABE 2007, 50, 885–900. [Google Scholar] [CrossRef]
- Zhang, Y.; Chiew, F.H.S. Relative merits of different methods for runoff predictions in ungauged catchments. Water Resour. Res. 2014. [Google Scholar] [CrossRef]
- Mengistu, A.G.; van Rensburg, L.D.; Woyessa, Y.E. Techniques for calibration and validation of SWAT model in data scarce arid and semi-arid catchments in South Africa. J. Hydrol. Reg. Stud. 2019, 25, 100621. [Google Scholar] [CrossRef]
- Zhang, Y.; Chiew, F.H.S. Evaluation of regionalisation methods for predicting runoff in ungauged catchments in southeast Australia. In Proceedings of the 18th World IMACS/MODSIM Congress, Cairns, Australia, 13–17 July 2009. [Google Scholar]
- Oudin, L.; Andréassian, V.; Perrin, C.; Michel, C.; Le Moine, N. Spatial proximity, physical similarity, regression and ungaged catchments: A comparison of regionalization approaches based on 913 French catchments. Water Resour. Res. 2008, 44, 1–15. [Google Scholar] [CrossRef]
- Merz, R. Regionalisation of catchment model parameters. J. Hydrol. 2004, 287, 95–123. [Google Scholar] [CrossRef]
- Valdés-Pineda, R.; Demaría, E.M.C.; Valdés, J.B.; Wi, S.; Serrat-Capdevilla, A. Bias correction of daily satellite-based rainfall estimates for hydrologic forecasting in the Upper Zambezi, Africa. Hydrol. Earth Syst. Sci. Discuss. 2016, 1, 1–28. [Google Scholar] [CrossRef]
© 2019 by the authors. Licensee MDPI, Basel, Switzerland. This article is an open access article distributed under the terms and conditions of the Creative Commons Attribution (CC BY) license (http://creativecommons.org/licenses/by/4.0/).