Abstract
Prolonged and frequent droughts in Southern California present hazards and uncertainty for the region’s increasing population, resulting in proactive and aggressive water management strategies. The goal of this study is to present a case study of the San Diego region’s rainfall and temperature time series analysis in order to determine annual and seasonal trends and their significance. Rainfall and temperature data from 20 rain-gauged stations were analyzed for the period 1985–2017. A project database was set up for data compilation and quality control, and a Mann-Kendall test for trend analysis was used. Results indicated that rainfall in the region decreased both annually and during the rainy season (November–April) by up to 0.14 mm between 1985 and 2017, although not in a statistically significant manner, except at two rainfall observation stations. Rainfall appears to have increased in many of the stations examined during the dry season (May–October), with an average magnitude of 0.09 mm. Analysis of daily minimum and maximum temperature reveals overall average annual and seasonal increases of 0.07 °C and 0.04 °C, respectively, with statistically significant increases at 10 of 17 for minimum temperature, and 0.27 °C and −0.25 °C with statistically significant increases at 9 of 16 for maximum temperature. Temperature tends to have increased more during the dry season compared to the rainy season. This study reveals an overall decreasing tendency in rainfall and an increasing tendency in minimum and maximum temperatures (although not statistically significant) in the San Diego region between 1985 and 2017, which likely contributed to important management implications for the region’s water resources.
1. Introduction
San Diego County is located in Southern California, an area that features numerous climate types, including Mediterranean, semi-arid, desert, and mountain climates, with irregular rainfall and many sunny days. Rainfall in San Diego County is naturally limited, highly variable, and unreliable [1,2,3]. Adequate water to support the needs of agricultural, industrial, and residential sectors is a challenge that persists in water-scarce regions, which are prone to flooding and prolonged drought [2,4,5].
Drought events in Southern California are frequent, chronic, pronounced, and prolonged due to high potential evapotranspiration and low-rainfall events [6]. The 2012–2014 drought was an approximately 10,000-year event, and the 2012–2015 drought was exceptionally severe, such that it was classified as an unprecedented event with virtually no calculable return period [7,8]. The 2012–2015 drought produced the greatest moisture deficit in California in the last 1200 years during the single-year 2014 event, subsequently leading to unwanted economic, agricultural, hydrological, and ecological consequences [7,9]. Based on years of rainfall data, Griffin and Anchukaitis (2014) [7] characterized drought variability in Southern California as primarily interannual, trending with the quasiperiodic influence of the El Niño–Southern Oscillation (ENSO), regional atmospheric pressure anomalies, and “drought-busting” atmospheric rivers [10,11,12,13]. Southern California drought conditions occur with the persistence of meteorological conditions that reduce and suppress storm activities, resulting in low incident precipitation events [14,15].
The extreme seasonality and variability of the region’s rainfall present a challenge for human and environmental water needs [12,14,15]. For example, Noe and Zedler (2001) [16] found a reduction in the germination of upper intertidal marsh plants with variable rainfall in Southern California, where ecosystems face remarkable natural variation in weather and water availability [16,17]. The historical seasonality and scarcity of rainfall in the region are exacerbated by climate change and population growth, reflected in diminishing springs, reservoirs, and aquifers [9], as well as increasing human activities that weigh heavily on the existing water supply sources and natural ecosystems [17,18]. Recent data indicates that the state’s climate is warming, with more frequent extreme weather, earlier snow melt, and notable decreases in spring and summer streamflow [17,19]. Growth in population and agriculture has almost doubled water use since 1950 [19,20].
Coordinated large and proactive water management projects have been undertaken in Southern California [8,21,22] to help develop resiliency and adaptation to constantly rising and dynamic water demands [9,17,23]. In San Diego County, these water management strategies take the form of aggressive water conservation efforts and plan to diversify local water supply sources by 2035 [24]. To support water supply diversification and effective management efforts, analysis of rainfall and temperature is an important step towards balancing water supply and demand in an urban-agricultural setting. Southern California’s population is expected to increase, and millions of people are projected to migrate to San Diego County by 2050 [25], while the county’s agricultural sector is expected to remain an important contributor to the region’s economy. The goal of this study was, therefore, to present a case study of the rainfall trend and its effects on water availability in Southern California. The specific objectives of this study were to use historical data to document the long-term trend characteristics of rainfall and temperature and to discuss their implications for San Diego County’s water supply. This study used a mixed-method, including a Mann-Kendall test for studying rainfall and temperature trends in conjunction with non-numerical information to provide insight into Southern California’s water availability issues.
2. Materials and Methods
2.1. Study Area
San Diego County occupies a quadrate portion of the far-southwestern corner of the state of California and the United States (Figure 1), encompassing approximately 11,000 km2 and spanning 105 km from north to south and 138 km from east to west [26,27]. San Diego County is the second-most populous county in California and the fifth-most in the United States, with a population of more than 3 million inhabitants. The City of San Diego, which serves as the county seat and has more than 1.3 million residents, is the second largest city in California and the 17th most populous metropolitan area in the United States [28]. Greater San Diego is part of the San Diego-Tijuana metropolitan area, shared between the United States and Mexico.
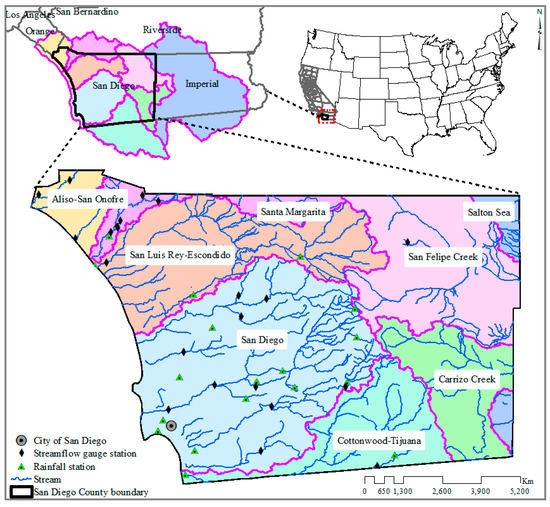
Figure 1.
Location of San Diego County, City of San Diego, rainfall and temperature measurement stations, and major watersheds in the county.
The physical geography, land usage, and landforms of San Diego County are generally consistent from north to south, while transitioning steadily from west to east. More than 110 km of Pacific Ocean coastline forms the county’s western boundary, where the majority of residents live within approximately 24 km of the coast in a heavily urbanized region [29]. Beaches and coastal terraces comprise the western third of the county and gradually yield to more rural foothills and valleys to the east (Figure 1), where agriculture and ranching tend to dominate land usage. Further east, the heavily forested mountains of the Peninsular Ranges bisect the county in a generally north-south direction, with some peaks gradually rising to above 2000 m before dropping rapidly into the low deserts of the county’s eastern quarter [30,31].
San Diego County generally has a mild Mediterranean climate, while experiencing microclimate shifts from west to east. From the coast to the mountains, the semi-arid Middle Latitude Steppe climate transitions to a hot–mild Mediterranean climate, with both regions experiencing warm–hot, dry, and sunny summers and cooler, wetter winters. Precipitation and temperature extremes increase from the beaches and lower elevations in the west to the mountains in the central-east part of the county, which receive frost and snow during winter. The mountains receive more rainfall than average in Southern California, while the county’s desert region in the east lies in a rain shadow that extends into the Desert Southwest region of North America. Average annual rainfall amounts typically vary, with the county’s coastal areas receiving 250 mm, the mountain peaks receiving over 800 mm, and the low desert areas often receiving less than 150 mm of rain [32]. Approximately 85% of all rainfall in the county happens between November and March [33] (Figure 2). Temperatures and temperature ranges can also vary considerably between microclimates and often short distances (15–30 °C difference) in the county [33].
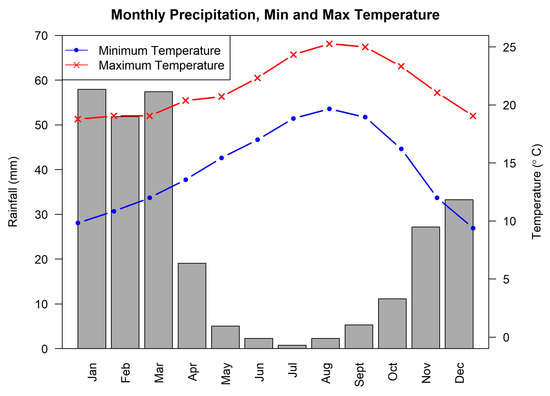
Figure 2.
Average monthly rainfall and temperature in San Diego County (1985–2017).
Despite San Diego County’s large urban population, agriculture and farming remain an important part of the economy, with roughly 9% of the county’s total area (980 km2) dedicated to commercial agriculture [34]. Of San Diego County’s 6690 farms—the most of any county in the United States [35]—68% are between 0.4–4 ha in size [36], with the median farm size being 2 ha [35]. Important agricultural operations include indoor flower and plant and ornamental tree and shrub nurseries, situated primarily in the rural backcountry areas east and north of the urbanized coastal region; avocado and citrus orchards nestled in the foothills and shelterbelts of the mountains; and sprawling palm farms in the desert [34].
2.2. Data Used
Daily rainfall, maximum, and minimum temperature data from stations within the County of San Diego were extracted for a period of 33 years (January 1985 to December 2017) from the National Oceanic and Atmospheric Administration (NOAA) database. Twenty rainfall observation stations, with continuous time daily data and gaps not longer than three days at a time, especially for the temperature data, covering all micro-climate zones in the county, were utilized for this analysis (Figure 2; Table 1). Daily rainfall values were compiled into total annual and seasonal time series, while means for annual and seasonal temperatures were used for the analysis. As mentioned earlier, San Diego County has two seasons, rainy (November–April) and dry (May–October), which were used for seasonal analysis.

Table 1.
Description of rainfall and temperature observation stations used in the study. [a] Stations excluded from both minimum and maximum temperature analysis and [b] stations excluded from maximum temperature analysis only; 20 stations were used for rainfall, 17 stations for minimum temperature, and 16 stations for maximum temperature analysis; (m a.s.l) denotes mean at sea level; C stands for Coastal, D for Desert, and M for Mountainous regions.
2.3. Methods
Annual and seasonal temporal trends in rainfall, minimum, and maximum temperature were determined using the modified non-parametric Mann-Kendall test (MK) [37,38]. Magnitudes of these trends were also estimated with the Theil-Sen slope estimator (TSE) [39,40].
The modified MK test is commonly used in long-term hydrological trend assessment studies on account of its robustness against inherent outliers, autocorrelation, and non-normal distribution in a dataset [37,38]. The test is very reliable for detecting monotonic trends in environmental time series data [37,38].
For a time series of X1, X2, X3, …, Xn, the MK test statistic (S) is calculated as [5,41,42]:
where Xi and Xj represent sequential datapoints, n is the length of the dataset, and
where (Xj − Xi) represents the difference between two sequential datapoints. The null hypothesis H0 of no trend is rejected with a p-value less than the significance level or if the calculated Z-statistic is larger than the critical value of the Z-value obtained from the normal distribution table. This study used a 10% significance level. The variance of S is calculated as (e.g., [37,38,41]):
The modified MK trend test statistic Z is given by
where the sign of S gives the direction of the trend. A negative sign indicates a decreasing trend, while a positive value indicates an increasing trend. The modified variance of S denoted by V(S)′ is computed as [5,38,41,43]:
and
where ri is the lag-i significant autocorrelation coefficient of a datapoint with rank i in the time series dataset. The autocorrelation coefficient is calculated as (e.g., [5,38,41,43]):
Since the MK statistic (S) does not indicate the magnitude of the slope, the TSE was used to determine the trend magnitude as [39,40]:
where β is the median for all possible combinations of pairs of any two datapoints in the entire time series dataset. Xi and Xj are the sequential datapoints, where i < j.
3. Results
3.1. Trends in Rainfall
Annual and seasonal spatial rainfall distribution over the county held a similar pattern among all three temporal scales used for the analysis. Long-term mean rainfall within San Diego County ranged from 720 mm in the mountainous areas (east of the Santa Margarita watershed and northeast of the San Diego watershed) to 130 mm in the desert (San Felipe Creek watershed) during the study period (1985–2017) (Table 2). From the 20 rainfall measurement stations analyzed, only one in the southwest of the county showed a statistically significant upward trend (0.5 mm increase over the study period) (Table 2; Figure 3). The remaining 19 stations showed slightly decreased rainfall with a magnitude of 0.18 mm on average) between 1985 and 2017 (Table 2; Figure 3). Data at the remaining stations suggest overall decreasing rainfall in the county with a statistically significant decreasing trend at one only station (Figure 3; Figure 4; Appendix A).

Table 2.
Mean annual rainfall (mm), MK Z statistic, Sen’s slope, and change (mm) of mean annual rainfall during the 1985–2017 period (statistically significant values at 10% significance levels are shaded). The dry season (summer) spans from May to October and the rainy season (winter) spans from November to April. C stands for Coastal; D for Desert, and M for Mountainous regions.
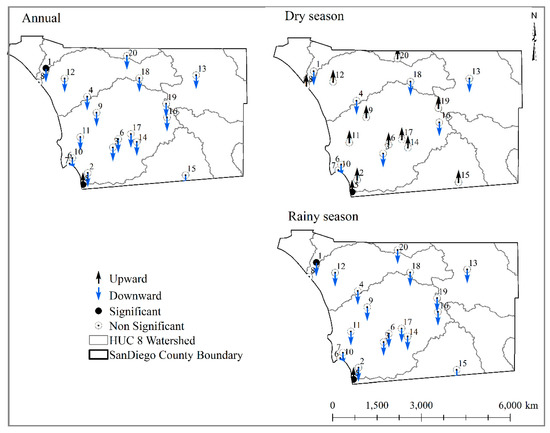
Figure 3.
Mean annual and seasonal rainfall trends from 1985 to 2017 in San Diego County. Dry season (summer) spans from May to October and the rainy season (winter) spans from November to April.
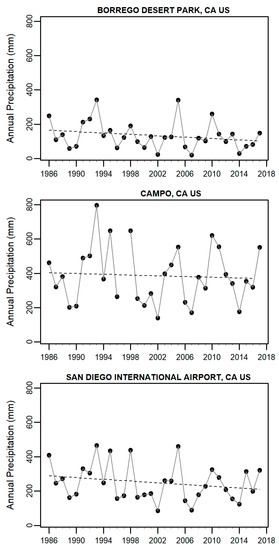
Figure 4.
Annual rainfall time series (1985–2017) and corresponding interpolated regression lines for three rain gauges located respectively from top to bottom in the northeastern, central, and southwestern (City of San Diego) regions of San Diego County.
The seasonal analysis revealed similar spatial patterns for the trend in rainy months compared to annual trend characteristics (Figure 3). Since most rain events occur during the rainy season, it is expected that annual trends were mostly driven by the rainfall events of this period. With only one station showing statistically significant downward trends (Table 2; Figure 3), rainfall during the rainy season averaged 0.19 mm (from 100 mm to 620 mm) over the study period, with downward trends for the majority of stations examined corresponding to a magnitude of 0.01 mm to 0.43 mm for stations (Table 2; Figure 3 and Figure 4). Unlike trend characteristics during the rainy season, rainfall during the dry season showed slight upward trends with an average of 0.09 mm (>0.00 to 0.50 mm) in 12 out of 20 stations during the study period (Table 2; Figure 3), suggesting a possible shift in rainfall patterns in the region. The station with statistically significant increasing trends was located in the Imperial Beach area (Figure 3), which receives frequent and abundant rainfall events compared to the rest of the county. This may be attributable to a combination of the area’s coastal micro-climate and the effects of local topographic features on weather patterns: sea surface evaporation could create excess moisture along the coast while orographic blocking by the rapid increase in slope of the nearby Tijuana Hills and San Ysidro and Jamul Mountains could lead to increased precipitation during rainfall events [44].
3.2. Trends in Temperature
Mean annual minimum and maximum temperatures ranged from 4 to 15 °C and 18 to 30 °C, respectively, increasing gradually from the county’s western (coastal) region to the eastern (desert) region. Minimum and maximum temperatures—defined as lowest and highest daily temperatures—showed statistically significant upward trends on an annual basis at 8 out of 17 for minimum and 5 of 16 maximum temperature measurement stations examined. The temperatures at all other stations also appear to increase, except at three locations (Figure 5, Figure 6 and Figure 7; Table 3; Table 4; Appendix A). The magnitude of the upward trends varied from 0.01 °C to 0.22 °C (1.0 to 22%) with an average of 0.07 °C for minimum temperature, and from 0.02 °C to 0.55 °C (0.40 to 14%) with an average of 0.25 °C for maximum temperature over the study period (Figure 5, Figure 6 and Figure 7; Table 3 and Table 4). The data suggest that minimum temperature increased more rapidly than maximum temperature over the study period.
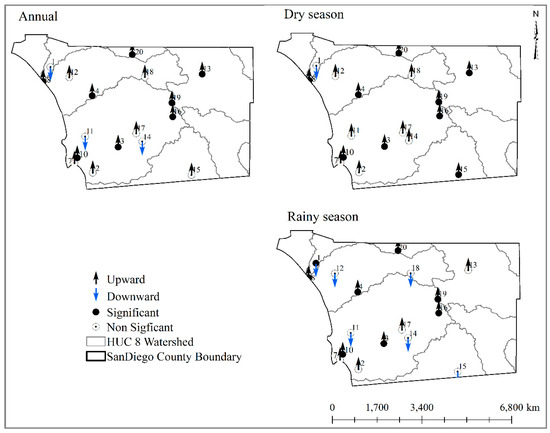
Figure 5.
Mean annual and seasonal minimum temperature trends from 1985 to 2017 in San Diego County. The dry season (summer) spans from May to October and the rainy season (winter) spans from November to April.
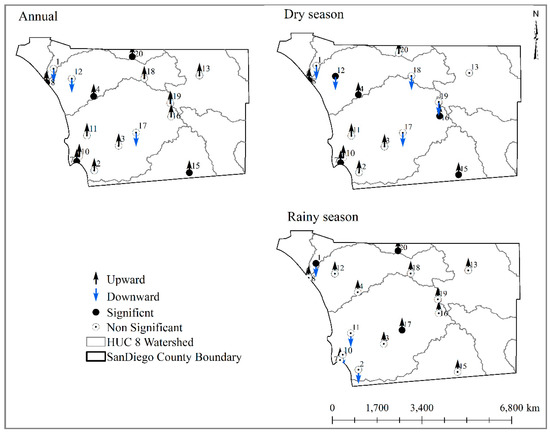
Figure 6.
Mean annual and seasonal maximum temperature trends from 1985 to 2017 in San Diego County. The dry season (summer) spans from May to October and the rainy season (winter) spans from November to April.
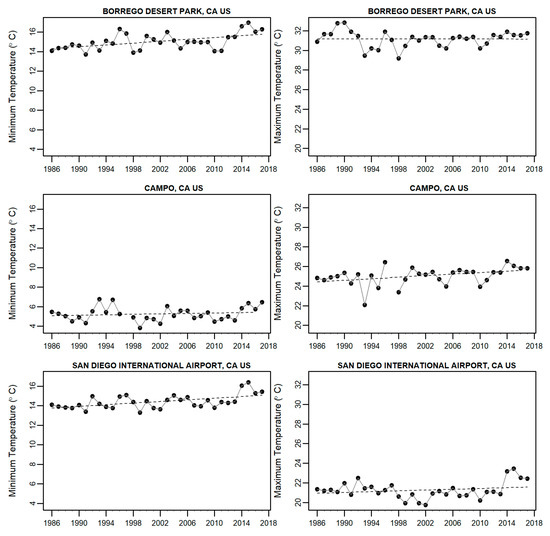
Figure 7.
Mean annual temperature time series (1985–2017) and corresponding interpolated regression lines for three rain gauges located respectively, from top to bottom, in the northeastern, central, and southwestern (City of San Diego) regions of San Diego County.

Table 3.
Mean temperature (°C), MK Z statistic, Sen’s slope, and change (°C) of minimum temperature during the 1985–2017 period (statistically significant values at 10% significance levels are shaded). The dry season (summer) spans from May to October and the rainy season (winter) spans from November to April. C stands for Coastal; D for Desert, and M for Mountainous regions. Stations 5, 6, and 9 were not used for minimum temperature analysis because of missing or erroneous data.

Table 4.
Mean temperature (°C), MK Z statistic, Sen’s slope, and change (° C) of maximum temperature during the 1985–2017 period (statistically significant values at 10% significance levels are shaded). The dry season (summer) spans from May to October and the rainy season (winter) spans from November to April. C stands for Coastal; D for Desert, and M for Mountainous regions. Stations 5, 6, 9, and 14 were not used for maximum temperature analysis because of missing or erroneous data.
The seasonal analysis also revealed similar upward trends in a majority of the observation stations examined (9 of 17 were statistically significant for minimum temperature and 6 of 16 for maximum temperature). A common trend was that, whether in dry or rainy seasons, the data revealed temperature increases in the county (1985 to 2017), with overall dry season temperatures increasing more compared to that of the rainy season (Figure 5, Figure 6 and Figure 7), indicating hotter temperatures during the dry season. The mean seasonal minimum temperature increased by 0.01 °C to 0.22 °C (1%–22%) for the annual period, 0.01 °C to 0.15 °C (2% to 25%) for the dry season, and >0.00 °C to 0.14 °C (1%−31%) for the rainy season with respective averages of 0.07 °C, 0.04 °C, and 0.04 °C. Downward trends in minimum temperature occurred primarily during the rainy season at some stations (Figure 5; Table 3 and Table 4). The analysis estimated an increase of 0.27 °C and 0.23 °C ranging from 0.03 °C to 0.56 °C (0.08% to 15%) for maximum temperature during the dry season and ranging from 0.01 °C to 0.06 °C (0.40% to 19%) during the rainy season, respectively (Figure 6). The annual maximum temperature increased by 0.02 °C to 0.55 °C (0.40% to 14%) (Table 3 and Table 4).
4. Discussion
Although the attribution of the study’s observed trends to possible causes was beyond the scope of this study, research has linked past droughts in California—including the most recent drought event (i.e., 2012–2014)—to reduced rainfall and record-high temperatures [7]. While the reduced rainfall pattern is within the range of natural variability, [7,45] explained that the extremely high temperatures recorded during the 2012–2014 drought may have been exacerbated by human-induced global warming. This is consistent with findings in the present study, where out of the 20 rainfall stations examined, only two stations showed statistically significant decreasing trends (Figure 5; Table 3), indicating that rainfall amounts in the San Diego region remained relatively similar during the study period and may remain as such in coming decades [46]. Unlike rainfall trends, maximum and minimum temperatures in Southern California show increased deviations from the normal [45,47,48,49]. Williams et al. (2015) [45] demonstrated that precipitation is the prime driver of California drought with 8%–27% of the observed drought anomaly attributed to human-induced warming in 2012–2014 and 5%–18% in 2014. In addition, rainfall and temperature patterns in Southern California are highly influenced by coastal microclimates. This suggests the importance of understanding changes in rainfall and temperature characteristics and how they relate to climate phenomena such as La Niña and El Niño Southern Oscillations at local levels for effective planning of water supply systems [50].
San Diego County imports roughly 80% of its water supply. The remaining 20% is dependent on local water sources, with only 10% supplied by direct rainfall. Major investments in water infrastructure and water use efficiency projects are intended to increase local supply sources by means of diversification. The San Diego County Water Authority aims to achieve an aggressive diversification of the region’s water supply portfolio by developing local supplies such as groundwater, recycled water, seawater desalination, and conservation practices [51]. Changes in rainfall input and patterns would affect the availability and ability of the aforementioned 20% of San Diego County’s water supply to meet agricultural, residential, commercial, and industrial water demands. Although the present study did not see any documentable patterns in rainfall and temperatures across the specific climate types, as presented in the Introduction, the analysis reveals an overall decreasing rainfall trend over the study period, which was reflected de facto in water availability in streams and rivers in the county (data and analysis not shown here). The decreasing rainfall input explains the long-standing drought that officially ended with the lifting of the drought emergency in April 2017 [24,45]. Even though 2019 brought abundant rainfall to the region, research has shown that prolonged and chronic droughts are frequent in Southern California (MacDonald et al. 2008). Decreases in rainfall would affect groundwater recharge and water supply, regardless of the level of conservation adopted. As rainfall decreases, pollutant buildup increases, eventually resulting in water quality deterioration, especially during first rainfall events [52,53]. Abnormally limited rainfall can cause harm to local flora and fauna through reduced environmental flows [54,55].
The urban population in San Diego County continues to increase, leading to an expansion in urban areas. While the expansion of urban land use without sound water management measures would result in increased runoff, there are currently no known ambitious community projects in the San Diego region to capture the excess runoff produced during abundant incident rainfalls. Runoff events are often considered to be hazards (e.g., they produce flooding) instead of resources. Unreliable rainfall events, coupled with the expansion of urban areas and a changing climate, point to uncertainty in the future of water supply in San Diego County. In addition, the continued reliance on water imports places rigid financial burdens on urban and agricultural water users. The decreasing rainfall trend would equally affect all sectors (urban, agricultural, etc.) through the rising cost of water, and this would lead inevitably to negative economic ramifications and challenges—such as the incentivization of selling of water to one sector over another—in regards to continuously balancing urban and agricultural water needs.
For proactive and long-term water management plans in dry climates to succeed, all sectors, including environmental requirements, must be considered. Continued sustainable planning, investment in research, prompt and responsive policies, and public education and outreach are necessary for adapting to the stress of future climate change in Southern California’s limited rainfall environment.
5. Conclusions
This study presented a case study of annual and seasonal rainfall and temperature time series to determine trends and their significance from 1985 to 2017 in San Diego County. Important conclusions from this study include:
- Annual rainfall generally decreased in the county (16 out of 20 rain gauge stations) even though the trends were not statistically significant; only two stations showed statistically significant trends. Trends in rainfall during the rainy season were reflected in annual trends, while rainfall during the dry season tended to increase in 12 out of 20 stations, suggesting that the dry season received more rainfall than normal over the study period.
- Annual minimum and maximum temperatures showed mostly upward trends with a magnitude of 0.05 °C and 0.25 °C increase between 1985 and 2017. Analysis of seasonal data also revealed that temperature increased more during the dry season compared to that of the rainy season (Figure 6 and Figure 7), indicating hotter days during the dry season. The mean seasonal minimum temperature significantly increased by 0.07 °C for the annual period, 0.04 °C for the dry season, and 0.04 °C for the rainy season (about 9 of 17 stations showed statistically significant trends). Downward trends in minimum temperature occurred primarily during the rainy season at some stations (Figure 5; Figure 6). The analysis estimated a statistically significant increase of 0.36 °C for maximum temperature on the annual basis, 0.33 °C for the dry season, and 0.34 °C for the rainy season (7 of 16 stations showed statistically significant trends) (Figure 7). Few stations revealed average decreases of 0.14 °C and 0.12 °C for the dry and rainy seasons (1 of 18 stations showed statistically significant trends) (Table 3 and Table 4).
The trends presented in this study may have resulted from possible climate or anthropogenic activities or the combination of both. While this study did not attempt to determine the possible causes of the decreasing rainfall trends that were observed, the information provided herein should prove useful to the region’s water research information system and should support further investigation into the impacts of climate change and anthropogenic activities on hydrological processes in Southern California. As the population continues to increase in Southern California, analyses of rainfall and temperature trends at local levels will inform support planning and management of water resources.
Author Contributions
L.A. conceived the study and supervised the work. He wrote the first draft and edited the paper. E.M. completed all the statistical analyses, maps, and assisted with writing the first draft of the manuscript. F.L. was instrumental in compiling the datasets used for the analyses. He also edited the paper. F.D. provided R programming support for data analysis and completed, together with Esther Mosase, the statistical analyses. He completed all the graphs as shown in the manuscript.
Funding
The authors thank the University of California Division of Agriculture and Natural Resources for providing financial support for this study.
Conflicts of Interest
The authors declare no conflict of interest. The funders had no role in the design of the study; in the collection, analyses, or interpretation of data; in the writing of the manuscript, or in the decision to publish the results.
Appendix A
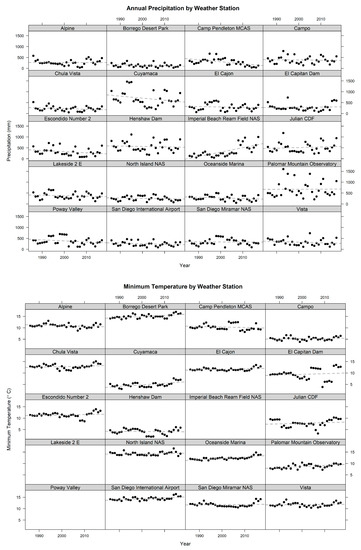
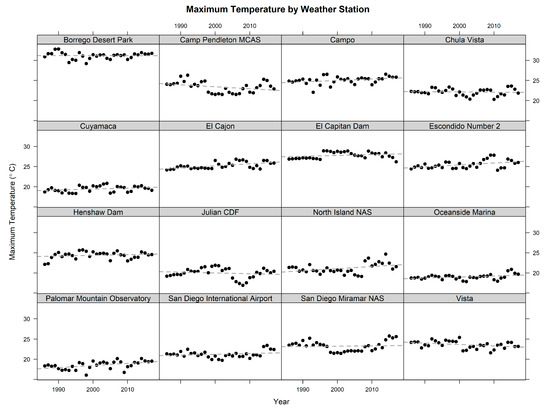
Figure A1.
Annual rainfall and temperature (minimum, maximum) time series and corresponding regression lines in San Diego region from 1985 to 2017.
References
- Tissue, D.; Leffler, A.J.; Ogle, K.; Schwinning, S.; Pockman, W.T.; Huxman, T.E.; Snyder, K.A.; Pockman, W.T.; Sandquist, D.R.; Potts, D.L.; et al. Precipitation pulses and carbon fluxes in semiarid and arid ecosystems. Oecologia 2004, 141, 254–268. [Google Scholar]
- Scanlon, B.R.; Keese, K.E.; Flint, A.L.; Flint, L.E.; Gaye, C.B.; Edmunds, W.M.; Simmers, I. Global synthesis of groundwater recharge in semiarid and arid regions. Hydrol. Process. 2006, 20, 3335–3370. [Google Scholar] [CrossRef]
- Schwinning, S.; Sala, O.; Sala, O.E. Hierarchy of responses to resource pulses in arid and semi-arid ecosystems. Oecologia 2004, 141, 211–220. [Google Scholar] [CrossRef] [PubMed]
- Macdonald, G.M. Severe and sustained drought in southern California and the West: Present conditions and insights from the past on causes and impacts. Quat. Int. 2007, 173, 87–100. [Google Scholar] [CrossRef]
- Mosase, E.; Ahiablame, L. Rainfall and Temperature in the Limpopo River Basin, Southern Africa: Means, Variations, and Trends from 1979 to 2013. Water 2018, 10, 364. [Google Scholar] [CrossRef]
- Macdonald, G.M.; Kremenetski, K.V.; Hidalgo, H.G. Southern California and the perfect drought: Simultaneous prolonged drought in southern California and the Sacramento and Colorado River systems. Quat. Int. 2008, 188, 11–23. [Google Scholar] [CrossRef]
- Griffin, D.; Anchukaitis, K.J. How unusual is the 2012–2014 California drought? Geophys. Res. Lett. 2014, 41, 9017–9023. [Google Scholar] [CrossRef]
- Robeson, S.M. Revisiting the recent California drought as an extreme value. Geophys. Res. Lett. 2015, 42, 6771–6779. [Google Scholar] [CrossRef]
- Lund, J.; Medellin-Azuara, J.; Durand, J.; Stone, K. Lessons from California’s 2012–2016 Drought. J. Water Resour. Plan. Manag. 2018, 144, 04018067. [Google Scholar] [CrossRef]
- Ault, T.R.; George, S.S. The Magnitude of Decadal and Multidecadal Variability in North American Precipitation. J. Clim. 2010, 23, 842–850. [Google Scholar] [CrossRef]
- Cayan, D.R.; Dettinger, M.D.; Díaz, H.F.; Graham, N.E. Decadal Variability of Precipitation over Western North America. J. Clim. 1998, 11, 3148–3166. [Google Scholar] [CrossRef]
- Cayan, D.R.; Das, T.; Pierce, D.W.; Barnett, T.P.; Tyree, M.; Gershunov, A. Future dryness in the southwest us and the hydrology of the early 21st century drought. Proc. Natl. Acad. Sci. USA 2010, 107, 21271–21276. [Google Scholar] [CrossRef]
- Dettinger, M.D.; Battisti, D.S.; Garreaud, R.D.; McCabe, G.; Bitz, C.M. Interhemispheric Effects of Interannual and Decadal ENSO-Like Climate Variations on the Americas. In Interhemispheric Climate Linkages; Elsevier BV: Amsterdam, The Netherlands, 2001; pp. 1–16. [Google Scholar]
- Schonher, T.; Nicholson, S.E. The Relationship between California Rainfall and ENSO Events. J. Clim. 1989, 2, 1258–1269. [Google Scholar] [CrossRef]
- Swain, D.L.; Tsiang, M.; Haugen, M.; Singh, D.; Charland, A.; Rajaratnam, B.; Diffenbaugh, N.S. The extraordinary california drought of 2013/2014: Character, context, and the role of climate change. Bull. Am. Meteorol. Soc. 2014, 95, S3–S7. [Google Scholar]
- Noe, G.B.; Zedler, J.B. Variable Rainfall Limits the Germination of Upper Intertidal Marsh Plants in Southern California. Estuaries 2001, 24, 30. [Google Scholar] [CrossRef]
- AghaKouchak, A.; Feldman, D.; Hoerling, M.; Huxman, T.; Lund, J. Water and climate: Recognize anthropogenic drought. Nat. News 2015, 524, 409–411. [Google Scholar] [CrossRef]
- Lovich, J.E.; Bainbridge, D. Anthropogenic Degradation of the Southern California Desert Ecosystem and Prospects for Natural Recovery and Restoration. Environ. Manag. 1999, 24, 309–326. [Google Scholar] [CrossRef]
- Barnett, T.P.; Pierce, D.W.; Hidalgo, H.G.; Bonfils, C.; Santer, B.D.; Das, T.; Bala, G.; Wood, A.W.; Nozawa, T.; Mirin, A.A.; et al. Human-Induced Changes in the Hydrology of the Western United States. Science 2008, 319, 1080–1083. [Google Scholar] [CrossRef]
- Syphard, A.D.; Clarke, K.C.; Franklin, J. Simulating fire frequency and urban growth in southern california coastal shrublands, USA. Landsc. Ecol. 2007, 22, 431–445. [Google Scholar] [CrossRef]
- He, M.; Gautam, M. Variability and Trends in Precipitation, Temperature and Drought Indices in the State of California. Hydrology 2016, 3, 14. [Google Scholar] [CrossRef]
- Wang, S.-Y.; Hipps, L.; Gillies, R.R.; Yoon, J.-H. Probable causes of the abnormal ridge accompanying the 2013–2014 California drought: ENSO precursor and anthropogenic warming footprint. Geophys. Res. Lett. 2014, 41, 3220–3226. [Google Scholar] [CrossRef]
- Kiparsky, M.; Milman, A.; Owen, D.; Fisher, A.T. The Importance of Institutional Design for Distributed Local-Level Governance of Groundwater: The Case of California’s Sustainable Groundwater Management Act. Water 2017, 9, 755. [Google Scholar] [CrossRef]
- SDCWA. San Diego County Water Authority. Available online: https://www.Sdcwa.Org/water-supplies (accessed on 10 January 2019).
- SANDAG. San Diego Forward: The Region Plan. Sandag. Available online: Http://www.Sdforward.Com/pdfs/final_pdfs/the_plan_combined.Pdf (accessed on 19 December 2018).
- SANDAG. Fast Facts: San Diego Region. SANDAG. Available online: Https://www.Sandag.Org/resources/demographics_and_other_data/demographics/fastfacts/regi.Htm (accessed on 19 December 2018).
- HHSA. Geography. San Diego County Health & Human Services Agency: County of San Diego. Available online: Https://www.Sandiegocounty.Gov/hhsa/statistics_geography.Html (accessed on 19 December 2018).
- NACo. National Association of Counties “Find a County”. 2013. Available online: https://ce.naco.org (accessed on 7 June 2018).
- SANDAG. San Diego’s Regional Planning Agency; Demographics in the San Diego Region. Available online: https://www.Sandag.Org/uploads/publicationid/publicationid_2001_20213.Pdf (accessed on 19 December 2018).
- CIA. Central Intelligence Agency. 2001. Available online: https://www.Cia.Gov/library/readingroom/docs/cia-rdp78b04747a001000020019-6.Pdf (accessed on 19 December 2018).
- Kochel, R.C.; Miller, J.R.; Ritter, D.F. Geomorphic response to minor cyclic climate changes, San Diego County, California. Geomorphology 1997, 19, 277–302. [Google Scholar] [CrossRef]
- Sandiegocounty.gov. San Diego County Rainfall-30 Year Annual Average Period of Record. 1971–2001. Available online: https://www.Sandiegocounty.Gov/content/dam/sdc/dpw/flood_control/floodcontroldocuments/average%20annual%20rainfall.Pdf (accessed on 19 December 2018).
- Isla, E.; Vanderburg, S.; Medjber, C.; Paschall, D. Climate of San Diego, California. Noaa Technical Memorandum Nws wr-275; NOAA: USA, 2004. Available online: Ftp://ftp.Library.Noaa.Gov/noaa_documents.Lib/nws/nws_wr/tm_nws_wr_270.Pdf (accessed on 19 December 2018).
- AWM. Department of Agriculture Weights and Measures, County of San Diego, Crops Statistics and Annual Report. Available online: https://www.Sandiegocounty.Gov/content/dam/sdc/awm/docs/awm_2017_crop_report.Pdf (accessed on 19 December 2018).
- AWM. Department of Agriculture Weights and Measures, County of San Diego, Crops Statistics and Annual Report. Available online: Https://ucanr.Edu/sites/sdsmallfarms/files/271408.Pdf (accessed on 21 December 2018).
- Ellsworth, S.; Feenstra, G. Assessing the San Diego County Food System: Indicators for a More Food Secure Future; Sustainable Agriculture Research and Education Program, and Agricultural Sustainability Institute: Davis, CA, USA, 2010. [Google Scholar]
- Hamed, K.H. Trend detection in hydrologic data: The Mann–Kendall trend test under the scaling hypothesis. J. Hydrol. 2008, 349, 350–363. [Google Scholar] [CrossRef]
- Hamed, K.H.; Rao, A.R. A modified Mann-Kendall trend test for autocorrelated data. J. Hydrol. 1998, 204, 182–196. [Google Scholar] [CrossRef]
- Sen, P.K. Estimates of the regression coefficient based on kendall’s tau. J. Am. Stat. Assoc. 1968, 63, 1379–1389. [Google Scholar] [CrossRef]
- Thiel, H. A rank-invariant method of linear and polynomial regression analysis. Adv. Stud. Theor. Appl. Econom. 1950, 23, 345–381. [Google Scholar]
- Kumar, S.; Merwade, V.; Kam, J.; Thurner, K. Streamflow trends in Indiana: Effects of long term persistence, precipitation and subsurface drains. J. Hydrol. 2009, 374, 171–183. [Google Scholar] [CrossRef]
- Sagarika, S.; Kalra, A.; Ahmad, S. Evaluating the effect of persistence on long-term trends and analyzing step changes in streamflows of the continental United States. J. Hydrol. 2014, 517, 36–53. [Google Scholar] [CrossRef]
- Ahiablame, L.; Sheshukov, A.Y.; Rahmani, V.; Moriasi, D. Annual baseflow variations as influenced by climate variability and agricultural land use change in the Missouri River Basin. J. Hydrol. 2017, 551, 188–202. [Google Scholar] [CrossRef]
- Hughes, M.; Hall, A.; Fovell, R.G. Blocking in Areas of Complex Topography, and Its Influence on Rainfall Distribution. J. Atmos. Sci. 2009, 66, 508–518. [Google Scholar] [CrossRef]
- Williams, A.P.; Seager, R.; Abatzoglou, J.T.; Cook, B.I.; Smerdon, J.E.; Cook, E.R.; Williams, P. Contribution of anthropogenic warming to California drought during 2012–2014. Geophys. Res. Lett. 2015, 42, 6819–6828. [Google Scholar] [CrossRef]
- Messner, S.; Miranda, S.C.; Young, E.; Hedge, N. Climate change-related impacts in the San Diego region by 2050. Clim. Chang. 2011, 109, 505–531. [Google Scholar] [CrossRef]
- Cordero, E.C.; Kessomkiat, W.; Abatzoglou, J.; Mauget, S.A. The identification of distinct patterns in California temperature trends. Clim. Chang. 2011, 108, 357–382. [Google Scholar] [CrossRef]
- Kessomkiat, W. Analysis of California Surface Temperature Trends Based on Observations. Master’s Thesis, San José State University, San Jose, CA, USA, 2009. [Google Scholar]
- Reed, D.D. Historical Temperature Trends in Los Angeles County, California; University of Southern California: Los Angeles, CA, USA, 2015. [Google Scholar]
- Neelin, J.D.; Langenbrunner, B.; Meyerson, J.E.; Hall, A.; Berg, N. California Winter Precipitation Change under Global Warming in the Coupled Model Intercomparison Project Phase 5 Ensemble. J. Clim. 2013, 26, 6238–6256. [Google Scholar] [CrossRef]
- SDCWA. San Diego County Water Authority; Annual Report. Diversification and Conservation. Demand Forecasts Decline. Available online: https://www.Sdcwa.Org/annualreport/2018/diversification-conservation.Php (accessed on 10 January 2019).
- Ackerman, D.; Weisberg, S.B. Relationship between rainfall and beach bacterial concentrations on Santa Monica bay beaches. J. Water Health 2003, 1, 85–89. [Google Scholar] [CrossRef]
- Şen, Z. Global warming threat on water resources and environment: A review. Environ. Geol. 2009, 57, 321–329. [Google Scholar] [CrossRef]
- Biggs, B.J.F.; Nikora, V.I.; Snelder, T.H. Linking scales of flow variability to lotic ecosystem structure and function. River Res. Appl. 2005, 21, 283–298. [Google Scholar] [CrossRef]
- Noy-Meir, I. Desert Ecosystems: Environment and Producers. Annu. Rev. Ecol. Syst. 1973, 4, 25–51. [Google Scholar] [CrossRef]
© 2019 by the authors. Licensee MDPI, Basel, Switzerland. This article is an open access article distributed under the terms and conditions of the Creative Commons Attribution (CC BY) license (http://creativecommons.org/licenses/by/4.0/).