Journal Description
Remote Sensing
Remote Sensing
is an international, peer-reviewed, open access journal about the science and application of remote sensing technology, and is published semimonthly online by MDPI. The Remote Sensing Society of Japan (RSSJ) and the Japan Society of Photogrammetry and Remote Sensing (JSPRS) are affiliated with Remote Sensing, and their members receive a discount on the article processing charge.
- Open Access— free for readers, with article processing charges (APC) paid by authors or their institutions.
- High Visibility: indexed within Scopus, SCIE (Web of Science), Ei Compendex, PubAg, GeoRef, Astrophysics Data System, Inspec, dblp, and other databases.
- Journal Rank: JCR - Q1 (Geosciences, Multidisciplinary) / CiteScore - Q1 (General Earth and Planetary Sciences)
- Rapid Publication: manuscripts are peer-reviewed and a first decision is provided to authors approximately 24.9 days after submission; acceptance to publication is undertaken in 2.5 days (median values for papers published in this journal in the first half of 2025).
- Recognition of Reviewers: reviewers who provide timely, thorough peer-review reports receive vouchers entitling them to a discount on the APC of their next publication in any MDPI journal, in appreciation of the work done.
- Companion journal: Geomatics.
- Journal Cluster of Geospatial and Earth Sciences: Remote Sensing, Geosciences, Quaternary, Earth, Geographies, Geomatics and Fossil Studies.
Impact Factor:
4.1 (2024);
5-Year Impact Factor:
4.8 (2024)
Latest Articles
A System Error Self-Correction Target-Positioning Method in Video Satellite Observation
Remote Sens. 2025, 17(17), 2935; https://doi.org/10.3390/rs17172935 (registering DOI) - 23 Aug 2025
Abstract
Satellite-based target positioning is vital for applications like disaster relief and precision mapping. Practically, satellite errors, e.g., thermal deformation and attitude errors, lead to a mix of fixed and random errors in the measured line-of-sight angles, resulting in a decline in target-positioning accuracy.
[...] Read more.
Satellite-based target positioning is vital for applications like disaster relief and precision mapping. Practically, satellite errors, e.g., thermal deformation and attitude errors, lead to a mix of fixed and random errors in the measured line-of-sight angles, resulting in a decline in target-positioning accuracy. Motivated by this concern, this study introduces a systematic error self-correction target-positioning method under continuous observations using a single video satellite. After analyzing error sources and establishing an error-inclusive positioning model, we formulate a dimension-extended equation estimating both target position and fixed biases. Based on the equation, a projection transformation method is proposed to obtain the linearized estimation of unknown parameters first, and an iterative optimization method is then utilized to further refine the estimate. Compared with state-of-the-art algorithms, the proposed method can improve positioning accuracy by 98.70% in simulation scenarios with large fixed errors. Thus, the simulation and actual data calculation results demonstrate that, compared with state-of-the-art algorithms, the proposed algorithm effectively improves the target-positioning accuracy under non-ideal error conditions.
Full article
(This article belongs to the Section Satellite Missions for Earth and Planetary Exploration)
Open AccessArticle
Analysis of the Spatiotemporal Variation Characteristics and Driving Forces of Crops in the Yellow River Basin from 2000 to 2023
by
Chunhui Xu, Zongshun Tian, Yuefeng Lu, Zirui Yin and Zhixiu Du
Remote Sens. 2025, 17(17), 2934; https://doi.org/10.3390/rs17172934 (registering DOI) - 23 Aug 2025
Abstract
In the context of global climate change and growing food security challenges, this study provides a comprehensive analysis of the yields of three staple crops (wheat, corn and rice) in the Yellow River Basin of China, employing multiple quantitative analysis methods including the
[...] Read more.
In the context of global climate change and growing food security challenges, this study provides a comprehensive analysis of the yields of three staple crops (wheat, corn and rice) in the Yellow River Basin of China, employing multiple quantitative analysis methods including the Mann–Kendall trend test, center of gravity transfer model and hotspot analysis. Our research integrates yield data covering these three crops from 72 prefecture-level cities across the Yellow River Basin, during 2000 to 2023, to systematically examine the temporal variation, spatial variation and spatial agglomeration characteristics of the yields. The study uses GeoDetector to explore the impacts of natural and socioeconomic factors on changes in crop yields from both single-factor and interactive-factor perspectives. While traditional statistical methods often struggle to simultaneously handle complex causal relationships among multiple factors, particularly in effectively distinguishing between direct and indirect influence paths or accounting for the transmission effects of factors through mediating variables, this study adopts Structural Equation Modeling (SEM) to identify which factors directly affect crop yields and which exert indirect effects through other factors. This approach enables us to elucidate the path relationships and underlying mechanisms governing crop yields, thereby revealing the direct and indirect influences among multiple factors. This study conducted an analysis using Structural Equation Modeling (SEM), classifying the intensity of influence based on the absolute value of the impact factor (with >0.3 defined as “strong”, 0.1–0.3 as “moderate” and <0.1 as “weak”), and distinguishing the nature of influence by the positive or negative value (positive values indicate promotion, negative values indicate inhibition). The results show that among natural factors, temperature has a moderate promoting effect on wheat (0.21) and a moderate inhibiting effect on corn (−0.25); precipitation has a moderate inhibiting effect on wheat (−0.28) and a moderate promoting effect on rice (0.17); DEM has a strong inhibiting effect on wheat (−0.33) and corn (−0.58), and a strong promoting effect on rice (0.38); slope has a moderate inhibiting effect on wheat (−0.15) and a moderate promoting effect on corn (0.15). Among socioeconomic factors, GDP has a weak promoting effect on wheat (0.01) and a moderate inhibiting effect on rice (−0.20), while the impact of population is relatively small. In terms of indirect effects, slope indirectly inhibits wheat (−0.051, weak) and promotes corn (0.149, moderate) through its influence on temperature; DEM indirectly promotes rice (0.236, moderate) through its influence on GDP and precipitation. In terms of interaction effects, the synergy between precipitation and temperature has the highest explanatory power for wheat and rice, while the synergy between DEM and precipitation has the strongest explanatory power for corn. The study further analyzes the mechanisms of direct and indirect interactions among various factors and finds that there are significant temporal and spatial differences in crop yields in the Yellow River Basin, with natural factors playing a leading role and socioeconomic factors showing dynamic regulatory effects. These findings provide valuable insights for sustainable agricultural development and food security policy-making in the region.
Full article
(This article belongs to the Special Issue Ground, Proximal and Remote Sensing for Precision Agriculture Applications)
Open AccessArticle
Navigating the Storm: Assessing the Impact of Geomagnetic Disturbances on Low-Cost GNSS Permanent Stations
by
Milad Bagheri and Paolo Dabove
Remote Sens. 2025, 17(17), 2933; https://doi.org/10.3390/rs17172933 (registering DOI) - 23 Aug 2025
Abstract
As contemporary society and the global economy become increasingly dependent on satellite-based systems, the need for reliable and resilient positioning, navigation, and timing (PNT) services has never been more critical. This study investigates the impact of the geomagnetic storm that occurred in May
[...] Read more.
As contemporary society and the global economy become increasingly dependent on satellite-based systems, the need for reliable and resilient positioning, navigation, and timing (PNT) services has never been more critical. This study investigates the impact of the geomagnetic storm that occurred in May 2024 on the performance of global navigation satellite system (GNSS) low-cost permanent stations. The research evaluates the influence of ionospheric disturbances on both positioning performance and raw GNSS observations. Two days were analyzed: 8 May 2024 (DOY 129), representing quiet ionospheric conditions, and 11 May 2024 (DOY 132), coinciding with the peak of the geomagnetic storm. Precise Point Positioning (PPP) and static relative positioning techniques were applied to data from a low-cost GNSS station (DYVA), supported by comparative analysis using a nearby geodetic-grade station (TRDS00NOR). The results showed that while RMS positioning errors remained relatively stable over 24 h, the maximum errors increased significantly during the storm, with the 3D positioning error nearly doubling on DOY 132. Short-term analysis revealed even larger disturbances, particularly in the vertical component, which reached up to 3.39 m. Relative positioning analysis confirmed the vulnerability of single-frequency (L1) solutions to ionospheric disturbances, whereas dual-frequency (L1+L2) configurations substantially mitigated errors, highlighting the effectiveness of ionosphere-free combinations during storm events. In the second phase, raw GNSS observation quality was assessed using detrended GPS L1 carrier-phase residuals and signal strength metrics. The analysis revealed increased phase instability and signal degradation on DOY 132, with visible cycle slips occurring between epochs 19 and 21. Furthermore, the average signal-to-noise ratio (SNR) decreased by approximately 13% for satellites in the northwest sky sector, and a 5% rise in total cycle slips was recorded compared with the quiet day. These indicators confirm the elevated measurement noise and signal disruption associated with geomagnetic activity. These findings provide a quantitative assessment of low-cost GNSS receiver performance under geomagnetic storm conditions. This study emphasizes their utility for densifying GNSS infrastructure, particularly in regions lacking access to geodetic-grade equipment, while also outlining the challenges posed by space weather.
Full article
(This article belongs to the Special Issue Geospatial Intelligence in Remote Sensing)
►▼
Show Figures
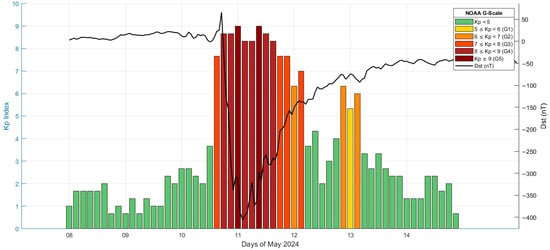
Figure 1
Open AccessArticle
High-Resolution Inversion of GOSAT-2 Retrievals for Sectoral Methane Emission Estimates During 2019–2022: A Consistency Analysis with GOSAT Inversion
by
Rajesh Janardanan, Shamil Maksyutov, Fenjuan Wang, Lorna Nayagam, Yukio Yoshida, Xin Lan and Tsuneo Matsunaga
Remote Sens. 2025, 17(17), 2932; https://doi.org/10.3390/rs17172932 (registering DOI) - 23 Aug 2025
Abstract
We employed a global high-resolution inverse model to estimate sectoral methane emissions, integrating observations from the GOSAT-2 satellite for the first time, along with observations from the surface observation network. A similar set of inversions using GOSAT observations was carried out to evaluate
[...] Read more.
We employed a global high-resolution inverse model to estimate sectoral methane emissions, integrating observations from the GOSAT-2 satellite for the first time, along with observations from the surface observation network. A similar set of inversions using GOSAT observations was carried out to evaluate the consistency between emissions estimates derived from these two satellites and to ensure that GOSAT-2 data could seamlessly integrate with the existing data series without disrupting the continuity of flux estimates. This analysis, covering the period from 2019 to 2022, utilized prior anthropogenic emissions data mainly from EDGAR v6 and incorporated additional natural sources and sinks as outlined by global methane budget, 2020. Our analysis reveals a general agreement between total methane emissions estimates from GOSAT and GOSAT-2. However, on a sectoral basis, we found notable regional differences in the flux estimates. While GOSAT inversion estimates ~8 Tg a−1 more anthropogenic emissions for China and around 4 Tg a−1 more wetland emissions for Brazil and Indonesia, the posterior error distribution suggests that GOSAT-2 inversion is closer to surface observations over Asia. These discrepancies are found in regions with significant differences in XCH4 data from the two satellites, such as East Asia and North America, tropical South America, and tropical Africa. These regional biases persist due to limited representative surface reference sites for Level 2 bias correction. The relatively lower data volume from GOSAT also introduces seasonal biases in the flux estimates when the quality filtering of Level 2 data persistently reduces usable observations during certain seasons, resulting in inadequate representation of the seasonal cycle in regions such as East Asia. Similarly, in tropical South America, where the model is relatively under-constrained by the limited surface observations, the lower data volume of GOSAT-2 suffers. While the two inversions exhibit consistent overall performance across North America and Europe, the GOSAT-2-based inversion demonstrates a better performance over East Asia. Therefore, while the two satellite datasets are broadly consistent, considering the fact that the biases in the XCH4 data overlap with regions under-constrained by surface observations, establishing additional surface reference measurement sites is desirable to ensure consistent inversion results.
Full article
(This article belongs to the Special Issue Quantifying Greenhouse Gases Emissions from Remote Sensing Perspective)
Open AccessArticle
Coarse-to-Fine Denoising for Micro-Pulse Photon-Counting LiDAR Data: A Multi-Stage Adaptive Framework
by
Zhaodong Chen, Chengdong Zhang, Xing Wang, Rongwei Fan, Zhiwei Dong, Lansong Cao and Deying Chen
Remote Sens. 2025, 17(17), 2931; https://doi.org/10.3390/rs17172931 (registering DOI) - 23 Aug 2025
Abstract
Micro-pulse photon-counting LiDAR has difficulty accurately extracting geophysical information in strong-noise environments, with solar noise interference being a key limiting factor. This study proposes a hierarchical coarse-to-fine denoising framework, combining grid-based pre-filtering with an optimized horizontal and vertical recursive division method using Otsu’s
[...] Read more.
Micro-pulse photon-counting LiDAR has difficulty accurately extracting geophysical information in strong-noise environments, with solar noise interference being a key limiting factor. This study proposes a hierarchical coarse-to-fine denoising framework, combining grid-based pre-filtering with an optimized horizontal and vertical recursive division method using Otsu’s method to achieve high time efficiency and denoising accuracy. First, an adaptive meshing strategy is employed to remove most of the noise in the data while retaining more than 99.1% of the signal. Subsequently, an alternating horizontal and vertical recursive division algorithm with automatically selected parameters is applied for denoising; the method was validated on ICESat-2 ATL03 data, GlobeLand30 V2020 data, and USGS 3DEP airborne radar data, where the method achieved a classification accuracy of more than 91.2%, with a several-fold reduction in runtime compared to traditional clustering methods. The framework demonstrates high efficiency, robustness, and computational scalability across diverse terrains, including polar, forest, and plains. It can contribute to geographic mapping, environmental protection, and ecological monitoring.
Full article
Open AccessArticle
Cascaded Hierarchical Attention with Adaptive Fusion for Visual Grounding in Remote Sensing
by
Huming Zhu, Tianqi Gao, Zhixian Li, Zhipeng Chen, Qiuming Li, Kongmiao Miao, Biao Hou and Licheng Jiao
Remote Sens. 2025, 17(17), 2930; https://doi.org/10.3390/rs17172930 (registering DOI) - 23 Aug 2025
Abstract
Visual grounding for remote sensing (RSVG) is the task of localizing the referred object in remote sensing (RS) images by parsing free-form language descriptions. However, RSVG faces the challenge of low detection accuracy due to unbalanced multi-scale grounding capabilities, where large objects have
[...] Read more.
Visual grounding for remote sensing (RSVG) is the task of localizing the referred object in remote sensing (RS) images by parsing free-form language descriptions. However, RSVG faces the challenge of low detection accuracy due to unbalanced multi-scale grounding capabilities, where large objects have more prominent grounding accuracy than small objects. Based on Faster R-CNN, we propose Faster R-CNN in Visual Grounding for Remote Sensing (FR-RSVG), a two-stage method for grounding RS objects. Building on this foundation, to enhance the ability to ground multi-scale objects, we propose Faster R-CNN with Adaptive Vision-Language Fusion (FR-AVLF), which introduces a layered Adaptive Vision-Language Fusion (AVLF) module. Specifically, this method can adaptively fuse deep or shallow visual features according to the input text (e.g., location-related or object characteristic descriptions), thereby optimizing semantic feature representation and improving grounding accuracy for objects of different scales. Given that RSVG is essentially an expanded form of RS object detection, and considering the knowledge the model acquired in prior RS object detection tasks, we propose Faster R-CNN with Adaptive Vision-Language Fusion Pretrained (FR-AVLFPRE). To further enhance model performance, we propose Faster R-CNN with Cascaded Hierarchical Attention Grounding and Multi-Level Adaptive Vision-Language Fusion Pretrained (FR-CHAGAVLFPRE), which introduces a cascaded hierarchical attention grounding mechanism, employs a more advanced language encoder, and improves upon AVLF by proposing Multi-Level AVLF, significantly improving localization accuracy in complex scenarios. Extensive experiments on the DIOR-RSVG dataset demonstrate that our model surpasses most existing advanced models. To validate the generalization capability of our model, we conducted zero-shot inference experiments on shared categories between DIOR-RSVG and both Complex Description DIOR-RSVG (DIOR-RSVG-C) and OPT-RSVG datasets, achieving performance superior to most existing models.
Full article
(This article belongs to the Section AI Remote Sensing)
Open AccessArticle
Mapping Soil Organic Matter in a Typical Black Soil Region Using Multi-Temporal Synthetic Images and Radar Indices Under Limited Bare Soil Windows
by
Wencai Zhang, Wenguang Chen, Zhenting Zhao, Liang Li, Ruqian Zhang, Dongheng Yao, Tingting Xie, Enyi Xie, Xiangbin Kong and Lisuo Ren
Remote Sens. 2025, 17(17), 2929; https://doi.org/10.3390/rs17172929 (registering DOI) - 23 Aug 2025
Abstract
Remote sensing technology provides an efficient and low-cost approach for acquiring large-scale soil information, offering notable advantages for soil organic matter (SOM) mapping. However, in recent years, the bare soil period of cultivated land in Northeast China has significantly shortened, posing serious challenges
[...] Read more.
Remote sensing technology provides an efficient and low-cost approach for acquiring large-scale soil information, offering notable advantages for soil organic matter (SOM) mapping. However, in recent years, the bare soil period of cultivated land in Northeast China has significantly shortened, posing serious challenges to traditional SOM prediction and mapping methods that rely on optical imagery. Meanwhile, current approaches that integrate optical imagery, radar imagery, and environmental covariates have yet to fully exploit the potential of remote sensing data in SOM mapping. To address this, this study focuses on the typical black soil region in Northeastern China, acquiring median synthetic images from different time periods (crop sowing, growing, and harvest stages) along with vegetation and radar indices. Six data groups were created by integrating environmental covariate data. Four machine learning models—XGBoost, BRT, ET, and RF—were used to analyze the SOM prediction accuracy of different groups. The group and model with the highest prediction accuracy were selected for SOM mapping in cultivated land. The results show that: (1) in the same model, incorporating radar images and their related indices significantly improves SOM prediction accuracy; (2) when using four machine learning models for SOM prediction, the RF model, which integrates optical images, radar images, vegetation indices, and radar indices from the crop sowing and growing periods, achieves the highest accuracy (R2 = 0.530, RMSE = 6.130, MAE = 4.822); (3) in the optimal SOM prediction model, temperature, precipitation, and elevation are relatively more important, with radar indices showing greater importance than vegetation indices; (4) uncertainty analysis and accuracy verification at the raster scale confirm that the SOM mapping results obtained in this study are highly reliable. This study made significant progress in SOM prediction and mapping by employing a radar–optical image fusion strategy combined with crop growth information. It helped address existing research gaps and provided new approaches and technical solutions for remote sensing-based SOM monitoring in regions with short bare soil periods.
Full article
(This article belongs to the Special Issue AI-Enhanced Remote Sensing and Land Surface Modeling for Terrestrial Hydrology and Climate Systems)
Open AccessTechnical Note
Integration of Convolutional Neural Networks and UAV-Derived DEM for the Automatic Classification of Benthic Habitats in Shallow Water Environments
by
Hassan Mohamed and Kazuo Nadaoka
Remote Sens. 2025, 17(17), 2928; https://doi.org/10.3390/rs17172928 (registering DOI) - 23 Aug 2025
Abstract
Benthic habitats are highly complex and diverse ecosystems that are increasingly threatened by human-induced stressors and the impacts of climate change. Therefore, accurate classification and mapping of these marine habitats are essential for effective monitoring and management. In recent years, Unmanned Aerial Vehicles
[...] Read more.
Benthic habitats are highly complex and diverse ecosystems that are increasingly threatened by human-induced stressors and the impacts of climate change. Therefore, accurate classification and mapping of these marine habitats are essential for effective monitoring and management. In recent years, Unmanned Aerial Vehicles (UAVs) have been increasingly used to expand the spatial coverage of surveys and to produce high-resolution imagery. These images can be processed using photogrammetry-based techniques to generate high-resolution digital elevation models (DEMs) and orthomosaics. In this study, we demonstrate that integrating descriptors extracted from pre-trained Convolutional Neural Networks (CNNs) with geomorphometric attributes derived from DEMs significantly enhances the accuracy of automatic benthic habitat classification. To assess this integration, we analyzed orthomosaics and DEMs generated from UAV imagery across three shallow reef zones along the Red Sea coast of Saudi Arabia. Furthermore, we tested various combinations of feature layers from pre-trained CNNs—including ResNet-50, VGG16, and AlexNet—together with several geomorphometric variables to evaluate classification accuracy. The results showed that features extracted from the ResNet-50 FC1000 layer, when combined with twelve geomorphometric attributes based on curvature, slope, the Topographic Ruggedness Index (TRI), and DEM-derived heights, achieved the highest overall accuracies. Moreover, training a Support Vector Machine (SVM) classifier using both pre-trained ResNet-50 features and geomorphometric variables led to an improvement in overall accuracy of up to 5%, compared to using ResNet-50 features alone. The proposed integration effectively improves the automation and accuracy of benthic habitat mapping processes.
Full article
(This article belongs to the Section Ocean Remote Sensing)
►▼
Show Figures
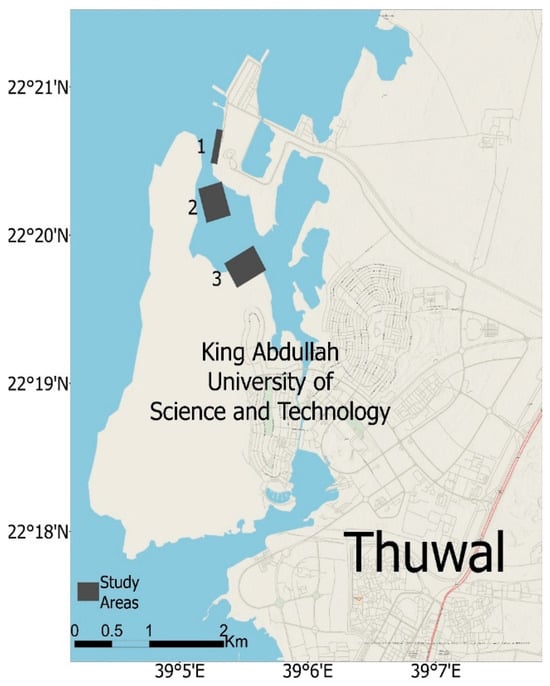
Figure 1
Open AccessArticle
Using Harmonized Landsat Sentinel-2 Vegetation Indices to Estimate Sowing and Harvest Dates for Corn and Soybeans in Brazil
by
Cleverton Tiago Carneiro de Santana, Marcos Adami, Victor Hugo Rohden Prudente, Andre Dalla Bernardina Garcia and Marcellus Marques Caldas
Remote Sens. 2025, 17(17), 2927; https://doi.org/10.3390/rs17172927 (registering DOI) - 23 Aug 2025
Abstract
As one of the world’s leading grain producers, Brazil stands out in soybean and corn production. Accurate estimation of key crop phenological stages is essential for agricultural decision-making, especially considering Brazil’s vast territory, climatic diversity, and increasing frequency of extreme weather events. This
[...] Read more.
As one of the world’s leading grain producers, Brazil stands out in soybean and corn production. Accurate estimation of key crop phenological stages is essential for agricultural decision-making, especially considering Brazil’s vast territory, climatic diversity, and increasing frequency of extreme weather events. This study investigated the applicability of the NDVI, EVI, WDRVI, and NDWI, derived from Harmonized Landsat Sentinel-2, to identify crop sowing and harvest dates at the field scale. We extracted the vegetative peak from each vegetation index time series and identified the left and right inflection points around the peak to delineate the crop season. A double-logistic function and a derivative approach were applied to identify the Start of Season, Peak of Season, and End of Season. For both soybeans and corn, the RMSE ranged from 5 to 8 days for sowing dates, while for harvest dates it ranged from 6 to 15 days for corn. Despite these differences, all vegetation indices exhibited robust performance, with Spearman correlation values between 0.56 and 0.84. Our findings indicate that the use of different indices does not have a significant impact on the results, as long as the adjustment of temporal parameters for the phenological metrics is appropriate for each index.
Full article
(This article belongs to the Special Issue Remote Sensing for Soil Moisture and Vegetation Parameters Retrieval (Second Edition))
►▼
Show Figures
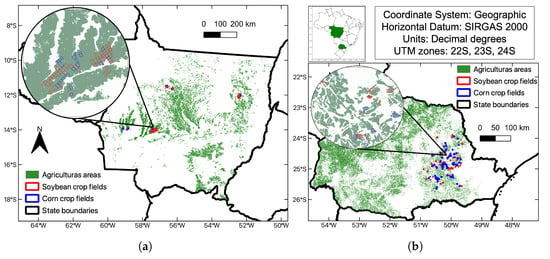
Figure 1
Open AccessArticle
Temporal and Spatial Characteristics of Thermal Discharge of Xiangshan Harbor (China) Power Plant Derived from Landsat Remote Sensing Data
by
Rong Tang, Zhongfeng Qiu, Lina Cai, Dongzhi Zhao and Chaofan Duan
Remote Sens. 2025, 17(17), 2926; https://doi.org/10.3390/rs17172926 - 22 Aug 2025
Abstract
The thermal discharge from coastal power plants exchanges heat with the surrounding marine environment, potentially affecting the aquatic ecosystem. This study utilizes Landsat-series satellite data from 2008 to 2023 to extract the spatiotemporal distribution characteristics of thermal discharges from the Xiangshan Harbor Guohua
[...] Read more.
The thermal discharge from coastal power plants exchanges heat with the surrounding marine environment, potentially affecting the aquatic ecosystem. This study utilizes Landsat-series satellite data from 2008 to 2023 to extract the spatiotemporal distribution characteristics of thermal discharges from the Xiangshan Harbor Guohua Power Plant (GPP) and the Wushashan Power Plant (WPP). Additionally, the study investigates the impact of thermal discharge on local aquatic life by examining the spatiotemporal distribution of chlorophyll-a (Chl-a). The results indicate that (1) the overall area of thermal rise in GPP and WPP shows a decreasing trend. The interannual variation in low thermal rise zones (+1 °C, +2 °C) is substantial, with significant seasonal differences mainly influenced by seasonal sea–air temperature differences, the flow velocity of seawater at the discharge outlet, and water depth. (2) The diffusion of thermal discharge is significantly affected by tides. The area of thermal rise is larger during ebb tide compared to flood tide, and during neap tide compared to mid-tide and spring tide. During the ebb tide of the neap tide period, the total area of thermal rise in WPP is approximately three times that of GPP. (3) There is a significant positive correlation between thermal discharge and concentrations of Chl-a. Thermal discharge has complex impacts on aquatic life, primarily positive. The findings of this study provide important references for analyzing the ecological impacts of thermal discharge from coastal power plants.
Full article
(This article belongs to the Section Ocean Remote Sensing)
Open AccessArticle
Mechanisms of Spatial Coupling Between Plantation Species Distribution and Historical Disturbance in the Complex Topography of Eastern Yunnan
by
Xiyu Zhang, Chao Zhang and Lianjin Fu
Remote Sens. 2025, 17(17), 2925; https://doi.org/10.3390/rs17172925 - 22 Aug 2025
Abstract
►▼
Show Figures
Forest disturbance is a major driver shaping the structure and function of plantation ecosystems. Current research predominantly focuses on single forest types or landscape scales. However, species-level fine-scale assessments of disturbance dynamics are still scarce. In this study, we investigated Chinese fir (
[...] Read more.
Forest disturbance is a major driver shaping the structure and function of plantation ecosystems. Current research predominantly focuses on single forest types or landscape scales. However, species-level fine-scale assessments of disturbance dynamics are still scarce. In this study, we investigated Chinese fir (Cunninghamia lanceolata), Armand pine (Pinus armandii), and Yunnan pine (Pinus yunnanensis) plantations in the mountainous eastern Yunnan Plateau. We developed a Spatial Coupling Framework of Disturbance Legacy (SC-DL) to systematically elucidate the spatial associations between contemporary species distribution patterns and historical disturbance regimes. Using the Google Earth Engine (GEE) platform, we reconstructed pixel-level disturbance trajectories by integrating long-term Landsat time series (1993–2024) and applying the LandTrendr algorithm. By fusing multi-source remote sensing features (Sentinel-1/2) with terrain factors, employing RFE, and performing a multi-model comparison, we generated 10 m-resolution species distribution maps for 2024. Spatial overlay analysis quantified the cumulative proportion of the historically disturbed area and the spatial aggregation patterns of historical disturbances within current species ranges. Key results include the following: (1) The model predicting disturbance year achieved high accuracy (R2 = 0.95, RMSE = 2.02 years, MAE = 1.15 years). The total disturbed area from 1993 to 2024 was 872.7 km2, exhibiting three distinct phases. (2) The random forest (RF) model outperformed other classifiers, achieving an overall accuracy (OA) of 95.17% and a Kappa coefficient (K) of 0.93. Elevation was identified as the most discriminative feature. (3) Significant spatial differentiation in disturbance types emerged: anthropogenic disturbances (e.g., logging and reforestation/afforestation) dominated (63.1% of total disturbed area), primarily concentrated within Chinese fir zones (constituting 70.2% of disturbances within this species’ range). Natural disturbances accounted for 36.9% of the total, with fire dominating within the Yunnan pine range (79.3% of natural disturbances in this zone) and drought prevailing in the Armand pine range (71.3% of natural disturbances in this zone). (4) Cumulative disturbance characteristics differed markedly among species zones: Chinese fir zones exhibited the highest cumulative proportion of disturbed area (42.6%), with strong spatial aggregation. Yunnan pine zones followed (36.5%), exhibiting disturbances linearly distributed along dry–hot valleys. Armand pine zones showed the lowest proportion (20.9%), characterized by sparse disturbances within fragmented, high-altitude habitats. These spatial patterns reflect the combined controls of topographic adaptation, management intensity, and environmental stress. Our findings establish a scientific basis for identifying disturbance-prone areas and inform the development of differentiated precision management strategies for plantations.
Full article
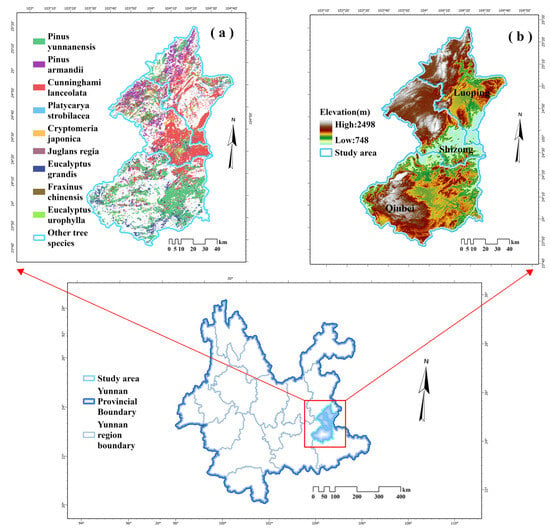
Figure 1
Open AccessArticle
Fast Protection Level for Precise Positioning Using PPP-RTK with Robust Adaptive Kalman Filter
by
Hassan Elsayed, Ahmed El-Mowafy, Amir Allahvirdi-Zadeh and Kan Wang
Remote Sens. 2025, 17(17), 2924; https://doi.org/10.3390/rs17172924 - 22 Aug 2025
Abstract
Developing advanced receiver autonomous integrity monitoring (ARAIM) for ground real-time precise positioning applications such as autonomous vehicles presents computational challenges, particularly in calculating real-time protection levels (PLs) that bound possible positioning errors under an acceptable integrity risk. This study proposes an enhanced method
[...] Read more.
Developing advanced receiver autonomous integrity monitoring (ARAIM) for ground real-time precise positioning applications such as autonomous vehicles presents computational challenges, particularly in calculating real-time protection levels (PLs) that bound possible positioning errors under an acceptable integrity risk. This study proposes an enhanced method for fast PL estimation by introducing a segmentation approach to the Gershgorin circle theorem-based technique for computing standard deviation upper bounds (UBs). This method divides satellites into segments based on normalised geometry mapping coefficients, allowing multiple UBs instead of a single bound for all subsets within each fault-tolerant mode. The approach is implemented for PPP-RTK with an improved Classification Adaptive Kalman Filter (CAKF). Testing is conducted using a network of 10 continuously operating reference stations (CORSs) employing dual-frequency multi-constellation GNSS data. Results show that when monitoring single fault mode, the PL ranges from 0.05 to 0.1 m with a PL-to-PE ratio of 30:1, while dual fault modes monitoring yields PL from 1 to 10 m with a ratio of 3700:1. The segmentation method achieves 1–5% tighter PLs, i.e., better integrity monitoring (IM) availability, compared to the classical single UB approach while maintaining the same computational efficiency by reducing processed subsets from 325 to 1 for dual fault modes. While the method provides slight improvement in PL tightness, it can be more computationally efficient when having geometries with dominant off-diagonal correlation that fails the computation of a UB.
Full article
(This article belongs to the Section Satellite Missions for Earth and Planetary Exploration)
Open AccessArticle
Deep Fuzzy Fusion Network for Joint Hyperspectral and LiDAR Data Classification
by
Guangen Liu, Jiale Song, Yonghe Chu, Lianchong Zhang, Peng Li and Junshi Xia
Remote Sens. 2025, 17(17), 2923; https://doi.org/10.3390/rs17172923 - 22 Aug 2025
Abstract
Recently, Transformers have made significant progress in the joint classification task of HSI and LiDAR due to their efficient modeling of long-range dependencies and adaptive feature learning mechanisms. However, existing methods face two key challenges: first, the feature extraction stage does not explicitly
[...] Read more.
Recently, Transformers have made significant progress in the joint classification task of HSI and LiDAR due to their efficient modeling of long-range dependencies and adaptive feature learning mechanisms. However, existing methods face two key challenges: first, the feature extraction stage does not explicitly model category ambiguity; second, the feature fusion stage lacks a dynamic perception mechanism for inter-modal differences and uncertainties. To this end, this paper proposes a Deep Fuzzy Fusion Network (DFNet) for the joint classification of hyperspectral and LiDAR data. DFNet adopts a dual-branch architecture, integrating CNN and Transformer structures, respectively, to extract multi-scale spatial–spectral features from hyperspectral and LiDAR data. To enhance the model’s discriminative robustness in ambiguous regions, both branches incorporate fuzzy learning modules that model class uncertainty through learnable Gaussian membership functions. In the modality fusion stage, a Fuzzy-Enhanced Cross-Modal Fusion (FECF) module is designed, which combines membership-aware attention mechanisms with fuzzy inference operators to achieve dynamic adjustment of modality feature weights and efficient integration of complementary information. DFNet, through a hierarchical design, realizes uncertainty representation within and fusion control between modalities. The proposed DFNet is evaluated on three public datasets, and the extensive experimental results indicate that the proposed DFNet considerably outperforms other state-of-the-art methods.
Full article
Open AccessArticle
An Object-Based Deep Learning Approach for Building Height Estimation from Single SAR Images
by
Babak Memar, Luigi Russo, Silvia Liberata Ullo and Paolo Gamba
Remote Sens. 2025, 17(17), 2922; https://doi.org/10.3390/rs17172922 - 22 Aug 2025
Abstract
The accurate estimation of building heights using very-high-resolution (VHR) synthetic aperture radar (SAR) imagery is crucial for various urban applications. This paper introduces a deep learning (DL)-based methodology for automated building height estimation from single VHR COSMO-SkyMed images: an object-based regression approach based
[...] Read more.
The accurate estimation of building heights using very-high-resolution (VHR) synthetic aperture radar (SAR) imagery is crucial for various urban applications. This paper introduces a deep learning (DL)-based methodology for automated building height estimation from single VHR COSMO-SkyMed images: an object-based regression approach based on bounding box detection followed by height estimation. This model was trained and evaluated on a unique multi-continental dataset comprising eight geographically diverse cities across Europe, North and South America, and Asia, employing a cross-validation strategy to explicitly assess out-of-distribution (OOD) generalization. The results demonstrate highly promising performance, particularly on European cities where the model achieves a Mean Absolute Error (MAE) of approximately one building story (2.20 m in Munich), significantly outperforming recent state-of-the-art methods in similar OOD scenarios. Despite the increased variability observed when generalizing to cities in other continents, particularly in Asia with its distinct urban typologies and the prevalence of high-rise structures, this study underscores the significant potential of DL for robust cross-city and cross-continental transfer learning in building height estimation from single VHR SAR data.
Full article
(This article belongs to the Special Issue Advances in Spaceborne SAR—Technology and Applications (Second Edition))
►▼
Show Figures

Figure 1
Open AccessArticle
Remote Monitoring of Ground Deformation in an Active Landslide Area, Upper Mapocho River Basin, Central Chile, Using DInSAR Technique with PAZ and Sentinel-1 Imagery
by
Paulina Vidal-Páez, Jorge Clavero, Valentina Ramírez, Alfonso Fernández-Sarría, Oliver Meseguer-Ruiz, Miguel Aguilera, Waldo Pérez-Martínez, María José González Bonilla, Juan Manuel Cuerda, Nuria Casal and Francisco Mena
Remote Sens. 2025, 17(17), 2921; https://doi.org/10.3390/rs17172921 - 22 Aug 2025
Abstract
The upper Mapocho River basin, located in central Chile, has been affected by numerous landslides in the past, which may become more frequent due to a projected increase in intense precipitation events in the context of climate change. Against this background, this study
[...] Read more.
The upper Mapocho River basin, located in central Chile, has been affected by numerous landslides in the past, which may become more frequent due to a projected increase in intense precipitation events in the context of climate change. Against this background, this study aimed to analyze the ground deformation associated with an active landslide area in the Yerba Loca basin using the SBAS–DInSAR technique with PAZ and Sentinel-1 images acquired during two time periods, 2019–2021 and 2018–2022, respectively. Using PAZ imagery, the estimated vertical displacement velocity (subsidence) was as high as 9.6 mm/year between 2019 and 2021 in the area affected by the Yerba Loca multirotational slide in August 2018. Analysis of Sentinel-1 images indicated a vertical displacement velocity reaching −94 mm/year between 2018 and 2022 in the Yerba Loca landslide, suggesting continued activity in this area. It, therefore, may collapse again soon, affecting tourism services and the local ecosystem. By focusing on a mountainous region, this study demonstrates the usefulness of radar imagery for investigating landslides in remote or hard-to-reach areas, such as the mountain sector of central Chile.
Full article
(This article belongs to the Special Issue PAZ Ciencia: Review of the Scientific Results from Radar PAZ Mission Data)
►▼
Show Figures
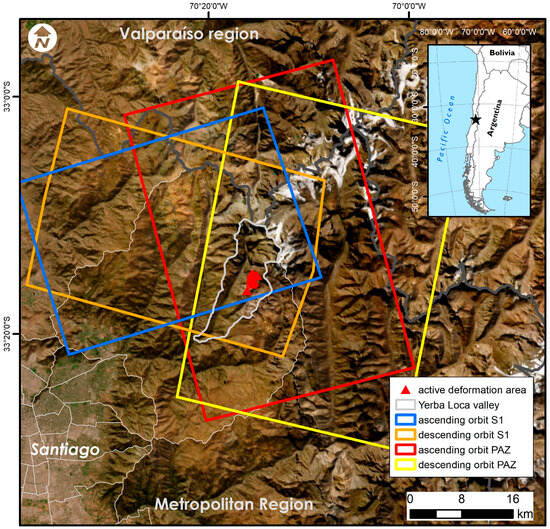
Figure 1
Open AccessArticle
Deep Learning with UAV Imagery for Subtropical Sphagnum Peatland Vegetation Mapping
by
Zhengshun Liu and Xianyu Huang
Remote Sens. 2025, 17(17), 2920; https://doi.org/10.3390/rs17172920 - 22 Aug 2025
Abstract
►▼
Show Figures
Peatlands are vital for global carbon cycling, and their ecological functions are influenced by vegetation composition. Accurate vegetation mapping is crucial for peatland management and conservation, but traditional methods face limitations such as low spatial resolution and labor-intensive fieldwork. We used ultra-high-resolution UAV
[...] Read more.
Peatlands are vital for global carbon cycling, and their ecological functions are influenced by vegetation composition. Accurate vegetation mapping is crucial for peatland management and conservation, but traditional methods face limitations such as low spatial resolution and labor-intensive fieldwork. We used ultra-high-resolution UAV imagery captured across seasonal and topographic gradients and assessed the impact of phenology and topography on classification accuracy. Additionally, this study evaluated the performance of four deep learning models (ResNet, Swin Transformer, ConvNeXt, and EfficientNet) for mapping vegetation in a subtropical Sphagnum peatland. ConvNeXt achieved peak accuracy at 87% during non-growing seasons through its large-kernel feature extraction capability, while ResNet served as the optimal efficient alternative for growing-season applications. Non-growing seasons facilitated superior identification of Sphagnum and monocotyledons, whereas growing seasons enhanced dicotyledon distinction through clearer morphological features. Overall accuracy in low-lying humid areas was 12–15% lower than in elevated terrain due to severe spectral confusion among vegetation. SHapley Additive exPlanations (SHAP) of the ConvNeXt model identified key vegetation indices, the digital surface model, and select textural features as primary performance drivers. This study concludes that the combination of deep learning and UAV imagery presents a powerful tool for peatland vegetation mapping, highlighting the importance of considering phenological and topographical factors.
Full article
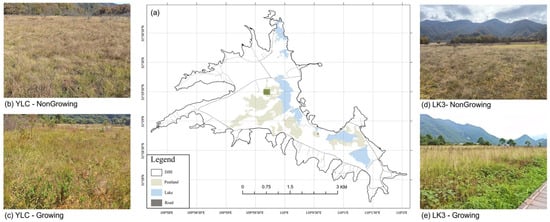
Figure 1
Open AccessArticle
Not All Green Is Equal: Growth Form Is a Key Driver of Urban Vegetation Sensitivity to Climate in Chicago
by
Natalie L. R. Love, Max Berkelhammer, Eduardo Tovar, Sarah Romy, Matthew D. Wilson and Gabriela C. Nunez Mir
Remote Sens. 2025, 17(17), 2919; https://doi.org/10.3390/rs17172919 - 22 Aug 2025
Abstract
Urban green spaces are important nature-based solutions to mitigate climate change. While the distribution of green spaces within cities is well documented, few studies assess whether inequities in green space quantity (i.e., percent cover) are mirrored by inequities in green space quality (i.e.,
[...] Read more.
Urban green spaces are important nature-based solutions to mitigate climate change. While the distribution of green spaces within cities is well documented, few studies assess whether inequities in green space quantity (i.e., percent cover) are mirrored by inequities in green space quality (i.e., vegetation health or sensitivity to stressors). Green space quality is important to measure alongside green space quantity because vegetation that is healthier and less sensitive to stressors such as climatic fluctuations sustain critical ecosystem services through stressful environmental conditions, especially as the climate changes. We use a 40-year remote sensing dataset to examine the spatial patterns and underlying drivers of vegetation sensitivity to short-term (monthly) climate fluctuations in Chicago. Our results show that although vegetation cover was not equitably distributed between racially and ethnically segregated census tracts, socio-demographic composition was not a key driver of spatial variation in short-term vegetation sensitivity to climate. Instead, we found that vegetation growth form was a strong predictor of differences in vegetation sensitivity among communities. At the census tract level, higher herbaceous/shrub cover was associated with increased sensitivity to climate, while higher tree cover was associated with decreased sensitivity. These results suggest that urban green spaces comprising trees will be less sensitive (i.e., more resistant) to short-term climate fluctuations than those comprising predominately herbaceous or shrub cover. Our findings highlight that urban green space quality can vary spatially within cities; however, more work is needed to understand how the drivers of vegetation sensitivity vary among cities, especially those experiencing different climatic regimes. This work is key to planning and planting high-quality, climate change-resilient and equitable urban green spaces.
Full article
(This article belongs to the Special Issue Remote Sensing of Climate Change Influences on Urban Ecology)
►▼
Show Figures
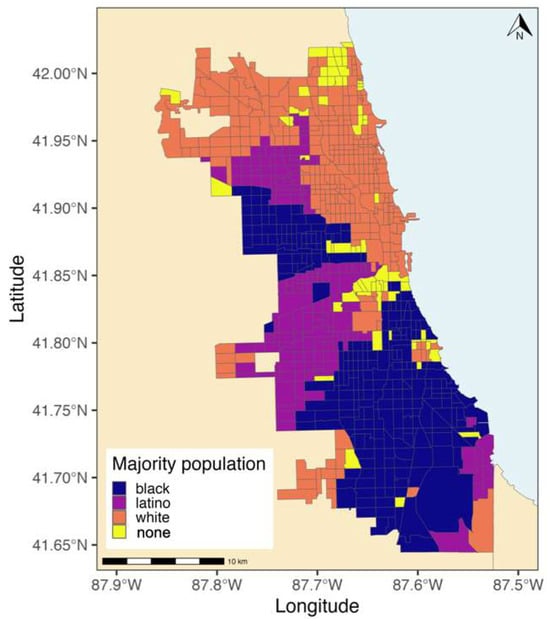
Figure 1
Open AccessTechnical Note
Air Moving-Target Detection Based on Sub-Aperture Segmentation and GoDec+ Decomposition with Spaceborne SAR Time-Series Imagery
by
Yanping Wang, Yunzhen Jia, Wenjie Shen, Yun Lin, Yang Li, Lei Liu, Aichun Wang, Hongyu Liu and Qingjun Zhang
Remote Sens. 2025, 17(16), 2918; https://doi.org/10.3390/rs17162918 - 21 Aug 2025
Abstract
Air moving-target detection is crucial for national defense, civil aviation, and airspace supervision. Spaceborne synthetic aperture radar (SAR) provides high-resolution, continuous observations for this task, but faces challenges including target attitude variation-induced weak signals and Doppler defocusing from targets’ high-speed motion, which hinder
[...] Read more.
Air moving-target detection is crucial for national defense, civil aviation, and airspace supervision. Spaceborne synthetic aperture radar (SAR) provides high-resolution, continuous observations for this task, but faces challenges including target attitude variation-induced weak signals and Doppler defocusing from targets’ high-speed motion, which hinder target-background separation. To address this, we propose a novel method combining sub-aperture segmentation with GoDec+ low-rank decomposition to enhance signal-to-noise ratio and suppress defocusing. Critically, ADS-B flight data is integrated as ground truth for spatio-temporal validation. Experiments using Sentinel-1 SM mode SLC imagery across farmland, forest, and mountainous regions confirm the method’s effectiveness and robustness in real airspace scenarios.
Full article
(This article belongs to the Special Issue Advances in Synthetic Aperture Radar Data Processing and Application (Second Edition))
►▼
Show Figures
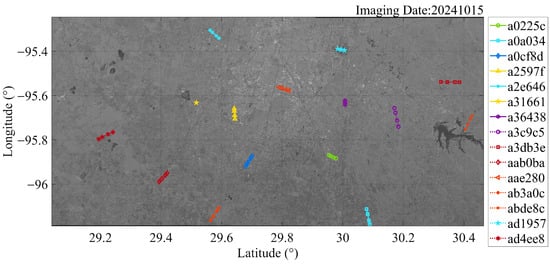
Figure 1
Open AccessArticle
Semi-Automated Mapping of Pockmarks from MBES Data Using Geomorphometry and Machine Learning-Driven Optimization
by
Vasileios Giannakopoulos, Peter Feldens and Elias Fakiris
Remote Sens. 2025, 17(16), 2917; https://doi.org/10.3390/rs17162917 - 21 Aug 2025
Abstract
Accurate mapping of seafloor morphological features, such as pockmarks, is essential for marine spatial planning, geological hazard assessment, and environmental monitoring. Traditional manual delineation methods are often subjective and inefficient when applied to large, high-resolution bathymetric datasets. This study presents a semi-automated workflow
[...] Read more.
Accurate mapping of seafloor morphological features, such as pockmarks, is essential for marine spatial planning, geological hazard assessment, and environmental monitoring. Traditional manual delineation methods are often subjective and inefficient when applied to large, high-resolution bathymetric datasets. This study presents a semi-automated workflow based on the CoMMa (Confined Morphologies Mapping) toolbox to classify pockmarks in Flensburg Fjord, Germany–Denmark. Initial detection employed the Bathymetric Position Index (BPI) with intentionally permissive parameters to ensure high recall of morphologically diverse features. Morphometric descriptors were then extracted and used to train a Random Forest classifier, enabling noise reduction and refinement of overinclusive delineations. Validation against expert-derived mappings showed that the model achieved an overall classification accuracy of 86.16%, demonstrating strong performance across the validation area. These findings highlight how integrating a GIS-based geomorphometry toolbox with machine learning yields a reproducible, objective, and scalable approach to seabed mapping, supporting decision-making processes and advancing standardized methodologies in marine geomorphology.
Full article
(This article belongs to the Special Issue Underwater Remote Sensing: Status, New Challenges and Opportunities)
►▼
Show Figures
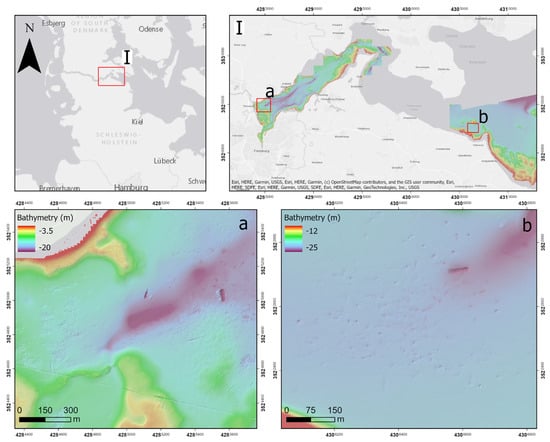
Figure 1
Open AccessArticle
A GRU-Enhanced Kolmogorov–Arnold Network Model for Sea Surface Temperature Prediction Derived from Satellite Altimetry Product in South China Sea
by
Rumiao Sun, Zhengkai Huang, Xuechen Liang, Siyu Zhu and Huilin Li
Remote Sens. 2025, 17(16), 2916; https://doi.org/10.3390/rs17162916 - 21 Aug 2025
Abstract
High-precision Sea Surface Temperature (SST) prediction is critical for understanding ocean–atmosphere interactions and climate anomaly monitoring. We propose GRU_EKAN, a novel hybrid model where Gated Recurrent Units (GRUs) capture temporal dependencies and the Enhanced Kolmogorov–Arnold Network (EKAN) models complex feature interactions between SST
[...] Read more.
High-precision Sea Surface Temperature (SST) prediction is critical for understanding ocean–atmosphere interactions and climate anomaly monitoring. We propose GRU_EKAN, a novel hybrid model where Gated Recurrent Units (GRUs) capture temporal dependencies and the Enhanced Kolmogorov–Arnold Network (EKAN) models complex feature interactions between SST and multivariate ocean predictors. This study integrates GRU with EKAN, using B-spline-parameterized activation functions to model high-dimensional nonlinear relationships between multiple ocean variables (including sea water potential temperature at the sea floor, ocean mixed layer thickness defined by sigma theta, sea water salinity, current velocities, and sea surface height) and SST. L2 regularization addresses multicollinearity among predictors. Experiments were conducted at 25 South China Sea sites using 2011–2021 CMEMS data. The results show that GRU_EKAN achieves a superior mean R2 of 0.85, outperforming LSTM_EKAN, GRU, and LSTM by 5%, 25%, and 23%, respectively. Its average RMSE (0.90 °C), MAE (0.76 °C), and MSE (0.80 °C2) represent reductions of 31.3%, 27.0%, and 53.2% compared to GRU. The model also exhibits exceptional stability and minimal Weighted Quality Evaluation Index (WQE) fluctuation. During the 2019–2020 temperature anomaly events, GRU_EKAN predictions aligned closest with observations and captured abrupt trend shifts earliest. This model provides a robust tool for high-precision SST forecasting in the South China Sea, supporting marine heatwave warnings.
Full article
(This article belongs to the Special Issue Recent Progress in Understanding Global Sea Level Rise Using Space and Earth Observations)
►▼
Show Figures
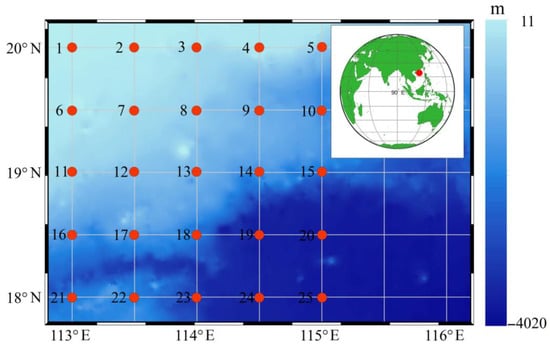
Figure 1

Journal Menu
► ▼ Journal Menu-
- Remote Sensing Home
- Aims & Scope
- Editorial Board
- Reviewer Board
- Topical Advisory Panel
- Photography Exhibition
- Instructions for Authors
- Special Issues
- Topics
- Sections & Collections
- Article Processing Charge
- Indexing & Archiving
- Editor’s Choice Articles
- Most Cited & Viewed
- Journal Statistics
- Journal History
- Journal Awards
- Society Collaborations
- Conferences
- Editorial Office
Journal Browser
► ▼ Journal BrowserHighly Accessed Articles
Latest Books
E-Mail Alert
News
Topics
Topic in
Drones, Electronics, Remote Sensing, Sensors, Smart Cities
Advanced Array Signal Processing for B5G/6G: Models, Algorithms, and Applications
Topic Editors: Fangqing Wen, Xianpeng Wang, Jin He, Liangtian Wan, Zhiyuan ZhaDeadline: 31 August 2025
Topic in
Conservation, Diversity, JMSE, Remote Sensing, Technologies
Technological Innovation to Support Reef Research and Conservation
Topic Editors: Atsuko Fukunaga, John BurnsDeadline: 15 September 2025
Topic in
Agriculture, Agronomy, Forests, Remote Sensing, Sustainability
Challenges, Development and Frontiers of Smart Agriculture and Forestry—2nd Volume
Topic Editors: Xiaoli Zhang, Dengsheng Lu, Xiujuan Chai, Guijun Yang, Langning HuoDeadline: 30 September 2025
Topic in
Entropy, Environments, Land, Remote Sensing
Bioterraformation: Emergent Function from Systemic Eco-Engineering
Topic Editors: Matteo Convertino, Jie LiDeadline: 30 November 2025

Conferences
Special Issues
Special Issue in
Remote Sensing
Cutting-Edge PolSAR Imaging Applications and Techniques
Guest Editors: Dapeng Tao, Jun Ni, Fan Zhang, Deliang Xiang, Sen DuDeadline: 25 August 2025
Special Issue in
Remote Sensing
Advances in High-Resolution Crop Mapping at Large Spatial Scales
Guest Editors: Lingbo Yang, Pengliang WeiDeadline: 28 August 2025
Special Issue in
Remote Sensing
Forest Disturbance Monitoring with Optical Satellite Imagery
Guest Editors: Antoine Masse, Nikolay S. StrigulDeadline: 28 August 2025
Special Issue in
Remote Sensing
Space-Photogrammetry for High-Precision Measurement by Multi-Sensor Data Fusion
Guest Editors: Rujin Zhao, Zhenming Peng, Xiong XuDeadline: 28 August 2025
Topical Collections
Topical Collection in
Remote Sensing
Visible Infrared Imaging Radiometers and Applications
Collection Editor: Changyong Cao
Topical Collection in
Remote Sensing
Google Earth Engine Applications
Collection Editors: Lalit Kumar, Onisimo Mutanga
Topical Collection in
Remote Sensing
Sentinel-2: Science and Applications
Collection Editors: Clement Atzberger, Jadu Dash, Olivier Hagolle, Jochem Verrelst, Quinten Vanhellemont, Jordi Inglada, Tuomas Häme
Topical Collection in
Remote Sensing
The VIIRS Collection: Calibration, Validation, and Application
Collection Editors: Xi Shao, Xiaoxiong Xiong, Changyong Cao


