Article

The Impact of Climate Change and Water Consumption on the Inflows of Hydroelectric Power Plants in the Central Region of Brazil

by
Filipe Otávio Passos
1,
Benedito Cláudio da Silva
2,*,
José Wanderley Marangon de Lima
3,
Marina de Almeida Barbosa
1,
Pedro Henrique Gomes Machado
2 and
Rafael Machado Martins
2
1
Instituto de Sistemas Elétricos e Energia, Campus José Rodrigues Seabra, Universidade Federal de Itajubá, Itajubá 37500-903, Brazil
2
Instituto de Recursos Naturais, Campus José Rodrigues Seabra, Universidade Federal de Itajubá, Itajubá 37500-903, Brazil
3
Marangon Engenharia, Rua Sebastião Leite, 48, Itajubá 37501-160, Brazil
*
Author to whom correspondence should be addressed.
Climate 2025, 13(7), 140; https://doi.org/10.3390/cli13070140
Submission received: 4 June 2025 / Revised: 29 June 2025 / Accepted: 1 July 2025 / Published: 4 July 2025
(This article belongs to the Section Climate and Economics)

Abstract

There is a consensus that climate change has affected society. The increase in temperature and reduction in precipitation for some regions of the world have had implications for the intensity and frequency of extreme events. This scenario is worrying for various sectors of water use, such as hydroelectric power generation and agriculture. Reduced flows in river basins, coupled with increased water consumption, can significantly affect energy generation and food production. Within this context, this paper presents an analysis of climate change impacts in a large basin of Brazil between the Amazon and Cerrado biomes, considering the effects of water demands. Inflow projections were generated for seven power plant reservoirs in the Tocantins–Araguaia river basin, using projections from five climate models. The results indicate significant reductions in flows, with decreases of more than 50% in the average flow. For minimum flows, there are indications of reductions of close to 85%. The demand for water, although growing, represents a smaller part of the effects, but should not be disregarded, since it impacts the dry periods of the rivers and can generate conflicts with energy production.

1. Introduction

Climate change (CC), which arises from natural processes, has been enhanced by anthropogenic actions, especially the increase in greenhouse gas (GHG) emissions. These changes have directly and indirectly affected various sectors of society, such as the environment, water resources, food production, and electricity generation. The latest climate assessment reports from the Intergovernmental Panel on Climate Change (IPCC) indicate that in the future there will be a tendency for temperatures and evapotranspiration to increase across the globe [1,2,3], reductions in precipitation mainly in the North and Northeast regions of Brazil [4,5], and an increase in the frequency and intensity of extreme events such as droughts and floods [3,6]. Analyses show that reductions in average rainfall of around 20% have already been observed in the Brazilian Northeast, and around 15% in the eastern Amazon region, which could get worse as GHG emissions increase [5].
Due to the predominance of hydropower in the Brazilian energy matrix, which represents approximately 50% of the total installed capacity [7]. This dependence on the quantity of water flowing into hydroelectric plants brings many uncertainties, especially in regions where there are trends towards reduced rainfall due to changes in global climate patterns. Within this context, the Amazon–Cerrado transition zone in central region of the country is vital for the Brazilian energy resilience, because it regulates rainfall, sustains river flows, and buffers against droughts [8]. Its deep-rooted vegetation stores and slowly releases water, ensuring stable supplies for key dams, while deforestation disrupts moisture recycling, reduces rainfall, and increases sedimentation—threatening Brazil’s hydropower-dependent energy system. Protecting this region is essential to maintain climate resilience, prevent reservoir siltation, and secure long-term electricity generation in Brazil.
On the other hand, the demands for water from different sectors of society also have an impact on energy generation, especially for small plants, bringing further uncertainties to the sector. Consumptive use of water occurs when the water withdrawn is consumed, partially or totally, in the process for which it is intended, and does not return directly to the water body [9]. The main consumptive uses of water in Brazil are human supply (urban and rural), animal feed, industry, mining, thermoelectricity, irrigation, and net evaporation from artificial reservoirs [10].
The demand for water in Brazil is growing, with an estimated increase of approximately 80% in the total water withdrawn in the past two decades [10], and the projection is that it will increase by around 24% by 2030. The evolution of water use is directly related to the country’s economic development and urbanization process, which has led to the expansion of industrial use and irrigated agriculture in recent decades. In the North and Southeast, there is a predominance of withdrawals for human supply, and in the other regions, there is a predominance of use for irrigated agriculture. Assessing the hydrological regime is of crucial importance for the rational management of water resources. Changes in water consumption patterns and land use and occupation affect water availability [11].
Therefore, there is a need to develop methodologies that can predict the impacts on the hydrological cycle, considering not only climate change, but also other changes that impact on the water balance of basins, such as land use and occupation and consumptive uses of water. In this sense, rainfall–runoff hydrological models are of fundamental importance. Combining rainfall–runoff models with climate change scenarios has been widely used to assess the impacts of climate change on river basins but requires consistent climate projections and robust hydrological models [12].
In relation to climate change, the main parameters that impact inflows to hydroelectric plants are precipitation and evapotranspiration. Changes in these climate parameters will directly impact flows in river basins, with precipitation being the parameter to which there is greatest sensitivity [13]. In more complete hydrological models, evapotranspiration is calculated during the hydrological simulation, based on variables provided by the climate model. The variables usually required are air temperature and relative humidity, wind speed, solar radiation, and atmospheric pressure. All variables are calculated at the Earth’s surface, with no need for results from other layers of the atmosphere. In addition, climate models generate results for many other variables that are not important in river flow simulation and are therefore disregarded.
For Brazilian basins, there are studies that have assessed the effects of climate change on inflows of hydropower stations, as in the case of the São Francisco River, based on projections from the HadCM3 climate model of CMIP4 and simulations from the MGB-IPH hydrological model [14]. The results indicated reductions in streamflows in the two scenarios analyzed, which could reach up to 35% by the end of the 21st century. In another study [15], SMAP was used to project the streamflows of the main power plants in the electricity sector using 13 CMIP5 models for the RCP 8.5 emission scenario, and thus assess the impact on the electricity sector. The results indicated that streamflow reductions could reach, in the worst-case scenario, 12% for the Northeast and 10% for the North.
More recently, the impacts of climate change on water resources throughout South America were assessed using the MGB-IPH hydrological model [16]. Using 25 CMIP5 models in the RCP 4.5 and RCP 8.5 scenarios. The results also indicated reductions in precipitation and, consequently, in streamflows in the eastern Amazon and much of northeastern Brazil, and that the intensity of the impacts depends on the RCP emission scenario. In addition, reductions in average annual streamflow (around 8–14%) were projected in the Tocantins and Amazonas basins. Similarly, the impacts of climate change on inflows and Inflow Natural Energy (ENA) were also assessed using six models from the Coordinated Regional Climate Downscaling Experiment (CORDEX) project, based on the RCP 4.5 and RCP 8.5 scenarios for the 21st century [15]. Using the SMAP hydrological model, the results showed that most of the models project reductions in streamflows and ENA for the North and Northeast regions of Brazil.
Similar research has been carried out for basins around the globe [13], but most of these studies only include the incorporation of climate model variables, and a smaller number analyze the combination of effects with changes in land use and land cover. Due to the high complexity of the global climate system, it is important to note that there are limitations in all research on climate change. These limitations are related to factors such as the structure and spatial resolution of climate models, the scarcity of observed data in many regions, and the need for high computational capacity, among other factors.
Another important limitation is that large-scale climate and hydrological models do not include the simulation of engineering structures and the uses of water [16], which interfere with the behavior of flows. Therefore, all these limitations are a source of uncertainty in climate change projections, which can be significant in many cases [17,18], making it necessary to develop strategies to incorporate the human system-of-system impact into hydrological models [19]. Furthermore, some connections between the climate system and water resources are complex and challenging to simulate [20]. Therefore, it is important to focus only on the connections that actually impact water availability.
Few studies about Brazilian basins assess the combined impact of climate change and increased water demand, such as the projection of scenarios for the main reservoirs of the São Francisco River (Brazil) using five CMIP6 models, the SSP2-4.5 and SSP5-8.5 scenarios, and the SMAP model for streamflow projection [21]. The combination of climate change scenarios and water demand indicated a decrease in inflows of between −5% and −40% in the Sobradinho and Três Marias reservoirs. The growth in water demand, mainly for irrigation, has increased the impacts on generation in the basin.
A limitation in climate change research is the use of climate variables from general circulation models (GCMs), which often have a coarser spatial resolution. As a result, the level of detail of the information may not be compatible with what is needed for regional analysis using hydrological models. Downscaling is a possible solution to this challenge, used to improve the spatial resolution of the information [3,22]. There are currently two commonly used downscaling techniques; one is dynamic downscaling, which uses higher resolution numerical models to simulate local effects on a sub-daily scale, and the second is statistical downscaling, used to extrapolate data to a more refined sampling frequency based on a climate scenario [23]. Dynamic downscaling uses regional models (RMs) nested with MCG models [24]. RMs incorporate regional characteristics such as topography, vegetation, soil, and continent–ocean differences, which are not contained in global models, and are able to respond to local forcing effects. Statistical downscaling involves establishing empirical relationships between observations of large-scale atmospheric variables and local climate variables, and that these relationships remain valid under different future climate conditions [3]. Statistical downscaling methods such as linear regression, non-linear regression, and stochastic estimators are simpler and less computationally expensive to implement than dynamic downscaling techniques [25].
Based on these considerations, the main objective of this work is to analyze the changes in inflows from seven hydroelectric plants in the Tocantins–Araguaia river basin, located in the Brazilian Amazon region, due to the influence of climate change in precipitation, evapotranspiration, and water consumption patterns in the region. Climate projections obtained by the statistical downscaling of five global climate models and two GHG emission scenarios are analyzed.

2. Materials and Methods

2.1. Study Area and Selected Hydropower Plant

The Tocantins–Araguaia river basin (TARB) is located between the coordinates 55°25′12″ to 45°43′48″ west longitude and 18°8′24″ to 1°41′24″ south latitude, and has a total area of 765,367.05 km2. It is located partly in the North (53%), partly in the Northeast (4%), and the rest in the Center-West of Brazil [26]. Among the criteria for choosing the TARB was the fact that it is located in the Amazon region (Figure 1), where rainfall is expected to decrease towards the end of the century, as well as the importance of hydroelectric plants.
According to the Köppen classification [27], it falls into the Am and Aw types (over 90% of the area). The Am type is called the Monsoon Climate and has a drier month with rainfall of less than 60 mm, but equivalent to more than 4% of the total annual rainfall, and the Aw type is called the Savannah Climate, which has a drier season in winter, where the driest month has rainfall of less than 60 mm, which is equivalent to less than 4% of the total annual rainfall.
A total of 7 main hydroelectric power plants are assessed in the TARB, namely, the Serra da Mesa hydroelectric power station (installed capacity of 1275 MW), the Cana Brava hydroelectric power station (installed capacity of 450 W), the São Salvador hydroelectric power station (installed capacity of 243.2 MW), the Peixe Angical hydroelectric power station (installed capacity of 498.75 MW), the Lajeado hydroelectric power station (installed capacity of 902.5 MW), the Estreito hydroelectric power station (installed capacity of 1087 MW), and the Tucuruí hydroelectric power station (installed capacity of 8370 MW).

2.2. Methodology Overview

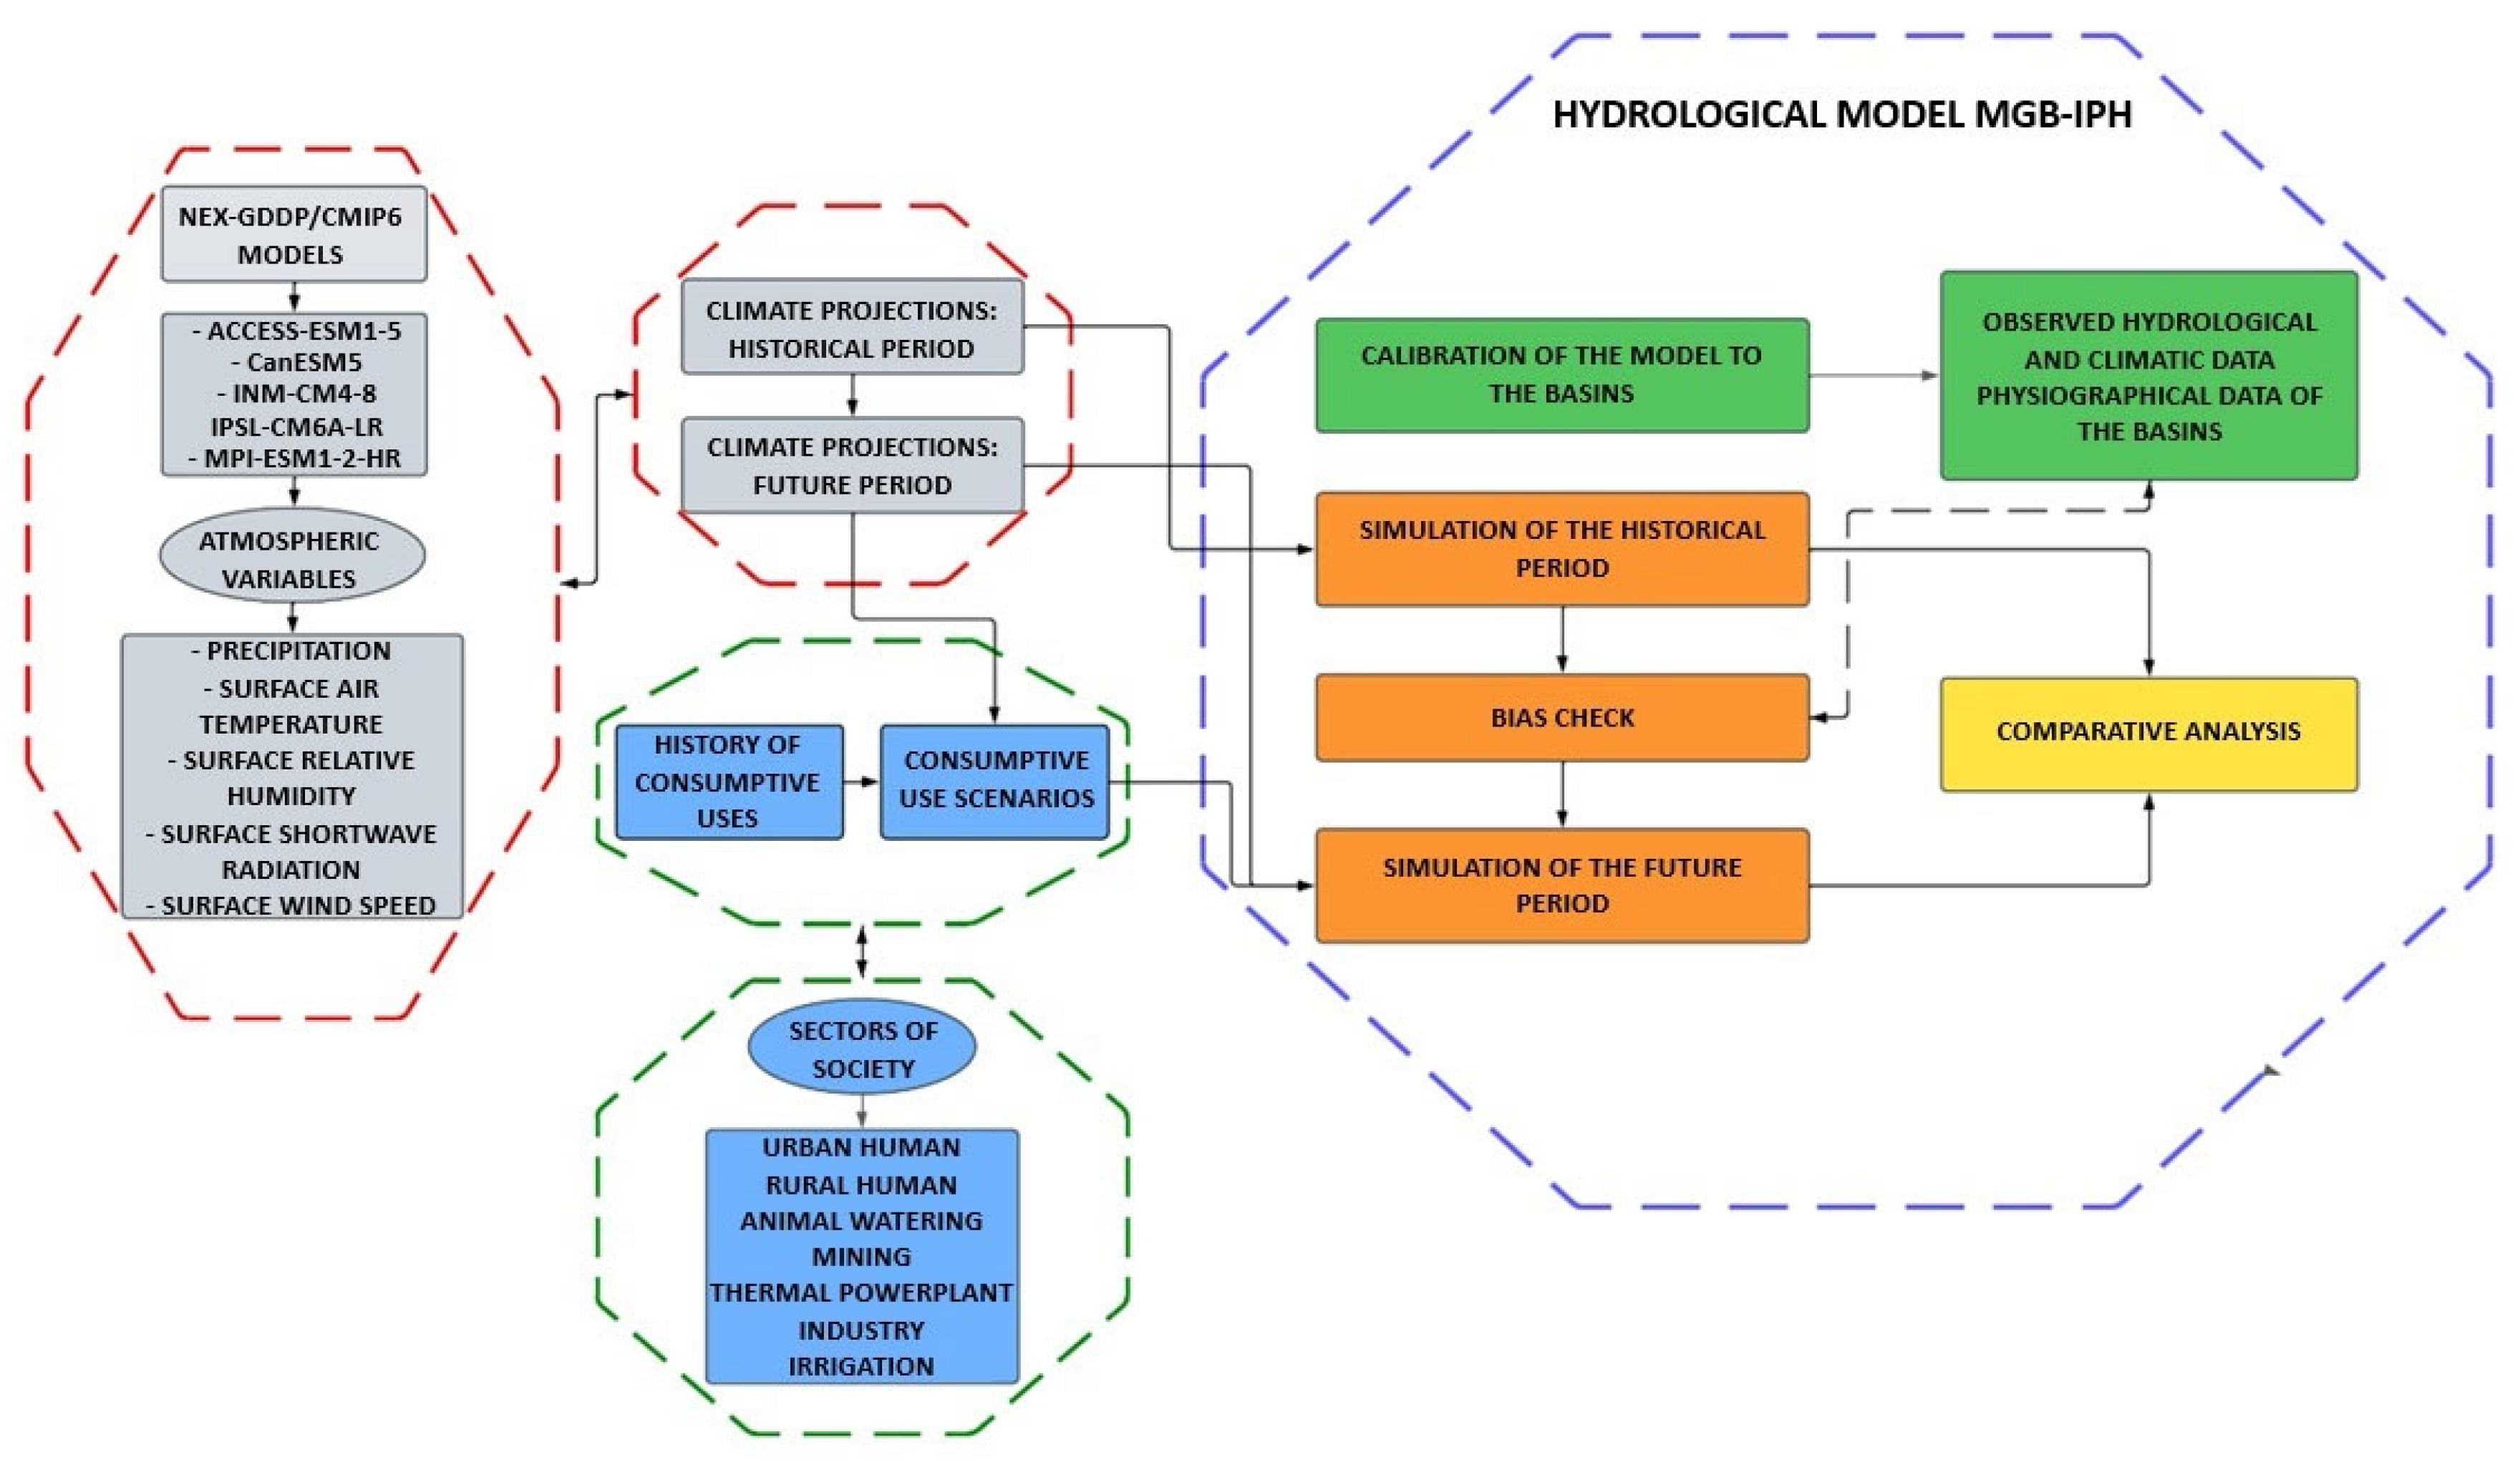
The methodology developed in this work can be summarized according to the flowchart shown in Figure 2. The first step in using the MGB-IPH hydrological model is to prepare the input data, which uses the basin’s physiographic data (relief, vegetation, land use, and occupation, among others) and observed hydrological and climatic data. Once the inputs are organized, the hydrological model can be calibrated and, after obtaining an adequate fit, it is ready for flow simulations and projections. At the same time, the projections of climate variables from NEX-GDDP/CMIP6 were obtained and formatted, using computer routines that range from extracting information for areas of interest and correcting the units of the variables to interpolating the information for the hydrological model grid [28].
Another step was to obtain and project the series of consumptive uses of water that were acquired from the National Water Agency (ANA) [10]. The series provided are monthly and cover the period from 1931 to 2021, with the remainder of the future horizon (up to 2060) being projected using an annual rate of change, defined on the basis of the trend observed in recent years. Although the stages are carried out in parallel, they are correlated. The projections of climate variables are assimilated by the MGB-IPH model, and the effect of climate change is also incorporated into the projections of consumptive uses using a correction factor based on changes in temperature and evapotranspiration. The last step is to project the streamflows of hydroelectric plants under the influence of climate change and subtract the share of water consumption. This results in the projected series of inflows from the plants and comparative analyses of the simulations for the historical period with the projections for the future period.

2.3. Hydrological Model

The parameters of MGB-IPH are calibrated for all the points of interest, i.e., the locations where the streamflow series is to be obtained. In this case, it is important that there are observed streamflows at all the locations for the same period, as they will be compared. The calibration period used in this work is from 1 January 1970 to 31 December 2014, i.e., the same horizon covered by the historical period of the climate models.
Hydrological (precipitation and river flow) and climatological data (temperature, relative humidity, wind speed, atmospheric pressure, and solar radiation or insolation) are required to calibrate the model [11]. In total, 498 rainfall stations and 53 meteorological stations were used [28,29] to collect data. The inflows in the 7 reservoirs were obtained from the Operador Nacional do Sistema Elétrico—ONS (National Electric System Operator) database [30]. The series of inflows to hydroelectric plants used by ONS are called “natural flows” because they were obtained using a methodology that removes the effect of reservoirs. Thus, the operation of hydroelectric plants does not need to be incorporated into hydrological simulations.
The model uses 3 statistics to evaluate the performance of the adjustment (Equations (1)–(3)), namely, Nash–Sutcliffe (NS), which is associated with medium and maximum flows, Nash–Sutcliffe of the logarithms of the streamflows (NSlog), which is related to minimum flows, and volume difference (ΔV), which is the bias between the observed streamflows and those simulated by the model. According to [31], the fit can be classified according to the values of the statistics as shown in Table 1. To determine the parameters, the genetic algorithm optimization technique is used, already incorporated into the model structure, which determines the parameter values through an automatic process.
N S = 1 t = 1 n Q o b s Q c a l 2 t = 1 n Q o b s Q o b s ¯ 2
N S t = 1 n log Q o b s log Q c a l 2 t = 1 n log Q o b s log Q o b s ¯ 2 l o g
Δ V = t = 1 n Q c a l t = 1 n Q o b s t = 1 n Q o b s
where t indicates the time interval; n is the number of time intervals; V is the volume; ΔV is the dimensionless relative error of this volume; Q c a l is the calculated flow at the station; Q o b s is the observed streamflow; Q o b s ¯ is the average of the observed flows.

2.4. Climate Model Projections and Precipitation Bias

Projections of climate variables were obtained from the IPCC’s AR6-CMIP6 information. The observed history of greenhouse gas emissions is taken into account, and future emission scenarios that combine socioeconomic and technological development [23], known as Shared Socioeconomic Pathways (SSPs), with future scenarios of radioactive forcings, known as Representative Concentration Pathways (RCPs), are used.
The SSP2 scenario considers moderate population growth and a slower convergence of income levels between countries. For the SSP5 scenario, both strong socioeconomic growth and a high use of fossil fuels are expected, as well as potentially large impacts from climate change. The RCP 4.5 scenario considers the stabilization of the radiative forcing at 4.5 W/m2 by the end of the century, and RCP 8.5, which is the most pessimistic scenario, considers an increase in the forcing reaching 8.5 W/m2 by the end of the century [23].
For this research, we used the results of the NEX-GDDP projections, which provide a statistical downscaling of the CMIP6 projections [32]. The information provided by NEX-GDDP has a high spatial resolution of 0.25°, which is equivalent to approximately 25 km, and is bias-corrected. These projections are ideal for analyzing smaller-scale areas, such as river basins. The data is separated into the historical period from 1970 to 2014 and the scenario projections from 2015 to 2100 for 33 climate models, 5 of which were selected (Table 2).
To manipulate the climate projections, computer routines were developed which perform the following operations: correcting the coordinates, cutting out the information for Latin America and the area of interest, calculating the climatology of the variables, concatenating the annual data into a single file, converting the format into text (the format used in the MGB-IPH), correcting leap years for the CanESM5 and INM-CM4-8 models, and interpolating rainfall [33].
With the files duly organized, the existence of biases in the rainfall from the climate models was checked, which can be achieved by comparing the simulated streamflows for the historical period (1970 to 2014) using the observed rainfall (ANA rain gauge stations) and the rainfall from the 5 climate models, where it is expected that, on average, the MGB-IPH model can adequately represent the streamflows with both the observed rainfall and the rainfall from the 5 models. If there are biases in the rainfall, the rainfall can be corrected directly in the MGB-IPH modeling or by applying a technique already established in the literature.
For the other climate variables used by the MGB-IPH model (temperature, wind, radiation, air humidity, and pressure), average values per period are used. To estimate future values, a perturbation of the variables mentioned is generated from the delta variation calculated by Equation (4), attributing the effects of climate change on the parameterization of the MGB-IPH model in the future horizon.
ΔV = (fut − hist)/hist
where ΔV is the delta change, fut is the monthly climatology of the variable in the future period (2015–2060), and hist is the monthly climatology of the variable in the historical period (1970–2014).

2.5. Projections of Consumptive Uses

In order to extend the monthly demand series to 2060, the methodology adopted was to apply the growth rate observed in the last five years of the historical record for each of the consumptive use classes. The growth rate values were calculated for each class, according to Equation (5), from 2017 to 2021, and the average of the rates was calculated and assigned to the year 2021. This process is represented in Figure 3a.
Δ C t = C t C t 1
where ΔCt is the growth rate consumption in year t, relative to year t − 1, Ct is the average annual consumption of the class in year t, and Ct−1 is the average annual consumption of the class in year t − 1.
A linear equation was adjusted, starting in 2021 with the average growth rate, and the variation value was set to 0 for the year 2050 (Figure 3b), the year in which population growth stabilizes according to the Brazilian census [34]. Therefore, the class variation rate is a function of the year (Equation (6)).
Δ C t f u t = Δ C ¯ 29 2050 t
where Δ C t f u t is the consumption growth rate in the future year t; Δ C ¯ is the average consumption growth rate of the last five years in the historic period.
The projected consumption values are calculated from 2022 to 2060 using Equation (7). As can be seen in Figure 3c, from 2050 to 2060, Equation (3) is applied with the growth rate of 2049. In other words, it was considered that despite population stabilization, the water demand will increase at a residual rate equal to that from 1948 to 1949.
C t + 1 = C t · 1 + Δ C t + 1
This adjustment is made for the classes of water consumption directly influenced by the total population. Therefore, the mining, thermoelectric, and animal watering classes did not have their growth limited until 2050.
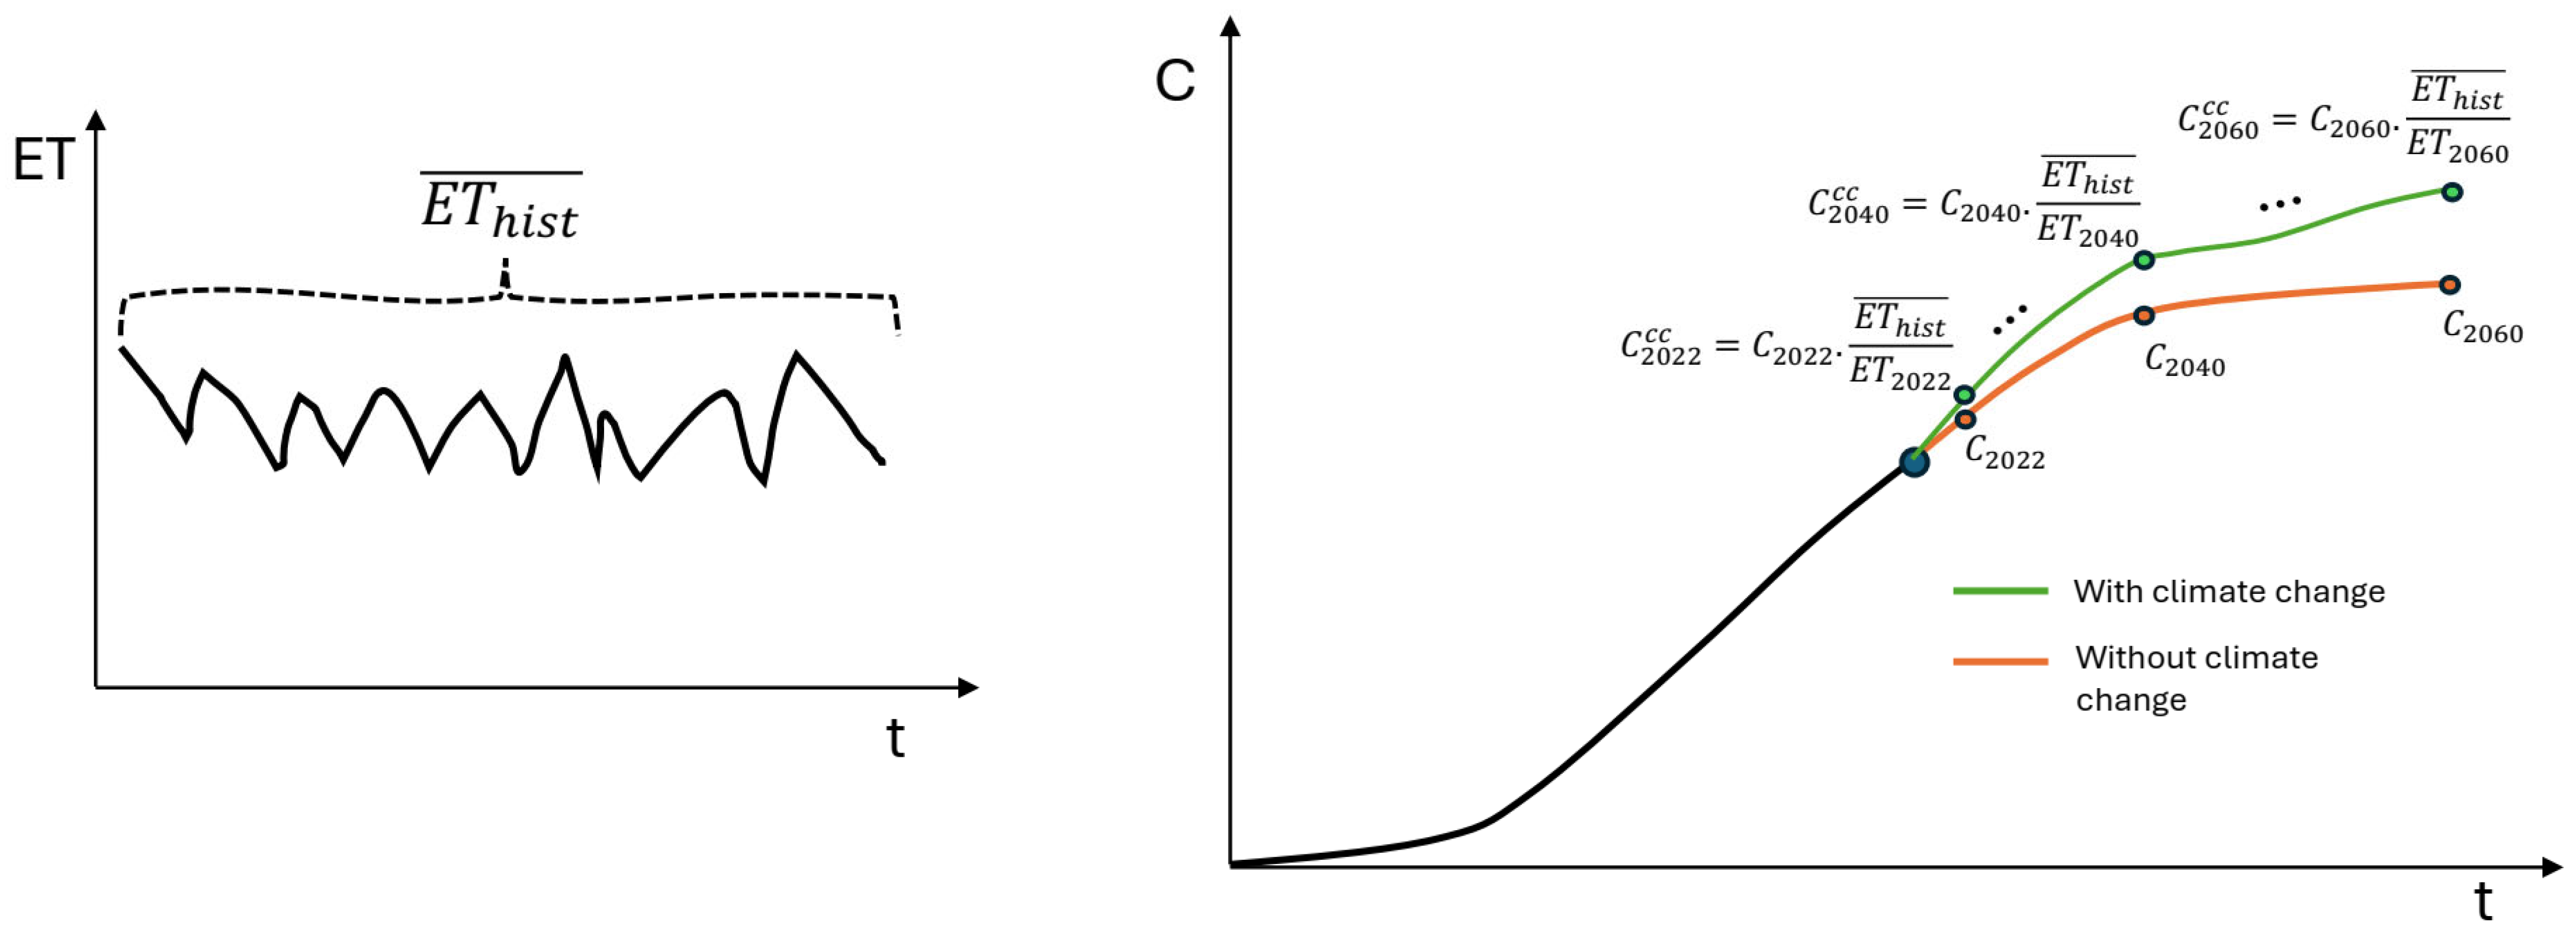
To incorporate climate change into the consumption projections, the premise adopted was that these projections are a reference scenario that must be corrected in line with the climate changes of each climate model. To this end, it was assumed that changes in reference evapotranspiration (ET) influence the irrigation class and that changes in average temperature (T) influence human supply (urban and rural) and animal supply. Equation (8) is used to calculate the water consumption correction, which is applied to the consumption projection values for the classes mentioned, thus adding the effect of climate change to the series. Figure 4 shows the procedure used to perform the calculations.
C t c c = C t . E T h i s t ¯ E T t
where C t c c is the water consumption corrected with climate change; E T h i s t ¯ is the average evapotranspiration from the historic period of the climate model (1970–2014); E T t is the evapotranspiration of the future year t. Evapotranspiration is replaced by temperature when applied to human and animal supply consumptions.
For the other classes, it was assumed that there is no well-defined relationship between climate variables and changes in water demand. Therefore, the effect of climate was not applied to the consumption of mining, thermoelectric plants, and industry.

2.6. Streamflow Projections

The final stage is the comparative analysis of the changes in the future scenarios in relation to the historical scenario. A total of ten combinations are made, with two future scenarios (SSP2-4.5 and SSP5-8.5) for each of the five climate models used (ACCESS-ESM1-5, CanESM5, INM-CM4-8, IPSL-CM6A-LR, and MPI-ESM1-2-HR).
The water consumption upstream of each hydroelectric plant evaluated in the TARB is taken into account in the streamflow series, subtracting the monthly water consumption values from the projected streamflow series, attributing the combined effect of climate and consumptive water use to the hydroelectric plant inflow series.

2.7. Data and Software Used

The streamflow simulations and projections for the hydroelectric plants are obtained from the Large Basin Model (MGB-IPH) [35]. This was chosen because of its extensive application in Brazilian river basins, its wide range of consultation material, and the fact that it is free software with an interface in a geographic information system (GIS) which is also freely accessible [36]. Among the applications of the MGB-IPH model are hydrological simulations that evaluate scenarios of changes in land use and occupation, streamflow forecasts, and the analysis of the impacts of climate change [14,37,38,39,40,41,42,43,44,45,46,47,48,49,50,51].
In the pre-processing stage of the MGB-IPH model, where the physiographic information of the basins is inserted, the main input is a digital elevation model (DEM). In this work, we used an MDE with a spatial resolution of 90 m, which has proven to be sufficient for use in the MGB-IPH. A map of hydrological response units (HRUs) is required, which are areas of similar hydrological behavior, defined by cross-referencing information on soil type and land use. In this work, the HRU map for South America is used [52]. Vegetation cover is parameterized by entering monthly values for 4 variables, namely, albedo (a), leaf area index (LAI), tree height (Z), and surface resistance (SR), which make up the so-called fixed parameters of the model, where the typical values used can be found in the literature [35].
The observed flow can be obtained from the National Water and Sanitation Agency’s (ANA) fluviometric stations or from the National System Operator (ONS). For rainfall, daily observed rainfall data is needed, which were used from ANA rain gauge stations. Climate data is also required, namely, average temperature (°C), relative humidity (%), sunshine (h/day), wind (m/s), and atmospheric pressure (kPa).
For the projections of climate variables, the NEX-GDDP-CMIP6 daily data set was used, in Network Common Data Form (NetCDF) format with a resolution of 0.25º, i.e., approximately 25 km. Five models were selected for use in this work, as shown in Table 2. These models were chosen based on the availability of climate data required for the MGB-IPH hydrological model (precipitation, wind, air humidity, radiation, and temperature), in daily temporal resolution. In addition, models evaluated with good performance over the Brazilian territory were considered.

3. Results and Discussion

3.1. Calibration of the MGB-IPH to the Tocantins–Araguaia River Basin

The process of adjusting MGB-IPH begins with adapting the model to the characteristics of the river basin to be studied. After this pre-processing stage, the physical information of the basin is entered and organized in the main file. From a DEM, the accumulated flow, flow direction, drainage network, and drainage network segmentation files are generated.
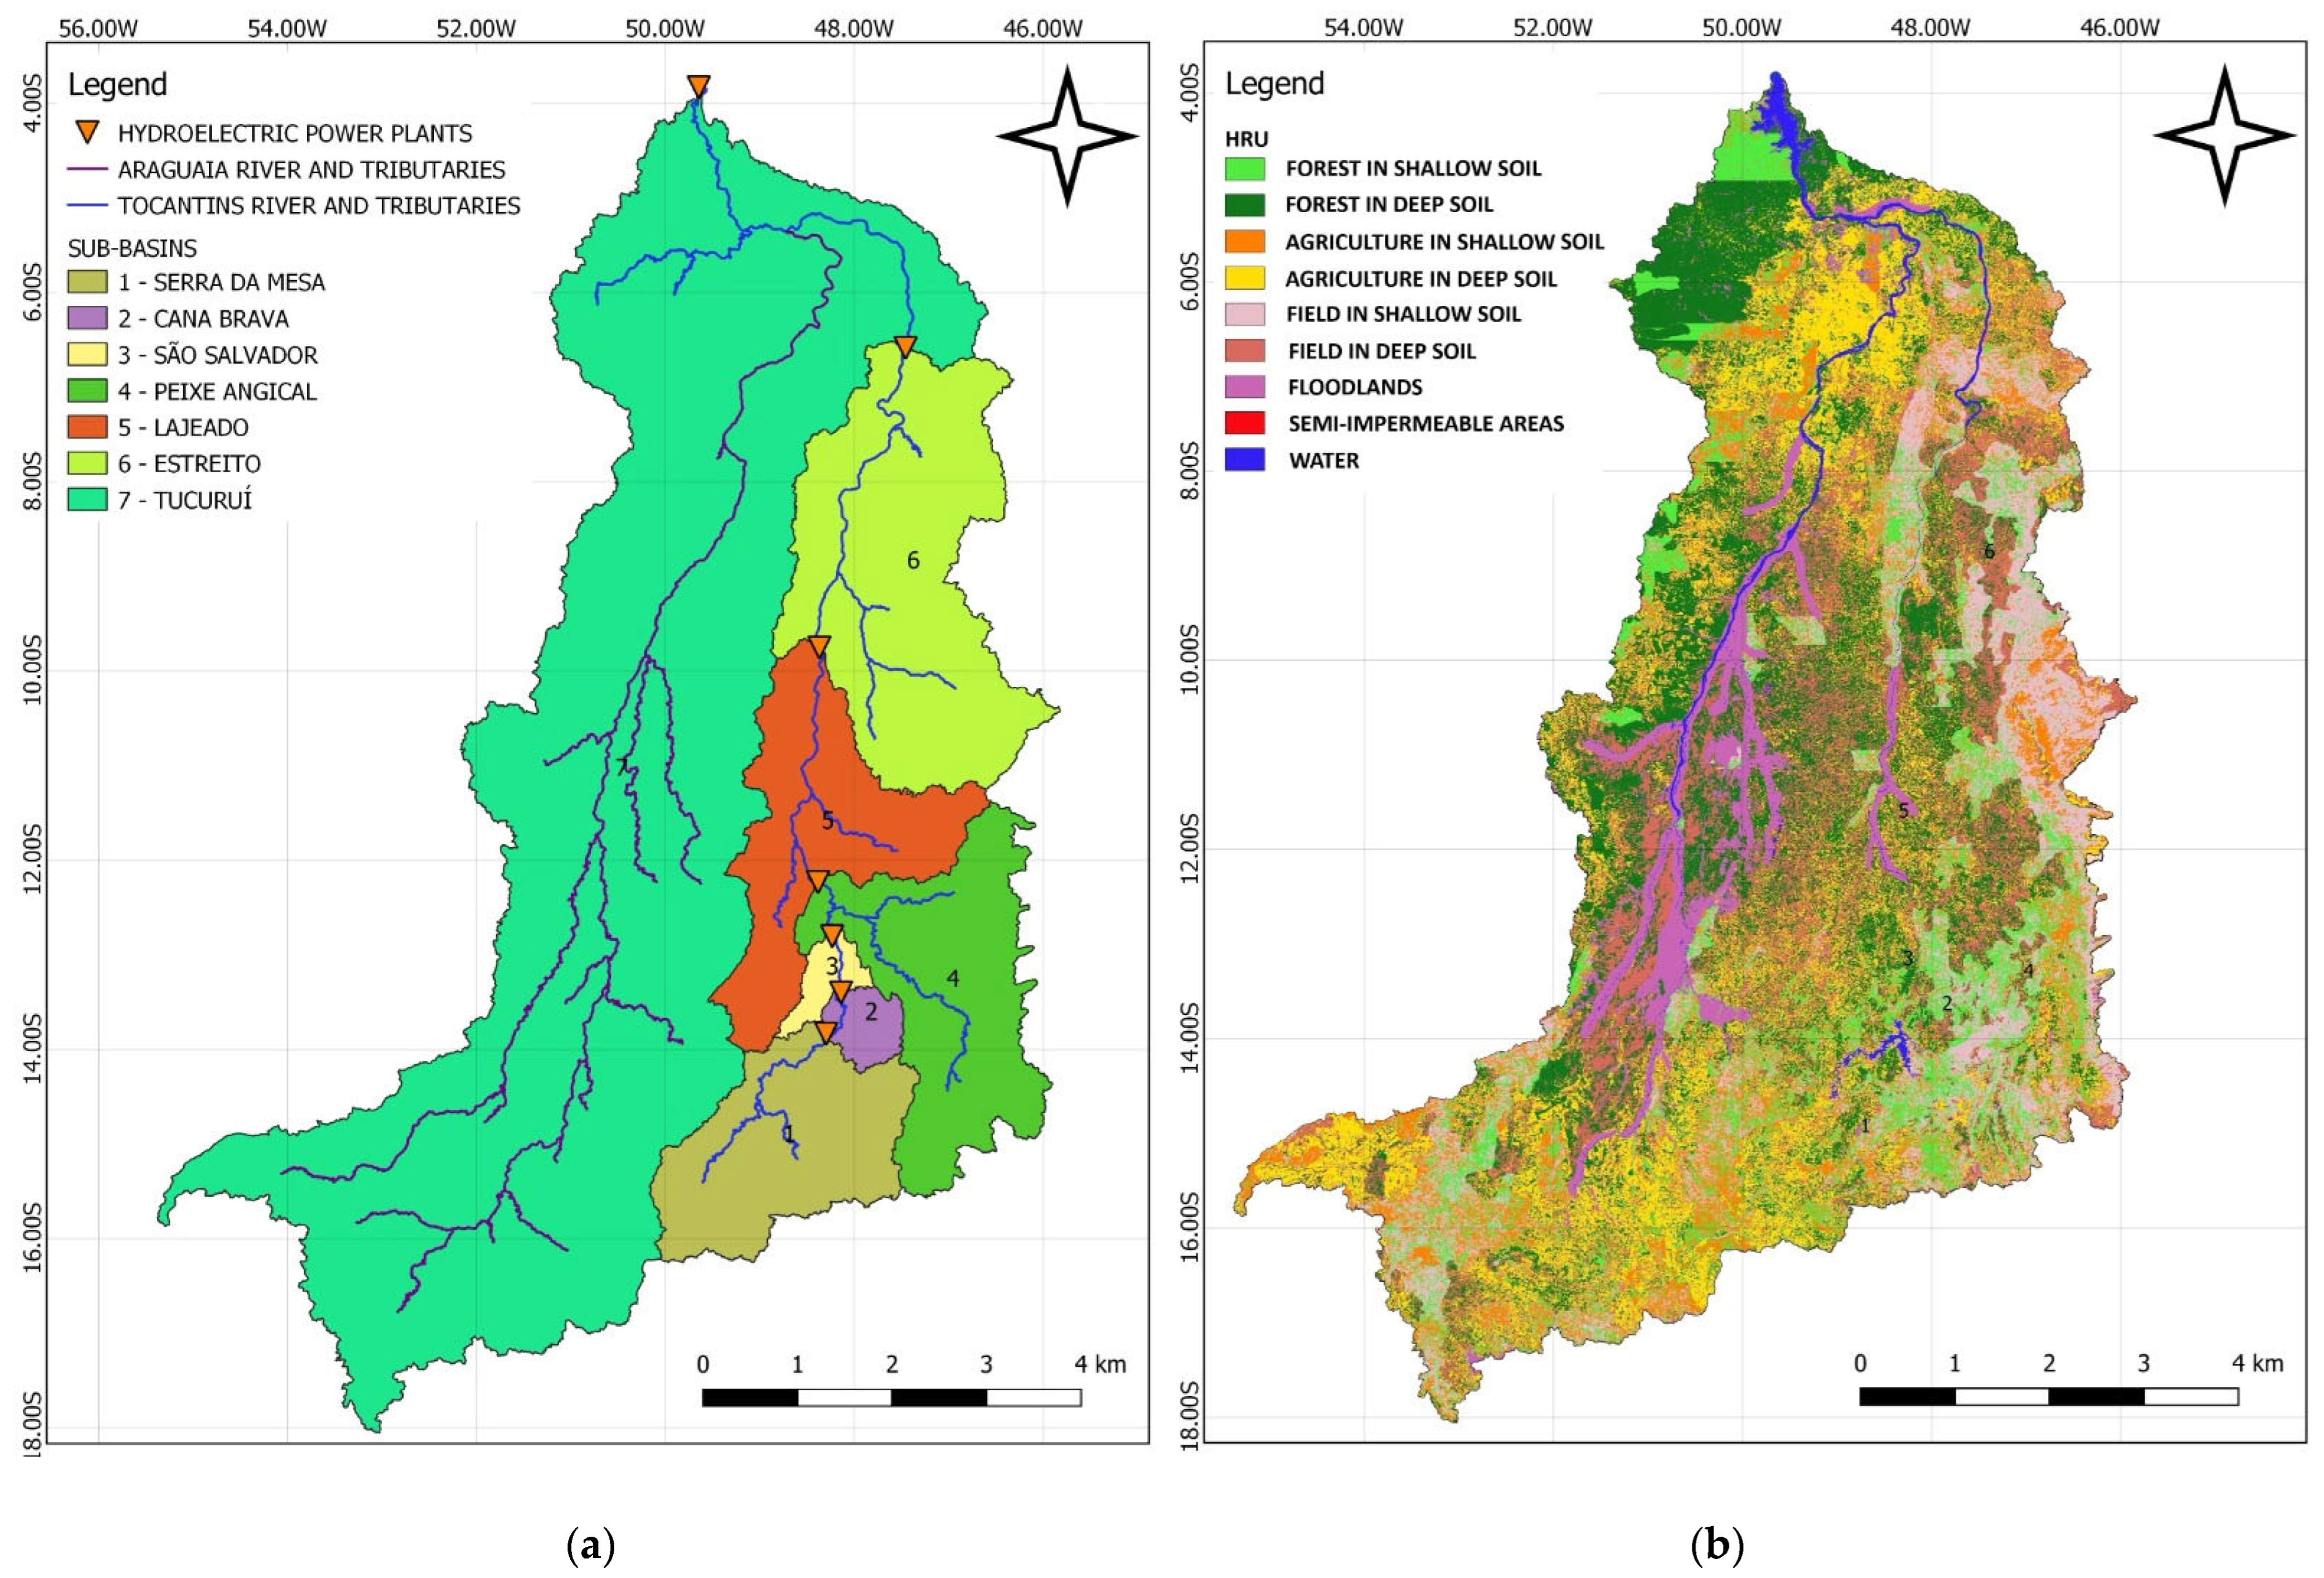
As MGB-IPH is a distributed model, the input information is discretized at different levels: the basin level, according to the boundaries shown in Figure 5, and the sub-basin level, obtained from points with flow measurements, i.e., fluviometric stations or, as in this study, hydroelectric dams. Calibration is carried out at this level, and simulated streamflows are also obtained (although it is possible to obtain the flow in any cell, even if they are not flow stations).
The third level is minibasins or cells, which are determined from the confluences of drainage sections or by minimum lengths chosen in the segmentation of the drainage network; in this work, the area was divided into 6072 minibasins. This is where water balance calculations and propagation in the drainage network take place. Within each minibasin, there is also a division into HRUs, as mentioned above and shown in Figure 5, where it can be seen that there are 9 classes.
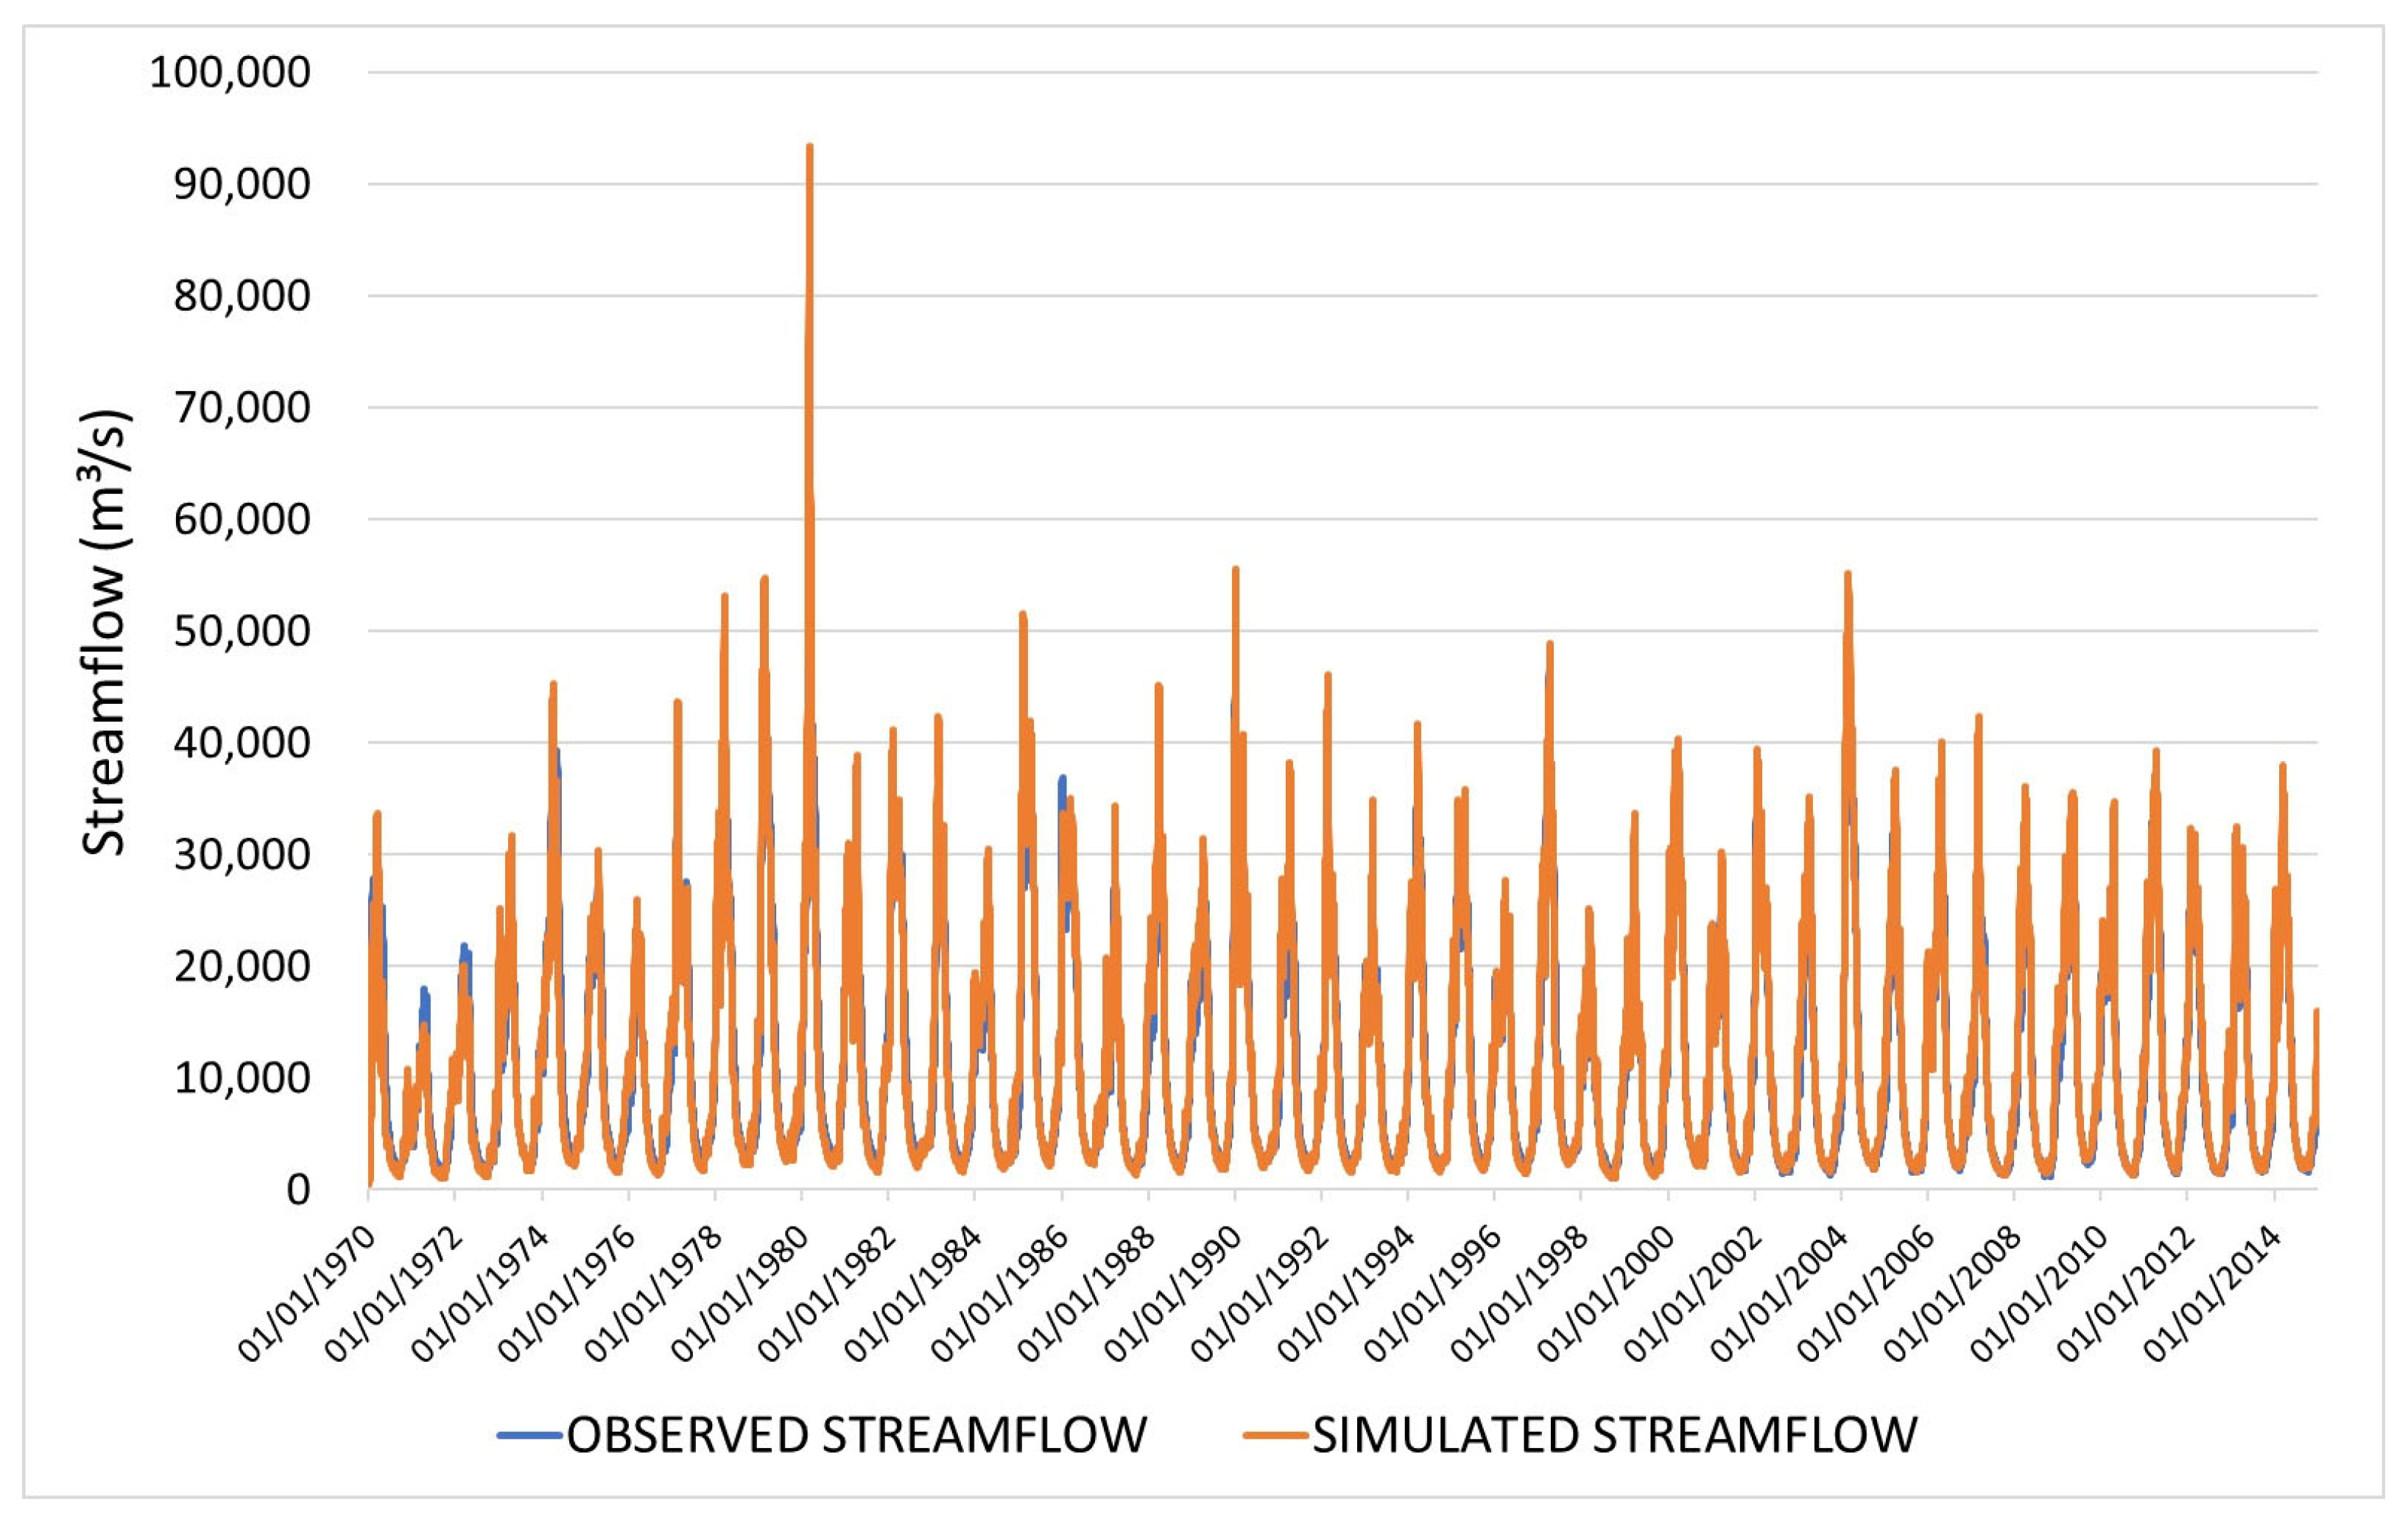
Once the MGB-IPH model had been fully adapted to the TARB, the parameters of the seven sub-basins were automatically calibrated. The results of the fit obtained can be seen in Table 3, which shows the efficiency statistics, where it can be seen that the fit can be classified as “very good” according to the classification in Table 3. Figure 6 shows the hydrograph of observed daily streamflows versus the streamflows simulated by the MGB-IPH model after calibration to Tucuruí HPP, corroborating the classification of the fit as very good, since there is adherence between the observed and simulated streamflow curves. More information about the calibration results of the MGB-IPH model to TARB, like parameter values, is available in Supplementary Materials.

3.2. Checking the Precipitation Bias of Climate Models for the Historical Period

The verification is performed as described in Section 2.4, comparing the streamflows simulated by the MGB-IPH model fed by observed rainfall with the simulated streamflows of the model now fed by rainfall from the NEX-GDDP/CMIP6 climate models. This type of procedure is necessary because the model has not been adjusted for the rainfall from the climate models, and therefore it is necessary to check for possible biases in the rainfall. The concern will not be with the daily values or the three efficiency statistics used by the MGB-IPH, but with the average values of simulated streamflows. From this verification, it is assumed that if the MGB-IPH model is able to adequately simulate streamflows being fed by rainfall from the climate models for the historical period, it will also be able to simulate streamflows for the future period (2015 to 2060) using the rainfall projected by the climate models.
The results presented in Figure 7 show that, on average, the climate models are able to represent streamflows quite satisfactorily, something that can be confirmed by the shape of the graphs. In general, the flows simulated with rainfall from the climate models overestimate the flows simulated with observed rainfall, in the months from March to June, with a few exceptions, such as in Figure 7d, where from May onwards, the flow simulated with rainfall from the climate models underestimates the flows simulated with observed rainfall, and in Figure 7e, where in almost all the months, the flows simulated with rainfall from the climate models underestimate the flows simulated with observed rainfall.
Considering the dry period from April to September and the wet period from October to March, the streamflows simulated by the climate models underestimate streamflows by 0.5% in the wet period and overestimate by 3.5% in the dry period for the ACCESS-ESM1-5 model; underestimate streamflows by 5.1% in the wet period and 4.8% in the dry period for the CanESM5 model; underestimate streamflows by 3.8% in the wet period and overestimate by 1, 2% in the dry period for the INM-CM4-8 model; underestimate streamflows by 6.7% in the wet period and 2.7% in the dry period for the IPSL-CM6A-LR model; and underestimate streamflows by 5% in the wet period and 4.1% in the dry period for the MPI-ESM1-2-HR model.
Although there are some differences between the streamflows simulated with rainfall from the climate models and the streamflows simulated with rainfall and observed rainfall, especially in the wet period (December to March), in general, the MGB-IPH model is considered to be able to represent this adequately and quite satisfactorily, since the variation in the simulations is within the MGB-IPH model adjustment error and within a limit of ±10%, which is considered acceptable.
The results are analyzed in terms of average values, since the projections do not reproduce streamflow events from specific periods, such as the driest or wettest years in the series. What is expected is that the projections satisfactorily represent the average characteristics of the period. Based on the results obtained, it is assumed that it is not necessary to correct for bias in the rainfall of climate models for the simulation of streamflows with MGB-IPH and that in the future, the model will continue to be able to simulate adequately.
Another measure that can be used to verify the simulations is the long-term average streamflow (QMLT) of the streamflow simulations with the observed rainfall and the rainfall from the climate models. The largest variation between the QMLTs was −10.5% for the IPSL-CM6A-LR model for sub-basin 6 (UHE Estreito) and the smallest variation was −0, 4% for the CanESM5 model in sub-basin 2 (HPP Cana Brava) and for INM-CM4-8 in sub-basin 3 (HPP São Salvador), for IPSL-CM6A-LR in sub-basin 2 (HPP Cana Brava), and +0.4% for the CanESM5 model in sub-basin 7 (HPP Tucuruí).
It should be noted that only rainfall bias was verified, and it was concluded that bias correction was not necessary. As mentioned, the statistical downscaling technique Bias Correction and Spatial Downscaling (BCSD) applied in the NEX-GDDP/CMIP project is a method that corrects biases in GCM results and then reduces the spatial scale to a more accurate resolution [3].
The mentioned verification was performed to check whether, on average, the MGB-IPH simulations with rainfall from climate models could be compared to simulations with observed rainfall from rain gauges. The objective was to infer that even if the hydrological model was not calibrated with rainfall from climate models, as the simulations adhered to the historical period in average terms, the projections would also adhere.

3.3. Projections for Consumptive Uses of Water

Projections for the consumptive use of water point to an increase in demand throughout Brazil [9]. The BHTA is no different, with projections indicating an increase in consumption for all sectors. Figure 8 shows three maps with the evolution (1940, 1980, and 2030) of water withdrawals by municipality.
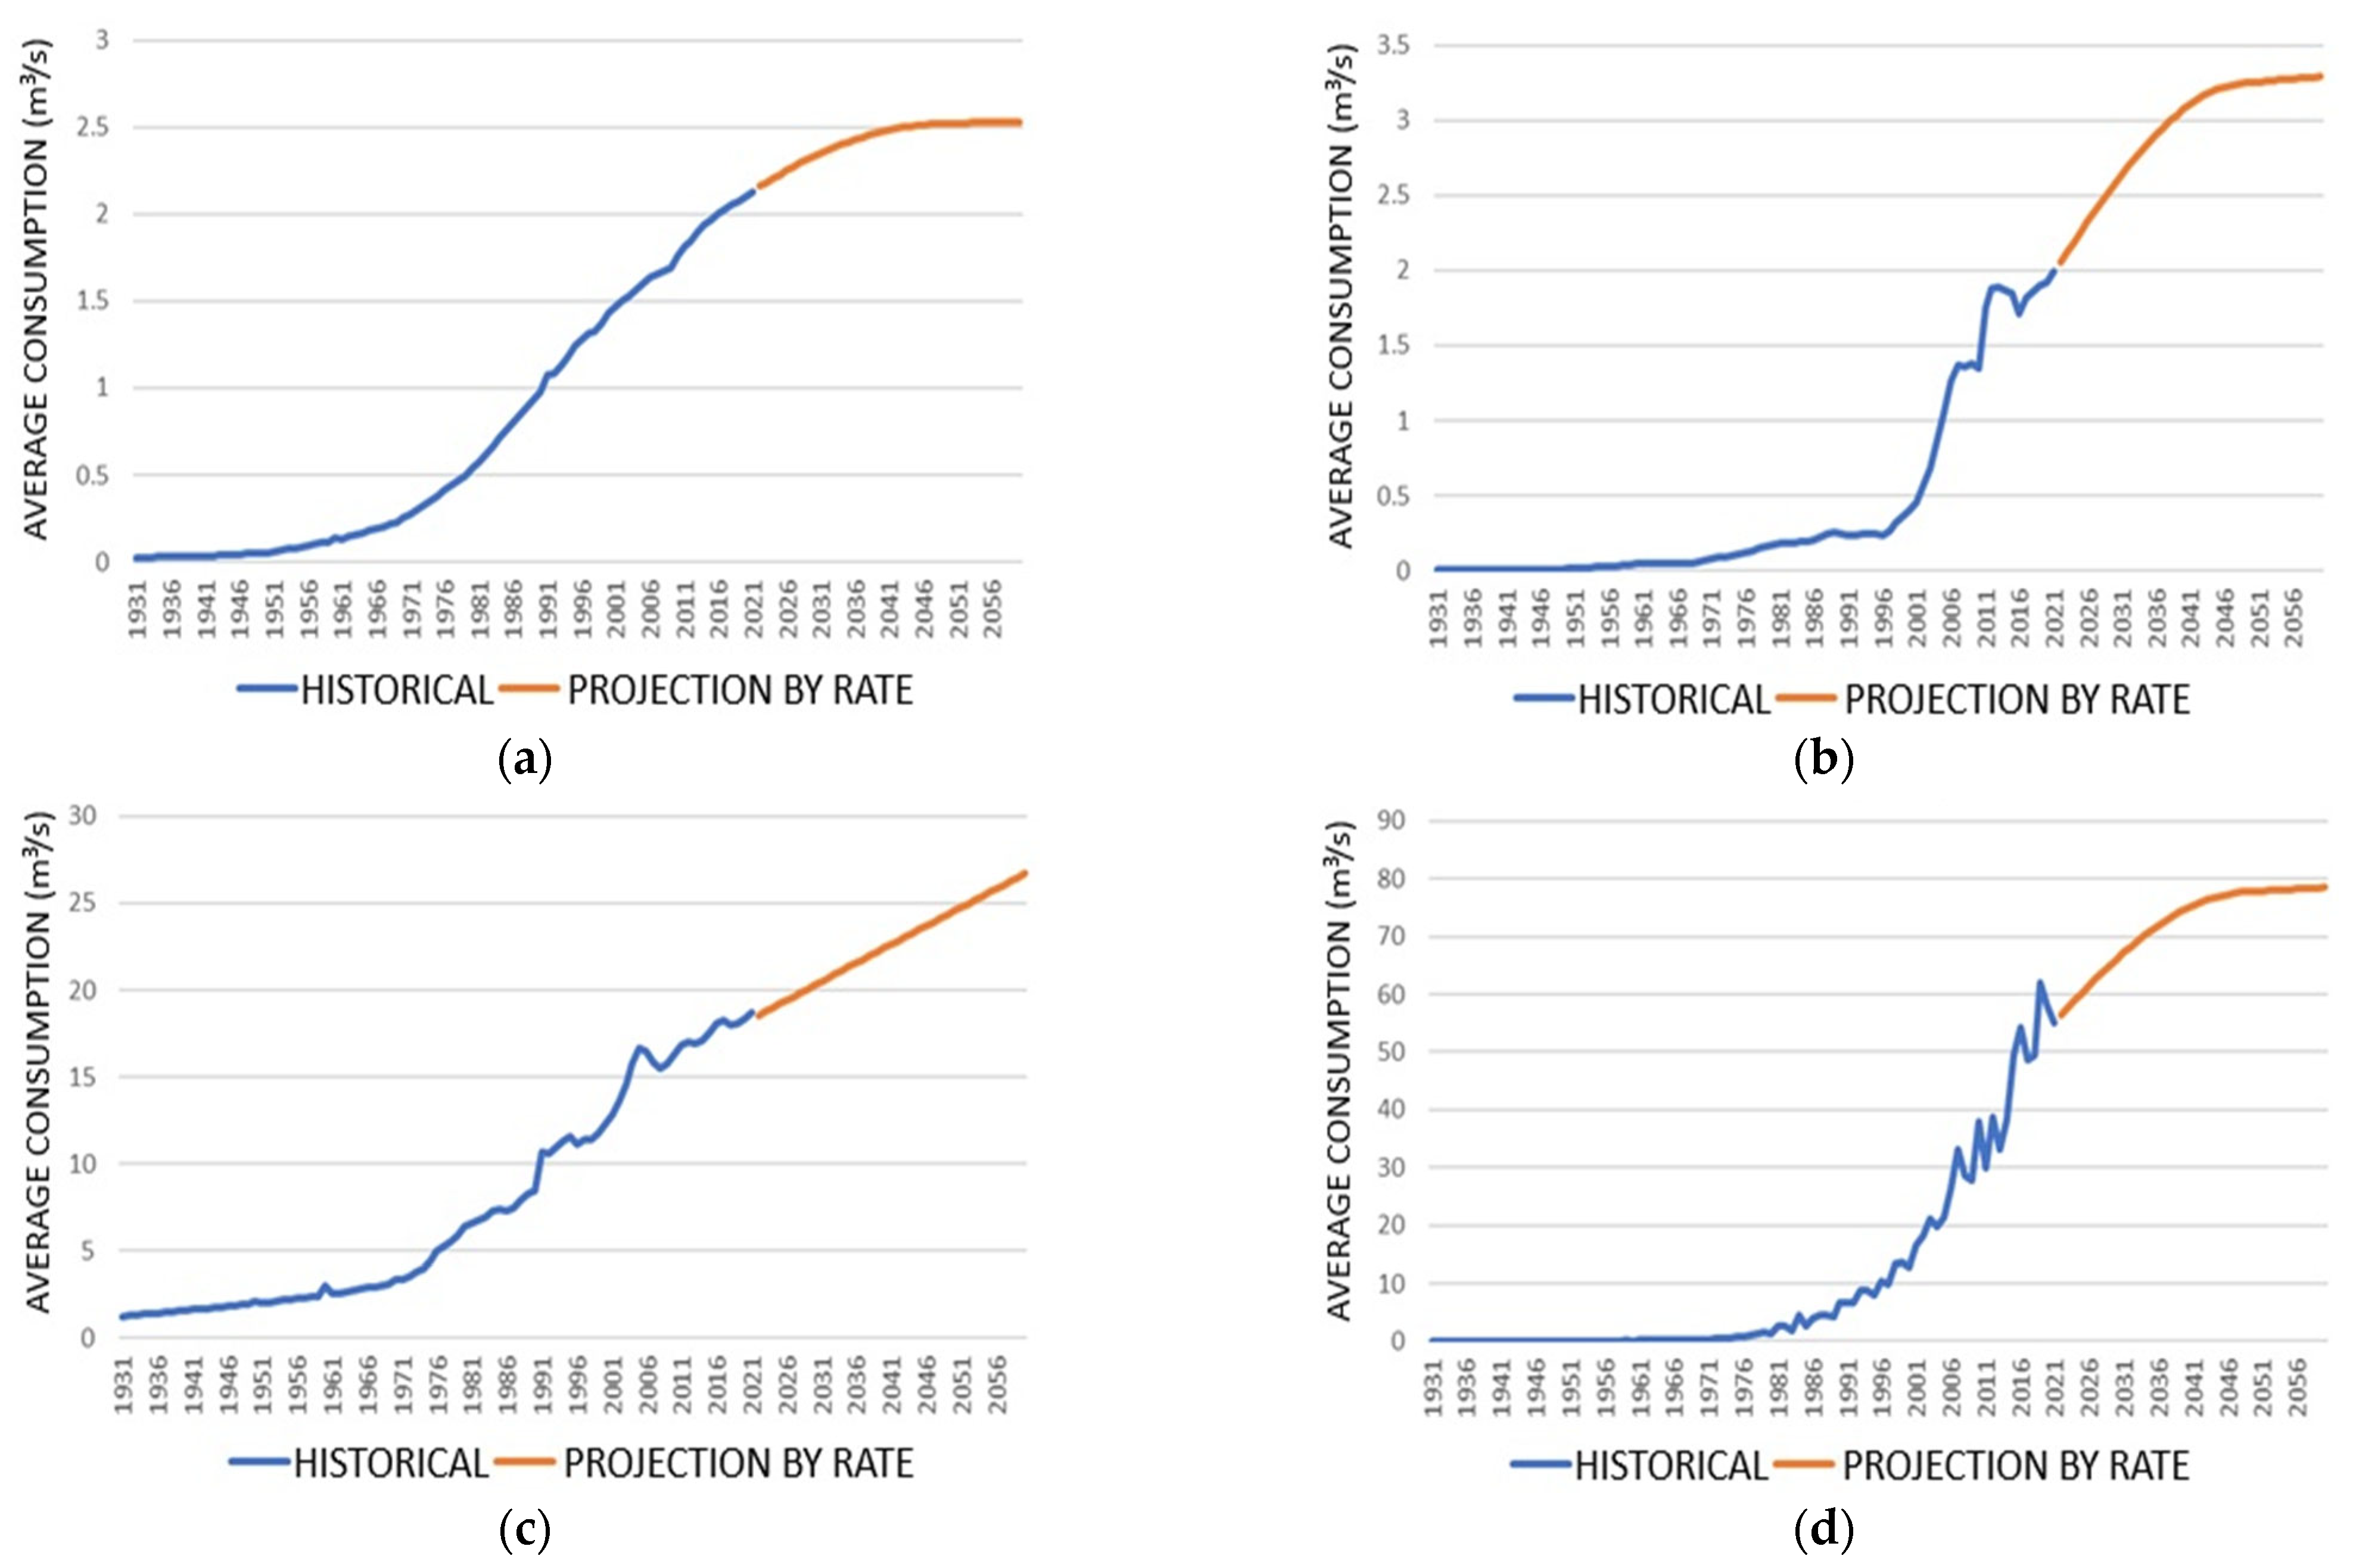
After applying the methodology described previously, in Figure 9a–d are presented the historical (1931–2021) and projected (2022–2060) series for urban human consumption, industry, animal watering, and irrigation, respectively, upstream of the Tucuruí HPP, where we can see the most pronounced growth in demand up to the year 2050, with a gradual variation as proposed in the work. There is an exception for the animal watering class, since this is not related to population growth, so the projection is simply made using the linear adjustment equation for the historical period.
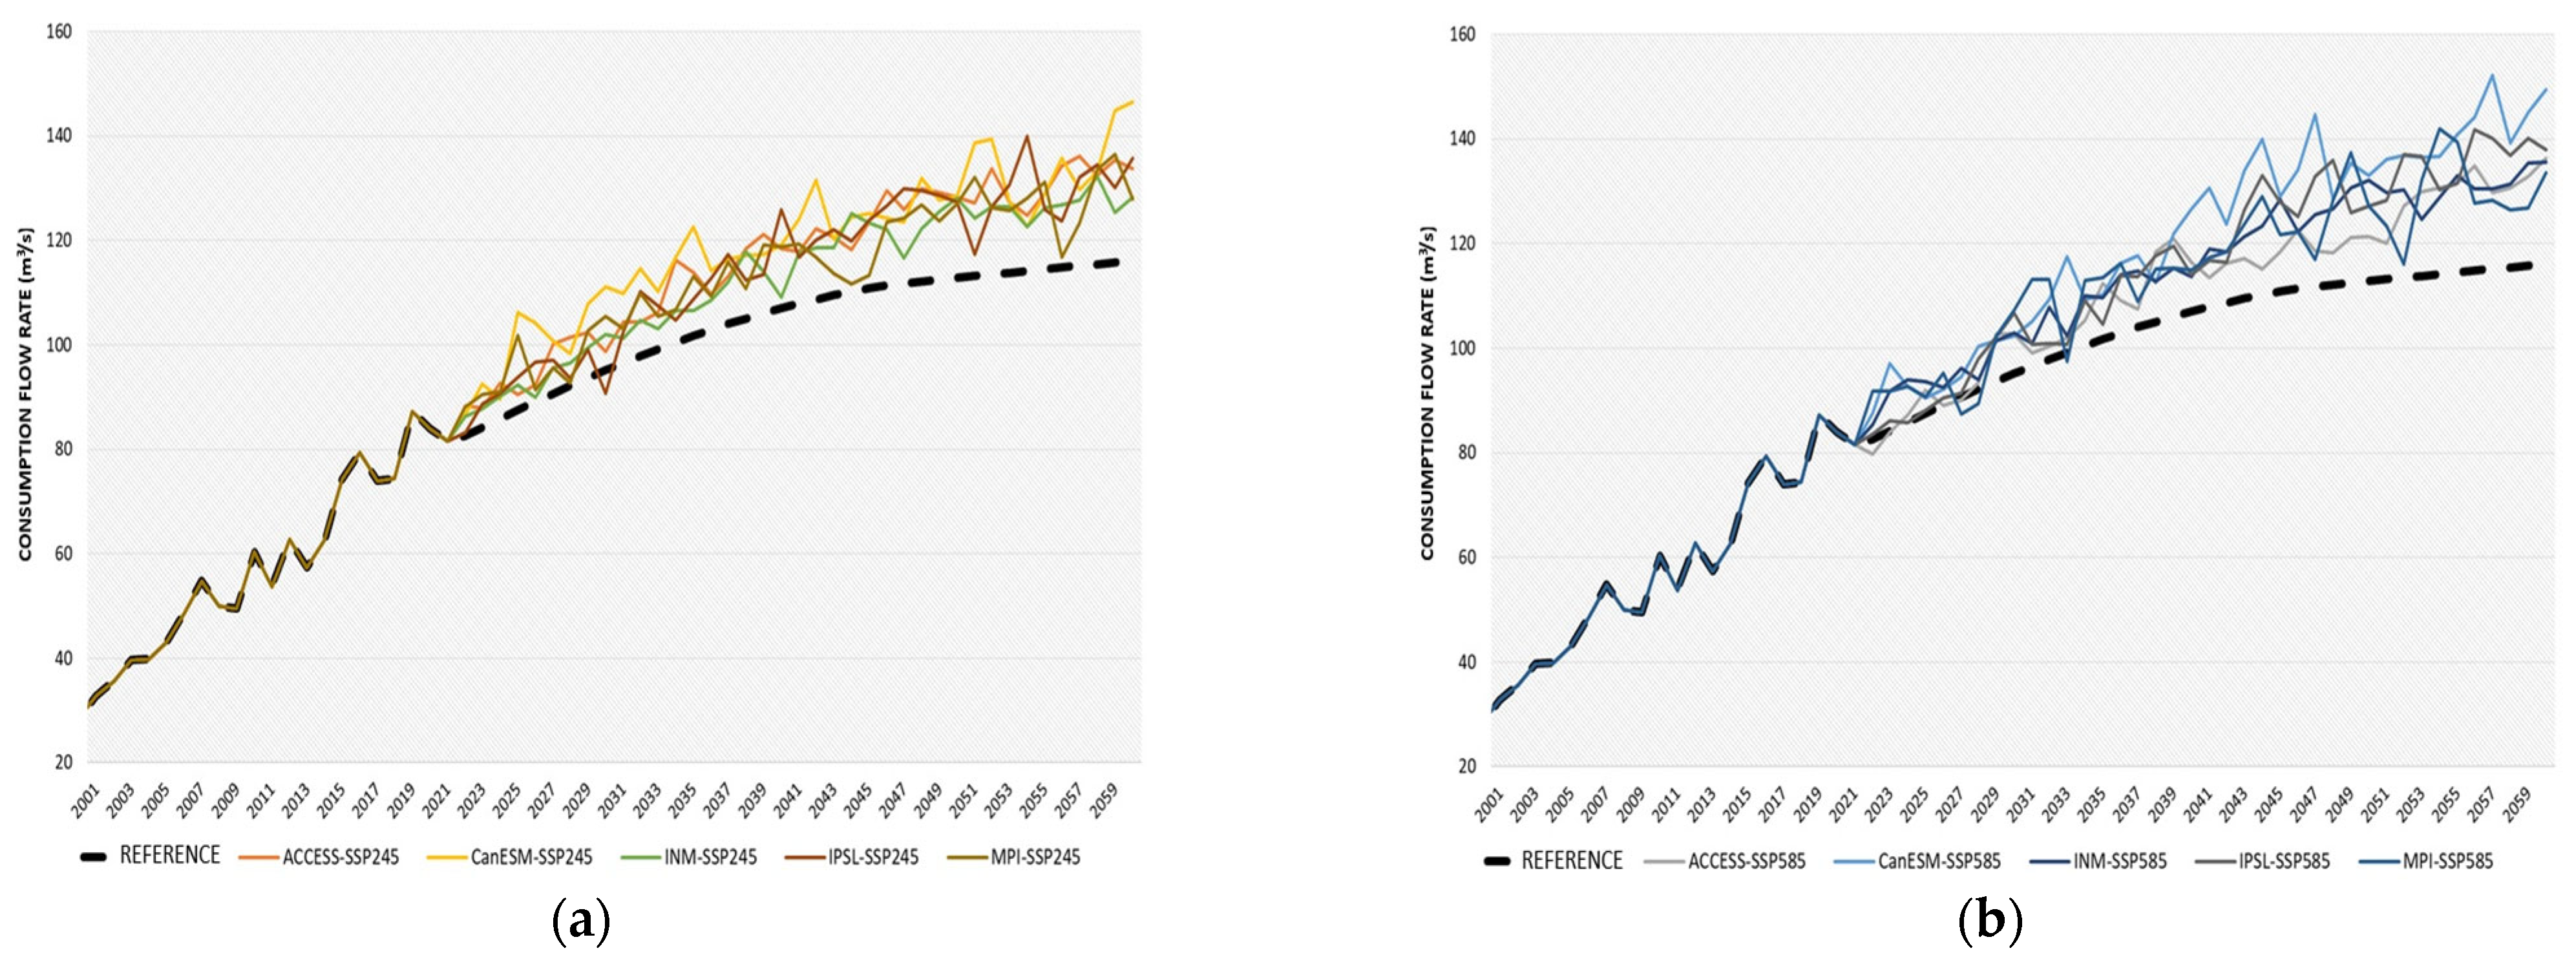
Average consumption upstream of the Tucuruí HPP is expected to reach 115 m3/s in 2060, increasing the demand seen in 2021 by 41%. Finally, the same methodology was applied to the seven TARB dams evaluated, and the results show the same results as for the Tucuruí HPP, differing only in the magnitude of average water consumption. Figure 10 shows the results for the Tucuruí HPP incremental basin (sub-basin 7). The dashed line is the reference scenario, with no climate change, and the other lines represent the same scenario with the influence of the projections from each of the climate models for the two emission scenarios (SSP2-4.5 and SSP5-8.5).

3.4. Streamflow Simulations for the Future Period

The future period of the NEX-GDDP/CMIP6 climate projections covers 2015 to 2100. The historical period from 1 January 1970 to 31 December 2014 and the future period from 1 January 2015 to 31 December 2060 will be used for the analysis. The results will be analyzed separately for the two emission scenarios, SSP2-4.5 and SSP5-8.5. To simplify the presentation and analysis of the results, the impacts on minimum, average, and maximum flows are presented below. Minimum flows are represented by the flow rate Q95%, which corresponds to the flow rate that remains 95% of the time in the time series. In other words, 95% of the time the flows are greater than Q95%. Average flows are represented by the average of the series and maximum flows by Q5%, which indicates a flow rate that is equaled or exceeded only 5% of the time.
The streamflow projections also point to changes in extreme flow patterns, which are even more pronounced. Figure 11a shows reductions in maximum streamflows (Q5%) for the ACCESS and CanESM models of 25% and 22%, respectively, in the SSP2-4.5 scenario for the Tucuruí HPP, while the INM model shows an increase of more than 10%. Still on the subject of maximum flows (Figure 11b), the downward trend is enhanced in the SSP5-8.5 scenario, with four models pointing to reductions (ACCESS and CanESM5 being even more significant), but the INM-CM4-8 model continues to point to an increase in flood flows of up to 20%.
Analyzing the minimum flows (Q95%), shown in Figure 11c,d, it can be seen that all the forecasts point to reductions in streamflows, and, as expected, these are of greater magnitude in the SSP5-8.5 emission scenario, with the ACCESS-ESM1-5 and CanESM5 models standing out, with reductions of approximately 75% and 85%, respectively. In the case of flow Q95, which is a flow during the river’s dry season, there is greater sensitivity to changes in climate variables. As can be seen in Figure 12, the scenarios show a very small absolute difference in relation to the historical data. However, these differences become significant when expressed in percentage terms. Therefore, these higher reductions should be viewed with caution, due to the considerable uncertainties involved in the models and scenarios used. Similar reductions in minimum streamflows have occurred in the past, particularly between 1949 and 1956.
Figure 12 shows the behavior of the permanence curve for the historical period (1970–2014) and the future period (2015–2060) of the Tucuruí HPP. It can be seen that depending on the climate model, the reductions in streamflows in the future period can be more or less intense. The ACCESS and CanESM models point to the greatest reductions. The SSP5-8.5 scenario also indicates slightly greater reductions than SSP2-4.5.
After removing the consumptive use portions of the natural flow series, the inflows are obtained. Figure 13 shows the effects of changes in water consumption patterns associated with climate change on the QMLTs of the São Salvador HPP and Tucuruí HPP. Withdrawals from consumptive uses represent reductions in QMLT of between 2.76% and 3.45% for the São Salvador HPP and reductions of between 0.64% and 0.83% for the Tucuruí HPP, depending on the model and emission scenario.
It can be seen that the estimates continue to be for reductions for four of the five models evaluated; however, the INM-CM4-8 model indicates a positive streamflow anomaly of approximately 10% for both emission scenarios for the Tucuruí HPP.
The ACCESS-ESM1-5 and CanESM5 models indicate the greatest reductions in streamflows in the future, with CanESM5 for the São Salvador HPP achieving reductions of around 60% after withdrawals of consumptive uses, something that was also verified for the CanESM5 model for the flow of two reservoirs analyzed in the São Francisco river basin [23], differing only in the magnitude of the negative anomaly, which was approximately 40%.
Figure 12 compares the results with and without water withdrawal. There are differences due to water withdrawal, but they are insignificant compared to the changes due to climate. Overall, the SSP5-8.5 scenario presents greater reductions in QMLT than the SSP2-4.5 scenario. In the case of the São Francisco River, there are also some cases of positive streamflow anomalies [23], with the IPSL-CM6A-LR model standing out, reaching approximately 10% average increase in future streamflows.
It can also be seen that the models were uncertain as to the sign and magnitude of the average streamflow anomalies for all the hydroelectric plants evaluated, but most of the indications were of reductions in QMLT, something also observed in other works [3,23], as well as in the extreme Q5% and Q95% streamflows, with the exception always being the INM model.
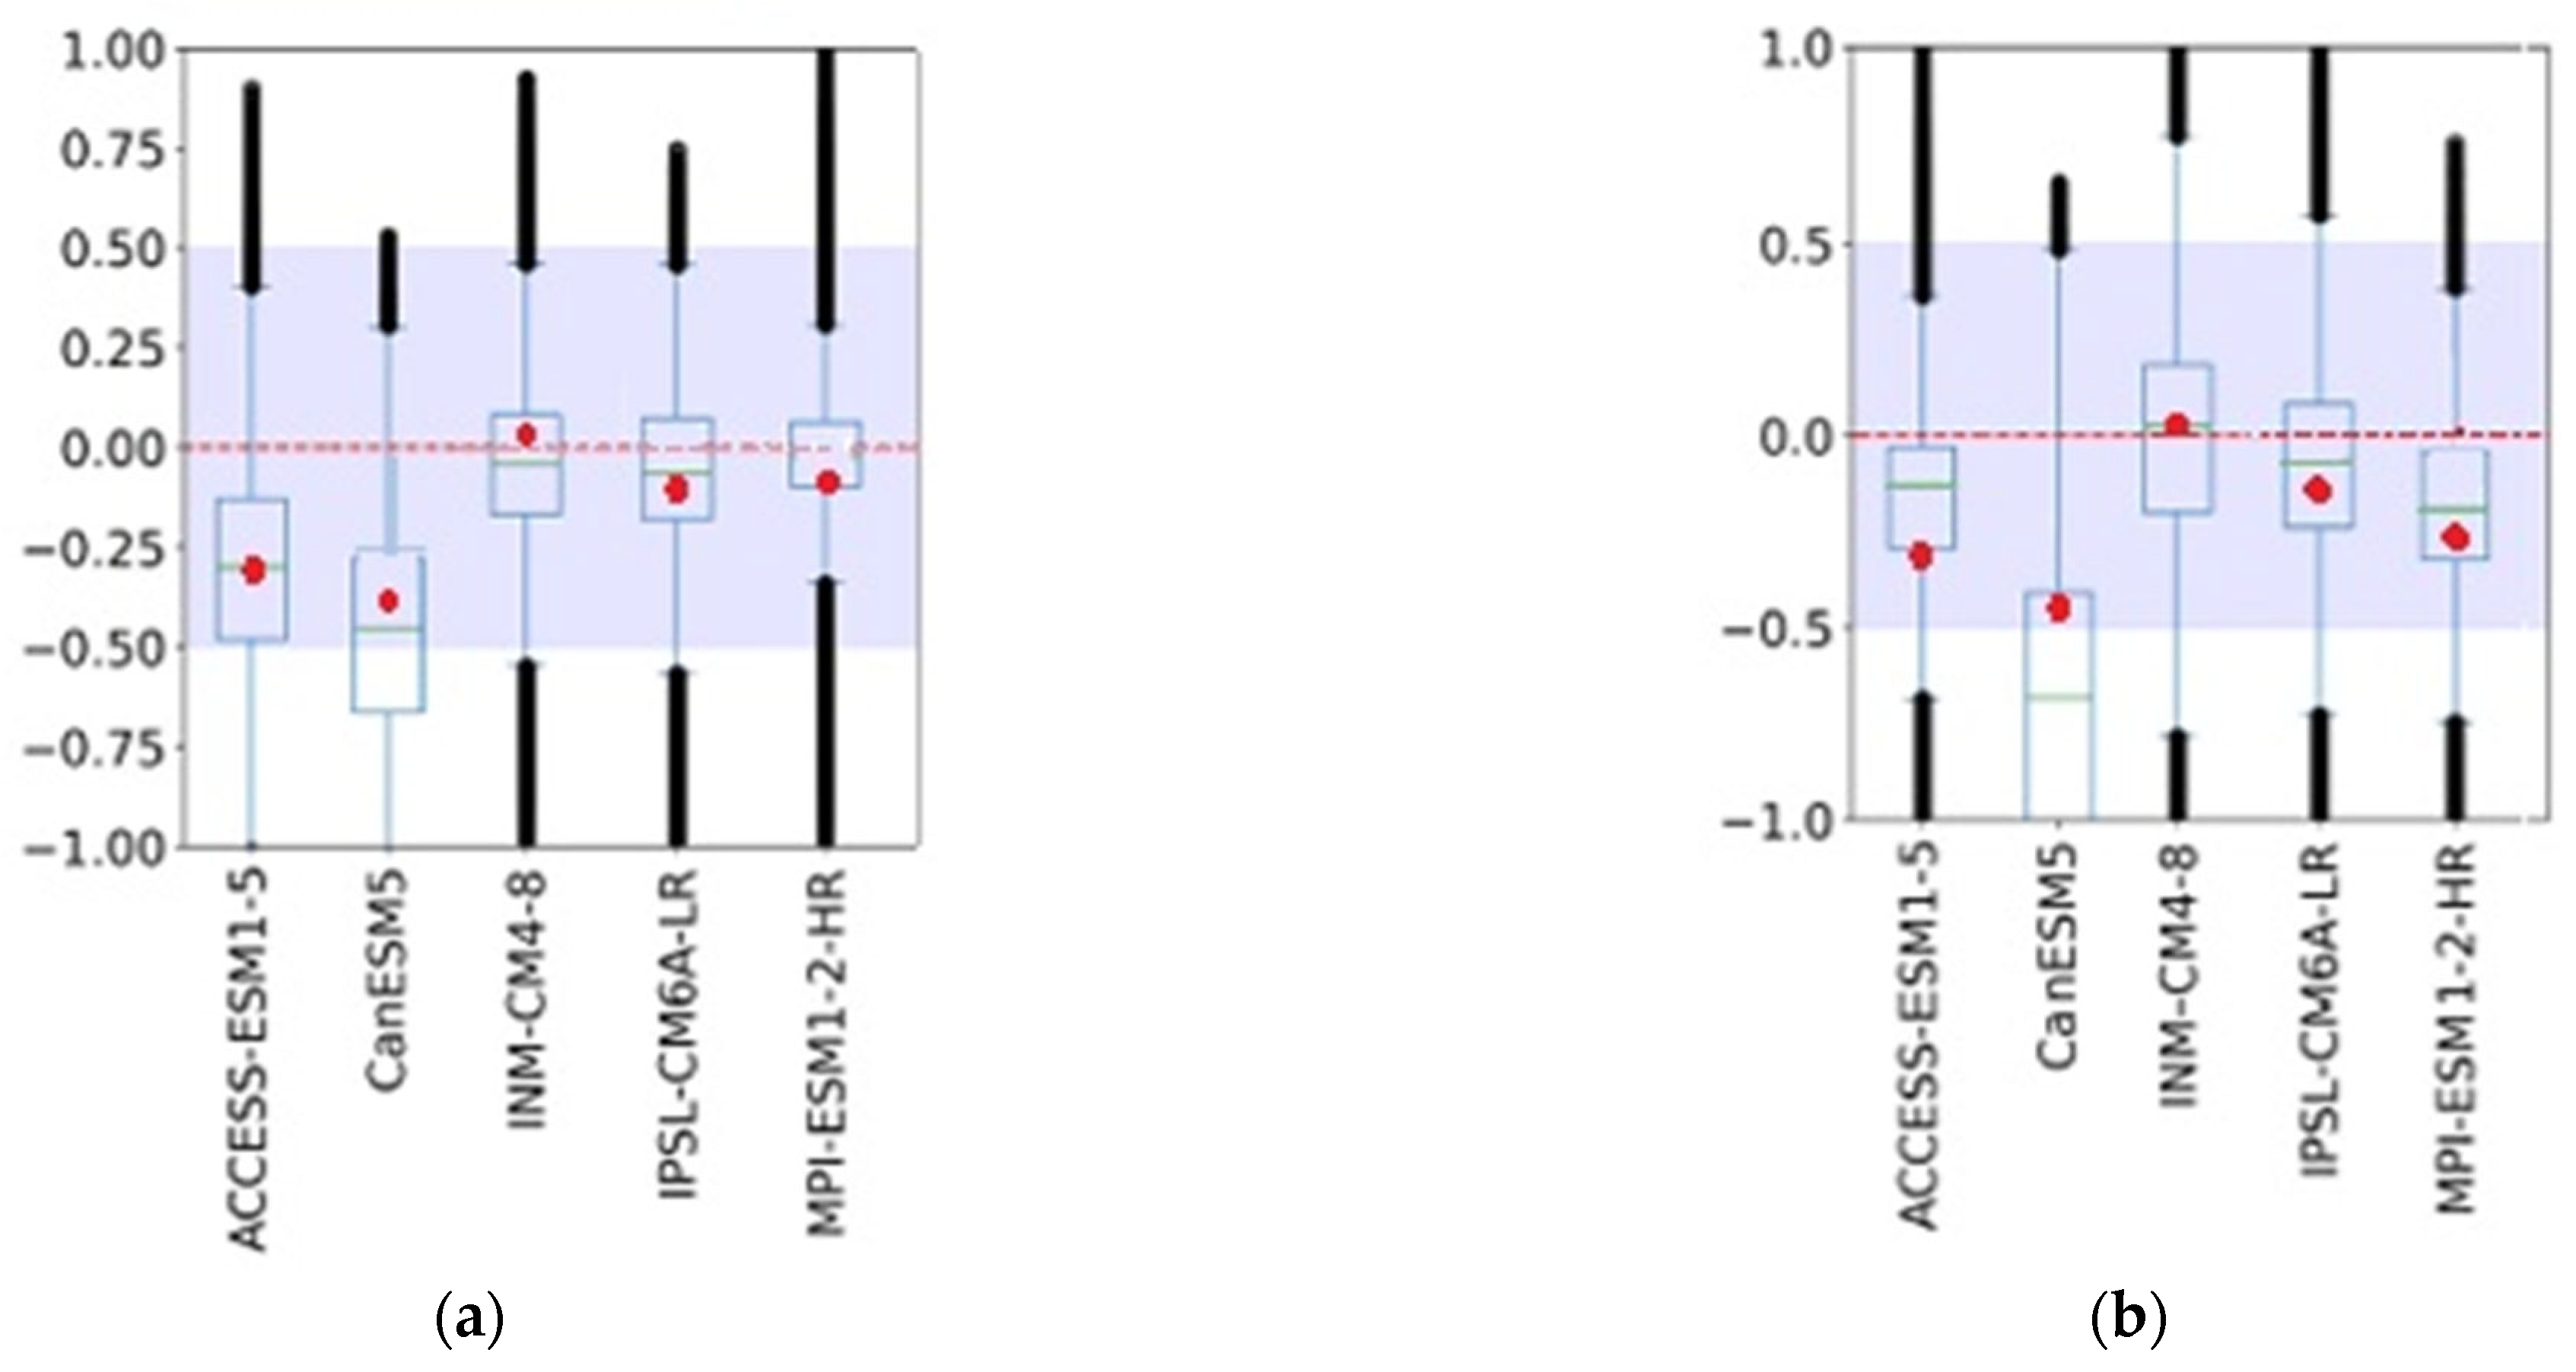
In an analysis of the 33 NEX-GDDP/CMIP6 models [3], average anomalies were generated for all the Brazilian Ottobasins; as shown in Figure 14, it can be seen that the ACCESS model showed a flow anomaly ranging from −50% to 22% and an average and mean of around −15%; the CanESM model ranged from −100% to 25% and averaged close to −27%; the INM model varied from −25% to 30% and averaged close to 1%; the IPSL model ranged from −55% to 50% and averaged close to −5%; and the MPI model ranged from −40% to 30% and averaged approximately −2% for the SSP2-4.5 scenario.
In the worst-case scenario (SSP5-8.5), the negative anomalies were of greater magnitude: the ACCESS model showed a flow anomaly ranging from −85% to 40% and averaging around −20%; in the CanESM model, the flow anomaly ranged from −100% to 20% and averaged close to −30%; in the INM model, the anomaly variation was from −30% to 30% and averaging close to 0%; in the IPSL model, it ranged from −30% to 50% and averaged close to 0%; and in the MPI model, it ranged from −30% to 25% and averaged approximately −5%. The average values from this work are shown in Figure 13 (red circles) for the period between 2041 and 2070, which confirms that the average values obtained in [3] are consistent with those obtained in this work.
Compared with the average results of the five models obtained by [3], it can be seen that the results of the streamflow anomalies obtained in this work are within the variation ranges of the models, corroborating the results found here.
Considering the average of the five climate models (ensemble), for Q5%, the variations are between −6.5% and −13% for the ensemble of the five models and scenario SSP2-4.5 and from −11.8% to −16.4% for the ensemble of the five models and scenario SSP5-8.5. QMLT varies between −13.2% and −19.4% for the ensemble of the five models and scenario SSP2-4. 5 and between −20% and −24.5% for the ensemble of the five models and scenario SSP5-8.5. With regard to Q95%, the variations are between −30.7% and −40.4% for the ensemble of the five models and scenario SSP2-4.5 and between −40.7% and −52.9% for the ensemble of the five models and scenario SSP5-8.5.
When we compare the results of similar assessments for the São Francisco river basin, we find that the Tocantins–Araguaia basin resulted in a greater decline in flows. These differences are related to the models and scenarios used in the studies but are also due to the physical and climatic characteristics. The São Francisco and Tocantins–Araguaia basins have striking climatic contrasts. São Francisco has a semi-arid climate in the Northeast (500–800 mm/year) and a more humid climate in the upper course (1000–1500 mm/year), with prolonged droughts that affect hydroelectric plants such as Sobradinho. Tocantins–Araguaia, under Amazonian influence, has a humid tropical climate (1500–2500 mm/year). While São Francisco depends on the ZCAS and is vulnerable to Atlantic warming, Tocantins is more stable but sensitive to deforestation in the Amazon. Prolonged periods of drought are common in the São Francisco River, and future scenarios only increase this characteristic a little further. In the case of the Tocantins–Araguaia River, future scenarios with reduced rainfall may bring impacts that are not yet known, due to the sensitivity of the transition ecosystem between the Amazon and Cerrado biomes [8].
It is important to highlight that despite the significant growth in water demand throughout the basin, for large hydroelectric plants, the major impact does not stem from the water consumption analyzed here. The greatest impact stems from climate change, mainly from the volume of rainfall over the basin. The greatest risk lies in the dry season, which often significantly reduces streamflow. As the largest water withdrawals tend to occur during this period, there will be an increased risk of conflicts over water use. In addition, for small hydroelectric plants, not analyzed in this study, the impacts of water consumption are greater, since water consumption for irrigation tends to be concentrated in areas with small rivers.
Considering the results obtained, it is important to highlight the need to adapt hydroelectric generation to climate change. An important measure is to combine energy diversification, operational modernization, and sustainable resource management. Integration with complementary renewable sources (solar and wind) and hybrid systems (such as floating hydro-solar plants) reduces exclusive dependence on hydrological regimes. Operational efficiency can be improved with turbines adapted to low flows and advanced hydrological forecasting models. Adaptive reservoir management and coordination between cascade plants help to balance supply and demand.
No less importantly, the conservation of river basins, through reforestation and erosion control, maintains river flow and reduces reservoir silting. Investing in resilient infrastructure, such as small hydroelectric plants (SHPs) and multifunctional dams (for irrigation and supply), also increases water security. Furthermore, public policies must review granting criteria and create contingency plans for droughts, ensuring backup energy (thermal power plants) in emergencies.

4. Conclusions

Considering that the fit of distributed hydrological models is strongly dependent on the quality of the available data, including its spatial and temporal distribution, the model’s fit can be considered very good, as indicated by the NS and NSLog statistics, which were higher than 0.90 for the historical period (1970 to 2014). When checking for biases, these were not found since the average monthly streamflows were consistent, with some minor problems in the maximum streamflows, which can be associated with the error in the adjustment of the MGB-IPH. With this, it can be inferred that the hydrological model will also be able to adequately simulate streamflows in the future (2015 to 2060) without the need to correct for biases in rainfall from climate models.
Simulations of the future horizon indicate reductions in the streamflows of the TARB hydroelectric dams analyzed in this study. The CanESM and ACCESS models showed the greatest negative anomalies in streamflows for all the dams, but the other models, with a few exceptions, agreed with the reduction in streamflows. As expected, the high GHG emissions scenario (SSP5-8.5) shows even more significant reductions in streamflows when compared to the intermediate emissions scenario (SSP2-4.5).
The demand for consumptive uses in the BHTA show growth from the historical period to the future period, with highlights for the irrigation, animal watering, and mining classes, which practically double their consumption by 2060. When the flows from consumptive uses of water were subtracted from the series of streamflows from the reservoirs, it was noted that the anomalies became even more negative, reaching a maximum reduction of 4%. However, the effects of water demand cannot be compared to the effects of climate change, especially in the ACCESS and CanESM models, which pointed to reductions of more than 50%.
Although the results obtained here confirm those of other studies, it is recommended that further analysis be carried out in order to better quantify the uncertainties of the projections and the combined impacts of climate change and anthropogenic alterations in the basin. Other recommendations include the use of a greater number of CMIP6 climate models, the application of more detailed spatial resolution projections through statistical downscaling, and testing alternative scenarios for consumptive water use projections, including projections from dynamic land use models, among other analyses that could be implemented. Finally, it is important to assess the impacts on hydroelectric power generation in the basin, which occupies an important place in the Brazilian energy matrix.

Supplementary Materials

The following supporting information can be downloaded at: https://doi.org/10.13140/RG.2.2.22336.65289.

Author Contributions

Conceptualization, B.C.d.S., J.W.M.d.L. and F.O.P.; methodology, B.C.d.S. and F.O.P.; software, P.H.G.M., M.d.A.B. and R.M.M.; validation, B.C.d.S.; formal analysis, F.O.P.; writing—original draft preparation, F.O.P.; writing—review and editing, B.C.d.S., J.W.M.d.L., F.O.P., P.H.G.M., M.d.A.B. and R.M.M.; funding acquisition, B.C.d.S. and J.W.M.d.L. All authors have read and agreed to the published version of the manuscript.

Funding

This research was funded by the Conselho Nacional de Desenvolvimento Científico e Tecnológico—CNPq, processo n. 140251/2021-9 (Edtal MAI/DAI 2020).

Data Availability Statement

Data will be made available on request.

Acknowledgments

We are grateful to the Agência Nacional de Águas (ANA, National Water Agency) for generously providing the data from rainfall stations and streamflow stations, and for consumptive use data for the Tocantins–Araguaia river basin.

Conflicts of Interest

The authors declare no conflicts of interest.

References

  1. Zákhia, E.M.S.; Alvarenga, L.A.; Tomasella, J.; Martins, M.A.; Santos, A.C.N.; Melo, P.A. Impactos das Mudanças Climáticas em uma Bacia Hidrográfica no Sul do Estado de Minas Gerais. Rev. Bras. Meteorol. 2021, 36, 667–681. [Google Scholar] [CrossRef]
  2. Silva, M.V.M.; Marcos Júnior, A.D.; Silva, G.K.; Nóbrega, M.R.R.; Lima, C.E.S.; Silveira, C.S. Impacto dos cenários de mudanças climáticas e demandas consuntivas no desempenho dos reservatórios do rio São Francisco, Brasil. In Proceedings of the XXIV Simpósio Brasileiro de Recursos Hídricos, Belo Horizonte, Brazil, 21–26 November 2021; Available online: https://anais.abrhidro.org.br/job.php?Job=13446 (accessed on 12 January 2025).
  3. ANA. Agência Nacional de Águas e Saneamento Básico. Impacto da Mudança Climática nos Recursos Hídricos do Brasil. 2024. Available online: https://metadados.snirh.gov.br/geonetwork/srv/api/records/31604c98-5bbe-4dc9-845d-998815607b33/attachments/Mudancas_Climaticas_25012024.pdf (accessed on 14 January 2025).
  4. Marengo, J.A. Água e mudanças climáticas. Estud. Avançados 2008, 22, 83–96. [Google Scholar] [CrossRef]
  5. Artaxo, P. Biomas brasileiros e as mudanças climáticas: Políticas de adaptação ao novo clima, consequentes e baseadas em ciência, são necessárias e urgentes. Cienc. Cult. 2023, 75, 1–8. Available online: https://revistacienciaecultura.org.br/?artigos=biomas-brasileiros-e-as-mudancas-climaticas (accessed on 5 January 2025). [CrossRef]
  6. da Silva, R.O.B.; Montenegro, S.M.G.L.; de Souza, W.M. Tendências de mudanças climáticas na precipitação pluviométrica nas bacias hidrográficas do estado de Pernambuco. Eng. Sanit. Ambient. 2017, 22, 579–589. [Google Scholar] [CrossRef]
  7. EPE. Empresa DE Pesquisa Energética. Balanço Energético Nacional. 2024. Available online: https://www.epe.gov.br/pt/publicacoes-dados-abertos/publicacoes/balanco-energetico-nacional-2024 (accessed on 3 January 2025).
  8. Serrão, E.A.d.O.; Pontes, P.R.M.; Cavalcante, R.B.L.; Xavier, A.C.F.; Ferreira, T.R.; Terassi, P.M.d.B. Hydrological processes in a watershed on the transition from Amazon to Cerrado in Brazil. J. S. Am. Earth Sci. 2023, 129, 104507. [Google Scholar] [CrossRef]
  9. Moreira, J.P.P.C.; Pedreno, G.Y.O.; Bruce Neta, I.B.; Souza, R.J.; Alves, N.S.; Silva, J.S. Gestão e usos consuntivos da água: Comparativo entre Brasil, Amazonas e Manaus. In Proceedings of the XXIV Simpósio Brasileiro de Recursos Hídricos, Belo Horizonte, Minas Gerais, Brazil, 21–26 November 2021; Available online: https://anais.abrhidro.org.br/job.php?Job=13329 (accessed on 7 January 2025).
  10. ANA—Agência Nacional de Águas e Saneamento Básico. Usos Consuntivos da Água no Brasil: Usos Consuntivos à Montante. 2019. Available online: https://metadados.snirh.gov.br/geonetwork/srv/por/catalog.search#/metadata/c239a66f-6b41-4b7e-9790- (accessed on 3 January 2025).
  11. Lima, J.W.M.; Collischonn, W.; Marengo, J.A. Efeitos das Mudanças Climáticas na Geração de Energia Elétrica, 1st ed.; AES Tietê: São Paulo, Brasil, 2014; 360p. [Google Scholar]
  12. Moura, C.N.; Mine, M.R.M.; Kaviski, E. Incertezas e impactos de mudanças climáticas nos recursos hídricos. In Anais do XXVIII Congresso Latinoamericano de Hidráulica—Hidrologia Superficial e Subterrânea, Proceedings of the XXVIII Congresso Latinoamericano de Hidráulica, Buenos Aires, Argentina, 18–21 September 2018; Argentina.gob.ar: Buenos Aires, Argentina, 2018; Volume 2, pp. 1402–1413. [Google Scholar]
  13. Ahialey, E.K.; Kabo–Bah, A.T.; Gyamfi, S. Impacts of LULC and climate changes on hydropower generation and development: A systematic review. Heliyon 2023, 9, e21247. [Google Scholar] [CrossRef]
  14. Santana, T.B.; Silva, B.C.; Santos, A.H.M. Estimativa de impactos de mudanças climáticas em bacias do Atlântico Leste. In Proceedings of the XX Simpósio Brasileiro de Recursos Hídricos, Bento Gonçalves, Brazil, 17–22 November 2013; Available online: https://www.abrhidro.org.br/SGCv3/publicacao.php?PUB=3&ID=155&SUMARIO=3451&ST=estimativa_de_impactos_de_mudancas_climaticas_em_bacias_do_atlantico_leste (accessed on 9 January 2025).
  15. Silveira, C.S.; Souza Filho, F.A.; Porto, V.C.; Cabral, S.L.; Lemos, W.E.D. Análise das projeções de vazão sobre as principais bacias do setor elétrico brasileiro usando dados provenientes do CMIP5 para o canário RCP8.5 para o século XIX. In Proceedings of the XX Simpósio Brasileiro de Recursos Hídricos, Bento Gonçalves, Brazil, 17–22 November 2013. [Google Scholar]
  16. Avesani, D.; Galletti, A.; Piccolroaz, S.; Bellin, A.; Majone, B. A dual-layer MPI continuous large-scale hydrological model including Human Systems. Environ. Model. Softw. 2021, 139, 105003. [Google Scholar] [CrossRef]
  17. Miller, O.L.; Putman, A.L.; Alder, J.; Miller, M.; Jones, D.K.; Wise, D.R. Changing climate drives future streamflow declines and challenges in meeting water demand across the southwestern United States. J. Hydrol. X 2021, 11, 100074. [Google Scholar] [CrossRef]
  18. Ahmadzadeh, H.; Mansouri, B.; Fathian, F.; Vaheddoost, B. Assessment of water demand reliability using SWAT and RIBASIM models with respect to climate change and operational water projects. Agric. Water Manag. 2022, 261, 107377. [Google Scholar] [CrossRef]
  19. Nazemi, A.; Wheater, H.S. On inclusion of water resource management in Earth system models—Part 1: Problem definition and representation of water demand. Hydrol. Earth Syst. Sci. 2015, 19, 33–61. [Google Scholar] [CrossRef]
  20. Cheng, T.; Wang, J.; Sui, J.; Zhao, H.; Hao, Z.; Huang, M.; Li, Z. A New Approach for Assessing Heat Balance State along a Water Transfer Channel during Winter Periods. Water 2022, 14, 3269. [Google Scholar] [CrossRef]
  21. Brêda, J.P.L.F.; de Paiva, R.C.D.; Collischon, W.; Bravo, J.M.; Siqueira, V.A.; Steinke, E.B. Climate Change impacts on South American Water Balance from a continental-scale hydrological model driven by CMIP5 projections. Clim. Change 2020, 159, 503–522. [Google Scholar] [CrossRef]
  22. da Silva, M.V.M.; Silveira, C.d.S.; da Silva, G.K.; Pedrosa, W.H.d.V.; Júnior, A.D.M.; Filho, F.d.A.S. Projections of climate change in streamflow and affluent natural energy in the Brazilian hydroelectric sector of CORDEX models. Rev. Bras. Recur. Hídricos 2020, 25, 1–15. [Google Scholar] [CrossRef]
  23. da Silva, M.V.M.; Lima, C.E.S.; Silveira, C.d.S. Impact of Climate Change and Consumptive Demands on the Performance of São Francisco River Reservoirs, Brazil. Climate 2023, 11, 89. [Google Scholar] [CrossRef]
  24. Bartkowiak, P.; Castelli, M.; Notarnicola, C. Downscaling Land Surface Temperature from MODIS Dataset with Random Forest Approach over Alpine Vegetated Areas. Remote Sens. 2019, 11, 1319. [Google Scholar] [CrossRef]
  25. Kumar, J.; Brooks, B.-G.J.; Thornton, P.E.; Dietze, M.C. Sub-daily statistical downscaling of meteorological variables using neural networks. Procedia Comput. Sci. 2012, 9, 887–896. [Google Scholar] [CrossRef]
  26. Lima, J.P.R.; Alves, J.M.B. Um estudo de downscaling dinâmico de precipitação intrasazonal acoplado a modelo chuva-vazão na bacia hidrográfica Alto-Médio São Francisco. Rev. Bras. Meteorol. 2009, 24, 323–338. [Google Scholar] [CrossRef]
  27. GeoAplicada. Zonas Climáticas do Brasil (Köppen). 2021. Available online: https://www.geoaplicada.com/dados/zonas-climaticas-do-brasil-koppen/ (accessed on 1 February 2025).
  28. ANA—Agência Nacional de Águas. Sistema de Informações Hidrológicas—HidroWeb. Available online: https://www.snirh.gov.br/hidroweb (accessed on 12 January 2023).
  29. INMET—Instituto Nacional de Meteorologia. Banco de Dados Meteorológicos para Ensino e Pesquisa—BDMEP. 2023. Available online: http://www.inmet.gov.br/projetos/rede/pesquisa/ (accessed on 20 January 2023).
  30. ONS—Operador Nacional do Sistema Elétrico. Dados Hidrológicos/Vazões. 2023. Available online: https://www.ons.org.br/Paginas/resultados-da-operacao/historico-da-operacao/dados_hidrologicos_vazoes.aspx (accessed on 13 January 2023).
  31. Moriasi, D.N.; Arnold, J.G.; van Liew, M.W.; Bingner, R.L.; Harmel, R.D.; Veith, T.L. Model evaluation guidelines for systematic quantification of accuracy in watershed simulations. Trans. ASABE 2007, 50, 885–900. [Google Scholar] [CrossRef]
  32. Thrasher, B.; Wang, W.; Michaelis, A.; Melton, F.; Lee, T.; Nemani, R. NASA Global Daily Downscaled Projections, CMIP6. Sci. Data 2022, 9, 262. [Google Scholar] [CrossRef]
  33. Barbosa, M.A. Análise da Influência das Mudanças Climáticas no Aproveitamento Hidroenergético da Bacia Hidrográfica do Rio Sapucaí. Master’s Thesis, Universidade Federal de Itajubá, Itajubá, Brazil, 2024. [Google Scholar]
  34. IBGE—Instituto Brasileiro de Geografia e Estatística. Projeção da População. 2018. Available online: https://www.ibge.gov.br/estatisticas/sociais/populacao/9109-projecao-da-populacao.html (accessed on 1 December 2024).
  35. Collischonn, W.; Allasia, D.; DA Silva, B.C.; Tucci, C.E.M. The MGB-IPH model for large-scale rainfall—Runoff modelling. Hydrol. Sci. J. 2007, 52, 878–895. [Google Scholar] [CrossRef]
  36. Fan, F.M.; Collischonn, W. Integração do Modelo MGB-IPH com Sistema de Informação Geográfica. Rev. Bras. Recur. Hídricos 2014, 19, 243–254. [Google Scholar] [CrossRef]
  37. Paiva, R.C.D. Modelagem Hidrológica e Hidrodinâmica de Grandes Bacias, Estudo de Caso: Bacia do rio Solimões. Master’s Thesis, Universidade Federal do Rio Grande do Sul, Porto Alegre, Brazil, 2009. [Google Scholar]
  38. Pontes, P.R.M.; Collischonn, W.; Fan, F.M.; de Paiva, R.C.D.; Buarque, D.C. Modelagem hidrológica e hidráulica de grande escala com propagação inercial de vazões. Rev. Bras. Recur. Hídricos 2015, 20, 888–904. [Google Scholar] [CrossRef]
  39. Felix, V.d.S.; da Paz, A.R. Representação dos processos hidrológicos em bacia hidrográfica do semiárido com modelagem hidrológica distribuída. Rev. Bras. Recur. Hídricos 2016, 21, 556–569. [Google Scholar] [CrossRef]
  40. Jati, D.A.; Da Silva, J.T. Estudos geo-hidrológicos da bacia do rio Curuá-Una, Santarém, Pará: Aplicação do modelo hidrológico de grandes bacias (MGB-IPH). Rev. Bras. Geogr. Física 2017, 10, 1296–1311. [Google Scholar] [CrossRef]
  41. Pessoa, M.M.E.P. Obtenção de Vazões em Locais sem Monitoramento Através de um Modelo Hidrológico com Assimilação de dados. Ph.D. Thesis, Universidade Federal do Rio Grande do Sul, Porto Alegre, Brazil, 2017. [Google Scholar]
  42. Negreiros, B.M.F.; Medeiros, J.D.F. Aplicação do modelo hidrológico MGB-IPH na bacia hidrográfica do rio Seridó, 2017. In Proceedings of the XX Simpósio Brasileiro de Recursos Hídricos, Florianópolis, Brazil, 26 November–1 December 2017. [Google Scholar]
  43. Bayer, D.M.; Collischonn, W. Análise de sensibilidade do modelo MGB-IPH a mudanças de uso da terra. Rev. Bras. Recur. Hídricos 2013, 18, 165–179. [Google Scholar] [CrossRef]
  44. Silva, M.K.A. Modelagem Hidrológica Aplicada ao Estudo da Vazão da Bacia Hidrográfica do rio Araguari—MG, a Partir das Mudanças do uso da Terra e Cobertura Vegetal Nativa. Ph.D. Thesis, Universidade Federal de Uberlândia, Uberlândia, Brazil, 2014. [Google Scholar]
  45. Lopes, V.A.C.; Fan, F.M.; Collischonn, W.; Paiva, P.R.M. Aplicação preliminar do modelo MGB—IPH para a bacia hidrográfica completa da Laguna dos Patos. In Proceedings of the XXI Simpósio Brasileiro de Recursos Hídricos, Brasília, Brazil, 22–27 November 2015. [Google Scholar]
  46. Beserra, P.S. Avaliação dos Efeitos das Alterações na Cobertura e uso do solo Sobre o Regime de Vazões via Modelagem Hidrológico Considerando Incerteza Paramétrica. Master’s Thesis, Universidade de Brasília, Brasília, Brazil, 2016. [Google Scholar]
  47. Neto, R.L.B.; Tagliaferre, C.; Lemos, O.L.; Rocha, F.A.; De Paula, A. Aplicação do modelo MGB-IPH na bacia hidrográfica do Rio Pardo em diferentes cenários de uso e ocupação do solo. Cienc. Florest. 2021, 31, 191–213. [Google Scholar] [CrossRef]
  48. Siqueira, P.C.; Pons, N.A.D.; da Silva, B.C.; Moreira, L.d.A.; Junior, P.S.; Martins, A.M. Aplicação do Modelo Hidrológico MGB-IPH para Simulação de Cenários de Uso do Solo na Bacia do Rio Sapucaí (MG). Rev. Bras. Geogr. Física 2022, 15, 2414–2429. [Google Scholar] [CrossRef]
  49. Gama, W.M. Impactos das Mudanças Climáticas na Resposta Hidrológica da Bacia Hidrográfica do rio Paraíba do Meio (AL/PE). Master’s Thesis, Universidade Federal de Alagoas, Maceió, Brazil, 2011. [Google Scholar]
  50. Adam, K.N.; Collischonn, W. Análise dos impactos de mudanças climáticas nos regimes de precipitação e vazão na bacia hidrográfica do rio Ibicuí. Rev. Bras. Recur. Hídricos 2013, 18, 69–79. Available online: https://lume.ufrgs.br/handle/10183/229606 (accessed on 15 November 2024). [CrossRef]
  51. Adam, K.N.; Fan, F.M.; Pontes, P.; Bravo, J.M.; Collischonn, W. Mudanças climáticas e vazões extremas na Bacia do Rio Paraná. Rev. Bras. Recur. Hídricos 2015, 20, 999–1007. [Google Scholar] [CrossRef]
  52. Fan, F.M.; Buarque, D.C.; Pontes, P.R.M.; Collischonn, W. Um mapa de unidades de respostas hidrológicas para a América do Sul. In Proceedings of the XXI Simpósio Brasileiro de Recursos Hídricos, Brasília, Brazil, 22–27 November 2015; pp. 1–8. Available online: https://www.ufrgs.br/hge/modelos-e-outros-produtos/sensoriamento-remoto/mapa-de-urhs-da-america-do-sul/ (accessed on 15 November 2024).
Figure 1. Tocantins–Araguaia river basin with its main hydroelectric power plants [26].
Climate 13 00140 g001
Figure 2. Flowchart of the methodology applied to this research.
Climate 13 00140 g002
Figure 3. Process for developing water consumption projections based on the growth trend observed in recent years in the historical series. The calculation sequence includes (a) the calculation of the average growth rate, (b) the growth rates for the future period, and (c) the projection of future water consumption.
Climate 13 00140 g003
Figure 4. Correction of water consumption projections to incorporate the effect of climate change.
Climate 13 00140 g004
Figure 5. Discretization of the TARB. (a) Discretization of the TARB into sub-basins. (b) Discretization of the TARB into HRUs.
Climate 13 00140 g005
Figure 6. Streamflow hydrographs observed and simulated by MGB-IPH to Tucuruí HPP.
Climate 13 00140 g006
Figure 7. Monthly averages of streamflows simulated with observed rainfall and rainfall from climate models. (a) Serra da Mesa hydroelectric power plant, (b) Cana Brava hydroelectric power plant, (c) São Salvador hydroelectric power plant, (d) Lajeado hydroelectric power plant, (e) Estreito hydroelectric power plant, and (f) Tucuruí hydroelectric power plant.
Climate 13 00140 g007
Figure 8. Evolution of water withdrawals by municipality [10].
Climate 13 00140 g008
Figure 9. Historical and projected water demands upstream of the Tucuruí HPP. (a) Human urban average consumption, (b) industry average consumption, (c) animal watering average consumption, and (d) irrigation average consumption.
Climate 13 00140 g009
Figure 10. Projections of water consumption from the Tucuruí HPP. (a) Tucuruí HPP to SSP2-4.5 scenario and (b) Tucuruí HPP to SSP5-8.5 scenario.
Climate 13 00140 g010
Figure 11. Anomaly of the extreme streamflows (5% and 95%) for the Tucuruí HPP. (a) Streamflow (5%) to the SSP2-4.5 scenario, (b) streamflow (5%) to the SSP5-8.5 scenario, (c) streamflow (95%) to the SSP2-4.5 scenario, and (d) streamflow (95%) to the SSP5-8.5 scenario.
Climate 13 00140 g011
Figure 12. Historical and future permanence curves (SSP2-4.5 and SSP5-8.5) for the Tucuruí HPP. (a) Climate model ACCESS, (b) climate model Can, (c) climate model IPSL, and (d) climate model MPI.
Climate 13 00140 g012
Figure 13. Historical and future anomalies in average inflows (SSP2-4.5 and SSP5-8.5) for São Salvador e Tucuruí HPP. (a) Natural streamflow of São Salvador HPP without removal of consumptive uses. (b) Influent streamflow of São Salvador HPP with removal of consumptive uses. (c) Natural streamflow of Tucuruí HPP without removal of consumptive uses. (d) Influent streamflow of Tucuruí HPP with removal of consumptive uses.
Climate 13 00140 g013
Figure 14. Flow anomalies for the five models evaluated for Brazilian basins [3]. (a) Scenario SSP2-4.5 to the period 2041–2070 and (b) scenario SSP5-8.5 to the period 2041–2070.
Climate 13 00140 g014
Table 1. Adjustment classification criteria according to the statistics used by MGB-IPH.
ClassificationNS or NSlogΔV
Very good>0.75 and ≤1.00>±10%
Good>0.65 and ≤0.75±10% ≤ ΔV < ±15%
Satisfactory>0.50 and ≤0.65±15% ≤ ΔV < ±25%
Not satisfactory≤0.50ΔV ≥ ±25%
Table 2. NEX-GDDP-CMIP6 models chosen.
ModelDevelopedCountry
ACCESS-ESM1-5Australian Community Climate and Earth System SimulatorAustralia
CanESM5Canadian Centre for Climate Modelling and AnalysisCanada
INM-CM4-8Institute of Numerical Mathematics of the Russian Academy of SciencesRussia
IPSL-CM6A-LRInstitute Pierre-Simon LaplaceFrance
MPI-ESM1-2-HRMax Planck Institute for Meteorology Earth System ModelGermany
Table 3. MGB-IPH model fit statistics for the TARB.
Sub-BasinHydroelectric Power PlantNSNslogΔV
1UHE Serra da Mesa0.8630.8804.852
2UHE Cana Brava0.8660.8685.577
3UHE São Salvador0.8720.8675.576
4UHE Peixe Angical0.8710.8845.985
5UHE Lajeado0.9150.9068.073
6UHE Estreito0.9070.9027.493
7UHE Tucuruí0.9110.9436.821
Disclaimer/Publisher’s Note: The statements, opinions and data contained in all publications are solely those of the individual author(s) and contributor(s) and not of MDPI and/or the editor(s). MDPI and/or the editor(s) disclaim responsibility for any injury to people or property resulting from any ideas, methods, instructions or products referred to in the content.