Abstract
Urban settings in West Africa are increasingly experiencing extreme weather events, such as heat waves, floods, and windstorms. Climate phenomena exacerbated by global climate change are not unique to this region but reflect a broader trend of worldwide environmental changes. However, how local communities in tropical cities in the global south adapt to these extreme events is not fully understood. Understanding local adaptation strategies is crucial in enhancing our ability to develop context-specific policies that address climate vulnerabilities. This study aimed to analyse the adaptation and mitigation strategies employed by the urban residents of Abuja and Ouagadougou in response to recurrent floods, heat waves, and windstorms. To investigate adaptation and mitigation strategies for climate change in urban areas, this study collected quantitative data from a sample of 840 households in Abuja and 840 households in Ouagadougou. The results revealed that the participants of each city used different strategies to adapt to and mitigate heat waves, floods, and windstorms. However, the level of adoption of these measures differed among the respondents. The findings revealed a low level of adoption of climate change mitigation measures. Context-specific policies must prioritise strengthening local adaptation strategies, addressing socioeconomic disparities, and fostering urban design solutions tailored to each city’s unique environmental and infrastructural challenges.
1. Introduction
Recent decades have been marked by a number of disasters linked to climate change. Currently, one of the most important and pressing issues that nations around the world are dealing with is climate change [1]. Climate change could lead to an increase in the scale and frequency of hydroclimatic hazards (heat waves, droughts, floods), which could have significant consequences for the environment and the health and safety of populations [2]. Climate change is a worldwide phenomenon, but populations and countries develop different coping strategies depending on a myriad of factors. The strategies adopted by urban populations in developing countries to adapt to and mitigate extreme climatic events reflect their levels of vulnerability to climate change. According to the Intergovernmental Panel on Climate Change [3], “Adaptation is defined, in human systems, as the process of adjustment to actual or expected climate and its effects, in order to moderate harm or exploit beneficial opportunities. In natural systems, adaptation is the process of adjustment to the actual climate and its effects; human intervention may facilitate adjustment to the expected climate and its effects.” Adaptation systems, if perfectly implemented by local populations, should allow them to protect themselves from current and future climate impacts. Mitigation, on the other hand, is an action to reduce the risks of rapid climate change, by which future damage is controlled or society adapts to new conditions [4]. Climate change mitigation refers to actions that are designed to reduce or prevent greenhouse gas emissions, which cause human-induced climate change [5]. These two strategies are complementary because they enable people not only to reduce and manage the risks of climate change in the short term but also to reduce them in the medium and long term.
In the disciplines of geography and anthropology, theories about the adaptive capacities of human communities to the threats posed by climate change were developed in the mid-20th century that drew on the ecological concept of societies as adaptive systems [6]. Resilience theory maintains that adjusting modes of existence requires constant creation and transformation [7]. The adaptive capacity of a human community in the face of climate change refers to its ability to adapt proactively to change, to learn from its experience, and to innovate in the face of challenges. Resilience is the ability of a population to withstand the impacts of climate change, to reorganise, and to continue to function despite the disruption [3]. Climate-resilient development is made possible by anticipatory, integrative, flexible, action-orientated, and inclusive processes involving local and indigenous knowledge. Furthermore, shared objectives and social learning strengthen the adaptive capacity, and the joint implementation of adaptation and mitigation measures and the consideration of trade-offs lead to multiple benefits in terms of combating climate change [3].
The effective mitigation of and adaptation to certain climate hazards can be achieved through the conservation and restoration of urban and peri-urban ecosystems, because ecosystems play a fundamental role in helping urban areas to develop resilient climate adaptation strategies [8]. However, effective mitigation and adaptation strategies require the effective participation of governance at all levels. For greater effectiveness, there must be a complete commitment from all stakeholders and decision makers [9]. Adapting to climate change requires local knowledge and skills, namely the experiences and capacities of households and community organisations [10]. However, these adaptation and mitigation measures have become a major challenge for cities [11]. For this reason, cities are trying to combine a number of measures to adapt to climatic hazards [12]. In terms of adaptation, it is usually the direct consequences of the phenomenon that are targeted. In fact, the measures adopted aim to reduce the vulnerability of populations and activities and do not directly address the causes of the hazards to which territories are exposed—for instance, the increase in global temperatures caused by greenhouse gas emissions [13]. This means that people will continue to suffer the consequences of these same phenomena, because focusing solely on the relatively short-term personal benefits of adaptive behaviours runs the risk of encouraging behaviours that are personally adaptive in the short term but which may be personally, socially, and environmentally maladaptive in the long term [14].
Populations are repeatedly being affected by the impacts of climate change, which is why there is a need to put in place a clear protocol so that adaptation measures can be adopted easily and quickly [15]. The limited understanding of the relationship between potential adaptation measures and the spatial context in which these measures are to be implemented hinders the sharing of knowledge between different climate adaptation projects [16]. The available synthesis of the rapidly expanding literature on adaptation is weak, making it difficult for governments and practitioners to make evidence-based decisions [17].
With the recurrence of extreme climate events, it is necessary to learn from past and present adaptation strategies to understand the processes by which adaptation takes place [18]. These are attitudes or behaviours taken on communities’ own initiative to avoid the direct physical and financial consequences imposed by increased climate-related risks [19]. For example, actions to adapt to flooding refer to actions taken before, during, or after the event to prevent or minimise the negative consequences [20]. A clear understanding of the social and behavioural elements and constraints related to household adaptation is crucial in effectively addressing the growing risks caused by climate change [21]. Assessing the adaptation progress can facilitate the sharing of best practices, the identification of successes and gaps, and the mapping of evidence across regions and sectors [22]. Most studies on adaptation and mitigation strategies have focused on a single climatic phenomenon. However, several climatic phenomena, including heat waves, floods, and windstorms, often simultaneously affect urban populations. This paper provides insights by examining how the urban populations of two large and fast-growing cities in Africa are implementing adaptation and mitigation strategies in the face of various climatic phenomena.
The aim of this study is to analyse the adaptation and mitigation strategies adopted by the urban populations of Abuja and Ouagadougou in the context of recurrent floods, heat waves, and windstorms. Specifically, the study seeks to determine how the urban environment as a whole and the neighbourhood in particular can help to mitigate the potential causes of climate change. Finally, it aims to understand people’s perceptions of how adaptation and mitigation measures should or could be improved in the face of the challenges posed by extreme climatic phenomena.
2. Materials and Methods
2.1. Description of the Study Areas
This study was carried out in two political capitals in West Africa—Abuja (Nigeria) and Ouagadougou (Burkina Faso). These two cities have similarities and differences in terms of their physical environments, climates, and urbanisation patterns and the sociodemographic characteristics of their populations. Geographically, both cities are located in the centre of the country. Administratively, Abuja has 6 local government areas (LGA) and 62 wards (Figure 1). Ouagadougou is composed of 12 arrondissements and 55 districts (Figure 1).
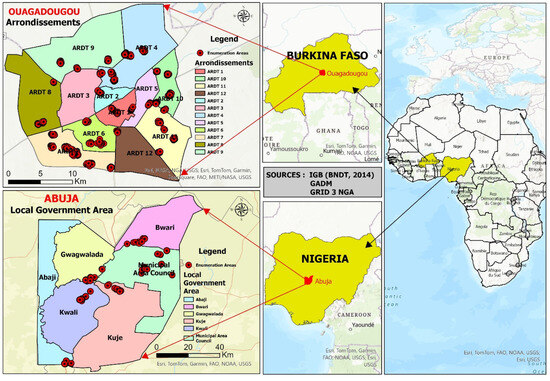
Figure 1.
Study areas (Abuja and Ouagadougou) and the distribution of the enumeration areas.
According to the World Meteorological Organization [23], in Ouagadougou, the average minimum temperature varies between 16.5 °C (January) and 26.4 °C (April). The average maximum temperature ranges from 31.1 °C (August) to 39.3 °C (April). The average monthly rainfall during the year varies between 0.1 mm (January) and 214.2 mm (August), while the average number of rainy days ranges from 0 (January) to 16 (August). In Abuja, the average minimum temperature varies between 18.3 °C (June) and 25.5 °C (February). The average maximum temperature ranges from 28.9 °C (August) to 36.8 °C (February). The average rainfall throughout the year varies between 1.2 mm (December) and 262.7 mm (August) [23]. The precipitation in both cities is marked by two seasons: a longer dry season and a shorter wet season. However, some climate projections already show that West Africa will be hotter and drier and that extreme events will be more frequent by 2030 or the early 2040s [24]. With 3,055,788 inhabitants in 2022, Ouagadougou is the most populous city in Burkina Faso. The city’s population increases at an annual average rate of 4.85% [25]. The central region, of which Ouagadougou is the capital, has a population density of 1014 inhabitants per square kilometre [26]. In 2022, Abuja’s population was estimated at 3,652,029 inhabitants, with an annual increase rate of 5.42% on average [25]. Figure 1 shows the locations of the enumeration areas where the population survey was conducted in Ouagadougou and Abuja.
2.2. Materials and Methods
2.2.1. Spatial and Demographic Sampling Method
For sampling, the cities were divided into two strata: planned areas and unplanned areas (informal settlements). In each stratum, 21 enumeration areas (EAs) were randomly selected. Created specifically for a census, an EA is a geographical statistical unit with a specific number of households within it—namely, between 150 and 250 households [27]. In most surveys, a sample size of 20–30 households per cluster is sufficient if the average cluster size is 250 households or less, and, for the most important survey indicators, a sample of between 20 and 25 households is appropriate in urban clusters [27]. To obtain a sample of 420 households, we decided to survey 20 households in each enumeration area. To survey this sample of around 420 households, we required 21 EAs per stratum (42 in total per city). The overall sample was 840 households for Abuja and 840 households for Ouagadougou. These enumeration areas were spatially distributed across the 12 districts of Ouagadougou and the 6 local government areas (LGA) of Abuja. Table 1 shows the distribution of households in the six LGAs and twelve arrondissements in Abuja and Ouagadougou, respectively.

Table 1.
Distribution of the demographic samples in Abuja and Ouagadougou.
The Abuja Municipal Area is the most densely populated area, which explains the difference in the number of households surveyed in this LGA as opposed to the others. As the other five LGAs had the same characteristics in terms of the population proportion, the same number of households was surveyed in each LGA. In Ouagadougou, the National Institute of Statistics and Demography has a database of all of the city’s enumeration areas. The 42 surveyed enumeration areas were randomly selected from this database. After enumerating the houses in the enumeration area, households were randomly selected to participate in the study.
2.2.2. Data Collection Method
This study used a quantitative approach based on a questionnaire addressed to households to collect precise and relevant information about climate change adaptation and mitigation strategies in urban areas. The main variables (Table 2) in this study were grouped into three main categories. The first consisted of strategies for adapting to heat waves, windstorms, and floods. The second consisted of measures to mitigate the effects of heat waves, floods, and windstorms. The third consisted of the use of public transport, renewable energy, and the planting of trees and construction methods for houses as strategies to mitigate the effects on the urban environment. The fourth consisted of constraints and proposals for improved adaptation and mitigation strategies. Finally, we collected the respondents’ sociodemographic characteristics. To obtain reliable data, the KoboToolbox application was used to ensure logical questions and the reliability of the data. The questionnaire was tested in three phases. First, it was tested by the programmer after design. Second, during interviewer training, simulations were carried out using a few scenarios to ensure consistency and check the logic of the questions. Third, a pilot survey was carried out to test the logic and clarity of the questions and the harmonisation of words, terms, and questions in the survey languages.
Table 2.
Main variables of the study.
Furthermore, the head of the household was chosen as the primary respondent. In their absence, another competent household member aged at least 20 years was authorised to participate. The minimum age of the respondents was set at 20 years to meet the general objectives of our research on climate change in recent years. The aim was to have a person capable of answering all sections of the questionnaire, including those on the adaptation and mitigation strategies discussed in this article. Participation in the study was voluntary, and the respondent’s consent was requested at the beginning of the interview. To maintain the integrity of the sampling process, no replacement was implemented for selected households. Multiple visits were conducted if necessary to find a qualified respondent under the defined conditions.
2.2.3. Indicators of Urban Adaptation and Mitigation Measures
There are no universal and static indicators for adaptation to climate change, due to the context in which these measures are taken and often because of their dynamism [28]. Indeed, populations adopt individual and often circumstantial measures in the face of floods, heat waves, windstorms, and droughts. However, it is possible to assess the common measures and practices typically used by populations to mitigate effects or adapt to impacts. According to Protection Motivation Theory (PMT), three aspects characterise people’s adaptation assessments: the first is their perceptions of the costs in terms of money, time, and effort involved in implementing the protective action; the second is their beliefs that a protective action will effectively reduce the threat; and the third is the belief in their own ability to carry out the protective action. Refs. [29,30] identified some of the physical and urban socioeconomic characteristics in which the risk impacts of certain climatic events materialise and through which adaptation measures can be targeted. They showed how urban characteristics influence exposure and vulnerability to certain effects of climate change, as well as their importance and implications for adaptation. To identify and analyse the adaptation and mitigation strategies of the studied urban populations, the types of impacts were first identified. Then, the risks (hazard, exposure, vulnerability) to which the populations were exposed, according to [3], were defined. The urban characteristics used were the population, governance [28], physical environment (soil, topography, hydrography, vegetation), and climate (temperature, precipitation, winds) of each of the cities. Figure 2 shows the adaptation and mitigation indicators for climate change.
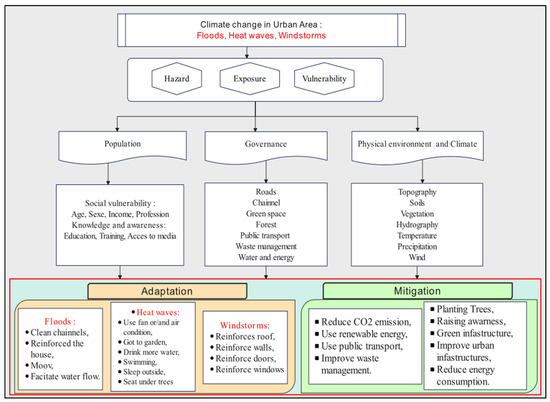
Figure 2.
Conceptual summary and illustration of extreme climate events in urban areas, main components of human behaviour and physical environment as drivers of climate change, and population adaptation and mitigation indicators based on the theory of planned behaviour. Adapted from [31].
2.2.4. Data Analysis
For this analysis, we used the sociodemographic characteristics of the respondents (Table 2), including gender, age, marital status, level of education, and occupation. We also used climate change adaptation and mitigation variables (Table 2). First, we conducted bivariate analyses (chi-squared tests) to determine the significance between the adaptation and mitigation variables and the respondents’ sociodemographic characteristics. In the bivariate analyses, we examined the differences in terms of adaptation to and mitigation of climate change (floods, heat waves, and windstorms), according to the aforementioned sociodemographic variables. To understand the differences in the mitigation and adaptation measures utilised by the respondents in each city, we conducted multivariable logistic regression. Our outcome for the logistic regression was the mitigation and adaptation measures, and the sociodemographic characteristics were the predictor variables. Multivariable logistic regression tests the relationships between a dependent variable and one or more independent variables [32]. In research fields such as education, health, geography, psychology, and sociology, multivariate statistical analyses are commonly used [33]. Specifically, the series of logistic regressions used examined the sociodemographic factors influencing the adoption of adaptation and mitigation strategies for climate change. The general form of the model was logit(P(Si = 1)) =β0 + β1 × Sex + β2 × Age + β3 × Education + β4 × Occupation + β5 × Marital status + ε, where Si is a binary variable taking the value 1 if the individual adopted strategy i and 0 otherwise. The explanatory variables represented the sociodemographic characteristics of the respondents. The likelihood ratio test was used to assess the overall significance of the model, and the Hosmer–Lemeshow test was used to examine the fit of the model to the data.
Next, multiple component analysis (MCA) and ascending hierarchical classification (AHC) were used to characterise the mitigation strategies according to the sociodemographic traits of the respondents. These approaches were used to differentiate between the participants and group them according to their similarity in terms of mitigation strategies [34,35]. Two main types of variables were used to create the models. There were the number of climate change mitigation variables, including perceptions of tree planting, the use of renewable energy, the use of energy for cooking, and perceptions of house orientation and ventilation. We also included the aforementioned sociodemographic variables. The advantage of using MCA and AHC in this study was that the respondents were categorised into clusters according to their similarity in terms of climate change mitigation. Thus, each cluster described the composition of the respondents according to their sociodemographic characteristics for each mitigation variable. The information provided by this categorisation made it possible to determine, for each mitigation strategy or action to be implemented, which populations should be taken into account in terms of gender, level of education, profession, and age. The FactoMineR and FactoExtra packages [36] were used to perform the analysis in R version 4.4.0.
3. Results
3.1. Sociodemographic Characteristics of Respondents
In Abuja, the study found that approximately one third of the respondents (32.52%) were women and two thirds were men. Respondents’ ages ranged from 20 to 70 years old, with a mean age of 39.74 years (standard deviation: 11.18). The majority of the respondents (31.17%) were between 40 and 50 years old. Only 4.28% were between 60 and 70. Those aged 20 and 30 accounted for 25.92%. More than 62% of the respondents were married and 32.4% were single. Fifty-three percent of the respondents had a university degree, 36% of the respondents had a secondary education, and only 2.81% had no formal education. The data on the level of education revealed a very high school enrolment rate. This is logical given the city’s role as Nigeria’s political capital and the headquarters of several African and international institutions. More than a quarter (27.02%) were self-employed (traders and entrepreneurs), while 23.47% worked in the public sector. The private sector accounted for 14.67%. Around 10% were students/researchers. There were also other categories that were not mentioned. They represented the smallest percentage (4.16%).
In Ouagadougou, the study found that approximately 70% of the respondents were women and 30% were men. The minimum age was 20 years and the maximum 88 years. The mean age was 42.16, and the standard deviation was 14.17. In terms of age, the results showed that the city’s population is very young. Indeed, 24.67% were between 20 and 30 years old, and 30.62% were between 30 and 40. These two age groups represented more than 50% of the population. The data on the marital statuses of the respondents showed that more than 76% were married. Those who lived with a partner represented the lowest percentage (2.55%). Singles accounted for around 11%. There was a low level of education: 44.35% had no formal education, and 22.36% of the respondents had a primary education. Those with a secondary or university education represented around 9% and 12%, respectively. In terms of occupation, the results showed that 35.6% were unemployed. Independent workers (traders and entrepreneurs) accounted for 31.23%. The smallest group was composed of mechanics and carpenters (4.74%). Table 3 presents the sociodemographic characteristics of the households interviewed in Abuja and Ouagadougou.
Table 3.
Sociodemographic characteristics of the respondents.
3.1.1. Sociodemographic Characteristics and Climate Change Adaptation
The multivariable logistic regression revealed significant links between certain adaptation variables and sociodemographic variables. For example, in terms of adaptation to hot weather, there was a significant link between the education level and the permanent use of air conditioning and fans. In addition, respondents with a higher level of education tended to travel to the forest, green spaces, restaurants, and scrubland. There was also a link between age and visits to forests, gardens, and green spaces. Finally, there was a significant link between occupation, the permanent use of air conditioning, and traveling to forests, green spaces, and gardens. In fact, workers in the private sector and the public sector, students, and researchers were more inclined to adopt these strategies than those in other categories.
3.1.2. Sociodemographic Characteristics and Climate Change Mitigation
The chi-squared test revealed a significant correlation between respondents’ age and the use of renewable energies, such as solar, wind, and biogas. However, the logistic regression showed that older respondents were less likely to use solar energy. In other words, age seems to be a determining factor in the adoption of solar energy. Younger people tend to use it more than older people. These devices consume more energy, which explains the use of solar energy by young people. The chi-squared test and logistic regression also revealed a significant correlation between the main energy source used and age. Furthermore, the chi-squared test and the logistic regression revealed a significant correlation, on the one hand, between the use of renewable energy sources, including solar and wind energy, and the level of education and, on the other hand, between the main source of energy and the level of education. Finally, there was a significant link between perceptions of tree planting and the level of education. Those with a higher level of education considered tree planting to be one of the actions with potential to mitigate high temperatures in urban areas, in contrast to those with a lower level of education.
3.2. Respondents’ Adaptation Strategies to Climate Change
The surveys in Abuja and Ouagadougou helped us to understand how, when, and why these populations adopt measures to adapt to climate change. The next section analyses the different strategies, attitudes, behaviours, and actions of these populations in combating heat waves, floods, and windstorms.
3.2.1. Adaptation Strategies of Abuja’s Respondents to Heat Waves, Floods, and Winds
This study found that the respondents developed a variety of strategies to cope with different climate change hazards, such as heat waves, flooding, and winds. Among the actions most frequently taken by households to adapt to heat waves were drinking more water (83.86%), taking a bath several times a day (55.87%), and using a fan permanently (50.61%). Respondents in Abuja used air conditioners (27.87%), travelled to the forest (8.44%), and travelled to green spaces (20.54%). To cope with heat waves at night, some people slept outside (38.75%), while others (26.65%) spent more time in gardens and restaurants.
Additionally, among the actions that could help to reduce the effects of heat, respondents mentioned the ways in which houses are built. In fact, the layout of the city and the ways in which people build their houses are important factors in adapting to heat. In Abuja, 71.15% felt that it was the construction of their house that allowed them to reduce the effects. Observations of the houses of the surveyed households revealed that the houses were wide and airy.
Over two thirds (67.73%) of the respondents said that they had taken precautions against windstorms. The measures taken by the populations to protect their homes included strengthening the roofs (82.95%) and walls (72.74%) and strengthening doors and windows (52.71%).
Similarly, respondents reported multiple measures to adapt to or reduce floods. Most of those who stated that they had experienced flooding in their current area of residence took the following actions: they placed sandbags in front of the door (67.36%), reinforced the structure of the house (66.94%), dug a channel to facilitate the passage of water (58.68%), and cleaned drainage channels (52.07%).
For those who experienced flooding elsewhere in the city before reaching their current place of residence, they took action at the time of the flood (Figure 3).
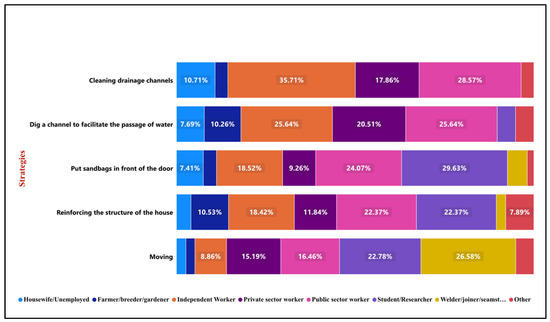
Figure 3.
Household adaptation strategies for floods in Abuja.
The results in terms of flood adaptation strategies adopted at a previous residence showed that, in general, 60.31% had moved out of their area due to flooding over the last 30 years (1992 to 2022). Other actions to protect against flooding included reinforcing the structure of the house (58.02%), placing sandbags in front of the door (41.22%), digging a channel/hole to facilitate the passage of water (29.77%), and cleaning drainage channels (21.37%). However, in terms of adaptation actions by occupation, an analysis of the graph shows that, among those who left their areas because of flooding, there were more welders, joiners, seamstresses (26.58%), and students and researchers (22.68%). Students and researchers (22.37%) and public sector workers (22.37%) were the most likely to have reinforced the structures of their homes. Students and researchers (29.63%) and public sector workers (24.07%) were also the most likely to place sandbags in front of their homes to prevent water from entering. In terms of digging channels to facilitate the passage of water, 25.64% of public sector workers and public sector workers had adopted this action. Finally, independent workers (35.71%) and public sector workers (28.57%) were the ones who most frequently cleaned drainage channels as a flood adaptation strategy. Respondents were asked if they would accept a relocation proposal if their area of residence was at risk of flooding; in total, 89.39% of the respondents in Abuja were in favour of relocation.
3.2.2. Adaptation Strategies of the Population of Ouagadougou to Heat Waves, Floods, and Wind
In Ouagadougou, people adopted multiple actions in response to heat waves. During the day, the actions most frequently taken by households to adapt to heat waves were drinking water more than usual (97.93%), showering several times (76.18%), and sitting under a shady tree (55.77%). Figure 4 shows how the respondents withstood severe heat waves during the day.
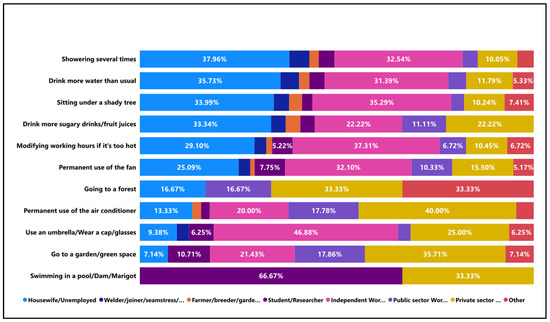
Figure 4.
Strategies adopted to cope with heat waves during the day in Ouagadougou.
The results in terms of adapting to heat waves during the day revealed that the solutions available and used by the respondents depended on their professions (Figure 4). Swimming was most frequent activity of students, researchers (66.67%), and private sector workers (33.33%). Given the nature of their work, independent workers, entrepreneurs, and traders used umbrellas, hats, and glasses to cope with the high temperatures. Welders, mechanics, carpenters, and tailors did not use air conditioners, did not bathe in swimming pools, and did not travel to the forest. Their coping strategies included drinking more water (35.73%) and fruit juice (33.34%), showering several times (37.96%), and sitting under shady trees (33.39%). The permanent use of air conditioning was the preferred action for public sector (17.78%), private sector (40%), and independent workers (20%). Additionally, around 50.18% slept outside at night. In terms of drinking more water and showering several times, the trends were the same. In Ouagadougou, respondents spent more time outside at night due to high temperatures and frequent power cuts.
In terms of taking precautions to protect themselves against windstorms, only 33.05% had taken measures in this regard. Of those who had taken measures against high winds, 77.57% had reinforced the roofs of their houses, 66.91% had reinforced the walls of their houses, and less than half (42.65%) had reinforced their windows and doors. These results show that some respondents did not take into account the realities of climate change. Adaptation methods were adopted on a case-by-case basis. The results show that people are more concerned with the roofs of their houses. This is because strong winds cause more damage to the roofs of houses.
In Ouagadougou, respondents who stated that they had experienced flooding in their current area of residence took the following actions. More than 85% reported that their first action during a flood was to protect important objects. Furthermore, 36.72% locked the doors of their homes, 21.79% placed electronic equipment on tables or chairs, and 36.72% drilled holes in walls to make it easier for the water to pass through. Some respondents (16.72%) dug trenches around their houses, raised the heights of their doors (11.64%), and built dykes to stop the water (7.46%). More than 78% of the Ouagadougou residents stated that they would relocate if their area of residence was reported to be at risk of flooding. Indeed, these results show that populations are open to the idea of being relocated if their area is declared flood-prone.
3.3. Populations’ Mitigation Strategies for Climate Change
3.3.1. Strategies to Mitigate and Reduce Climate Change Impacts in Abuja
Respondents believed that planting trees (78.36%), airing houses (65.89%), and orienting houses or buildings (54.52%) were factors that helped to reduce high temperatures. In fact, the layout of the city as a whole and the neighbourhoods in particular can allow good air circulation, and the presence of trees helps to cool the hot air. The data on the level of education provided a clearer picture of this perception. Figure 5 shows respondents’ perceptions of the factors that help to reduce high temperatures according to their levels of education.
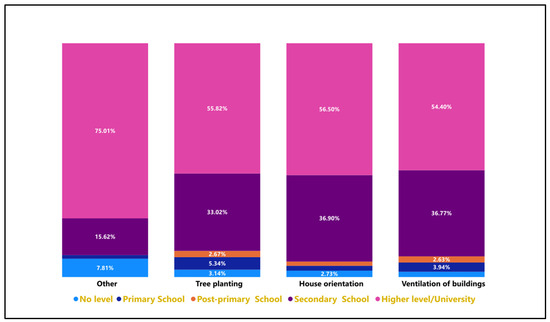
Figure 5.
Perceptions of climate change mitigation actions according to respondents’ levels of education.
The respondents displayed a very good understanding of how city planning (urban design) can mitigate the harmful effects of climate change. For example, planting trees helps to adapt to and mitigate climate change because they address heat waves, reduce wind speeds, minimise the risk of flooding, and sequester toxic gases from the air. The orientation of houses also plays a dual role in adaptation and mitigation by reducing the use of air conditioners and fans. Perceptions varied by level of education (Figure 5). Respondents with a university or secondary education demonstrated a better understanding of the actions to be taken. Besides these actions, people believed that there were other factors that could help to mitigate high temperatures. Approximately 73% of those with a university degree mentioned that there were other factors.
In terms of climate change mitigation strategies, there is the use of public transport (taxis and municipal buses) for urban mobility. To understand public transport use, this study assessed the number of times that the respondents took either the bus or the taxi per month. In Abuja, public transport is the dominant means of transportation. More than 17% of the respondents used taxis or buses at least once throughout the month. Around 19% used a taxi or bus between one and five times a month, 21.64% between six and 10 times, and 15.28% between 11 and 15 times. The use of public transport by the respondents is shown in Figure 6 according to their occupations.
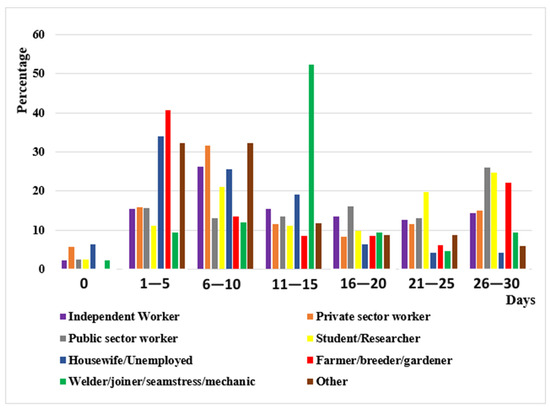
Figure 6.
Frequency of use of public transport (in days) during a month in Abuja by occupation.
The results showed that all categories used public transport during the month. Those who used it more during the month (26 to 30 days) were students, researchers, public sector workers and farmers, gardeners, private sector workers, and self-employed individuals. These were the groups that carried out activities that required them to be onsite. These activities were carried out during the week, which explains the high use of public transport. On the other hand, those who did not use it at all during the month were the unemployed and private sector workers. The results indicate the frequent use of public transport, which is a very important element in mitigating the effects of climate change by reducing emissions.
The study also investigated the main energy sources used by the populations. Around 90% of the households in Abuja use electricity, 4.89% use solar panels, and 2.86% use generators as their main sources of energy. These results can be explained by the fact that, in Abuja, even in unplanned areas, there is an electricity supply. However, it should be noted that the respondents used various sources of energy. The main energy sources used by the respondents are shown in Figure 7 according to their ages.
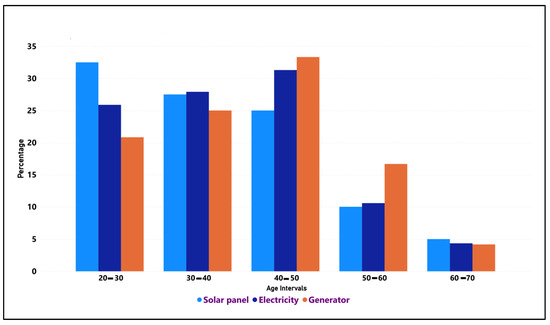
Figure 7.
The main source of energy in Abuja by age.
In the 20–30 age group, the results showed that 32.5%, 25.88%, and 20.83% used solar energy, electricity, and generators, respectively. Moreover, in the 30–40 age group, the use of these three energy sources was similar, at around 25%. In the 40–50 age group, 31.3% used electricity, around 25% used solar panels, and 30% used generators. An analysis of these data confirms that the older people are, the less solar energy they use. In other words, younger people use more natural energy sources than older people. As for other energy sources, including electricity and generators, there was no significant difference in terms of use according to age. The results show that all age groups use energy sources differently. In contrast to other energy sources (electricity, generators), solar energy is the only source that helps to mitigate climate change. However, despite being limiting factors for climate change mitigation, electricity and generators are used by a large proportion of the population.
Households use certain energy sources to cook their food. The energy sources used include gas, firewood, charcoal, and electricity. In this study, the main source of energy for food preparation was gas. It was used by more than 57% of the households. The second most important source was firewood, which was used by 17.36% of the population. Nearly 14% used charcoal. These statistics show that there is a segment of the population that continues to use energy derived from forest exploitation. However, forests play a vital role in mitigating climate change.
3.3.2. Strategies to Mitigate and Reduce Climate Change Impacts in Ouagadougou
In Ouagadougou, respondents mentioned that planting trees, orienting houses, and ventilating buildings were important factors in reducing high temperatures in the city. However, housing in Ouagadougou is dense; thus, there is less ventilation. Due to its geographical position, the lack of trees and vegetation in the city, and the way in which it is built, the population suffers significantly from the effects of heat waves.
This study also examined the main energy sources used by these households. The findings revealed that 41.43% used electricity and 47.51% used solar panels. Solar panels were used by people living in areas without electricity. These results can be explained by the fact that, in Ouagadougou, there is no electricity supply in unplanned areas. The main energy sources used by the respondents are shown in Figure 8 according to their ages.
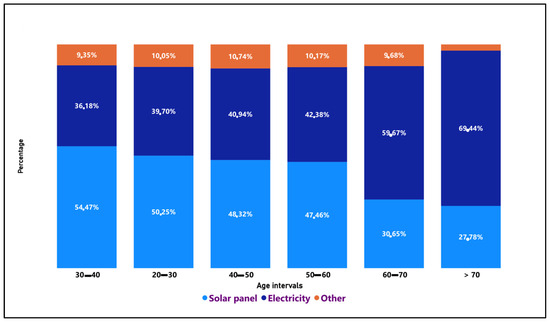
Figure 8.
Households’ main sources of energy in Ouagadougou by age.
A comparison of the main energy sources used by households shows disparities by age group. Solar energy is used most frequently by those aged 30–60. However, electricity is the energy source most used by the last two age groups. More specifically, the results show that, as the age increases (from the 30–40 age group onwards), the use of solar energy gradually decreases. On the contrary, the use of electricity increases as the age increases. All age groups also use other energy sources in almost equal proportions.
In Ouagadougou, to cook food, households mainly used gas (55.53% of households), charcoal (24.54%), firewood (18.83%), and electricity (0.85%). This information shows that a certain percentage of people still use energy derived from forests; such actions do not help to mitigate climate change.
In addition, the results showed that 87.61% of the population in Ouagadougou did not use public transport. Of the households interviewed in this study, 70.22% said that motorcycles were their main means of transport. This shows once again the constraints on mitigation actions, because the use of public transport, such as municipal buses, which carry several people at the same time, is a means of reducing gas emissions and therefore climate change.
3.4. Characteristics of Population and Mitigation Indicators
3.4.1. Characterisation of the Population According to Mitigation Indicators in Abuja
The setting of the minimum cumulative inertia criterion of 80% enabled us to determine the optimal number of dimensions to retain in the ascending hierarchical classification in Abuja. The eigenvalues showed that 24 dimensions needed to be retained in order to achieve 80.22% of the total information. The setting of the inter-cluster inertia gains enabled us to determine the number of clusters to retain. Figure 9 shows the distribution of the three clusters retained (Abuja) in the factorial axes of the AHC (Dimension 1 and Dimension 2).
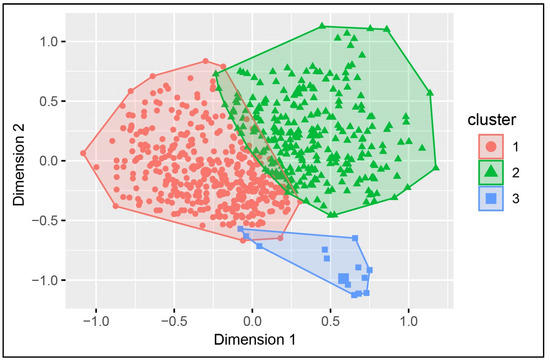
Figure 9.
Distribution of respondents by cluster in Abuja.
The first cluster consisted mainly of people aged between 20 and 30 years with a high level of education and whose profession was student/researcher. These people did not use natural energy sources, although they did use gas for cooking and electricity for lighting. They also believed that tree planting, house design, and the ways in which houses were situated were factors that might help to mitigate the effects of climate change. In this cluster, 72.59% of the respondents were aged between 20 and 30 years, 66.74% possessed university degrees, over 64% were men, over 77% were single, and 92.40% were students/researchers. In this cluster, around 80% used gas for cooking and 60.92% used electricity for lighting. Most (90%) believed that planting trees and orienting houses (71.68%) were actions that could help to mitigate climate change in urban areas.
Older married people—primarily farmers, breeders, or gardeners with a primary education—composed the second cluster. These people used wood and charcoal for food preparation and solar energy for lighting, and they believed that planting trees was a means of mitigating climate change. Specifically, 71.42% of these respondents were between 60 and 70 years old, around 51% were married, and 91% had a primary education. In this cluster, only 47.06% believed that tree planting helped to mitigate climate change. Specifically, 80.43% used wood for cooking, and 56.03% used solar panels.
The third cluster comprised public sector workers with a higher education. They used renewable energy sources such as solar power for lighting and gas for cooking. A large proportion of married men was present in this cluster. Individuals in this cluster believed that ventilating houses, orientating them, and planting trees could mitigate the effects of climate change.
3.4.2. Characterisation of the Respondents According to Mitigation Indicators in Ouagadougou
In Ouagadougou, the setting of the minimum cumulative inertia criterion showed that 26 dimensions must be retained in order to achieve 81.19% of the total information. The setting of the inter-cluster inertia gains enabled us to determine the number of clusters to retain. Figure 10 shows the distribution of the three clusters retained in the factorial axes of the AHC (Dimension 1 and Dimension 2).
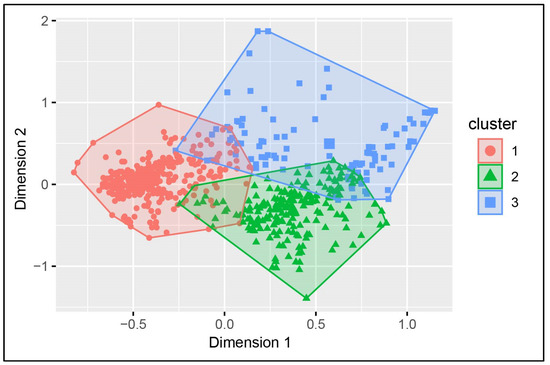
Figure 10.
Distribution of respondents by cluster in Ouagadougou.
The first cluster consisted mainly of married women aged between 30 and 40 years with a low level of education, who were unemployed or housewives. They mainly used solar energy for light and firewood for cooking, and only half of them believed that planting trees would help to mitigate the effects of climate change. More specifically, 89.76% of the people in this cluster used solar energy, and 78.63 used firewood as their main source of energy for cooking. Only 50% believed that planting trees helped to mitigate the effects of climate change. In this cluster, 59.67% were married, 58.43% were female, and 60.98% were between 30 and 40 years of age. In terms of the level of education, 65.34% did not have schooling, and around 64% were unemployed or housewives.
The second cluster specifically comprised older people with a university education who were widowed or single and did not use solar or other natural energy sources. In this cluster, some people believed that tree planting could help to mitigate the effects of climate change, and others believed the opposite. Specifically, 62.5% were between 60 and 70, about 51% were widows/widowers, more than 85% used electricity as their main source of energy, about 19% used firewood for cooking, and 35.66% used gas. In particular, this cluster did not use natural energy, and 33.6% believed that planting trees helped to mitigate the effects of climate change, while 24% believed the opposite.
The third cluster consisted mainly of older people working in the public sector, who did not use solar energy or any other natural energy source but who used electricity as their main source of energy. They also had a relatively high level of education but had a poor understanding of the mitigation of climate change effects. In this cluster, 35.19% of the population was aged between 20 and 30, 92.10% worked in the public sector, and about 52.70% had a secondary education. Only 18.09% thought that airing and ventilating their homes would help to mitigate the effects of climate change. The majority (66.60%) of the people in this cluster were single and used gas to prepare food. In this cluster, 2.54% used firewood to prepare food, and 3.63% used charcoal.
3.5. Actions to Improve Adaptation and Mitigation Strategies
Climate resilience refers to the capacity of cities to protect their inhabitants and infrastructure from the effects of climate change and from extreme weather events; these include urban climate regulations, urban water management, air quality improvement, and habitat and biodiversity preservation [37]. This study gathered the opinions of the populations of two cities on measures or actions to improve adaptation and mitigation strategies.
In Abuja, the participants mentioned several actions to improve climate change adaptation and mitigation. Improving urban infrastructure (82.15%), raising population awareness (54.65%), promoting renewable energy (44.38%), planting trees (41.08%), and reducing gas emissions (39.49%) were some measured described by the respondents. In fact, reducing emissions is crucial to address the issue of climate change and limit the increase in global temperatures, and the management, preservation, and restoration of ecosystems reduce the exposure of a territory to climate change [38].
In Ouagadougou, to improve the city’s adaptation to climate change, the urban infrastructure needs to be improved (70.55%), citizens need to be made more aware of climate change (47.63%), green cities need to be promoted by planting trees (46.78%), the management of plastic waste in the city needs to be improved (24.18%), gas emissions need to be reduced (15.91%), and the use of renewable energy sources needs to be encouraged.
The findings reveal that the most important actions are improving urban infrastructure and raising the public awareness of climate change. In terms of urban transport, although it is well developed in Abuja, the participants in Abuja felt that it should be promoted more. In Ouagadougou, the development of urban transport does not seem to be a priority. People use motorcycles and personal vehicles. This is a constraint in mitigating and adapting to climate change. However, the views of city dwellers show that green cities and the planting of trees should be promoted. This makes sense given the lack of woodland, parks, and green gardens in the city.
4. Discussion
Population-level adaptations to the impacts of climate change are an absolute necessity. It is essential to consider the adaptation actions of populations, as individual actions can have beneficial consequences in the short term [39]. It is essential to assess global progress in adapting populations to climate change. National and local authorities around the world are working to learn about measures to adapt to climate risks, recognise successes, identify risk gaps, guide national adaptation plans, and assess progress towards the global adaptation goal [22].
4.1. Sociodemographic Characteristics of the Respondents
According to the mitigation strategies by city, the results showed that the sociodemographic characteristics were similar for some groups and different for others. The level of education was significantly higher in the city of Abuja. In Abuja, more than 50% of the respondents had a university degree. Furthermore, more than 30% had a secondary education. Those without an education represented only 2.81%. The data on the level of education revealed a very high school enrolment rate. This is logical given the city’s role as Nigeria’s political capital and the headquarters of several African and international institutions. In Ouagadougou, more than 44% did not have any schooling, and 22.36% of the respondents had a primary education. Those with a secondary or university education represented around 9% and 12%, respectively. This disparity in terms of the level of education means that there is a difference in terms of understanding the strategies to be adopted for the mitigation of or adaptation to climate change. For example, more than 55% mentioned tree planting and around 53% mentioned housing construction methods as mitigation strategies. The layout of the city in terms of the orientation of houses, tree planting, and the ventilation of houses are all elements that can help to mitigate the effects of climate change, such as flooding and heat waves. The local climate is influenced by buildings because they modify the exchange of radiation, heat, and humidity with the atmosphere [40].
4.2. Assessment of Adaptation and Mitigation Strategies in the Two Cities
The ability to prepare for and respond to climate risks and impacts is strongly influenced by a city’s socioeconomic and political context [9]. Urban development patterns often shape the configurations of these areas, which can significantly affect their adaptability to climate change [41]. The cities of Ouagadougou and Abuja are experiencing the adverse effects of climate change and have implemented various adaptation and mitigation measures.
In Abuja, the results showed that people take individual and collective actions to adapt to the impacts of flooding. For example, they place sandbags in front of their doors and clear gutters to facilitate the passage of water. To adapt to the impacts of wind, they reinforce their houses. The results also revealed that, to adapt to heat waves, the participants used air conditioners and fans on a permanent basis. They showered several times during the day. These actions to adapt to high temperatures show that populations consume more energy and water to adapt; thus, these actions limit the overall mitigation of climate change. Reducing energy and water consumption can improve climate change mitigation [42]. This study also found that some good climate change mitigation strategies are being used in Abuja—notably, the use of public transport, which is a very important element in reducing gas emissions. In this city, public transport is used because motorbikes are banned from certain roads. People are forced to use public transport, which is an advantage in mitigating climate change. The use of public transport, reductions in the distance travelled, and the promotion of low-emission means of transport are actions that help to mitigate climate change [43].
In Ouagadougou, the results revealed that the participants had adopted several strategies to adapt to the impacts and mitigate the causes of climate change. To adapt to the impacts of high temperatures, respondents spent time in their gardens, swam in the water, drank more water and beverages, used fans and air conditioners, and slept outside often. To adapt to wind impacts, they reinforced the doors, walls, and roofs of their homes. In regard to climate change mitigation strategies, participants used good practices, such as solar panels. The city’s geographical position and sunshine offer advantages in using solar energy. Solar energy is an abundant, renewable source of energy that has less negative impacts on the environment and climate [44]. However, some of the actions used are limited in terms of climate change mitigation. The use of public transport by the local population is low. The low use of public transport in Ouagadougou is linked to the lack of dedicated roads for buses and the frequency with which they pass. Moreover, people can use motorbikes on all roads, with no restrictions in either direction, so they are not obliged to use buses. In addition, some people still use wood and charcoal from forests as an energy source for cooking. Thus, the use of energy sources must be addressed in communication to show how people can contribute to climate change mitigation and adaptation through the different energy sources used. Moreover, individuals constantly use air conditioners and fans to cope with heat waves. These actions, reflecting an increase in energy needs, the exploitation of forests, and urban pollution through gas emissions, slow down the mitigation of climate change. Given these contextual realities, it is essential to tailor adaptation strategies to the specific characteristics of each city for enhanced effectiveness [45]. Policies and actions must be customised to address the unique conditions and needs of each urban area.
4.3. Factors That Influence Awareness of Adaptation Measures
Few studies have investigated the reasons that people adopt specific adaptation strategies to deal with climatic phenomena [46]. The results of this study show that households’ awareness of adaptation measures is determined by whether someone has been affected by climate change, their knowledge about climate change, and the perceived risk of additional climate change impacts on their well-being. Numerous studies have examined the factors that motivate people to adapt [47]. The intention to apply climate change mitigation measures is influenced by the level of education of households [48]. The level of education is very important for access to information about climate change. This study revealed that those with a higher level of education had a good perception of the measures to be implemented. Numerous elements, such as knowledge and social, demographic, and economic aspects, affect households’ abilities to adapt [20]. Therefore, further investigation is needed to comprehensively determine which variables need to be taken into account.
4.4. Barriers to Effective Climate Adaptation and Mitigation
In the field of adaptation research, the study of the limits of adaptation strategies remains underdeveloped [17]. At the population level, the major limitations are the lack of financial resources and the lack of training and awareness raising regarding climate change. In terms of adaptation and mitigation actions, there is the use of renewable energy, the planting of trees in houses, or participation in reforestation campaigns. In Abuja, 29.83% of the population does not use any source of natural energy, while, in Ouagadougou, this figure is more than 43%. In addition, more than 80% (Ouagadougou) and 66.38% (Abuja) have never participated in a reforestation campaign. Therefore, to assess the involvement of the authorities in the prevention and management of climate hazards in the two cities, this study paid particular attention to the participants’ perceptions of the local authorities’ responses to the effects of climate change. In Ouagadougou, 36.94% felt that the authorities had not reacted at all, 49.7% felt that the authorities’ reactions were insufficient, 7.41% felt that the reaction was moderate, and only 2.79% stated that the reaction was adequate. In Abuja, 30.2% felt that the authorities had not reacted at all, 36.43% felt that the authorities were reacting inadequately, 24.21% felt that the reaction was moderate, 5.62% stated that the reaction was adequate, and 2.08% stated that the authorities’ response was very adequate. These results highlight the insufficient participation of local authorities, despite their crucial roles in developing and implementing effective adaptation strategies [38]. In Burkina Faso, while most institutions acknowledge the need for adaptation in response to climate impacts, the actual implementation of measures remains limited due to financial constraints, communication gaps, and a lack of coordination [49]. Many cities that exhibit an almost negligible contribution to greenhouse gas emissions face the greatest risks of the adverse consequences of climate change, and most have significant limitations in their capacity to adapt [10].
4.5. Respondents’ Perceptions of Opportunities to Improve Adaptation and Mitigation Strategies
In the current institutional and regulatory context, adaptation is essential to ensure long-term sustainable adaptation action [50]. It is essential to develop and apply a methodological approach to capture and analyse the range of adaptation solutions in cities. It is possible to avoid making inappropriate decisions by building on the experience of cities that have already implemented good adaptation measures [11]. Some scientific research and recent climate assessment reports have begun to identify individual and collective adaptation actions that people can take to cope with the effects of climate change [14]. Climate resilience refers to the ability of cities to protect their inhabitants and infrastructure from the effects of climate change and from extreme weather events; these include urban climate regulations, urban water management, air quality improvements, and habitat and biodiversity preservation [37]. In Ouagadougou, the respondents suggested that improving adaptation to climate change would require the commitment of authorities, communities, and all stakeholders to strengthen the urban infrastructure, increase the awareness of climate issues, promote city greening through tree planting, and manage plastic waste more effectively. Similarly, in Abuja, the focus was on improving the urban infrastructure, increasing public awareness, promoting renewable energy, and reducing gas emissions. Factors such as the demographics of the city, political leadership, economic factors, institutional structures, environmental activism, and a strong civil society are key exogenous and endogenous variables that contribute to successful adaptation and mitigation [51]. To enhance these strategies, residents’ opinions were sought regarding their willingness to pay for climate protection measures. Around 70% (Abuja) and around 60% (Ouagadougou) expressed their willingness to pay or contribute financially to protect against floods, heat waves, and storms. Furthermore, regarding public opinion towards energy-saving practices, 35.33% of the respondents in Abuja believed that households could save between 20% and 40% of their energy through serious measures, while 19.32% believed that 40% to 60% of their energy could be saved. In Ouagadougou, 17.27% and 7.06%, respectively, shared similar views. These findings underscore the importance of implementing policies that promote an awareness of energy-saving behaviours and introducing insurance schemes to protect vulnerable populations from climate-related risks.
4.6. Study Recommendations
African cities in general, and those in West Africa specifically, are both particularly vulnerable to natural hazards and demonstrate strong potential for adaptation to and the mitigation of climate change. The results of this study shed light on the adaptation and mitigation actions adopted, as well as the characteristics of these urban populations according to their perceptions of the actions to be taken to mitigate climate change. The main challenges for adaptation and mitigation are rapid urban growth, the proliferation of informal settlements, the lack and inadequacy of water drainage infrastructure, the destruction of natural resources, the dependence on fossil fuels and biomass, and gas emissions linked to urban transport. The opportunities for adapting to and mitigating climate change lie in the strong potential for renewable energies (solar, wind); the youth of the population; the potential for partnerships with NGOs, international donors, and the private sector; and the possibility of involving local people in the implementation of strategies.
To make urban environments more resilient to climate change, this study recommends the following actions. First, to improve climate change mitigation through the use of public transport in urban areas, dedicated bus lanes should be built for municipal buses to facilitate their mobility, which could encourage people to use them. Moreover, it is necessary to increase the number of buses on each line to reduce waiting times and increase people’s awareness of their use by showing how they can contribute individually and collectively to improving the environment at the local level and to combating climate change at the global level. Second, given the need to adapt to climate change, it is necessary to take advantage of the opportunities offered by African youth. Indeed, due to the young populations of the two cities and similar cities in Africa, it is important to promote the use of solar energy. To do this, governments should make these technologies accessible and raise awareness of their use. Third, many households still use wood and charcoal for cooking. To protect natural resources—mainly forests—it is necessary to develop, disseminate, and promote the use of natural energy sources for cooking. In addition, we must combat the proliferation of informal settlements, which are destroying natural resources and specifically peri-urban vegetation, and reduce the exploitation of forests and vegetation in outlying areas, as they play an important role in mitigating urban heat islands, flooding, and wind speeds. Finally, it is crucial to improve urban planning, increase the collective awareness, facilitate access to funding, and involve all stakeholders.
4.7. Limitations and Perspectives
Measures to adapt to and mitigate the impacts of climate change in urban areas involve several aspects, including policies, programmes, projects, and individual strategies. This study specifically examined people’s adaptation and mitigation strategies and their perceptions of how to improve these strategies. The study used a quantitative approach that involved households. One limitation of the study is that it did not address institutional aspects of strategies to combat climate change. Additionally, the study did not explore the constraints linked to the implementation of projects, programmes, and policies. Another limitation is that the study did not explore the financial and technical constraints of adaptation and mitigation measures.
To address these limitations, future research could explore international climate finance, private sector investments, and national and regional public financing. Such future work could involve national and international institutions working on urbanisation, the environment, and climate change. Studies may use a qualitative approach that involves all organisations working in the field of climate change. A qualitative study could use an interview guide specifically adapted to each organisation according to the policies, projects, and programmes that they are implementing. Finally, research could focus on financial and technical constraints, gaps in adaptation and mitigation, and countries’ legal frameworks.
5. Conclusions
This study evaluated the mitigation and adaptation strategies adopted by the urban populations in Abuja and Ouagadougou to protect themselves from adverse climate change effects.
The results showed that the respondents in both cities adopted various measures to adapt to climate phenomena and mitigate their causes. However, the level of adoption of these measures differed among the respondent groups in each city. The findings revealed a low level of adoption of climate change mitigation measures. Households make little use of renewable energy, which is an important factor to mitigate climate change. In particular, in Ouagadougou, the population does not use public transport. The results also showed that the authorities’ reactions to extreme weather events were poor in these two cities. The described mitigation and adaptation strategies reveal the resilience of urban populations, demonstrating the need to use an integrated approach at all levels to mitigate the effects of climate change. The results enabled the characterisation of the populations according to their sociodemographic statuses and their behaviour and perceptions with regard to climate change mitigation. This characterisation of these populations provides information for decision makers who wish to identify targets for the implementation of climate change mitigation projects or programmes in urban areas. This study contributes to the development of a better understanding of the determinants of the adoption of behaviours related to structural adaptation. The results will enhance the scientific community’s knowledge of how urban populations adapt and will help to improve the planning of adaptation actions. Taking into account the recurrence of weather-related events in these two cities in the last 30 years, it is necessary to develop adaptation indices for each climatic phenomenon. To effectively combat climate change, cities need to focus their policies and improve urban planning, as well as implementing policies to promote public transport and the use of renewable energy, improve access to decent housing, and target the development of undeveloped areas. It is also necessary to implement a policy for access to information, training, and awareness raising regarding climate change. In terms of urban design solutions, cities need to reduce their greenhouse gas emissions and respond effectively to risks through good urban planning, appropriate infrastructure, the development of green spaces, and the protection of natural vegetation.
Author Contributions
Conceptualisation, A.G., A.A.O., M.T. and O.N.; methodology, A.G., A.A.O., M.T. and O.N.; software, A.G.; validation, A.G., A.A.O., M.T. and O.N.; formal analysis, A.G.; investigation, A.G. and A.A.O.; data curation, A.G.; writing—original draft preparation, A.G., A.A.O. and M.T.; writing—review and editing, A.G., A.A.O., M.T. and O.N.; supervision, A.A.O., M.T. and O.N.; project administration, A.G.; funding acquisition, A.G. and A.A.O. All authors have read and agreed to the published version of the manuscript.
Funding
This research was funded by the German Federal Ministry of Education and Research (BMBF) under the West African Science Service Centre on Climate Change and Adapted Land Use (WASCAL) programme at the Federal University of Technology, Minna, Nigeria and through the project NetCDA (FKZ:01LG2301A).
Data Availability Statement
Data available on request from corresponding author.
Acknowledgments
The authors extend their appreciation to the Doctoral Research Programme on Climate Change and Human Habitats, the West African Science Service Centre on Climate Change and Adapted Land Use (WASCAL), the Federal University of Technology Minna, Nigeria, and the Institut Superieur des Sciences de la Population (ISSP) of Joseph KI-ZERBO University, Burkina Faso.
Conflicts of Interest
The authors declare no conflicts of interest.
References
- Agboola, O.P.; Alotaibi, B.S.; Dodo, Y.A.; Abuhussain, M.A. Abuhussain Built environment transformation in Nigeria: The effects of a regenerative framework. J. Asian Archit. Build. Eng. 2024, 23, 789–812. [Google Scholar] [CrossRef]
- Stevenson, S.; Coats, S.; Touma, D.; Otto-Bliesner, B. Twenty-first century hydroclimate: A continually changing baseline, with more frequent extremes. Proc. Natl. Acad. Sci. USA 2022, 119, e2108124119. [Google Scholar] [CrossRef] [PubMed]
- Intergovermental Panel on Climate Change (IPCC). Climate Change 2022: Impacts, Adaptation and Vulnerability. Summary for Policymakers. Working Group II Contribution to the Sixth Assessment Report of the Intergovernmental Panel on Climate Change; Cambridge University Press: Cambridge, UK, 2022; p. 3676. [Google Scholar]
- Brodhag, C. Glossaire Pour le Développement Durable. 2001. Available online: https://www.researchgate.net/publication/228780559 (accessed on 10 March 2024).
- Intergovernmental Panel on Climate Change (IPCC). Glossary. In Climate Change 2022—Impacts, Adaptation and Vulnerability; Cambridge University Press: Cambridge, UK, 2023; pp. 2897–2930. [Google Scholar]
- Adams, S. The pragmatic holism of social–ecological systems theory: Explaining adaptive capacity in a changing climate. Prog. Hum. Geogr. 2021, 45, 1580–1600. [Google Scholar] [CrossRef]
- Schmidt, J. Intuitively neoliberal? Towards a critical understanding of resilience governance. Eur. J. Int. Relat. 2015, 21, 402–426. [Google Scholar] [CrossRef]
- Marando, F.; Heris, M.P.; Zulian, G.; Udías, A.; Mentaschi, L.; Chrysoulakis, N.; Parastatidis, D.; Maes, J. Urban heat island mitigation by green infrastructure in European Functional Urban Areas. Sustain. Cities Soc. 2022, 77, 103564. [Google Scholar] [CrossRef]
- Boyd, D.; Pathak, M.; Diemen, V.; Skea, J. Mitigation co-benefits of climate change adaptation: A case-study analysis of eight cities. Sustain. Cities Soc. 2022, 77, 103563. [Google Scholar] [CrossRef]
- Satterthwaite, D.; Huq, S.; Pelling, M.; Reid, H.; Lankao, P.R. Adapting to Climate Change in Urban Areas; International Institute for Environment and Development: London, UK, 2007; Volume 58. [Google Scholar]
- Kalbarczyk, E.; Piegat, M. Implementation of Municipal Adaptation Plans to Climate Changes: Case Study of Poznań. Acta Sci. Pol. Adm. Locorum 2021, 20, 323–334. [Google Scholar] [CrossRef]
- Muñoz-erickson, T.A.; Miller, C.A.; Miller, T.R. How Cities Think: Knowledge Co-Production for Urban Sustainability and Resilience. Forests 2017, 8, 203. [Google Scholar] [CrossRef]
- Bosboeuf, P. Chercheur-Ses et de Cideur-Ses Face aux Politiques Locales D’adaptation aux Changements Climatiques: Les Organisations-Frontie res Comme Creusets de Savoirs Actionnables; Université Paris-Est Créteil: Créteil, France, 2021. [Google Scholar]
- Carman, J.P.; Zint, M.T. Defining and classifying personal and household climate change adaptation behaviors. Glob. Environ. Chang. 2020, 61, 102062. [Google Scholar] [CrossRef]
- van Valkengoed, A.M.; Perlaviciute, G.; Steg, L. Relationships between climate change perceptions and climate adaptation actions: Policy support, information seeking, and behaviour. Clim. Chang. 2022, 171, 14. [Google Scholar] [CrossRef]
- Wamsler, C.; Raggers, S. Principles for supporting city–citizen commoning for climate adaptation: From adaptation governance to sustainable transformation. Environ. Sci. Policy 2018, 85, 81–89. [Google Scholar] [CrossRef]
- Berrang-Ford, L.; Siders, A.R.; Lesnikowski, A.C.; Fischer, A.P.; Callaghan, M.; Haddaway, N.R.; Mach, K.; Araos, M.; Shah, M.A.R.; Wannewitz, M.; et al. Mapping evidence of human adaptation to climate change. Res. Sq. 2021. [Google Scholar] [CrossRef]
- Adger, W.N. Social Capital, Collective Action, and Adaptation to Climate Change. In Der Klimawandel; VS Verlag für Sozialwissenschaften: Wiesbaden, Germany, 2010; pp. 327–345. [Google Scholar]
- Wilson, R.S.; Herziger, A.; Hamilton, M.; Brooks, J.S. From incremental to transformative adaptation in individual responses to climate-exacerbated hazards. Nat. Clim. Chang. 2020, 10, 200–208. [Google Scholar] [CrossRef]
- Kuhlicke, C.; Seebauer, S.; Hudson, P.; Begg, C.; Bubeck, P.; Dittmer, C.; Grothmann, T.; Heidenreich, A.; Kreibich, H.; Lorenz, D.F.; et al. The behavioral turn in flood risk management, its assumptions and potential implications. WIREs Water 2020, 7, e1418. [Google Scholar] [CrossRef]
- Noll, B.; Filatova, T.; Need, A.; Taberna, A. Contextualizing cross-national patterns in household climate change adaptation. Nat. Clim. Chang. 2022, 12, 30–35. [Google Scholar] [CrossRef]
- Berrang-Ford, L.; Siders, A.R.; Lesnikowski, A.; Fischer, A.P.; Callaghan, M.W.; Haddaway, N.R.; Mach, K.J.; Araos, M.; Shah, M.A.R.; Wannewitz, M.; et al. A systematic global stocktake of evidence on human adaptation to climate change. Nat. Clim. Chang. 2021, 11, 989–1000. [Google Scholar] [CrossRef]
- World Meteorological Organization (WMO). World Weather Information Service. 2024. Available online: https://worldweather.wmo.int/en/city.html?cityId=324 (accessed on 16 March 2024).
- Ministry of Foreign Affairs of the Netherlands. Climate Change Profile West African Sahel. Minist. Foreign Aff. 2018.
- United Nations. World Urbanization Prospects. 2024. Available online: https://worldpopulationreview.com/world-cities/ (accessed on 17 March 2024).
- INSD. Cinquième Recensement Général de la Population et de l’Habitation du Burkina Faso Synthèse des Résultats Déninitifs; Ministère l’économie, des Financ. la Prospect: Ouagadougou, Burkina Faso, 2022; pp. 5–133. [Google Scholar]
- USAID. Sampling and Household Listing Manual:Demographic and Health Survey. ICF Int. 2012, 1–2. Available online: https://dhsprogram.com/pubs/pdf/DHSM4/DHS6_Sampling_Manual_Sept2012_DHSM4.pdf (accessed on 22 September 2024).
- Christiansen, L.; Martinez, G.; Prakriti, N. Adaptation Metrics: Perspectives on Measuring, Aggregating and Comparing Adaptation Results; UNEP DTU Partnership: Nairobi, Kenya, 2018. [Google Scholar]
- Floyd, D.L.; Prentice-Dunn, S.; Rogers, R.W.A. Meta-Analysis of Research on Protection Motivation Theory. J. Appl. Soc. Psychol. 2000, 30, 407–429. [Google Scholar] [CrossRef]
- Tuomimaa, J.; Käyhkö, J.; Juhola, S.; Räsänen, A. Developing adaptation outcome indicators to urban heat risks. Clim. Risk Manag. 2023, 41, 100533. [Google Scholar] [CrossRef]
- Gifford, R.; Kormos, C.; McIntyre, A. Behavioral dimensions of climate change: Drivers, responses, barriers, and interventions. WIREs Clim. Chang. 2011, 2, 801–827. [Google Scholar] [CrossRef]
- Backhaus, K.; Erichson, B.; Gensler, S.; Weiber, R.; Weiber, T. Regression Analysis. In Multivariate Analysis; Springer Fachmedien Wiesbaden: Wiesbaden, Germany, 2021; pp. 55–146. [Google Scholar]
- Mertler, C.A.; Vannatta, R.A.; LaVenia, K.N. Advanced and Multivariate Statistical Methods; Routledge: New York, NY, USA, 2021. [Google Scholar]
- Lê, S.; Josse, J.; Husson, F. FactoMineR: An R Package for Multivariate Analysis. J. Stat. Softw. 2008, 25, 1–18. [Google Scholar] [CrossRef]
- Husson, A.F.; Josse, J.; Le, S.; Mazet, J.; Husson, M.F. Package ‘FactoMineR’. J. Stat. Softw. 2024. Available online: https://cran.r-project.org/web/packages/FactoMineR/FactoMineR.pdf (accessed on 15 June 2025).
- Kassambara, A. Practical Guide to Principal Component Methods in R: PCA, M(CA), FAMD, MFA, HCPC, Factoextra; Volume 2 de Multivariate Analysis; STHDA, 2017; p. 169. ISBN 1975721136/9781975721138. Available online: https://www.datanovia.com/en/wp-content/uploads/dn-tutorials/book-preview/principal-component-methods-in-r-preview.pdf (accessed on 15 June 2025).
- Croce, S.; Vettorato, D. Urban surface uses for climate resilient and sustainable cities: A catalogue of solutions. Sustain. Cities Soc. 2021, 75, 103313. [Google Scholar] [CrossRef]
- Khamis, R. The Governance of Adaptation to Climate Change in Medium-Sized European Cities: A Comparative Assessment of Växjö (Sweden), Nijmegen (Netherlands), Leuven (Belgium), Rouen (France) and San Sebastian (Spain); Geography; Université de Pau et des Pays de l’Adour: Pau, France, 2022. [Google Scholar]
- Anderson, S.E.; Bart, R.R.; Kennedy, M.C.; MacDonald, A.J.; Moritz, M.A.; Plantinga, A.J.; Tague, C.L.; Wibbenmeyer, M. The dangers of disaster-driven responses to climate change. Nat. Clim. Chang. 2018, 8, 651–653. [Google Scholar] [CrossRef]
- Lauer, A.; Pausata, F.S.R.; Leroyer, S.; Argueso, D. Effect of urban heat island mitigation strategies on precipitation and temperature in Montreal, Canada: Case studies. PLoS Clim. 2023, 2, e0000196. [Google Scholar] [CrossRef]
- Roest, A.H.; Weitkamp, G.; van den Brink, M.; Boogaard, F. Mapping spatial opportunities for urban climate adaptation measures in public and private spaces using a GIS-based Decision Support Model. Sustain. Cities Soc. 2023, 96, 104651. [Google Scholar] [CrossRef]
- Garcia, D.A.; Dionysis, G.; Raskovic, P.; Duić, N.; Al-Nimr, M.A. Climate change mitigation by means of sustainable development of energy, water and environment systems. Energy Convers. Manag. X 2023, 17, 100335. [Google Scholar] [CrossRef]
- Deweerdt, T.; Fabre, A. The Role of Land Use Planning in Urban Transport to Mitigate Climate Change: A Literature Review. Adv. Environ. Eng. Res. 2022, 3, 3. [Google Scholar] [CrossRef]
- Maka, A.O.M.; Alabid, J.M. Solar energy technology and its roles in sustainable development. Clean Energy 2022, 6, 476–483. [Google Scholar] [CrossRef]
- Kalbarczyk, E.; Kalbarczyk, R. Credibility assessment of municipal climate change adaptation plans using the ex-ante method: A case study of Poland. Sustain. Cities Soc. 2022, 87, 104242. [Google Scholar] [CrossRef]
- Babcicky, P.; Seebauer, S. Unpacking Protection Motivation Theory: Evidence for a separate protective and non-protective route in private flood mitigation behavior. J. Risk Res. 2019, 22, 1503–1521. [Google Scholar] [CrossRef]
- van Valkengoed, A.M.; Steg, L. Meta-analyses of factors motivating climate change adaptation behaviour. Nat. Clim. Chang. 2019, 9, 158–163. [Google Scholar] [CrossRef]
- Mondal, M.S.H.; Murayama, T. and Nishikizawa, S. Examining the determinants of flood risk mitigation measures at the household level in Bangladesh. Int. J. Disaster Risk Reduct. 2021, 64, 102492. [Google Scholar] [CrossRef]
- Basson, F.; Dayamba, D.S.; Korahire, J.; Dipama, J.M.; Zougmore, F.; Neya, T. Institutional Barriers to Climate Change Adaptation in Burkina Faso: How could We Go around Them? J. Sustain. Dev. 2020, 13, 67. [Google Scholar] [CrossRef]
- Olazabal, M.; De Gopegui, M.R. Adaptation planning in large cities is unlikely to be effective. Landsc. Urban Plan. 2021, 206, 103974. [Google Scholar] [CrossRef]
- Castán Broto, V.; Westman, L.K. Ten years after Copenhagen: Reimagining climate change governance in urban areas. WIREs Clim. Change 2020, 11, e643. [Google Scholar] [CrossRef]
Disclaimer/Publisher’s Note: The statements, opinions and data contained in all publications are solely those of the individual author(s) and contributor(s) and not of MDPI and/or the editor(s). MDPI and/or the editor(s) disclaim responsibility for any injury to people or property resulting from any ideas, methods, instructions or products referred to in the content. |
© 2025 by the authors. Licensee MDPI, Basel, Switzerland. This article is an open access article distributed under the terms and conditions of the Creative Commons Attribution (CC BY) license (https://creativecommons.org/licenses/by/4.0/).