Abstract
Floods pose a substantial threat to both life and property, with their frequency and intensity escalating due to climate change. A comprehensive hydrological and hydraulic modeling approach is essential for understanding flood dynamics and developing effective future flood risk management strategies. The accuracy of Digital Elevation Models (DEMs) directly impacts the reliability of hydrologic simulations. This study focuses on evaluating the efficacy of two DEMs in hydrological modeling, specifically investigating their potential for daily discharge simulation in the Periyar River Basin, Kerala, India. Recognizing the limitations of the Hydrologic Engineering Center’s Hydrologic Modeling System (HEC-HMS) with the available dataset, a novel hybrid model was developed by integrating HEC-HMS outputs with an Artificial Neural Network (ANN). While precipitation, lagged precipitation, and lagged discharge served as inputs to the ANN, the hybrid model also incorporated HEC-HMS simulations as an additional input. The results demonstrated improved performance of the hybrid model in simulating daily discharge. The Hydrologic Engineering Center’s River Analysis System (HEC-RAS) was employed to predict flood inundation areas for both historical and future scenarios in the Aluva region of the Periyar River Basin, which was severely impacted during the 2018 Kerala floods. By integrating hydrological and hydraulic modeling approaches, this study aims to enhance flood prediction accuracy and contribute to the development of effective flood mitigation strategies.
1. Introduction
Floods cause significant loss of life and property. Floods resulting from unintended discharges of reservoirs—including those from dams, snowmelt, or tidal surges—or floods primarily triggered by extreme precipitation events represent well-documented impacts of climate change [1,2]. Throughout the 20th century, severe flood events caused millions of deaths and substantial economic losses. Between 2000 and 2019, flood-related disasters affected approximately 1.65 billion people, resulted in around 122,000 fatalities, and caused an estimated USD 563 billion in economic losses worldwide, as reported by the International Disaster Database. During this period, 3254 flood events were recorded globally—more than double the 1389 events reported between 1980 and 1999 [3]. The frequency and intensity of flooding events are rising in many regions worldwide, largely driven by the increasing severity of extreme precipitation under climate change [3,4,5,6,7,8]. This trend is further intensified by human-induced factors such as unplanned urban expansion, loss of vegetation cover, and inadequate drainage systems, all of which contribute to increased surface runoff and diminished natural infiltration. Projections from climate models indicate that flood-prone regions—especially in Southeast Asia and Sub-Saharan Africa—are likely to experience even more frequent and severe flooding in the future. This underscores the urgent need for adaptive planning, sustainable land use practices, and the development of resilient infrastructure to safeguard communities and ecosystems from the escalating impacts of flood hazards [9,10,11,12,13].
Terrain information is vital for any hydrological research, and remote sensing technology plays a crucial role in this regard. Global digital elevation models (GDEMs) are primarily constructed using stereo optical and interferometric radar satellite imagery, processed in various ways. The accuracy of these DEMs significantly affects subsequent calculations and hydrological modeling [14]. Therefore, selecting the most suitable DEM—considering the study’s objectives, accuracy requirements, and spatial scale—is essential [15,16]. For example, [15] analyzed the use of DEMs—AW3D30, ASTER GDEM V003, and SRTMGL1—for modeling a mountainous lake basin, conducting a comparative analysis of their spatial accuracy. Reference [17] suggested that, despite its coarser spatial resolution, SRTM delivers more accurate results than ASTER DEM for drainage delineation and basin morphometric analysis.
The intricate interplay between precipitation, terrain characteristics, and land surface influences the hydrological response of watersheds, impacting water availability, flood risk, and ecosystem health [18]. Rainfall-runoff modeling serves as a pivotal tool in understanding these dynamics, enabling the simulation of runoff generation and flow pathways within a watershed [19,20]. Among the array of modeling frameworks available, the Hydrologic Engineering Center’s Hydrologic Modeling System (HEC-HMS) stands out for its versatility, robustness, and wide-ranging applications in hydrological analysis and engineering. In a study by [21], HEC-HMS was found to have performance limitations. Increasingly, machine learning techniques are employed for modeling flood flows [22]. As a result, a hybrid model was developed by integrating HEC-HMS output with an artificial neural network (ANN) to simulate daily runoff.
Hydraulic modeling is an essential component of any system designed to predict river water levels and flood inundation [23]. Precise and reliable water level forecasts are critical for preventing flood damage and effectively planning interventions during high-risk situations. Reference [24] created flood inundation maps of the Indus Basin using HEC-RAS v5 software. Reference [25] conducted a study in the Aswah Bella River Basin in Ethiopia using HEC-RAS, HEC-GeoRAS, and HEC-HMS. They determined the maximum flow value using HEC-HMS and applied it as a boundary condition for hydraulic simulation.
The impact of climate change on water resources has become a subject of increasing interest and importance, as changes in precipitation patterns, temperature, and other climatic variables can significantly affect water availability, flood risk, and overall water management [26]. Recognizing the need to understand these impacts, researchers have increasingly adopted advanced hydrological modeling techniques to analyze how climate change influences various components of the water cycle [27,28,29]. One such technique is return period analysis, which evaluates the frequency and magnitude of extreme events—such as floods or droughts—and how they may shift under changing climate conditions [26]. Furthermore, the integration of hydraulic models such as HEC-RAS with hydrological models like HEC-HMS has proven effective for assessing climate change impacts on water systems. These models can simulate the complex interactions among precipitation, runoff, and the operation of hydraulic infrastructure [27,28]. For example, [28,29] employed HEC-HMS and HEC-RAS to estimate flood risks under varying return periods. Understanding return periods is crucial for floodplain zoning, infrastructure design, and risk management. It informs the development of building codes, insurance policies, and the design of resilient flood protection measures tailored to specific levels of flood risk.
From the reviewed literature, it is evident that current studies often lack a comprehensive evaluation of the comparative effectiveness of different digital elevation models (DEMs) in hydrological modeling, especially under diverse climate change scenarios. Moreover, there is limited analysis of localized flood risks in regions such as the Periyar River Basin. Integrated approaches that combine both hydrological and hydraulic modeling are needed to produce accurate flood inundation maps for specified return periods in the context of future climate scenarios. Additionally, previous studies have reported limitations in the performance of HEC-HMS when used alone.
The primary objectives of this study are as follows: (1) to evaluate the effectiveness of different DEMs in hydrological modeling; (2) to simulate future streamflow in the Aluva region of the Periyar Basin under various climate change scenarios using a hybrid hydrologic model; and (3) to generate flood inundation maps for a 100-year return period using hydraulic modeling. This study integrates hydrological and hydraulic models to accurately delineate potential flood-inundation zones, offering valuable insights for flood risk reduction and climate-resilient planning.
2. Materials and Methods
2.1. Study Area
Kerala, situated between the Western Ghats and the Arabian Sea, is one of the most flood-prone regions in India. It ranks among the states with the highest population density and lies at the foothills of the Western Ghats, a prominent orographic barrier. The state is home to 44 medium- and small-sized rivers, each following a short course that traverses all three physiographic zones—highland, midland, and lowland—before emptying into the Arabian Sea [30,31,32]. The dominance of a monsoonal climate has contributed to frequent and severe flooding across various parts of Kerala [33]. During the southwest (SW) monsoon in mid-August 2018, central Kerala experienced its most devastating flood since 1924, submerging vast areas and severely affecting several regions, especially Ernakulam [33,34]. To effectively identify flood-prone zones, it is essential to generate potential inundation maps under various climate change scenarios [35,36].
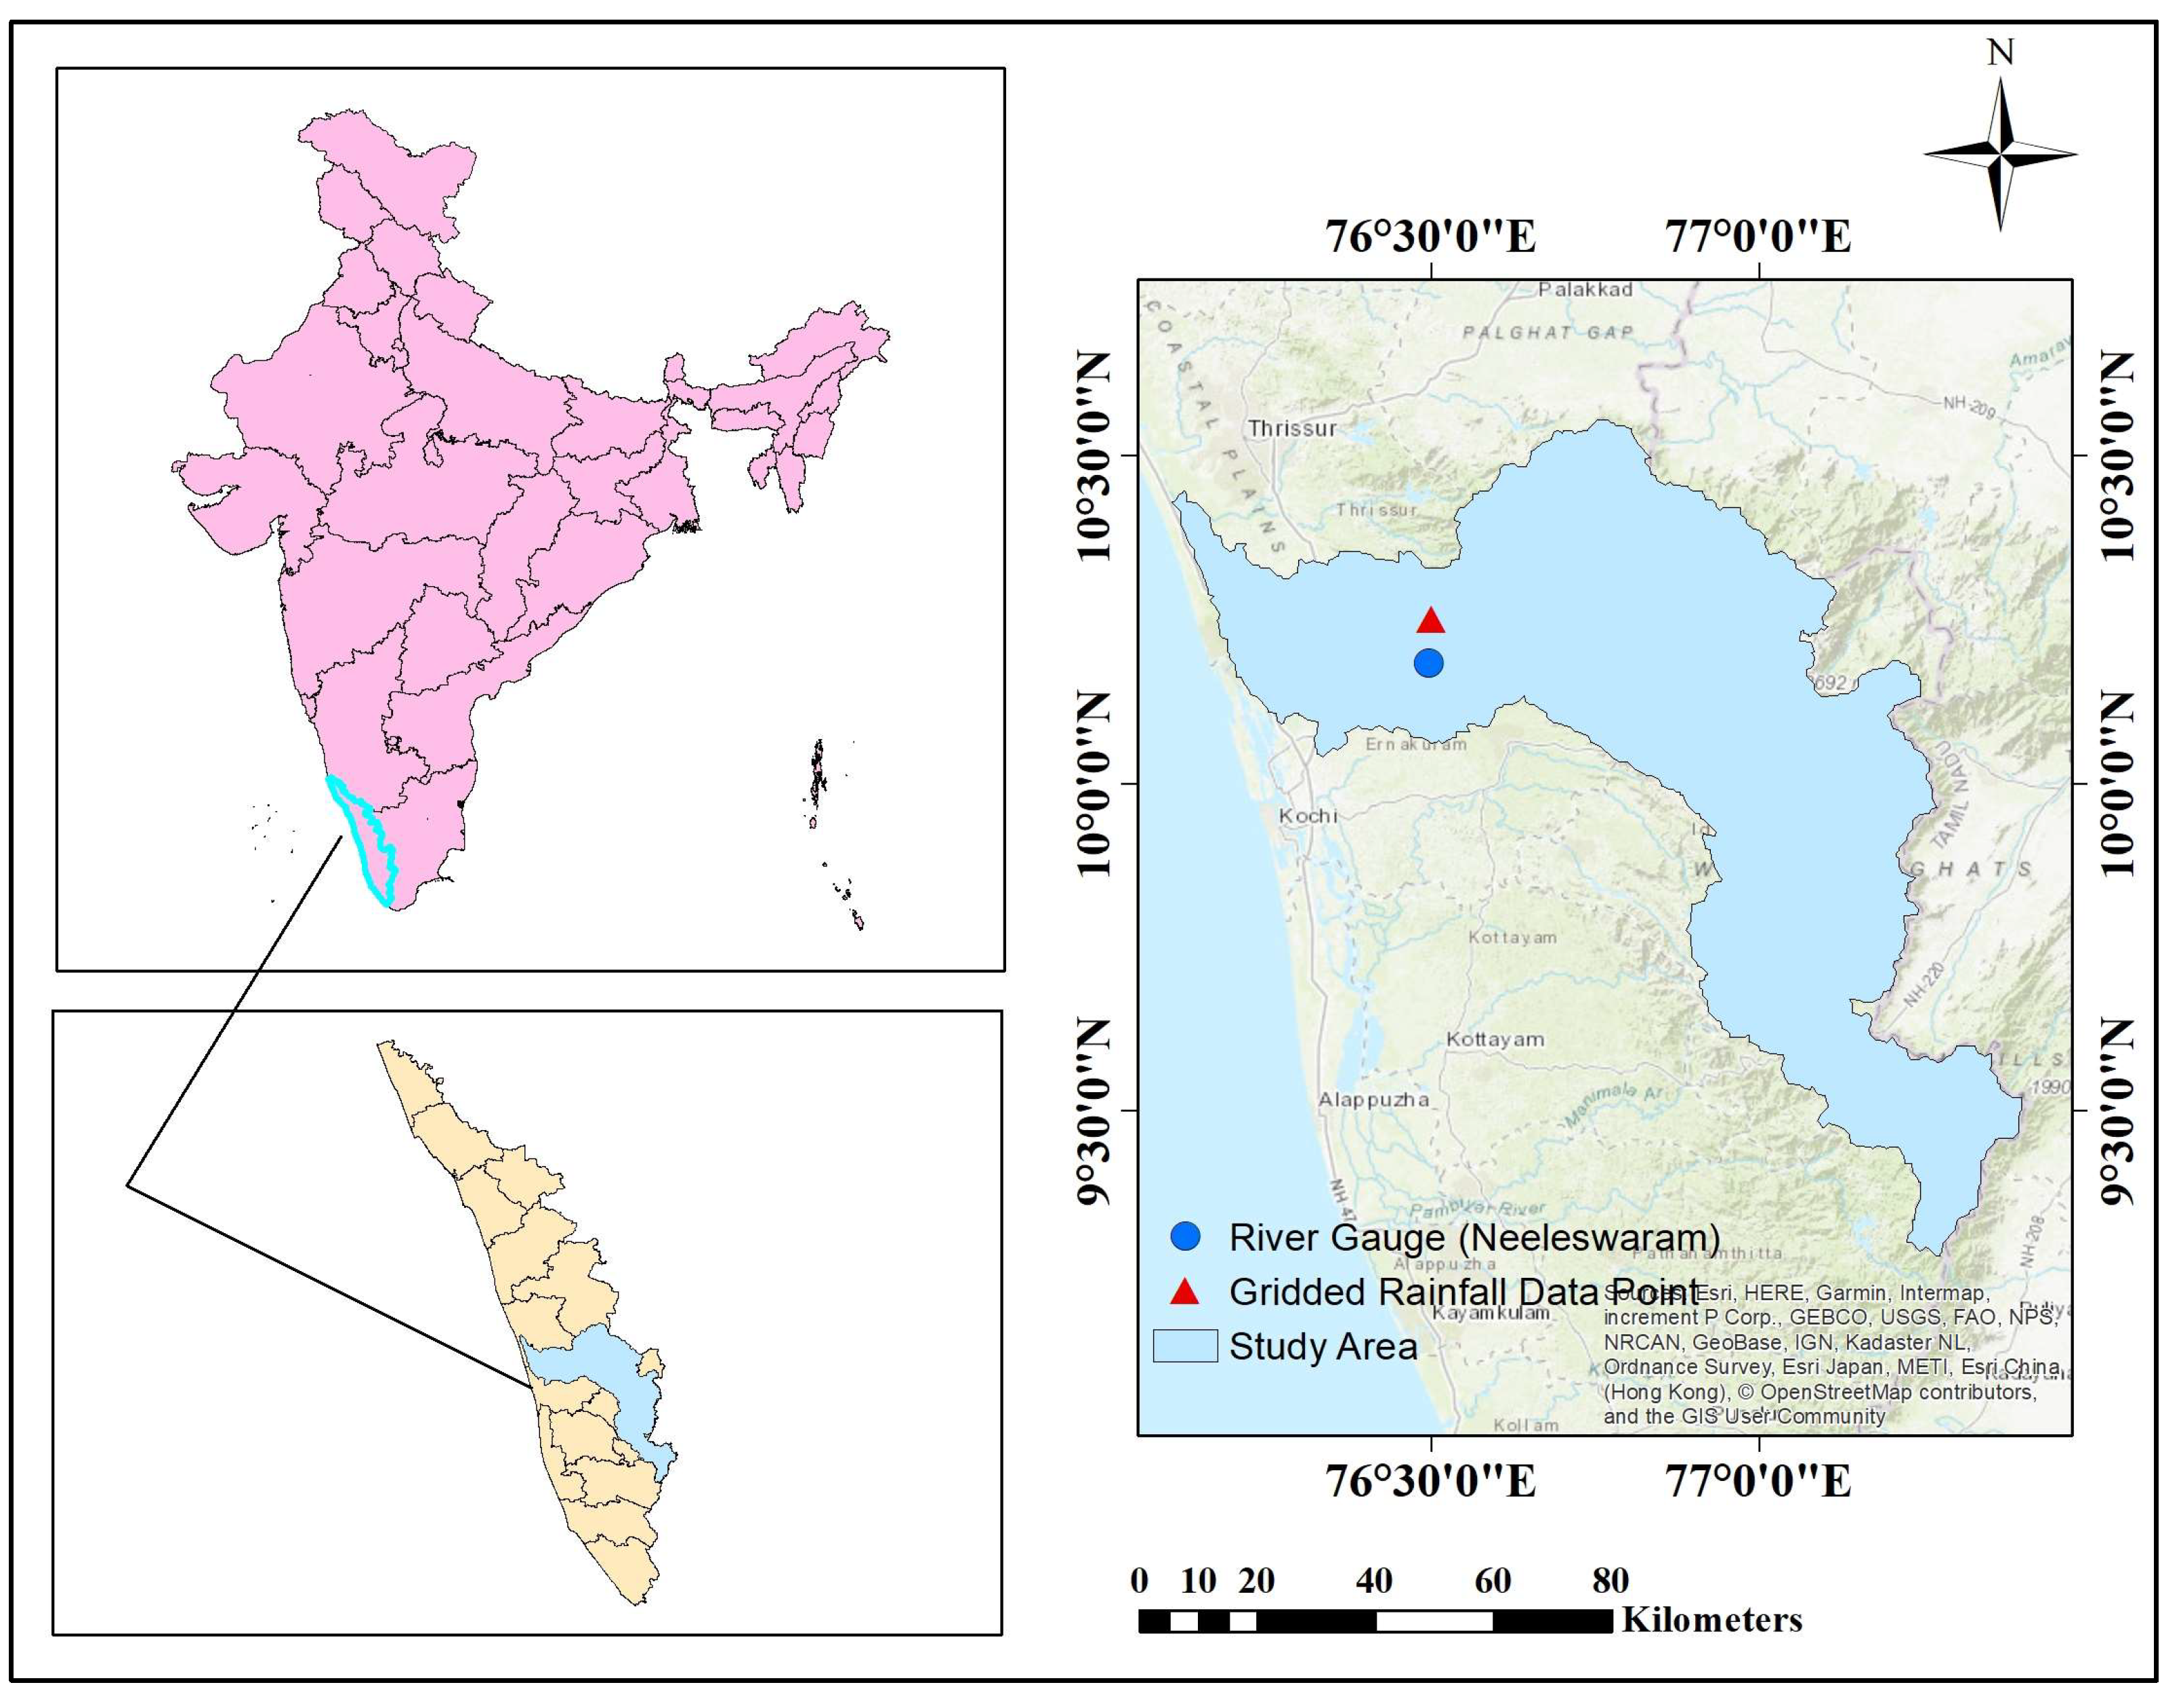
The Periyar River, the longest river in Kerala, also has the highest discharge potential in the state. The Periyar River Basin (Figure 1) lies between latitudes 9°15′30″ N and 10°21′00″ N and longitudes 76°08′38″ E and 77°24′32″ E. The river extends approximately 244 km and encompasses a catchment area of 5398 km2, of which 5284 km2 lies in Kerala and 114 km2 in Tamil Nadu. It originates from the Sivagiri group of hills within the Periyar Tiger Reserve, at an elevation of about 1830 m, and drains parts of the Idukki, Ernakulam, and Thrissur districts in Kerala, as well as the Coimbatore district in Tamil Nadu. A river gauge station at Neeleshwaram monitors the flow characteristics of the Periyar. Aluva, part of the Kochi metropolitan area, is located about 15 km from the city center on the banks of the Periyar River. Due to its proximity to the river, many areas within Aluva municipality have been frequently isolated from the mainland during periods of continuous rainfall.
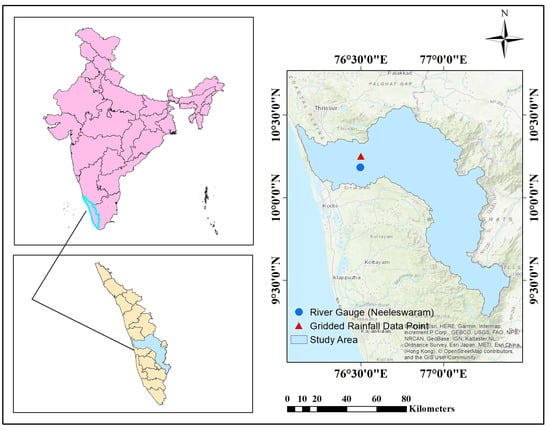
Figure 1.
Study area: Periyar River Basin, including the Chalakkudi sub-basin.
2.2. Database
In this study, DEMs with a spatial resolution of 30 m × 30 m were obtained from the Indian Space Research Organization (ISRO) and the United States Geological Survey (USGS). Hydrological data for the period 2014–2019 were collected from the India Water Resources Information System (India-WRIS). Rainfall data with a spatial resolution of 0.25° × 0.25° and temperature data with a resolution of 1.0° × 1.0° were sourced from the India Meteorological Department (IMD), Pune. Soil data were obtained from the Food and Agriculture Organization (FAO), and land use/land cover (LULC) data were collected from ISRO. The details of all datasets used in this study are presented in Table 1.

Table 1.
Details of collected datasets used in the study.
2.3. Methodology
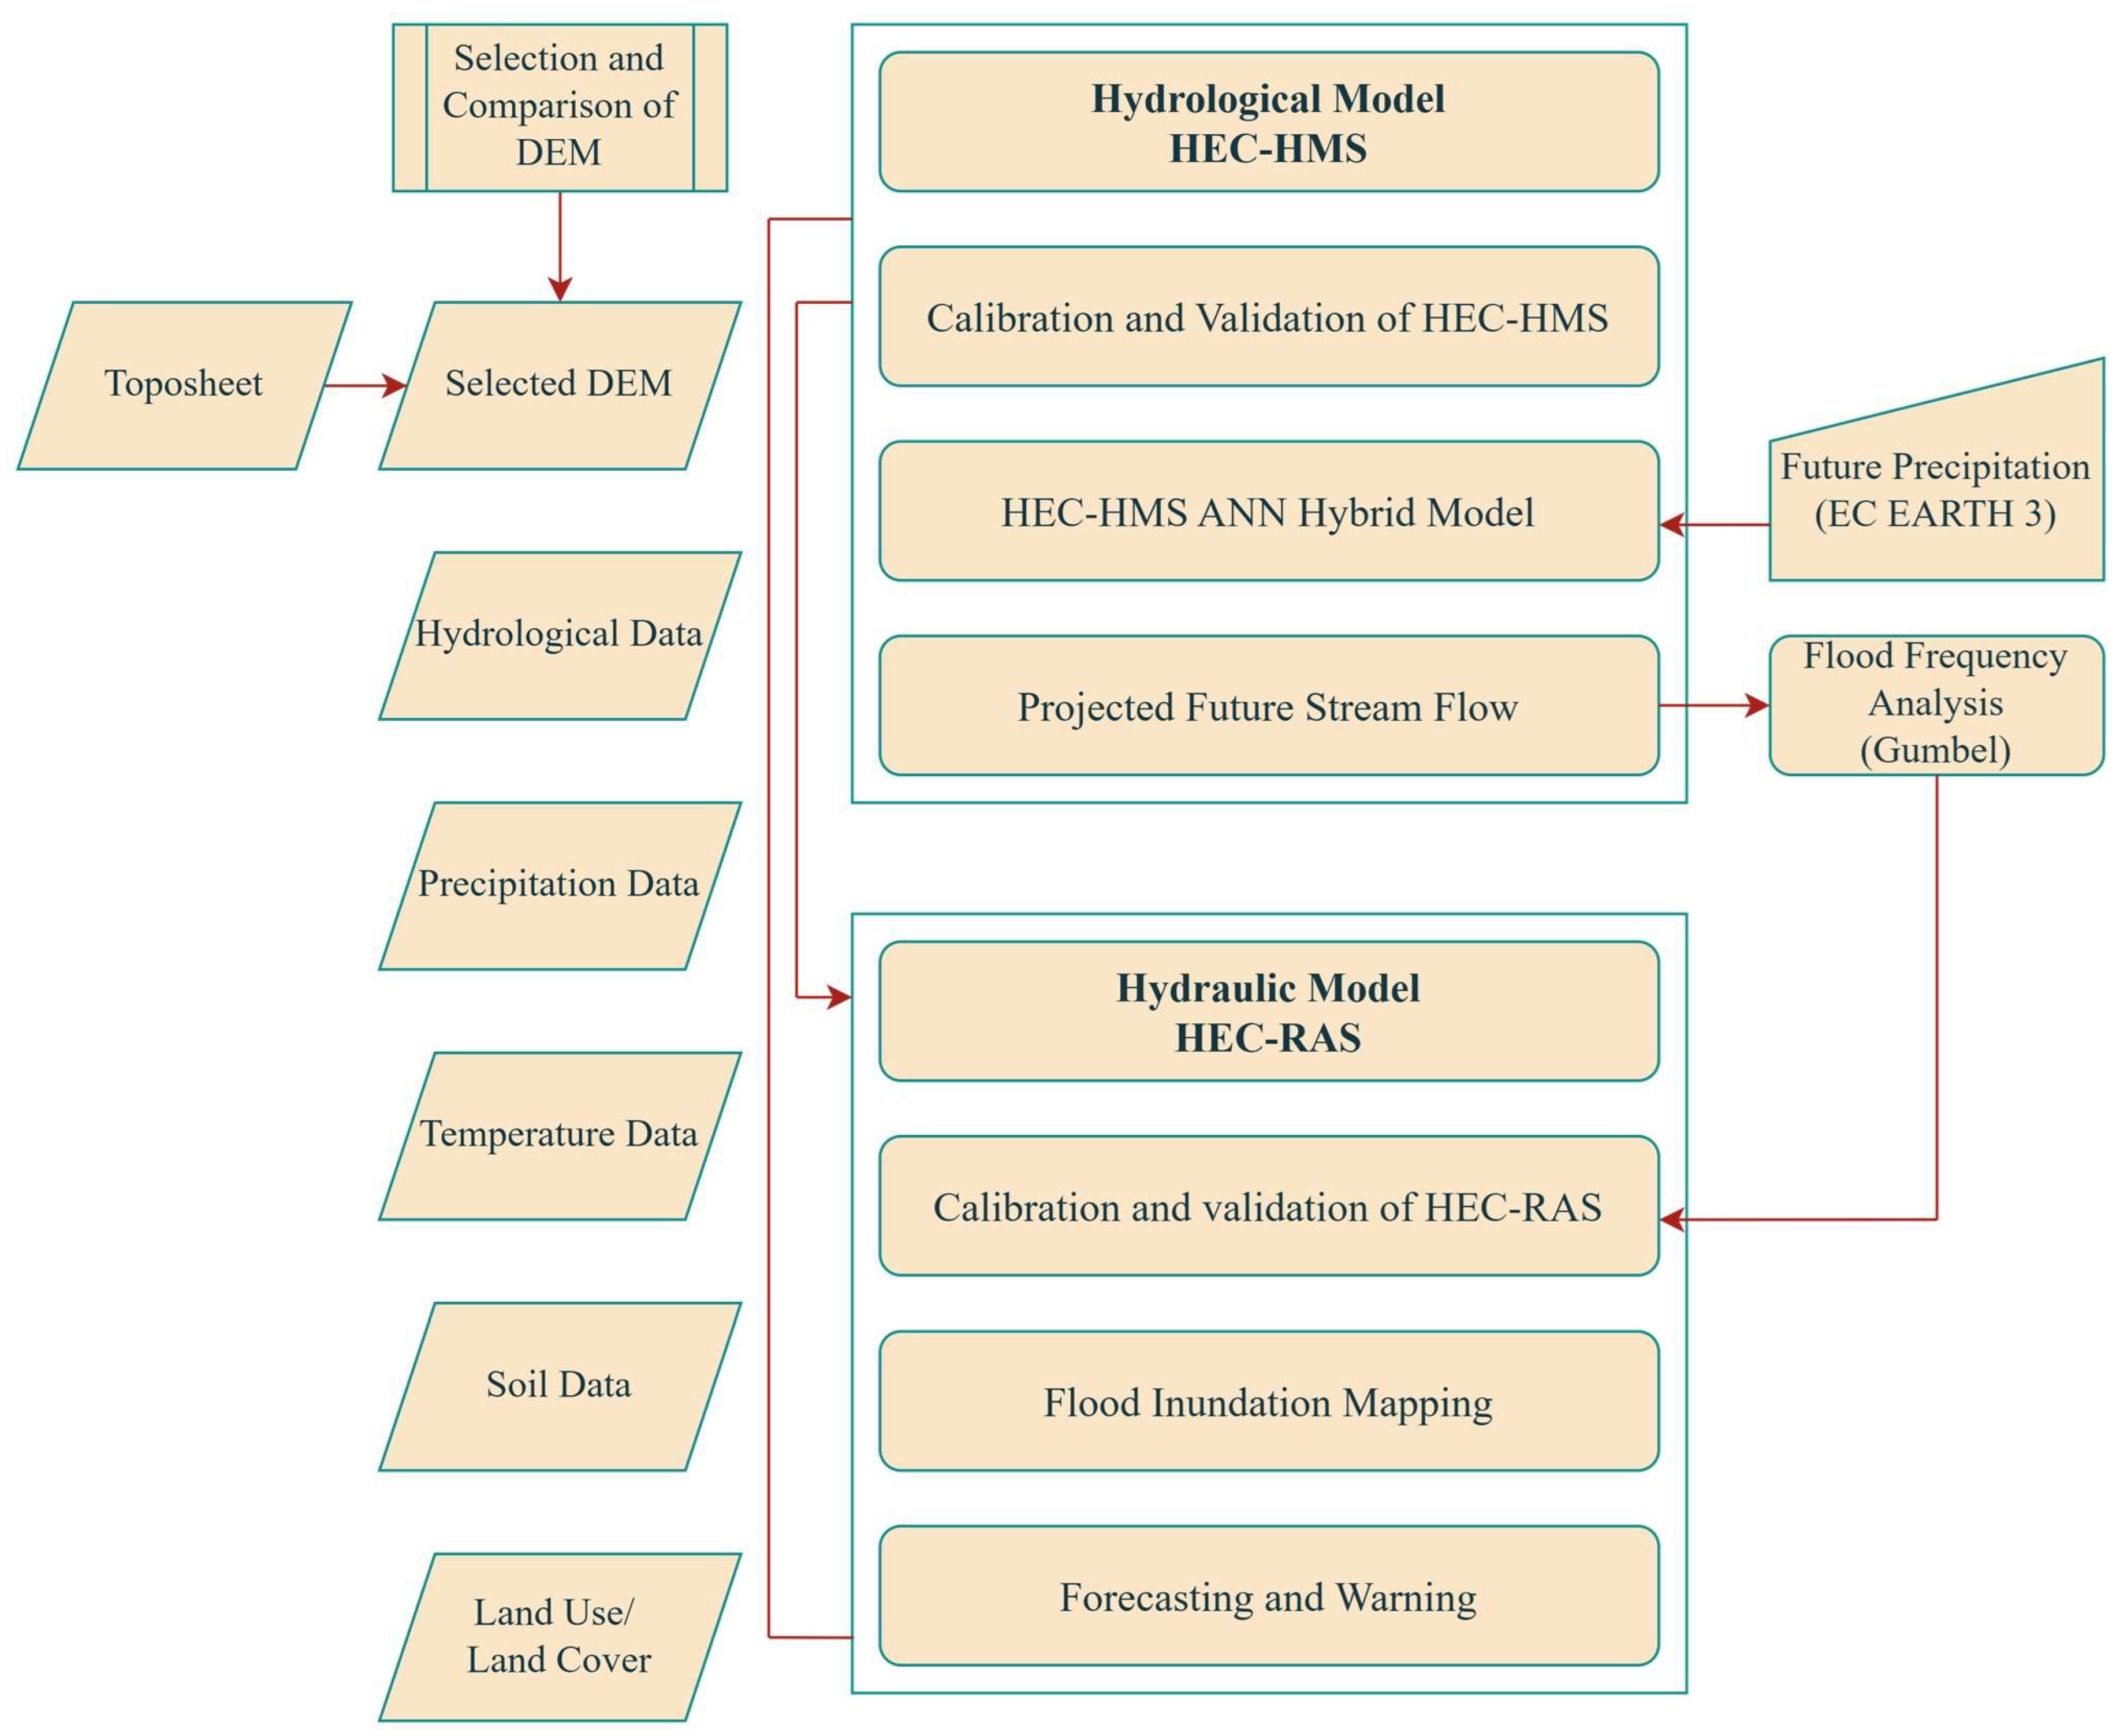
This study utilizes two digital elevation models (DEMs) with a spatial resolution of 30 m × 30 m—SRTM (https://earthexplorer.usgs.gov/ accessed on 20 August 2023) and Cartosat-1 (https://bhuvan-app3.nrsc.gov.in/data/download/index.php accessed on 25 August 2023)—to compare topographic attributes for hydrologic analysis. The methodology adopted for this analysis is illustrated in Figure 2.
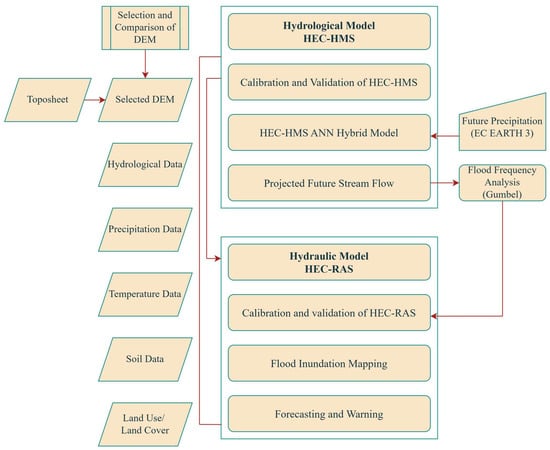
Figure 2.
Flowchart illustrating the methodology adopted in the study.
2.3.1. Comparison and Selection of DEM
CARTOSAT-1 is the first Indian Remote Sensing Satellite capable of capturing in-orbit stereo imagery. A key objective of the mission is to generate Digital Elevation Models (DEMs) and corresponding ortho-images to support large-scale mapping and terrain modeling applications. Launched on 5 May 2005 by PSLV-C6 from the Satish Dhawan Space Centre (SLP) in Sriharikota, Cartosat-1 is capable of acquiring high-resolution imagery over both Indian and global regions.
The Shuttle Radar Topography Mission (SRTM) is another major source of DEM data, resulting from a collaborative effort between NASA and the National Geospatial-Intelligence Agency (NGA). The mission aimed to produce a near-global elevation dataset of the Earth’s surface and successfully collected topographic information covering approximately 80% of the planet’s land area in February 2000. This mission produced the first nearly global land elevation dataset. SRTM DEM data are publicly available through platforms such as the USGS Earth Explorer and are typically provided in a geographic coordinate system (EPSG:4326). Commonly available resolutions include 30 m and 90 m, and the data are widely used for applications such as flood risk assessment, land use planning, and infrastructure development.
In this study, the relevant CartoDEM and SRTM DEM tiles for the Periyar River Basin were downloaded from the Bhuvan and USGS portals, respectively. Following data acquisition, preprocessing was performed using ArcGIS, including tasks such as re-projection and resampling to ensure uniform resolution and coordinate systems. ArcGIS tools were also used for watershed and basin delineation. DEM elevation values were validated against reference elevations from Google Earth to ensure consistency and accuracy.
2.3.2. Rainfall–Runoff Modeling
Rainfall–runoff models are widely used to assess climate-related risks by forecasting streamflow and other hydrological responses. Among these, the Hydrologic Engineering Center’s Hydrologic Modeling System (HEC-HMS), developed by the U.S. Army Corps of Engineers, is one of the most commonly adopted tools for hydrological simulation and analysis. HEC-HMS is designed to model surface runoff and channel flow within a watershed and incorporates various methods for loss estimation, flow transformation, baseflow separation, and reach routing.
In this study, the Soil Conservation Service (SCS) Curve Number method is applied to estimate infiltration losses, while the SCS Unit Hydrograph method is used to compute direct runoff. Flow routing within stream reaches is simulated using the Muskingum method. The accurate determination of the curve number (CN) is essential when applying the SCS method, as it depends on land use, soil type, and slope.
Land use/land cover (LULC) data for the study area are derived from ESA Sentinel-2 imagery, which provides a high spatial resolution of 10 m. Curve Number values are generated using a combination of the LULC map, soil data, and a digital elevation model (DEM) with the help of HEC-GeoHMS 10.2 software. The soil data are sourced from the Food and Agriculture Organization (FAO), which provides a Digitized Soil Map of the World at a 1:5,000,000 scale in a geographic projection. These datasets are integrated in HEC-GeoHMS to generate the CN map for the Periyar River Basin.
2.3.3. Calibration and Validation of the HEC-HMS Model
Daily rainfall and streamflow data from 2014 to 2016 were used for model calibration, while data from 2018 were used for validation. Land use/land cover (LULC) and soil characteristics were assumed to remain unchanged during the calibration period. In HEC-HMS, the autocalibration feature was employed to optimize model parameters. Specifically, the simplex optimization method was used to minimize the root mean square error (RMSE) and obtain the best-fit parameters for the simulated model. These optimized parameters were subsequently applied during the validation phase.
To evaluate the performance of the HEC-HMS model, four statistical metrics were used as follows: the correlation coefficient (R), Nash–Sutcliffe Efficiency (NSE), percent bias (PBIAS), and root mean square error (RMSE). The correlation coefficient (R) quantifies the strength and direction of the relationship between observed and simulated streamflow values, indicating how well the model predictions align with actual outcomes. The Nash–Sutcliffe Efficiency (NSE) measures the predictive accuracy of the model, with values closer to 1 indicating higher efficiency. Percent bias (PBIAS) evaluates the average tendency of the simulated values to overestimate or underestimate the observed values. RMSE quantifies the average magnitude of prediction error, serving as a comprehensive measure of model accuracy. HEC-HMS computes and displays these summary statistics to assess the model’s performance against observed data.
2.3.4. HEC-HMS-ANN Hybrid Model
Traditional hydrologic and hydraulic models, such as HEC-HMS and HEC-RAS, have been widely used for flood forecasting and simulation. However, these models often require extensive input data and substantial computational resources, which can pose challenges in regions with limited data availability or computational capacity [37,38]. To address these limitations, researchers have increasingly explored the integration of machine learning (ML) approaches. Additionally, traditional hydrologic models may produce inaccurate simulations in certain conditions. In such cases, combining machine learning techniques—such as artificial neural networks (ANNs)—with physical models can enhance forecasting performance.
One such approach is the HEC-HMS-ANN hybrid model, which integrates the strengths of HEC-HMS (a physically based hydrologic model) with the pattern-recognition capabilities of ANN [37]. This hybrid approach leverages the physical understanding of hydrologic processes simulated by HEC-HMS, while the ANN component captures complex nonlinear relationships by learning from historical data [39,40].
In this study, a hybrid modeling framework was developed to improve simulation accuracy by integrating HEC-HMS outputs with an ANN. The HEC-HMS-simulated discharge was used as an additional input to the ANN, along with precipitation, observed discharge, and its lagged values. The appropriate lag structure was identified using the Partial Autocorrelation Function (PACF). An artificial neural network is composed of interconnected nodes (neurons), structured into the following layers: an input layer, one or more hidden layers, and an output layer. In a typical feed-forward architecture, information flows from the input to the output layer. During training, the network adjusts the connection weights to learn the relationship between inputs and outputs. Inputs to a node may originate from external variables or from the outputs of nodes in a previous layer.
A key component of ANN architecture is the activation function, which governs the learning behavior and convergence of the model. In this study, the ‘Tansig’ (hyperbolic tangent sigmoid) activation function was used in the hidden layer to capture nonlinear relationships, while the ‘Purelin’ (linear) function was applied in the output layer for the continuous prediction of runoff.
Data preprocessing is a critical step in developing effective ANN models. In this study, both normalization and robust scaling techniques were applied for feature scaling. Normalization transforms the data to have a mean of 0 and a standard deviation of 1, while robust scaling uses the median and interquartile range (IQR), making it less sensitive to outliers. This is especially important when input features differ in units or magnitude, as inconsistent scales can adversely affect model performance. Preprocessing not only stabilizes and accelerates training but also improves computational efficiency and model accuracy.
The performance of the HEC-HMS-ANN hybrid model was evaluated using statistical metrics including the correlation coefficient (R), Nash–Sutcliffe Efficiency (NSE), and percent bias (PBIAS).
2.3.5. Flood Inundation Modeling
The Hydrologic Engineering Center’s River Analysis System (HEC-RAS) is a computer program developed to simulate river flow in open, natural channels and compute water surface profiles. Widely adopted by hydraulic engineers and researchers, HEC-RAS is particularly valued for its ability to model unsteady flow conditions and identify flood-prone zones where ground elevations fall below calculated water levels. It also facilitates the visualization of flood extents along river reaches. Accurate river geometry inputs—including centerlines, bank lines, flow paths, and cross-sections—are essential for delineating flood-prone areas within the HEC-RAS modeling framework.
In this study, runoff values generated by HEC-HMS were used as boundary conditions for the HEC-RAS model. The primary objective of creating flood inundation maps is to provide accurate and timely information on the spatial extent of flooding along the Periyar River. Flood severity varies by location due to factors such as topographic slope and rainfall intensity. Therefore, identifying flood hazard zones along the river is critical, as it offers valuable insights into potential flood depths—particularly in low-lying and downstream areas—ultimately aiding in the protection of lives and property.
2.3.6. Future Flood Inundation Map
The NEX-GDDP-CMIP6 dataset consists of globally downscaled climate projections derived from General Circulation Model (GCM) runs under CMIP6, spanning the four ‘Tier 1’ Shared Socioeconomic Pathways (SSPs). In this study, precipitation data from the EC-Earth3 CMIP6 model were used under the SSP2–4.5 scenario. These precipitation projections were provided as input to the HEC-HMS model to simulate future streamflow (discharge). Subsequently, frequency analysis was conducted using the Gumbel distribution method to estimate the discharge corresponding to a 100-year return period. This return level was then used as an input boundary condition in HEC-RAS to generate flood inundation maps under different climate scenarios.
3. Results and Discussions
3.1. Comparison and Selection of DEM
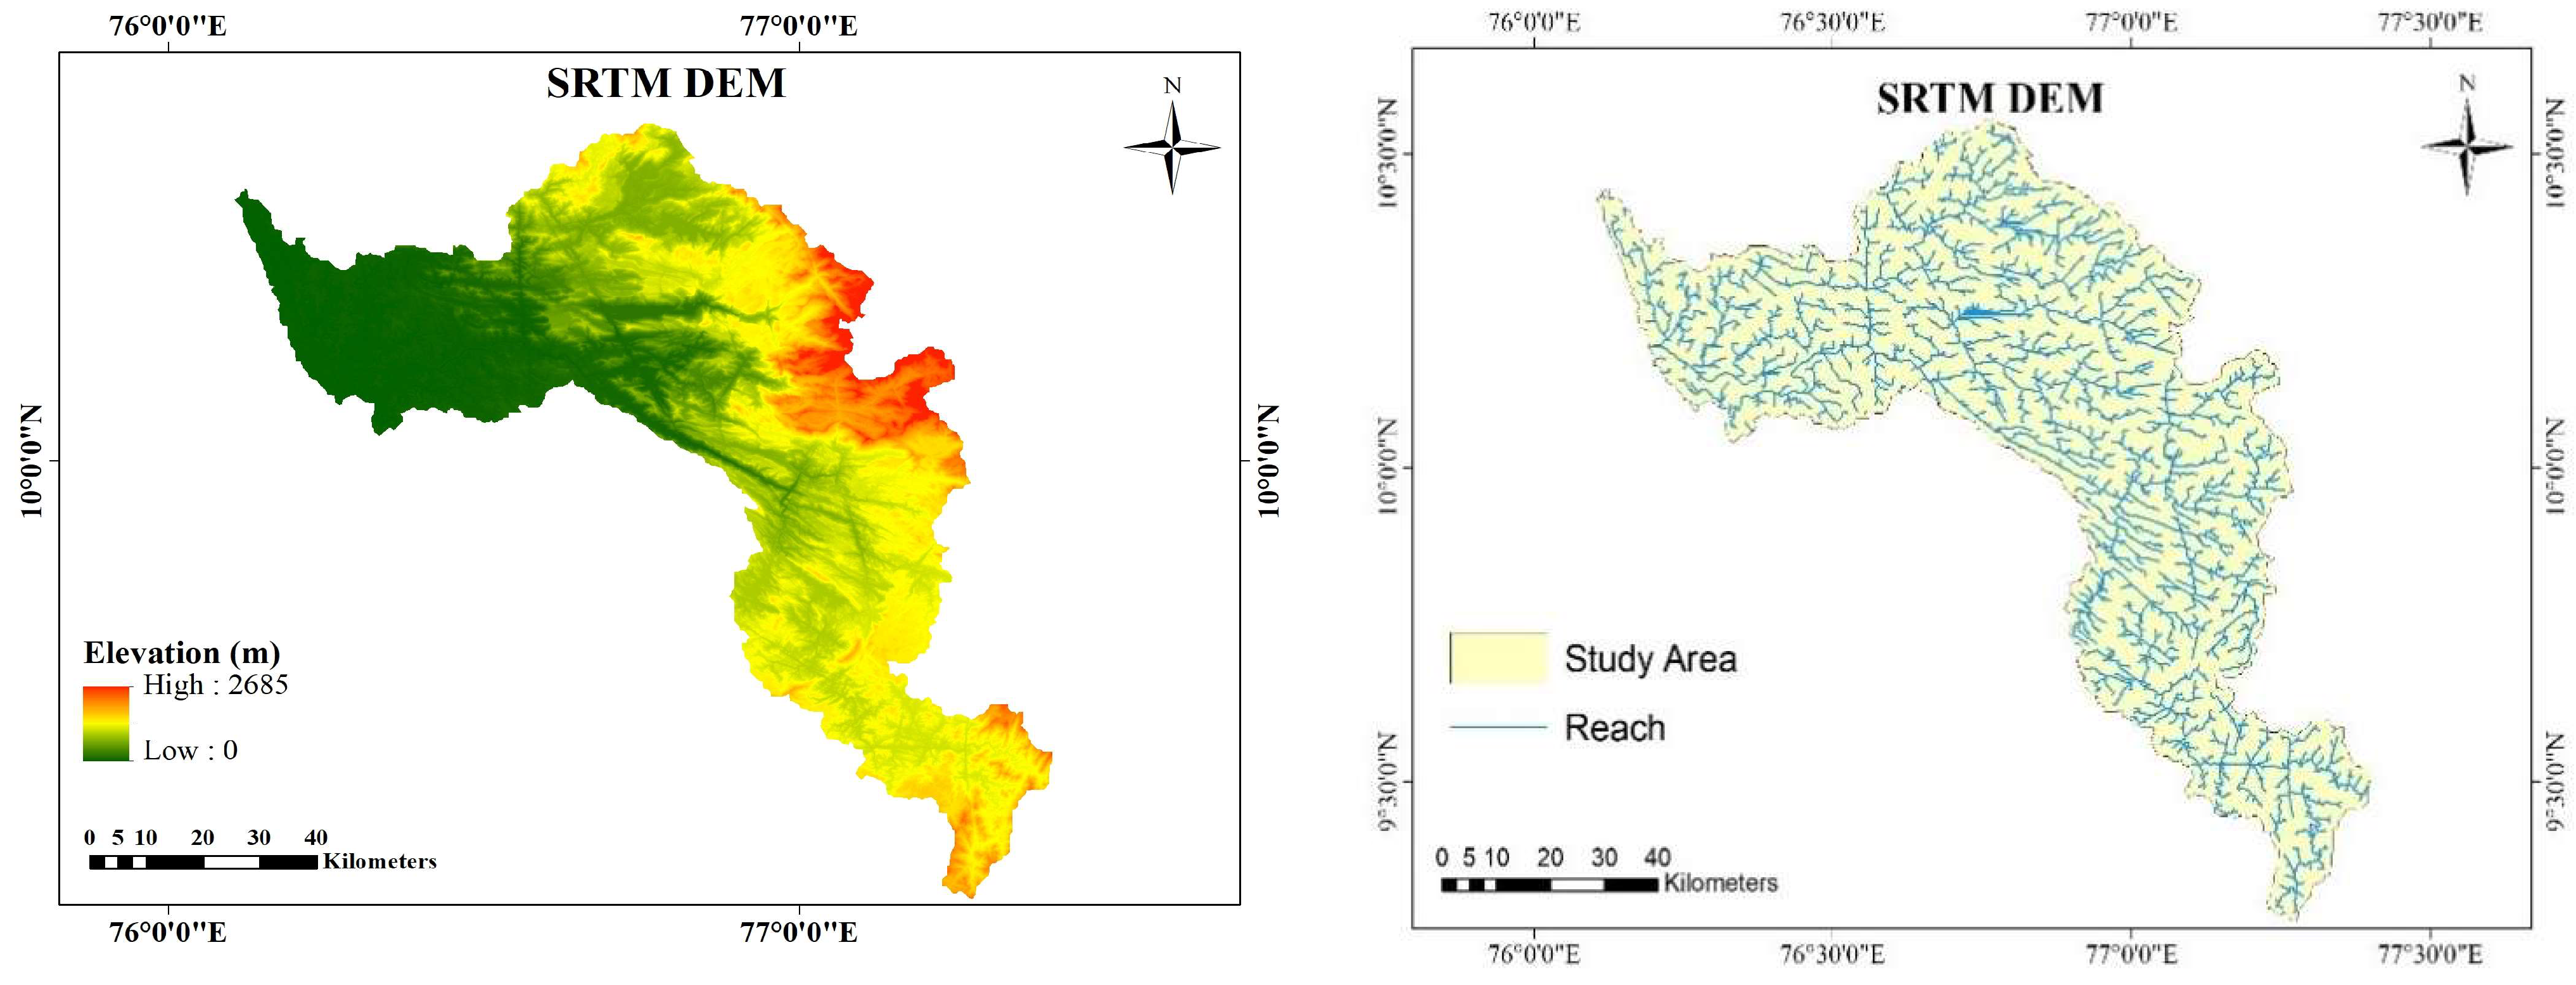
A comparison of DEMs derived from CartoDEM (sourced from ISRO Bhuvan version 1.0) and SRTM (obtained from USGS) revealed notable differences in hydrological representation within the Periyar River Basin. Key basin characteristics, including the area, perimeter, and the length of the longest stream reach, are presented in Table 2. Notably, the SRTM DEM (Figure 3) exhibited a more interconnected stream network compared to the CartoDEM (Figure 4). This variation in stream connectivity can be attributed to several factors, including the complex geomorphological features of the Periyar Basin and differences in data acquisition methods.
Table 2.
Properties of DEM.

Figure 3.
SRTM digital elevation model (DEM) of the study area.
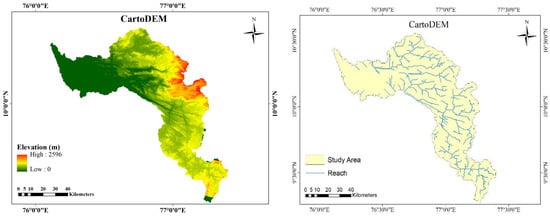
Figure 4.
CARTODEM of the study area.
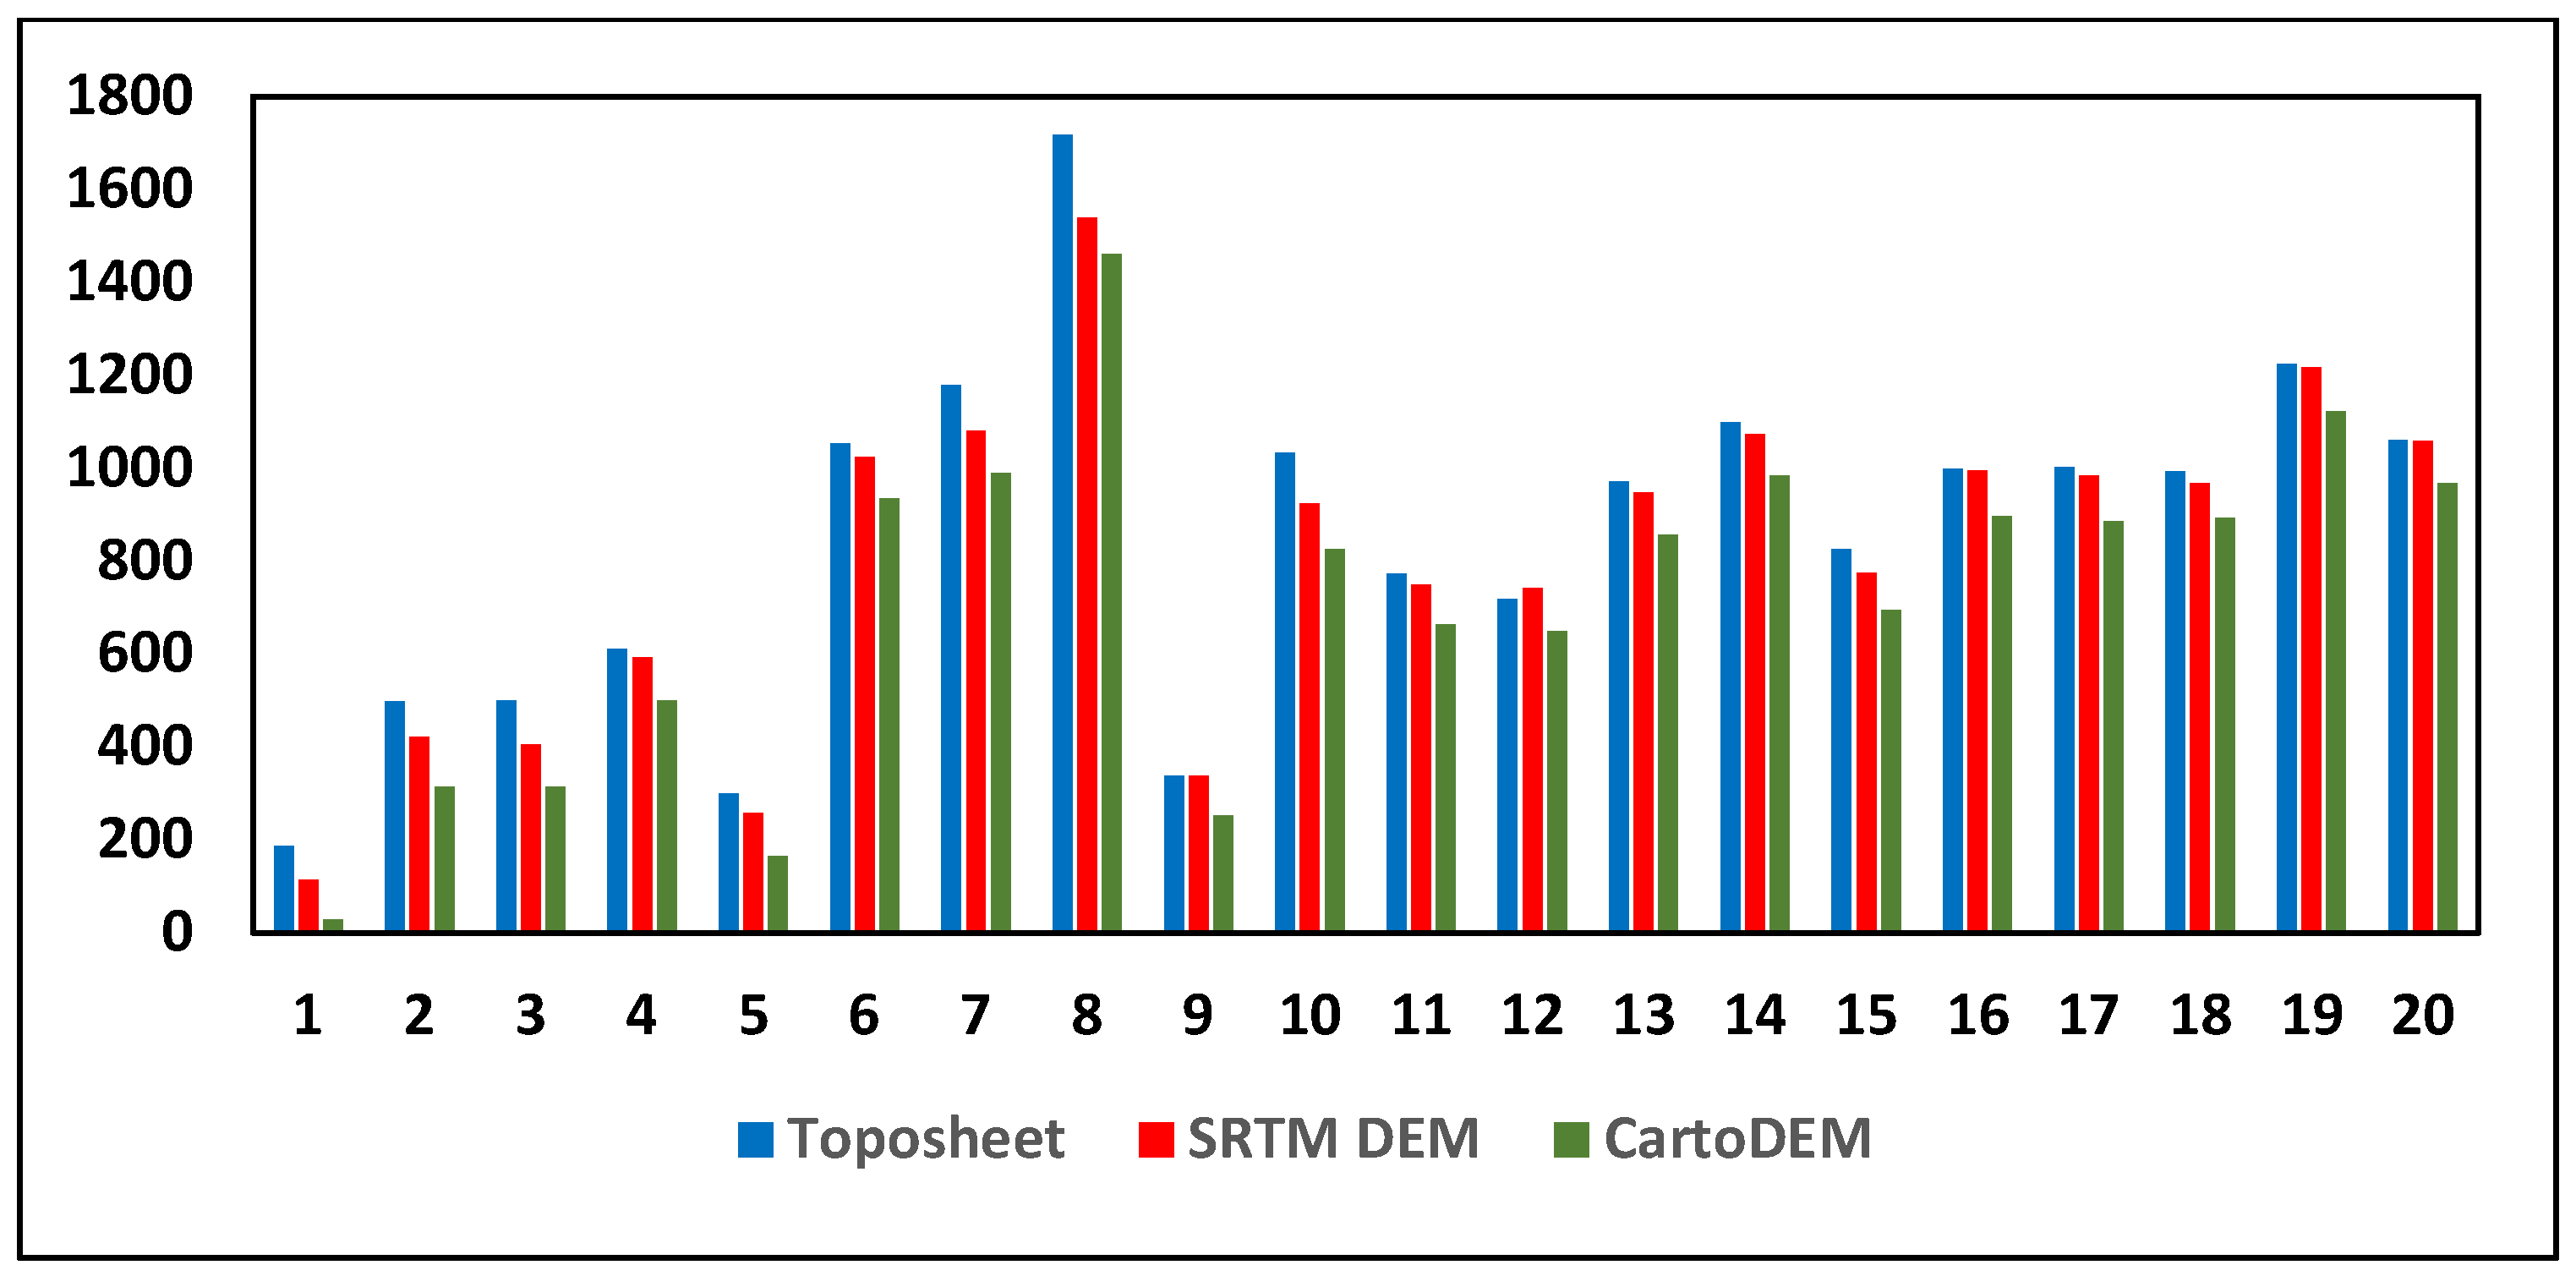
The elevation correlation of both SRTM and CartoDEM with reference to topographic maps (toposheets) is shown in Figure 5, with corresponding values summarized in Table 3. The SRTM DEM demonstrated a stronger correlation with the toposheet data compared to CartoDEM, indicating higher consistency in terrain representation. Disparities in stream path delineation between the two DEMs may also result from differences in data acquisition methodologies—such as radar signal penetration and spatial resolution.
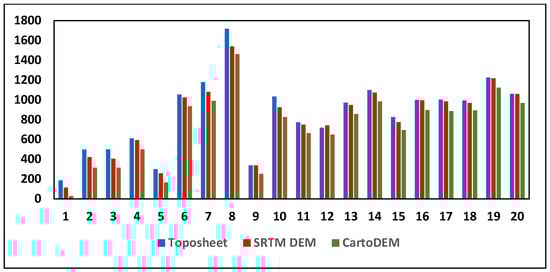
Figure 5.
Elevation data at sample points for DEM validation.
Table 3.
Comparison of DEM elevation values with toposheet reference data.
The more pronounced stream network connectivity observed in the SRTM-derived DEM underscores the importance of understanding geological, topographical, and methodological intricacies when conducting hydrological modeling in the Periyar Basin. Such insights are critical to selecting the most appropriate elevation data source for accurate hydrologic simulations.
3.2. Comparison of Rainfall and Discharge
Rainfall and discharge data from the period 2014 to 2016 and 2018 are visually represented using a contour map in Figure 6. While visual comparison does not establish a continuous spatial relationship, it remains a valuable tool for understanding how specific rainfall events correspond to discharge responses within the same time frame. The contour map highlights the intensity and timing of individual events, providing insights into their hydrological impact.
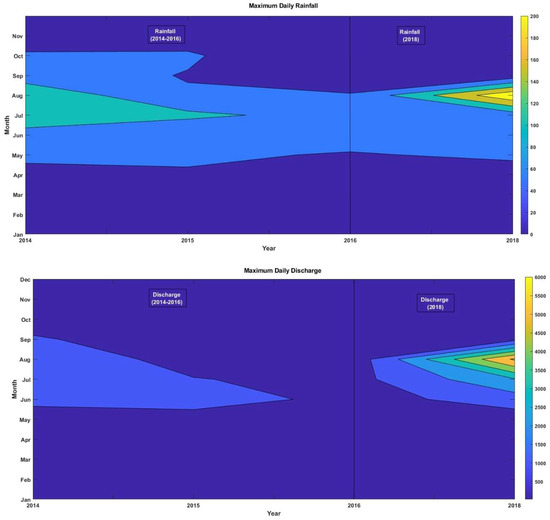
Figure 6.
Contour map of maximum daily rainfall and discharge for the selected months during 2014–2016 and 2018.
A high correlation coefficient of 0.92 between rainfall and discharge indicates a strong temporal relationship during these events. This suggests that, within the observed periods, higher rainfall consistently resulted in increased discharge. Such a strong correlation supports the reliability of rainfall as a predictive indicator for streamflow during intense precipitation events captured in the analysis.
The contours illustrate that specific rainfall events have a significant and immediate impact on discharge levels. This observation is crucial for understanding the dynamics of storm events and other short-term weather phenomena and their effects on hydrological systems. The strong correlation between rainfall and discharge can be effectively leveraged to improve event-based predictive models. By anticipating rainfall intensity and timing, it becomes possible to more accurately forecast corresponding discharge events, thereby enhancing the effectiveness of flood forecasting and event-based water resource management strategies.
3.3. Rainfall–Runoff Modeling
The LULC map and soil map of the study area were prepared and are presented in Figure 7. The study area includes distinct land cover classes such as built-up areas, plantations, croplands, flooded vegetation, range land, bare ground, and open ground. Among these, plantations occupy the majority of the basin’s area. The dominant soil type in the Periyar River Basin is loamy clay, which plays a significant role in influencing the hydrological response of the watershed.
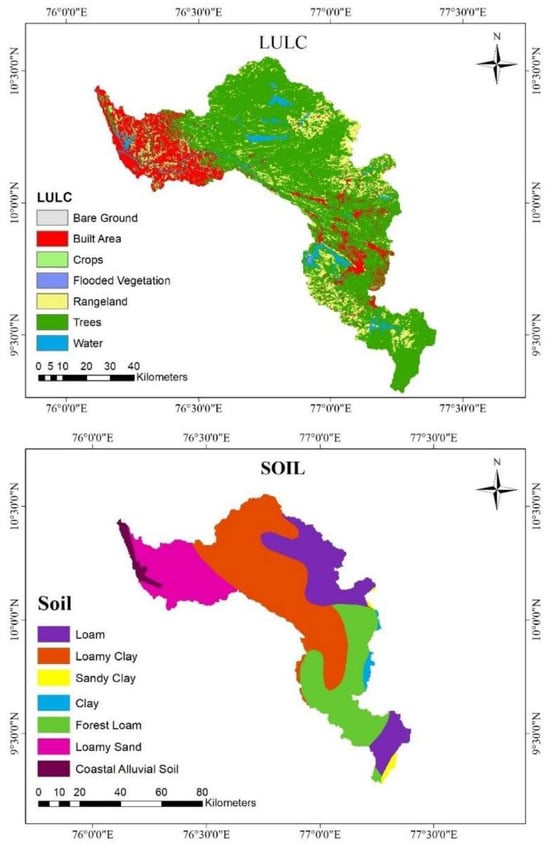
Figure 7.
Land use/land cover (LULC) and soil map of the Periyar River Basin.
3.3.1. Calibration and Validation
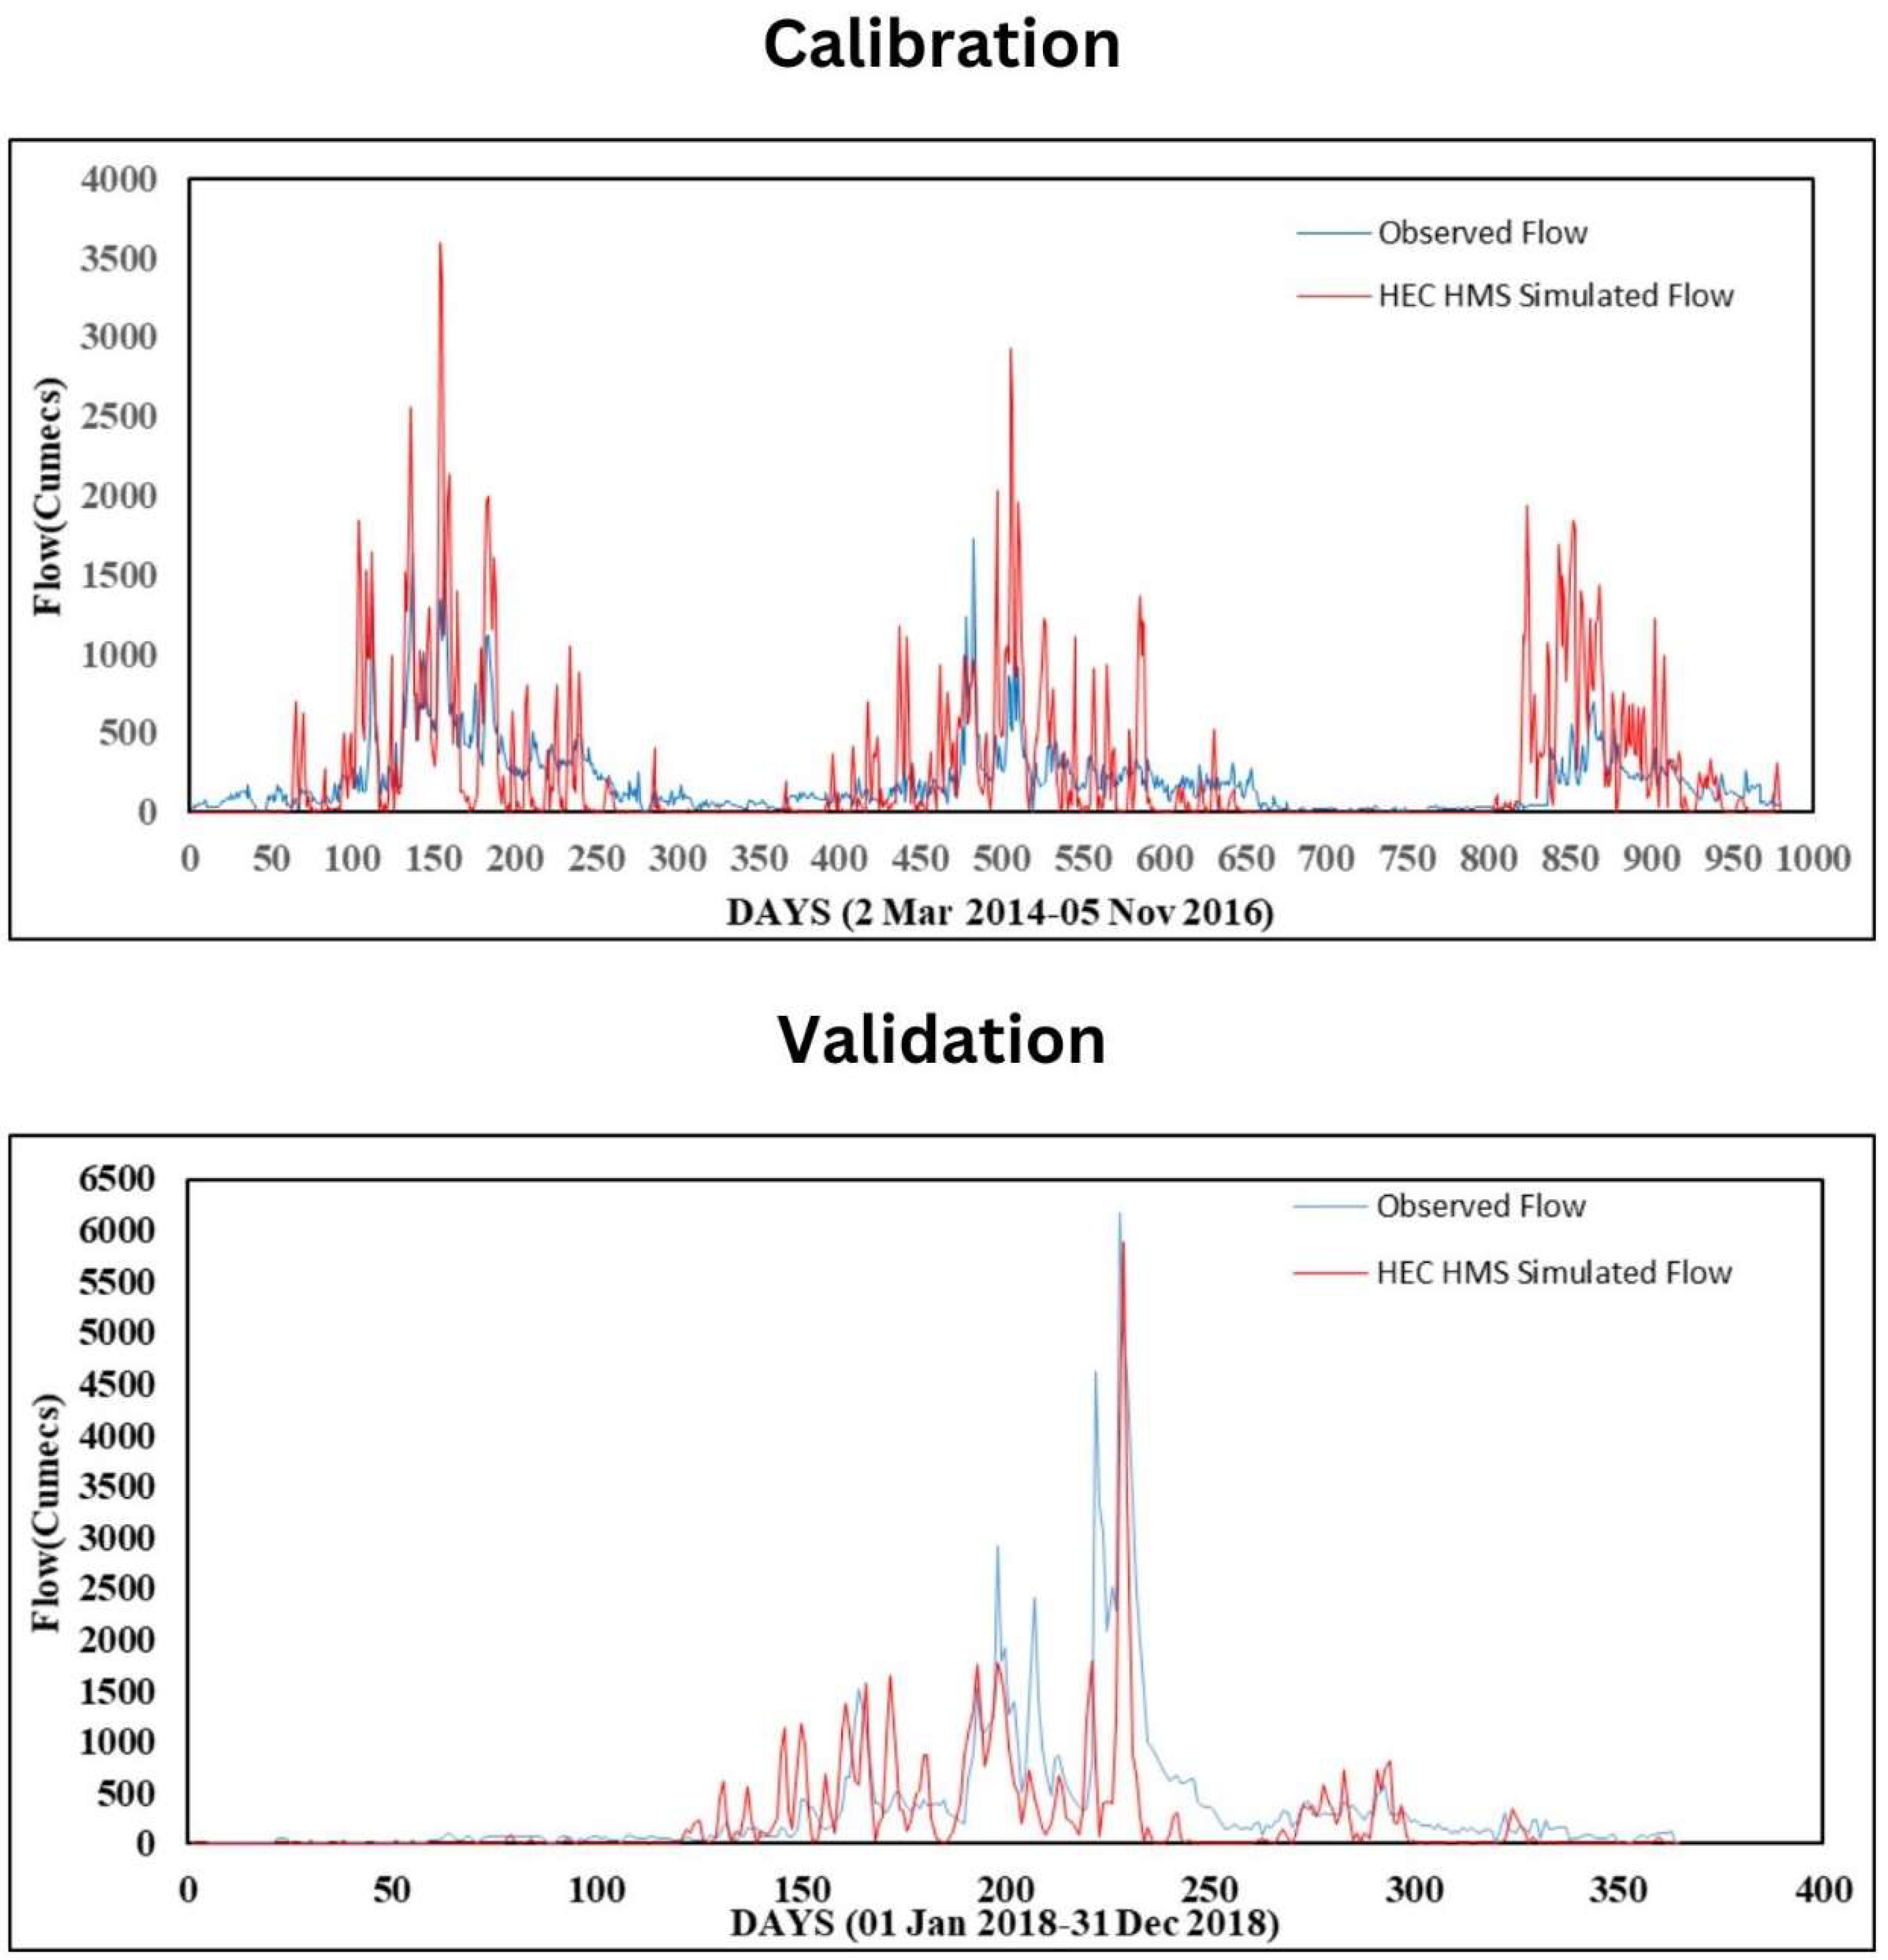
The HEC-HMS model was developed using gridded rainfall data from 2014 to 2016 for the area near the Neeleswaram river gauge station. Model-simulated discharge was subsequently validated using observed real-time discharge data from the year 2018 at the same station. The performance metrics for both calibration and validation phases are summarized in Table 4. The correlation coefficient (R) was found to be 0.82 during calibration and 0.66 during validation, indicating a strong and moderate correlation, respectively. The Nash–Sutcliffe Efficiency (NSE) values were 0.398 for calibration and 0.193 for validation, suggesting moderate to low model efficiency. Figure 8 presents the comparison of observed and simulated streamflow during both calibration and validation periods.
Table 4.
HEC-HMS performance indicators.
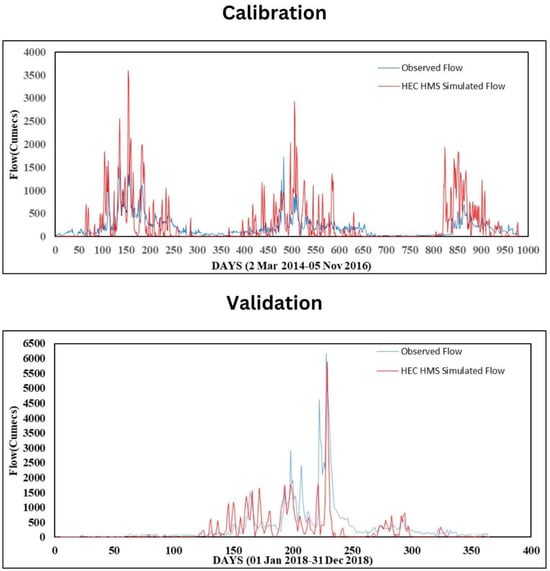
Figure 8.
Comparison of observed and HEC − HMS-simulated streamflows during calibration and validation periods.
3.3.2. HEC-HMS-ANN Hybrid Model
The HEC-HMS model alone did not provide satisfactory results in simulating discharge for the Aluva region of the Periyar River Basin. To improve prediction accuracy, this study incorporated the simulated discharge from the semi-distributed HEC-HMS model, along with its lagged values, as additional inputs to an Artificial Neural Network (ANN) model. Prior to training the ANN, input data were preprocessed using both robust scaling and normalization techniques.
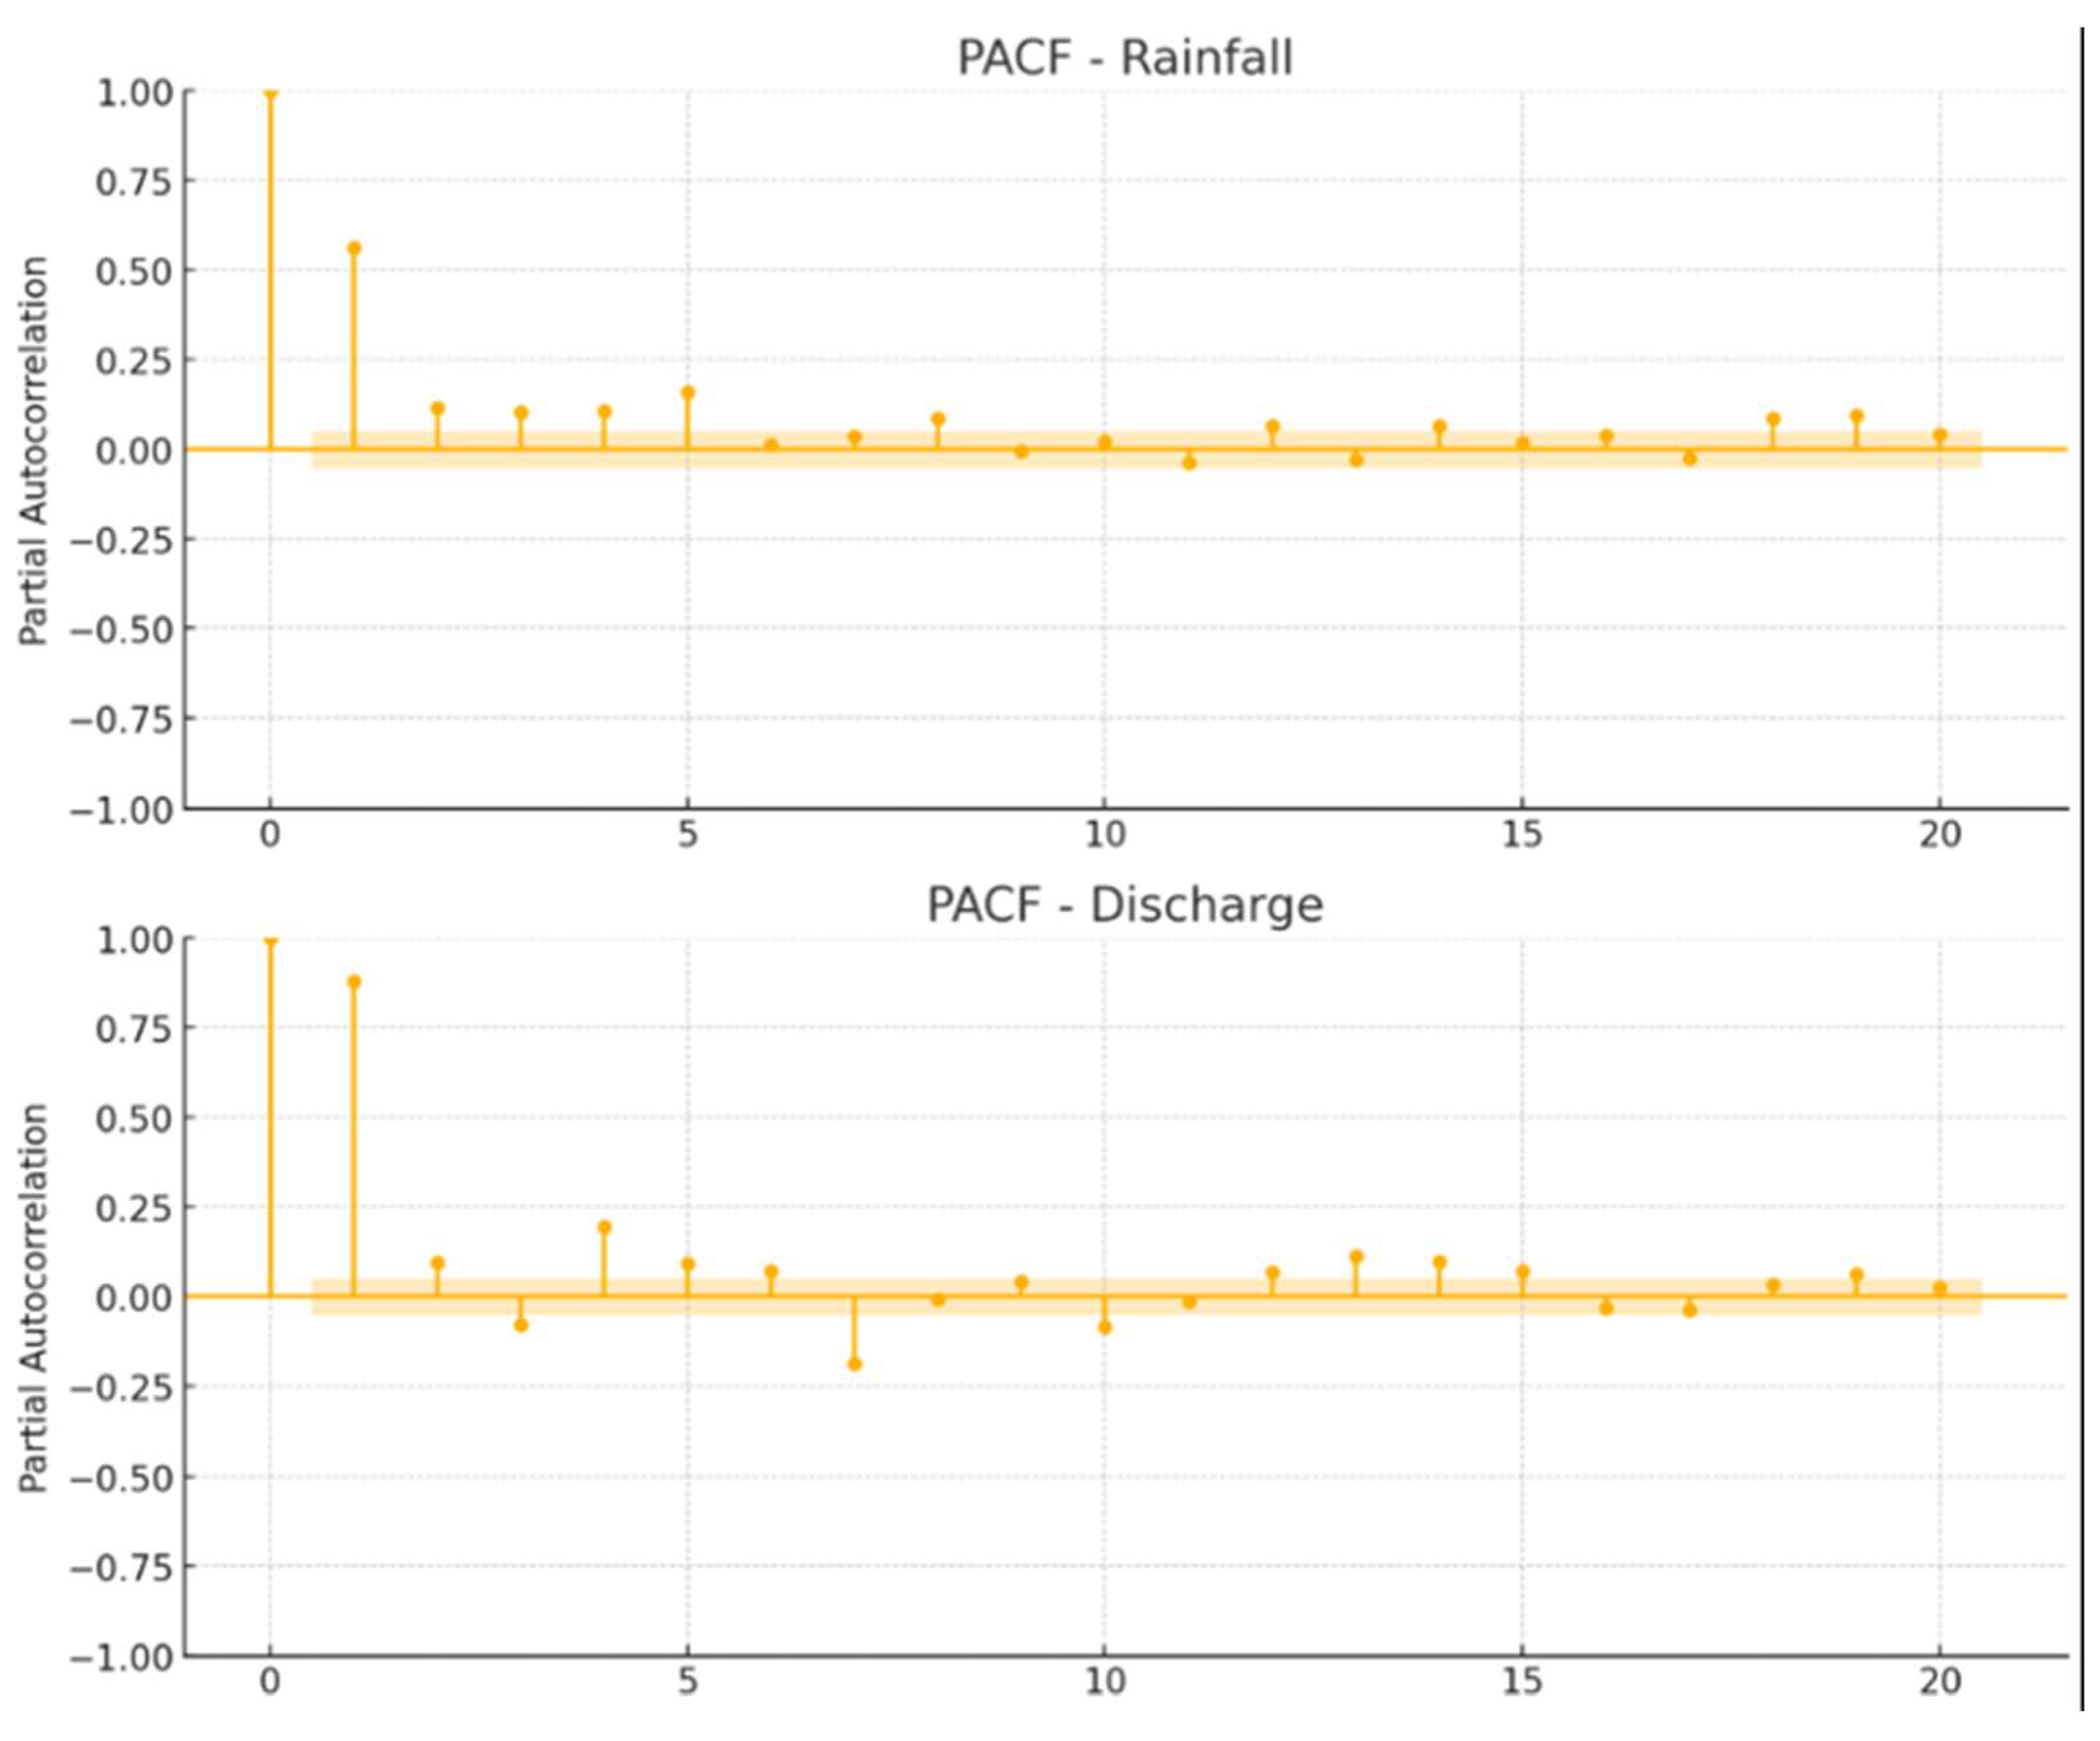
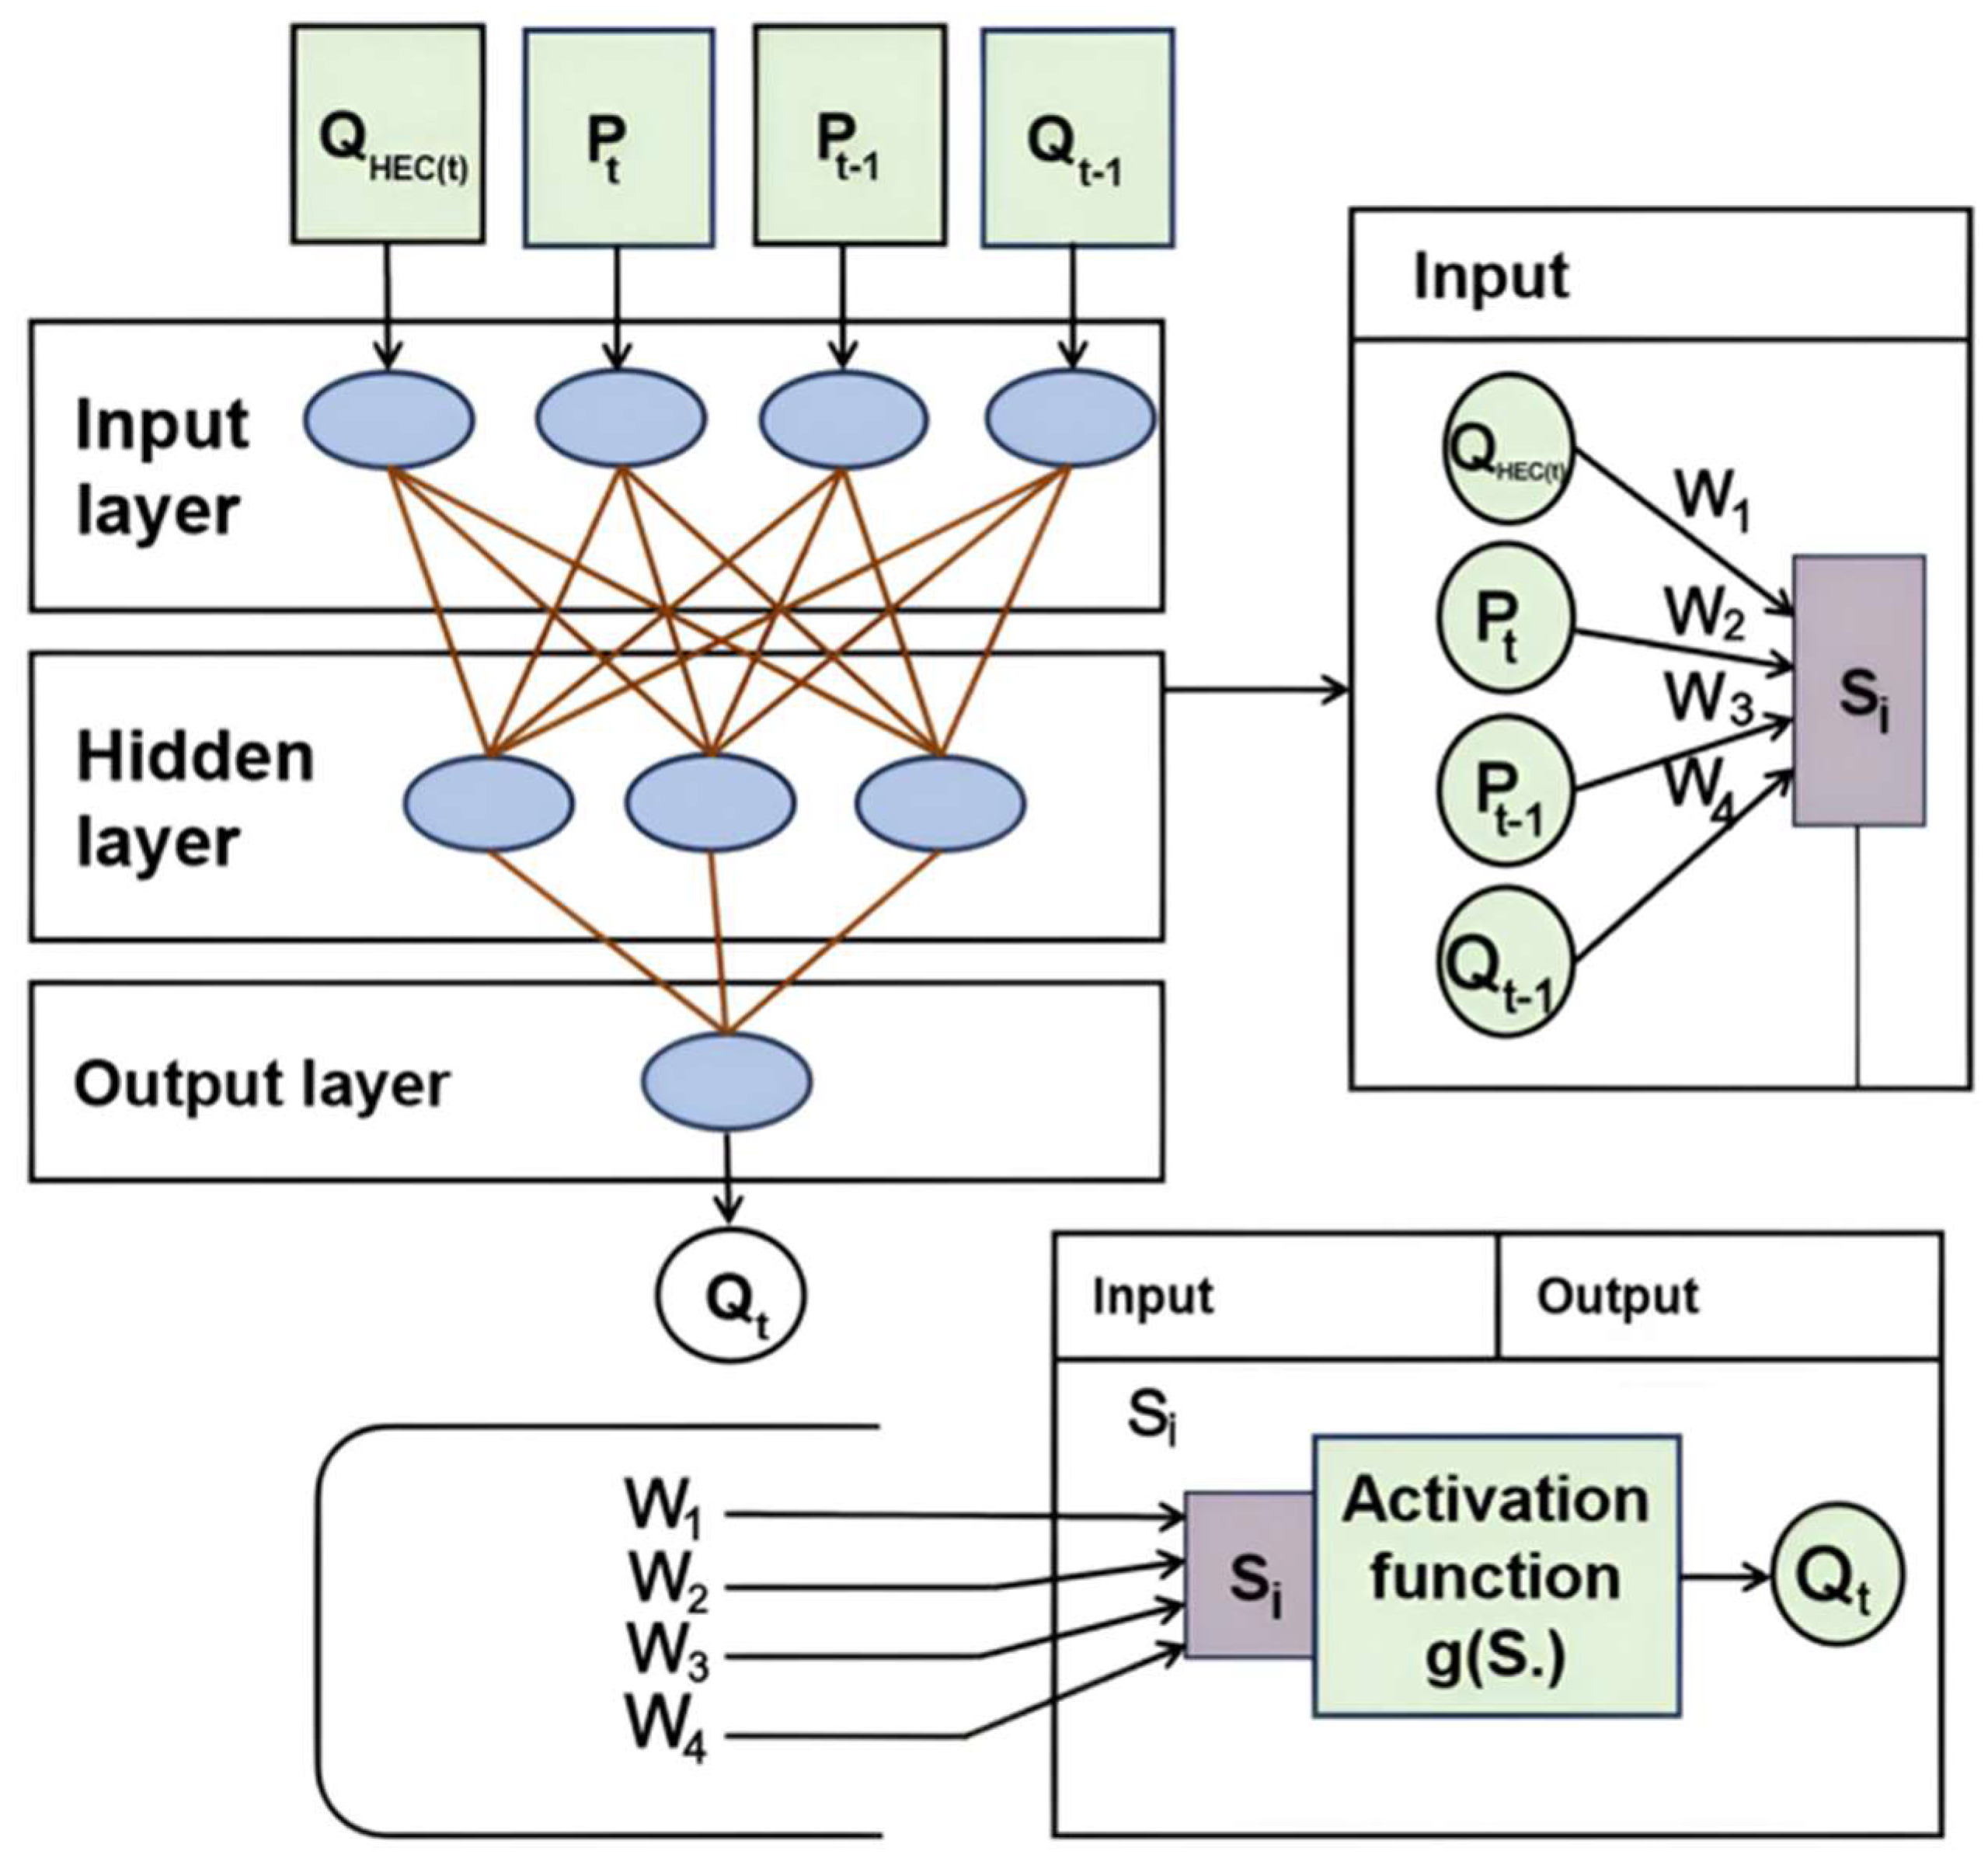
The input features used for the ANN model included HEC-HMS-simulated discharge at time t (QHEC(t)), precipitation at time t (Pt), lagged precipitation (Pt−1), and lagged observed discharge (Qt−1). These lag values were identified using the autocorrelation function, as illustrated in Figure 9. The ANN was trained using a feedforward architecture comprising a single hidden layer with a Sigmoid activation function. The architecture of the hybrid HEC-HMS-ANN model is shown in Figure 10.
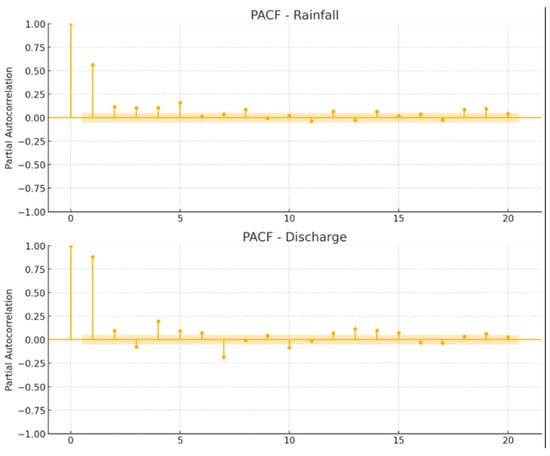
Figure 9.
Partial autocorrelation function (PACF) for rainfall and discharge data.

Figure 10.
Architecture of the HEC-HMS-ANN hybrid model.
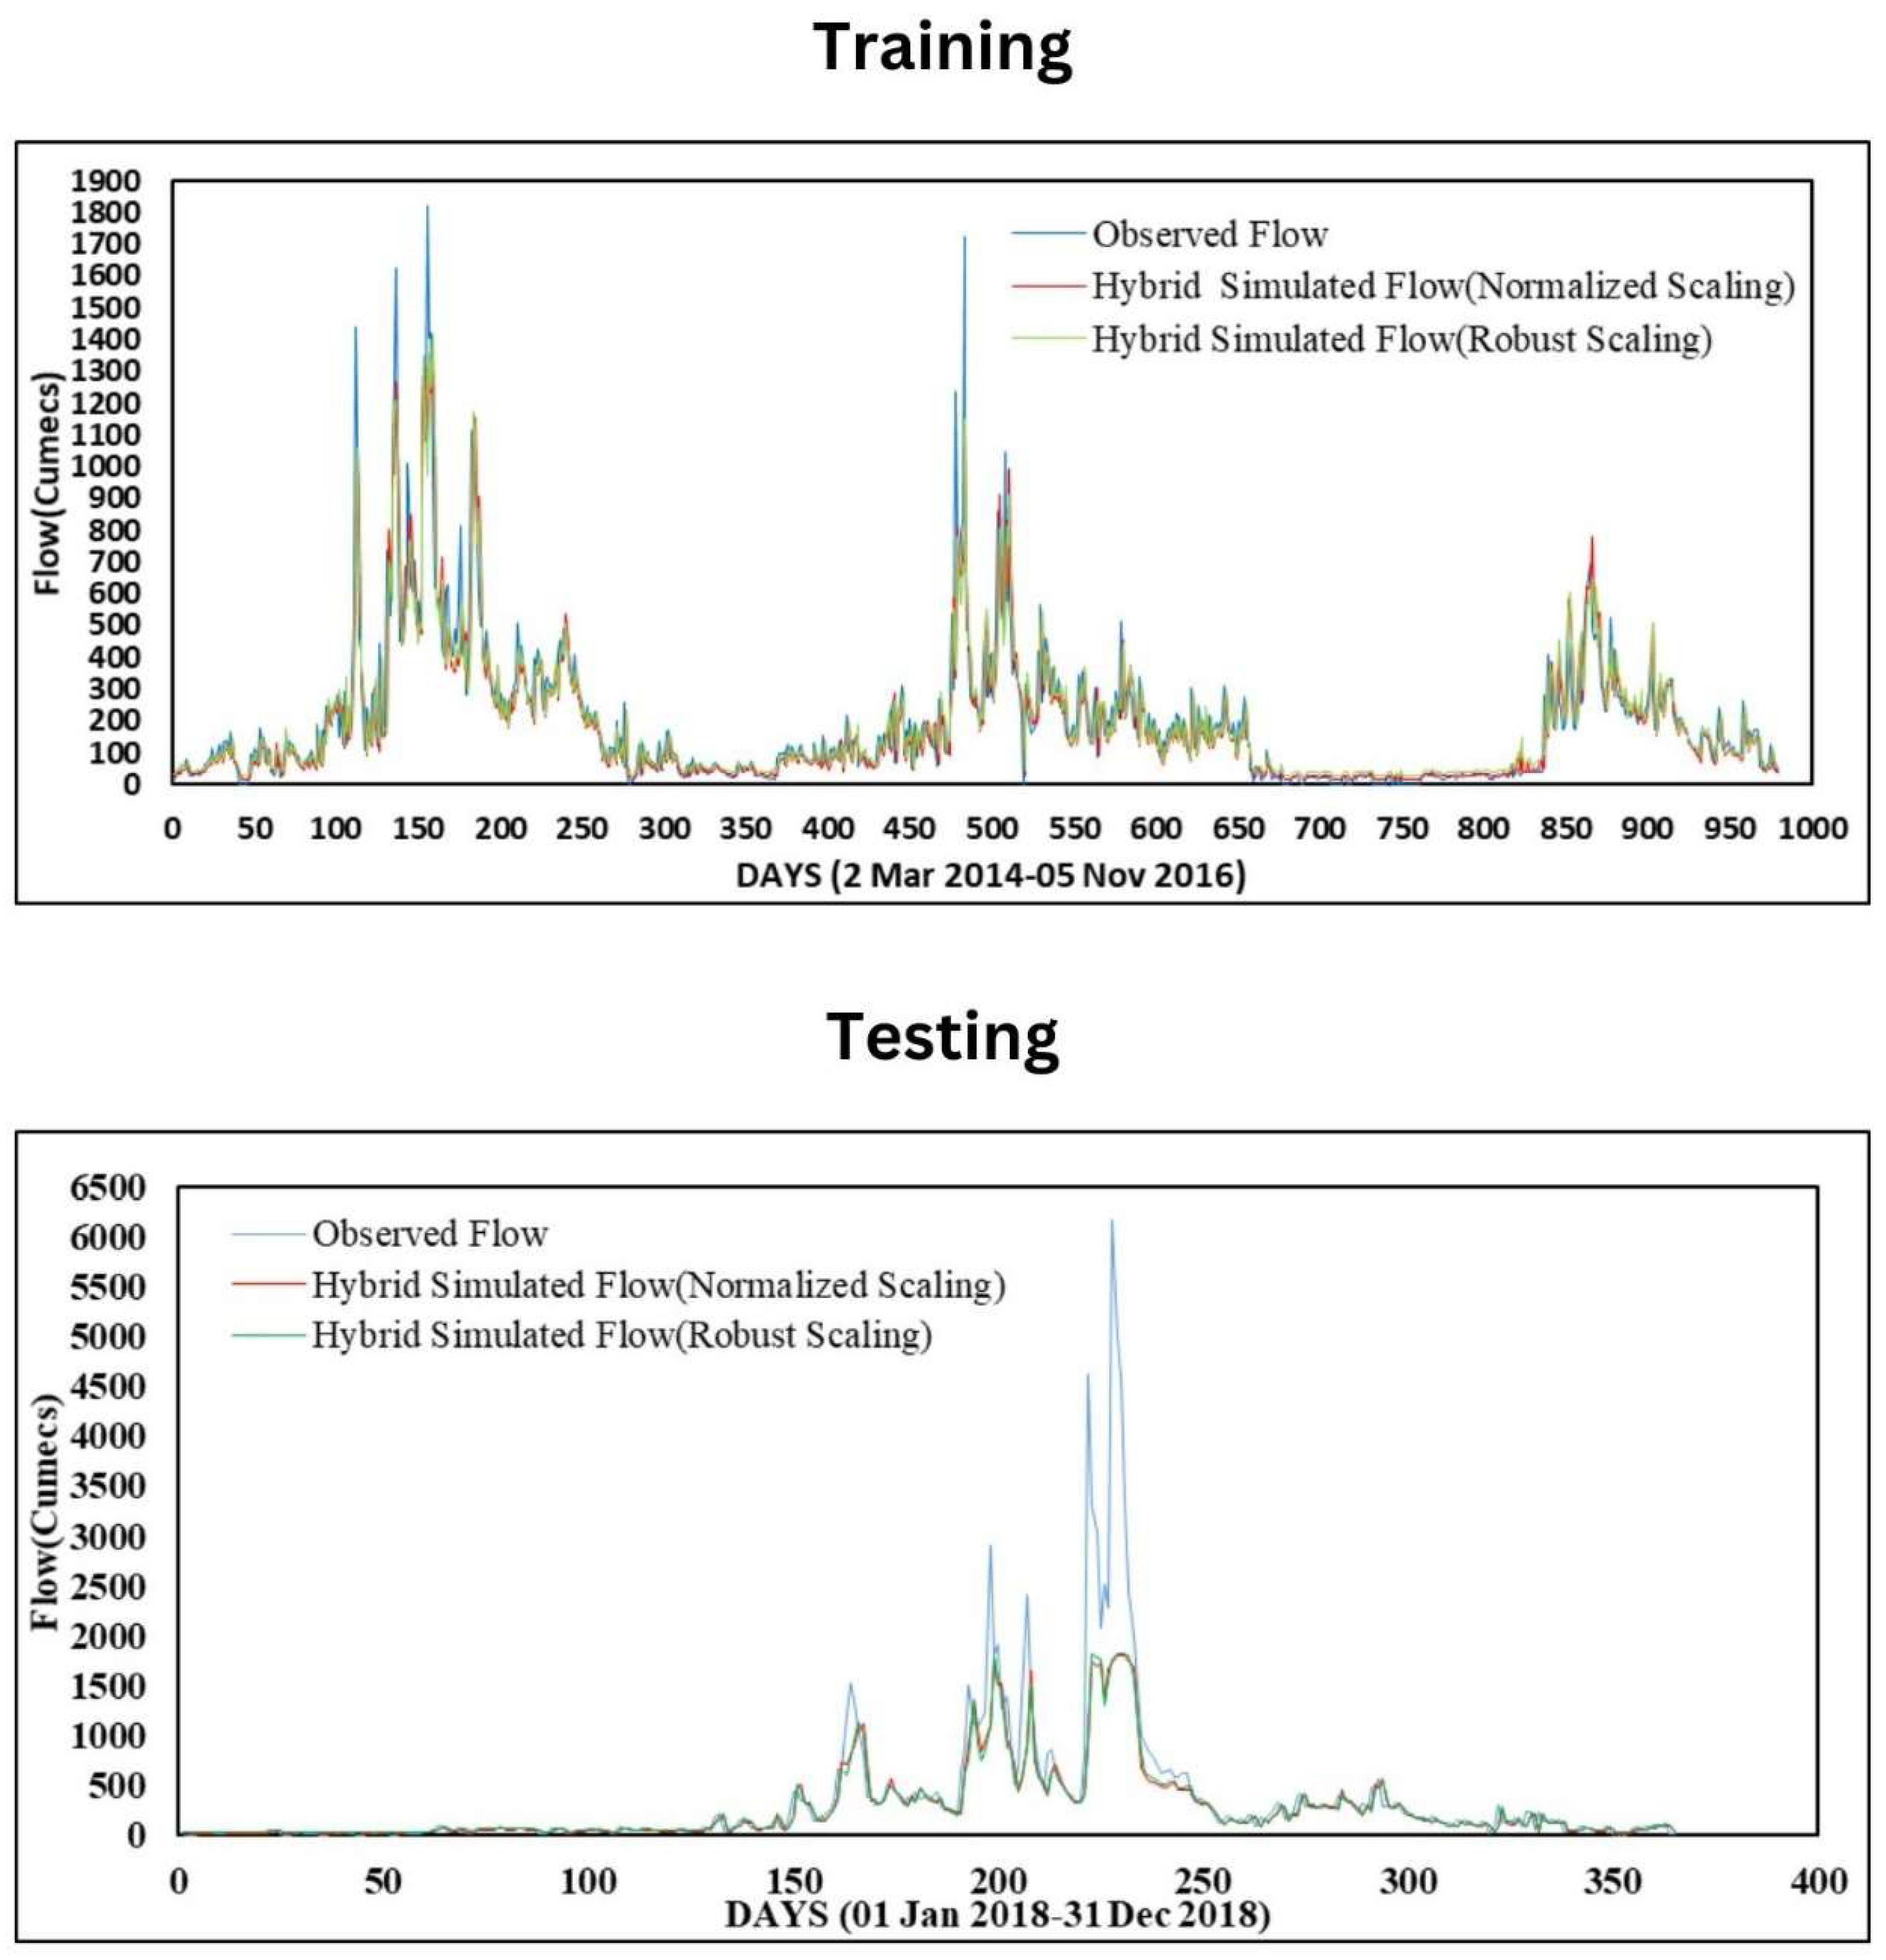
Figure 11 presents a visual comparison of the simulated streamflow from the hybrid model during training and testing against the observed streamflow. The performance of the hybrid model was evaluated using statistical metrics including the correlation coefficient (R), Nash–Sutcliffe Efficiency (NSE), and percent bias (PBIAS), with the results summarized in Table 5. Among the preprocessing techniques, the robust scaling method yielded better model performance compared to normalization.
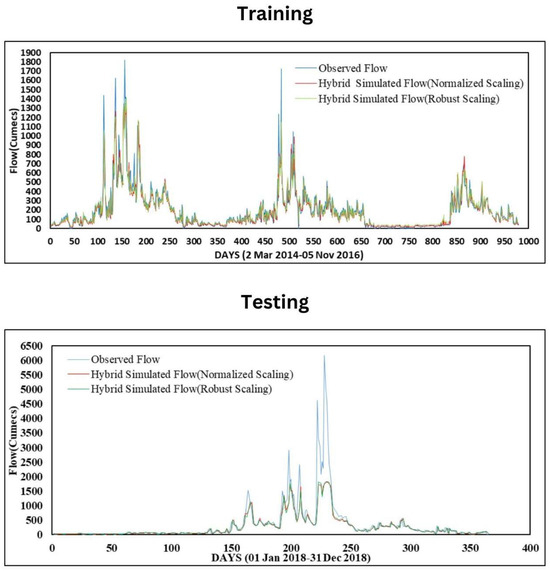
Figure 11.
Comparison of observed and simulated streamflows during training and testing using the hybrid HEC-HMS-ANN model.
Table 5.
Performance indicators of the hybrid ANN-HEC-HMS model during calibration and validation phases.
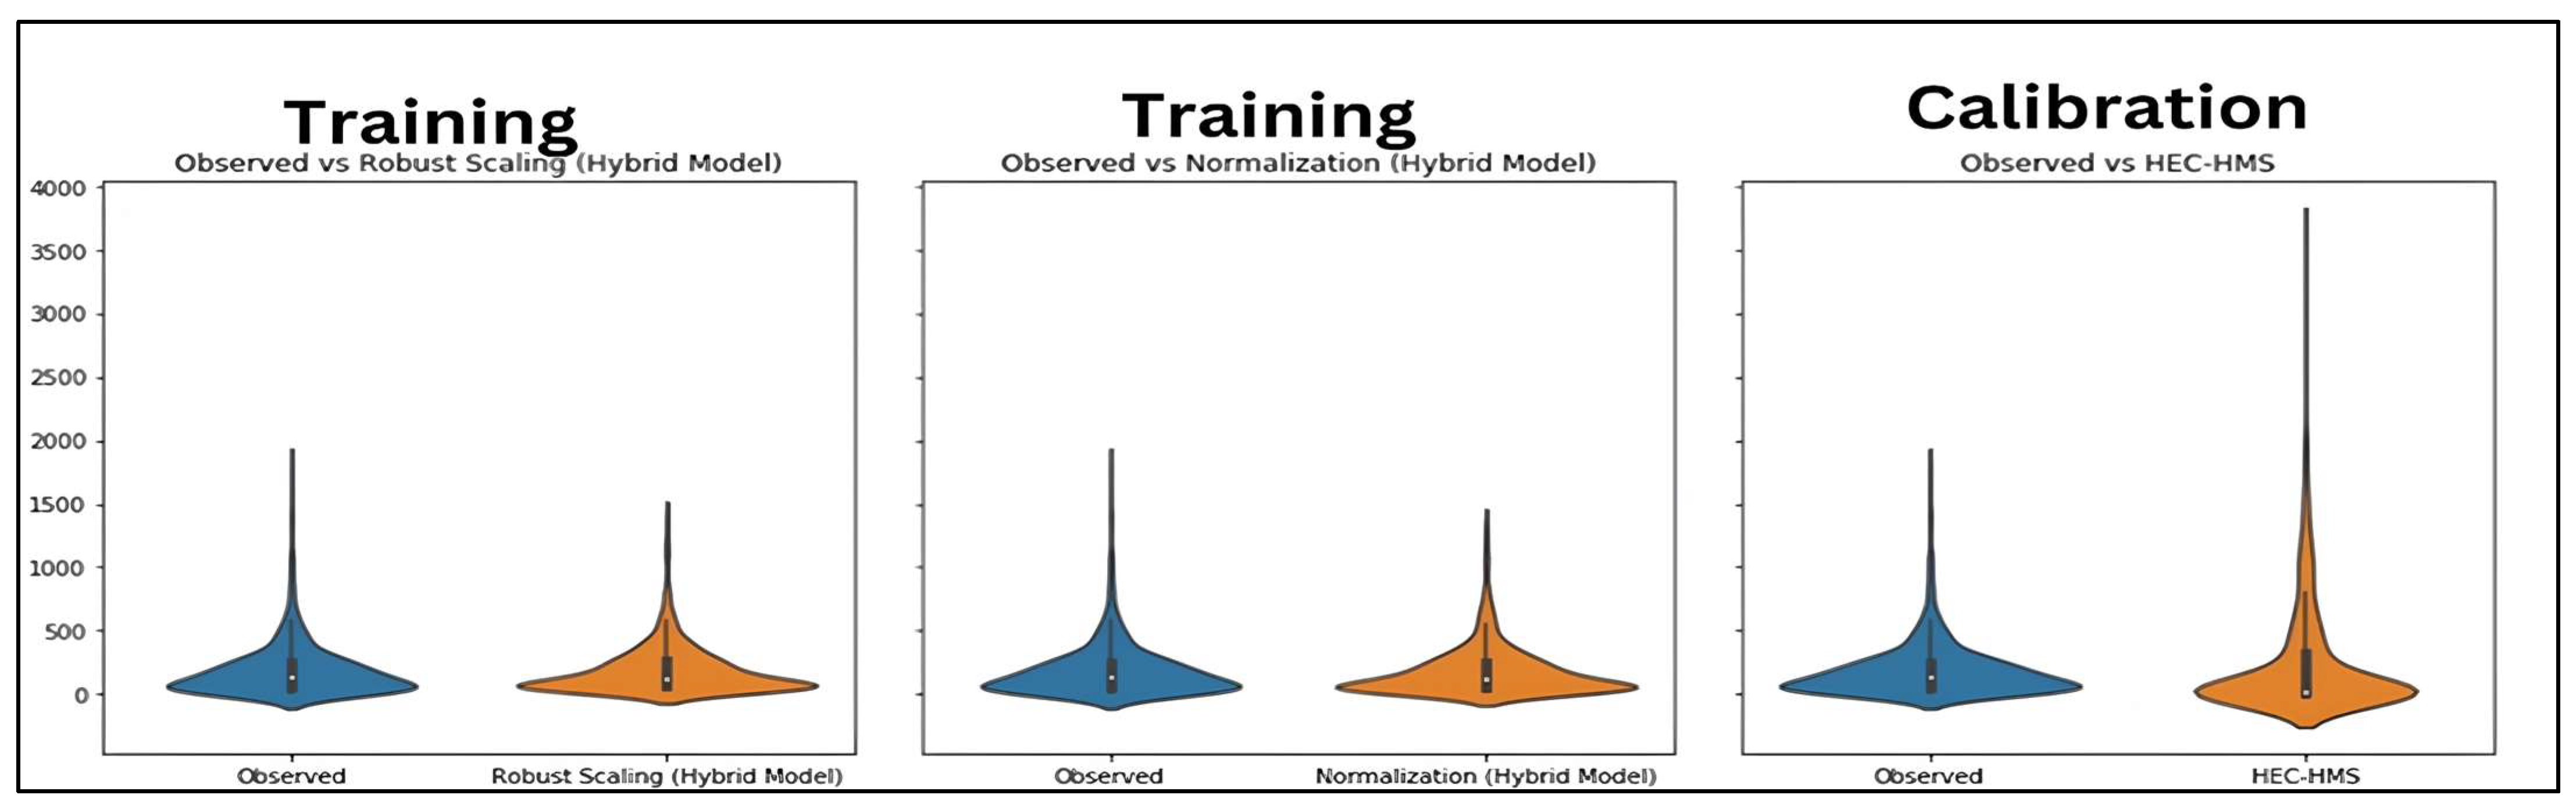
The hybrid model demonstrates superior predictive performance based on key statistical indicators—namely, the correlation coefficient (R), Nash–Sutcliffe Efficiency (NSE), and percent bias (PBIAS). Although PBIAS slightly increases during validation, it remains within acceptable limits, especially when weighed against the significant improvements observed in R and NSE. Among the scaling methods evaluated, robust scaling performed marginally better during validation. This indicates that the hybrid model is not highly sensitive to the choice of scaling method (Figure 12), possibly due to the characteristics of the data and the architecture of the ANN.
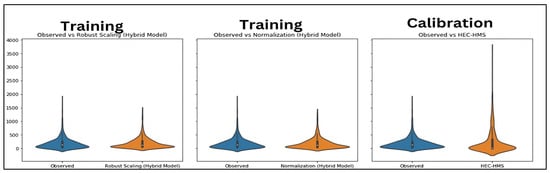
Figure 12.
Violin plot comparing hybrid model performance during training with HEC-HMS model performance during calibration.
Overall, the performance metrics clearly show that the HEC-HMS-ANN hybrid model provides enhanced accuracy compared to the standalone HEC-HMS model. However, both models tend to underestimate peak discharge values. One potential solution to improve peak flow prediction is to incorporate reservoir outflow as an additional input in the hydrological modeling framework—a factor that was not included in the current study.
Future modeling efforts could also explore the integration of deep learning approaches within hybrid frameworks to further improve simulation accuracy. This limitation underscores the importance of continued refinement in model structure and input selection to better capture extreme flow conditions.
3.4. Flood Inundation Modeling and Mapping
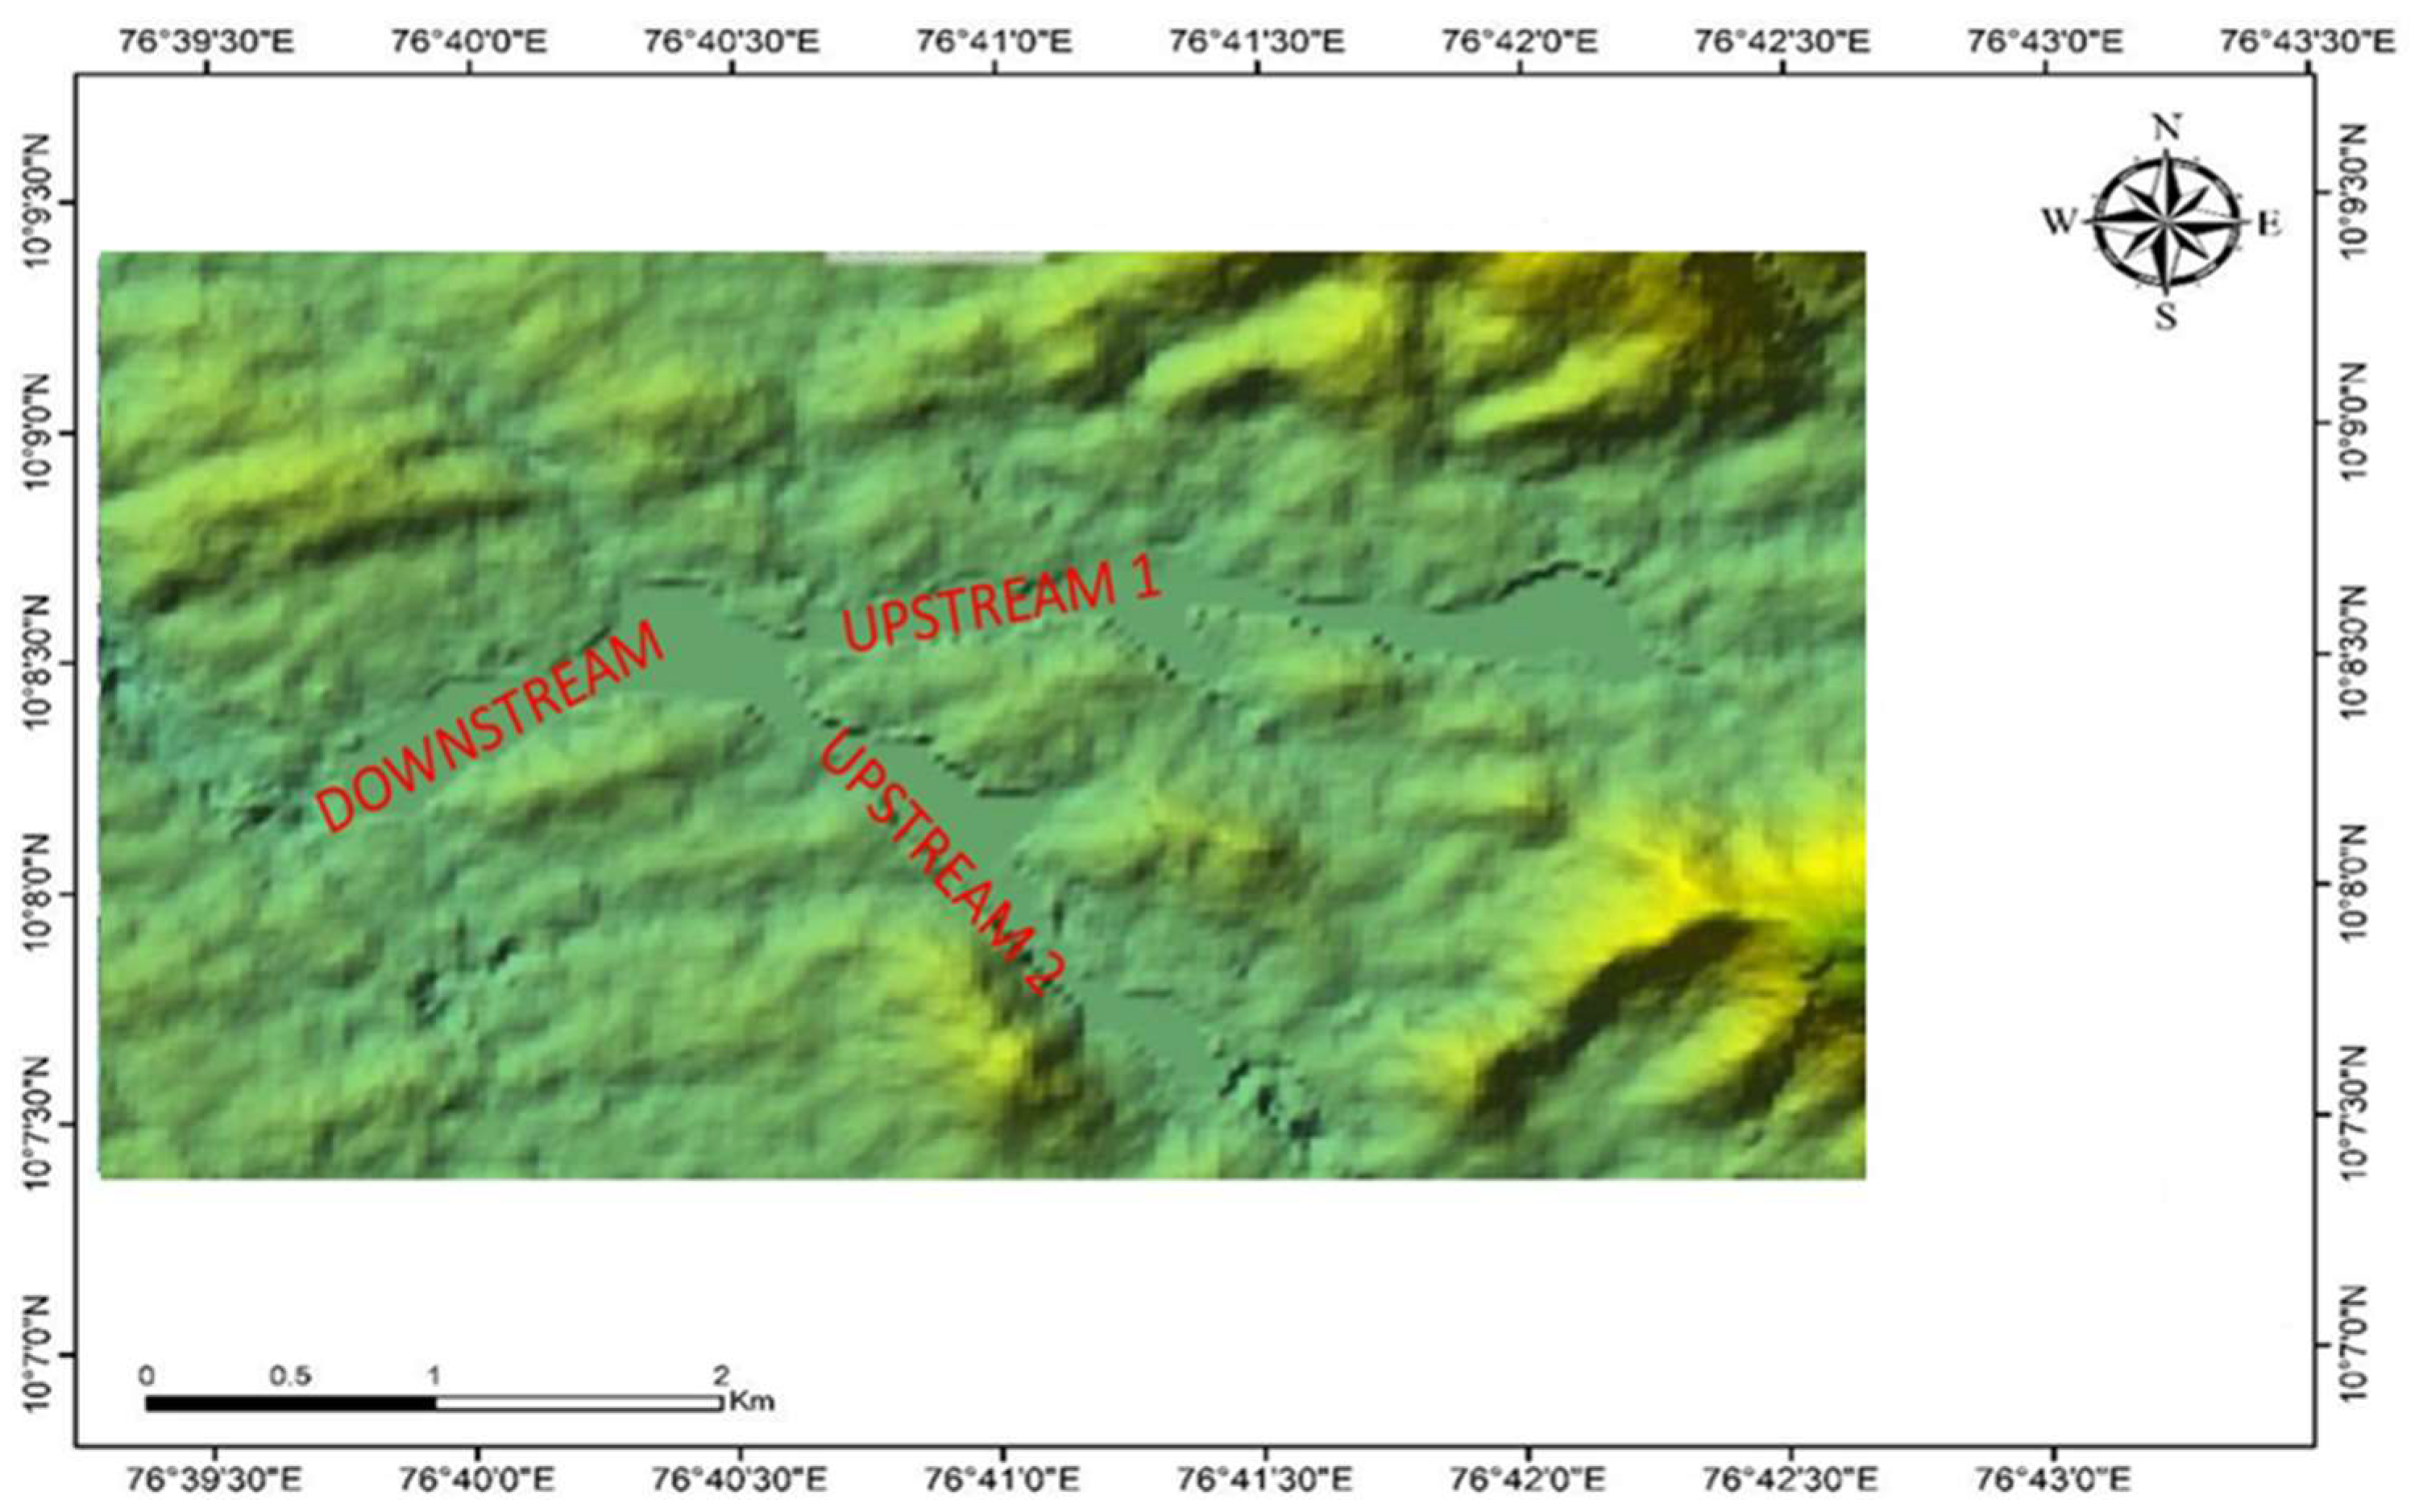
The flood inundation map was generated using HEC-RAS 6.4.1 software, with the SRTM DEM serving as the input topographic data. Boundary conditions were defined as shown in Figure 13. Specifically, Upstream 1 and Upstream 2 were assigned flow hydrograph inputs, while the downstream boundary condition was set as a normal depth. Details of the boundary conditions are provided in Table 6.
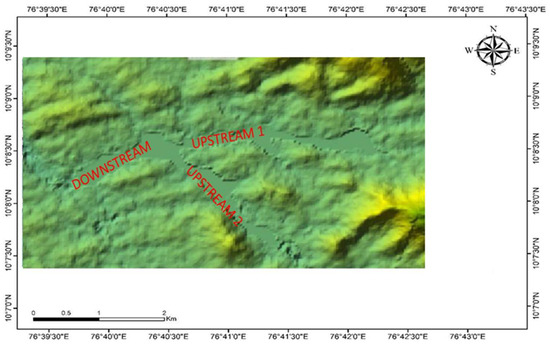
Figure 13.
Stretches of the study area along the Periyar River Basin.
Table 6.
Boundary conditions used for the HEC-RAS simulation.
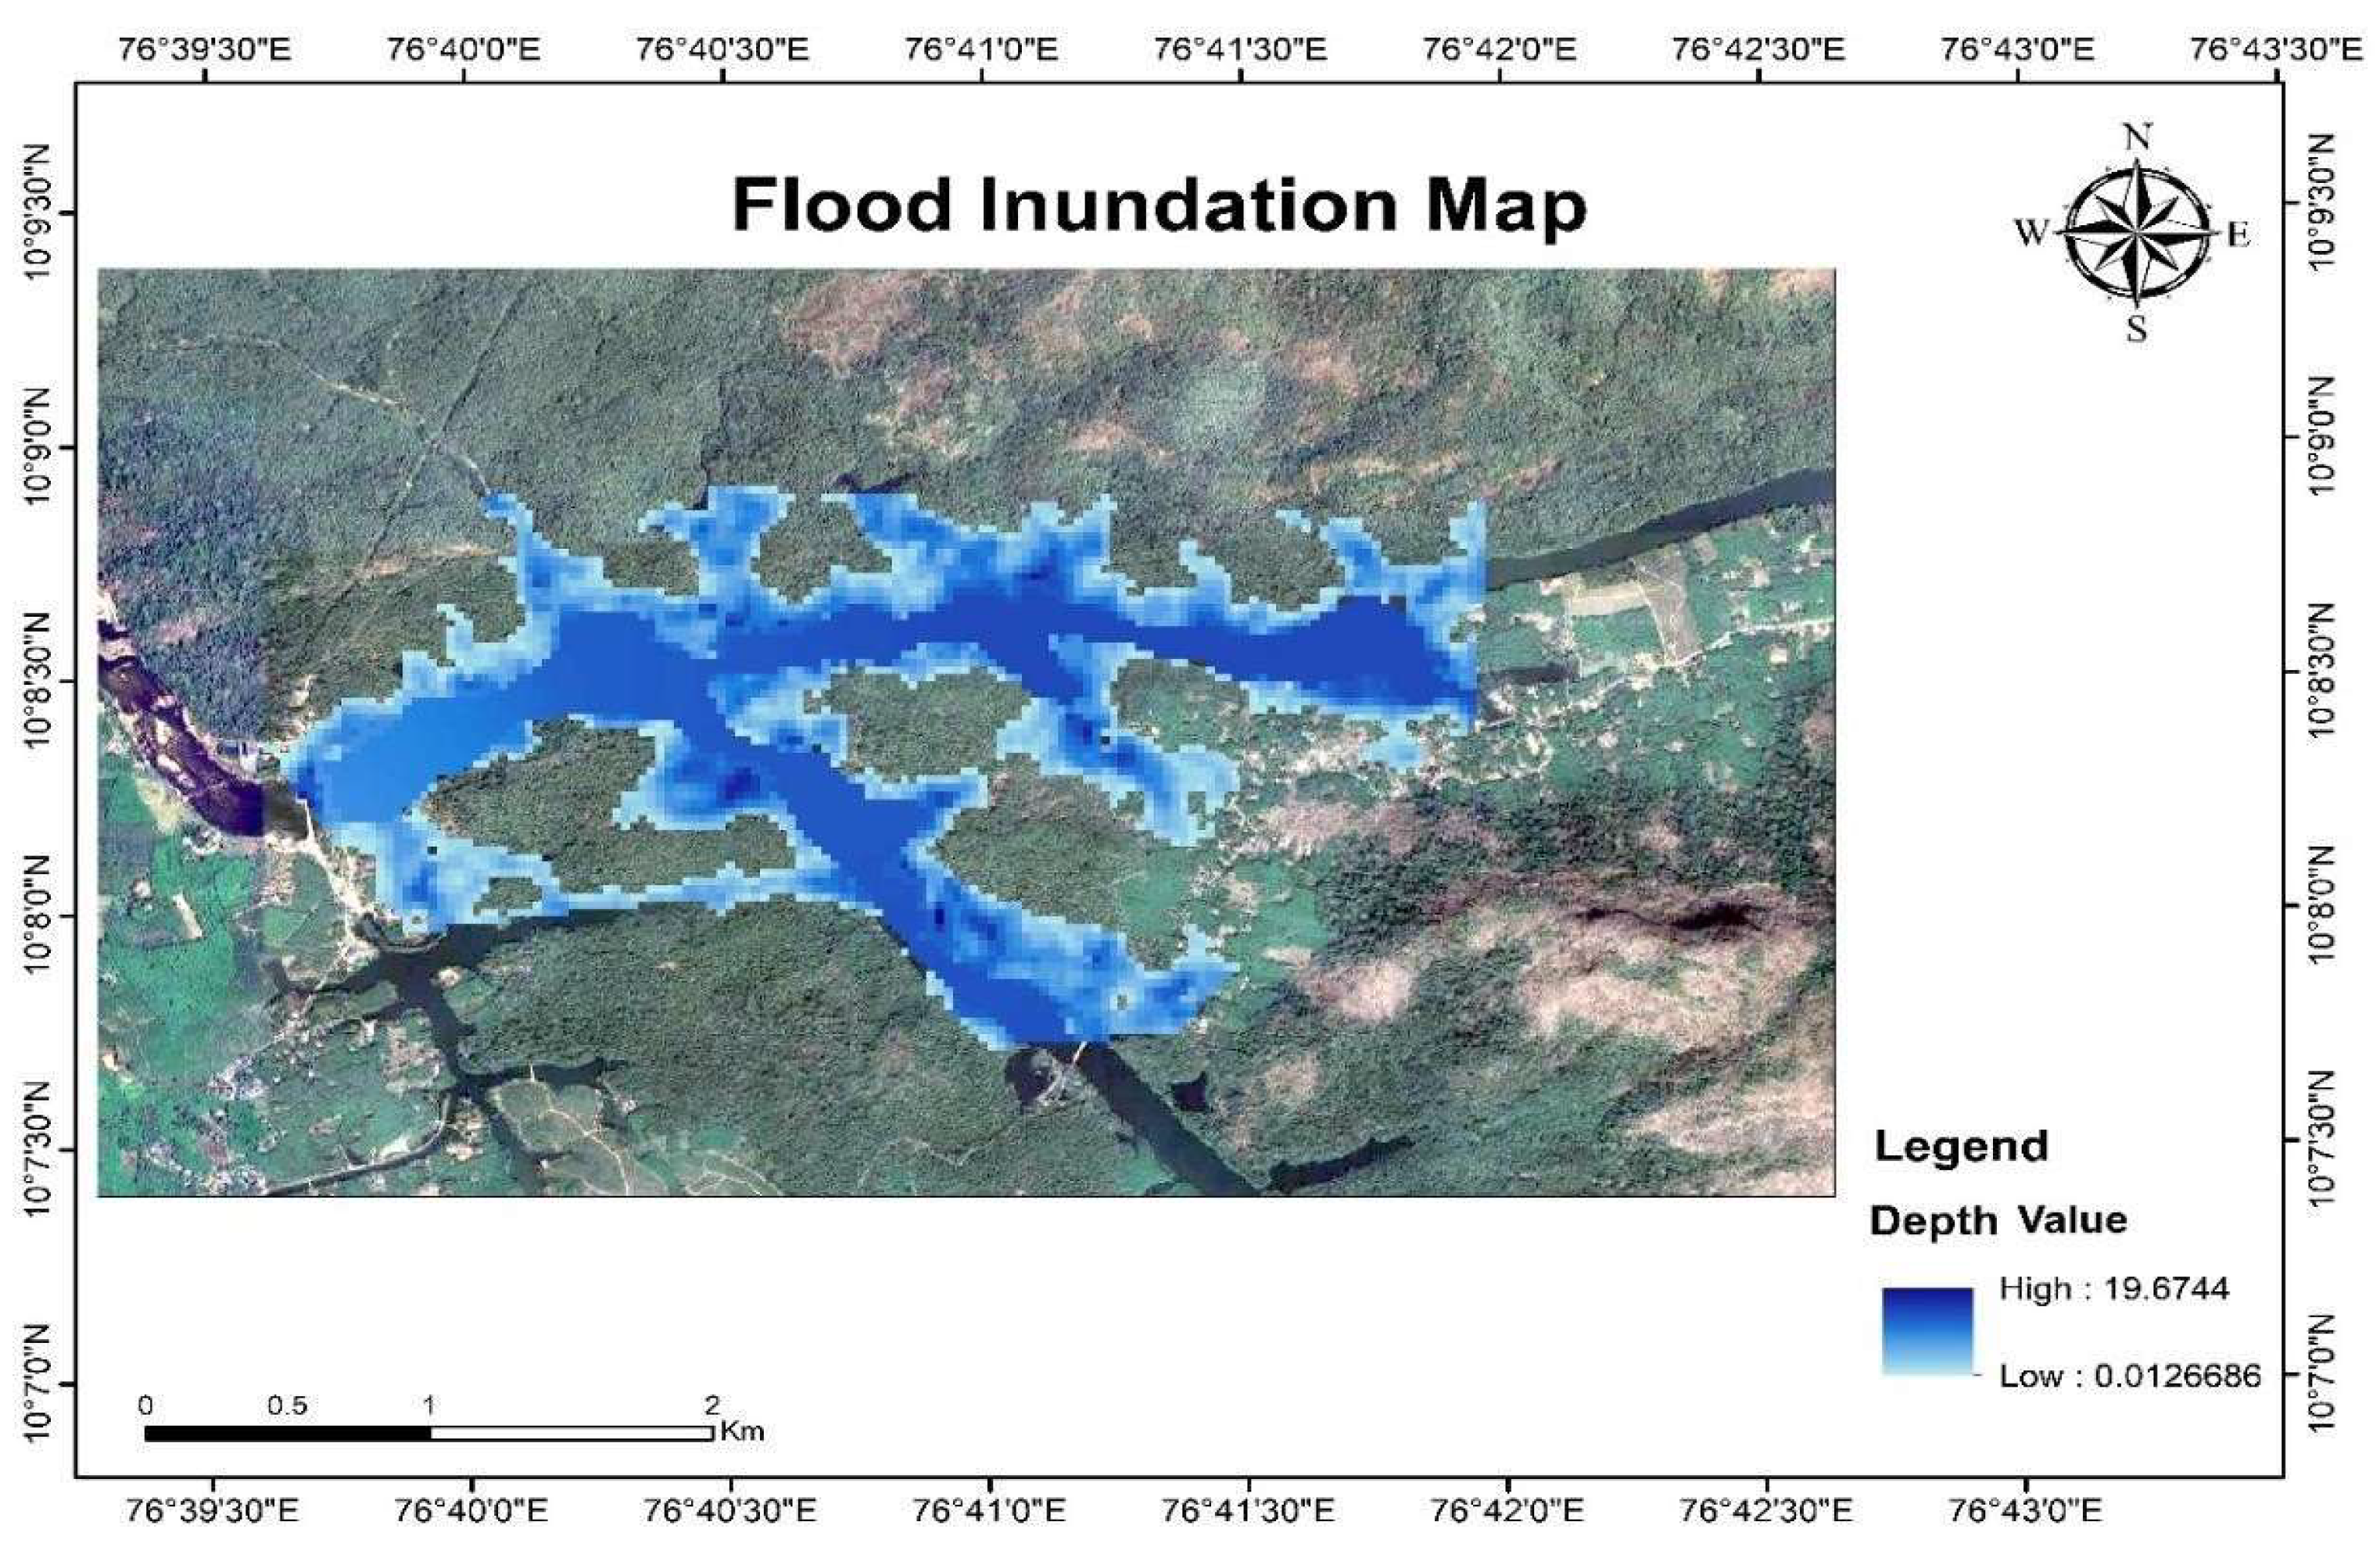
The flood inundation map for the year 2018 is presented in Figure 14. For the maximum precipitation event recorded on 16 August 2018, with a rainfall intensity of 241.65 mm, the corresponding maximum flood depths observed were 12.22 m at Upstream 1, 13.5 m at Upstream 2, and 8.7 m at the downstream location.
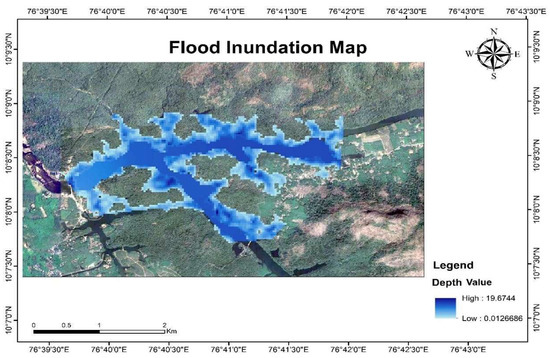
Figure 14.
Flood inundation map for the 2018 Kerala flood event based on the HEC-RAS simulation.
3.5. Future Flood Map Under Climate Change Scenarios
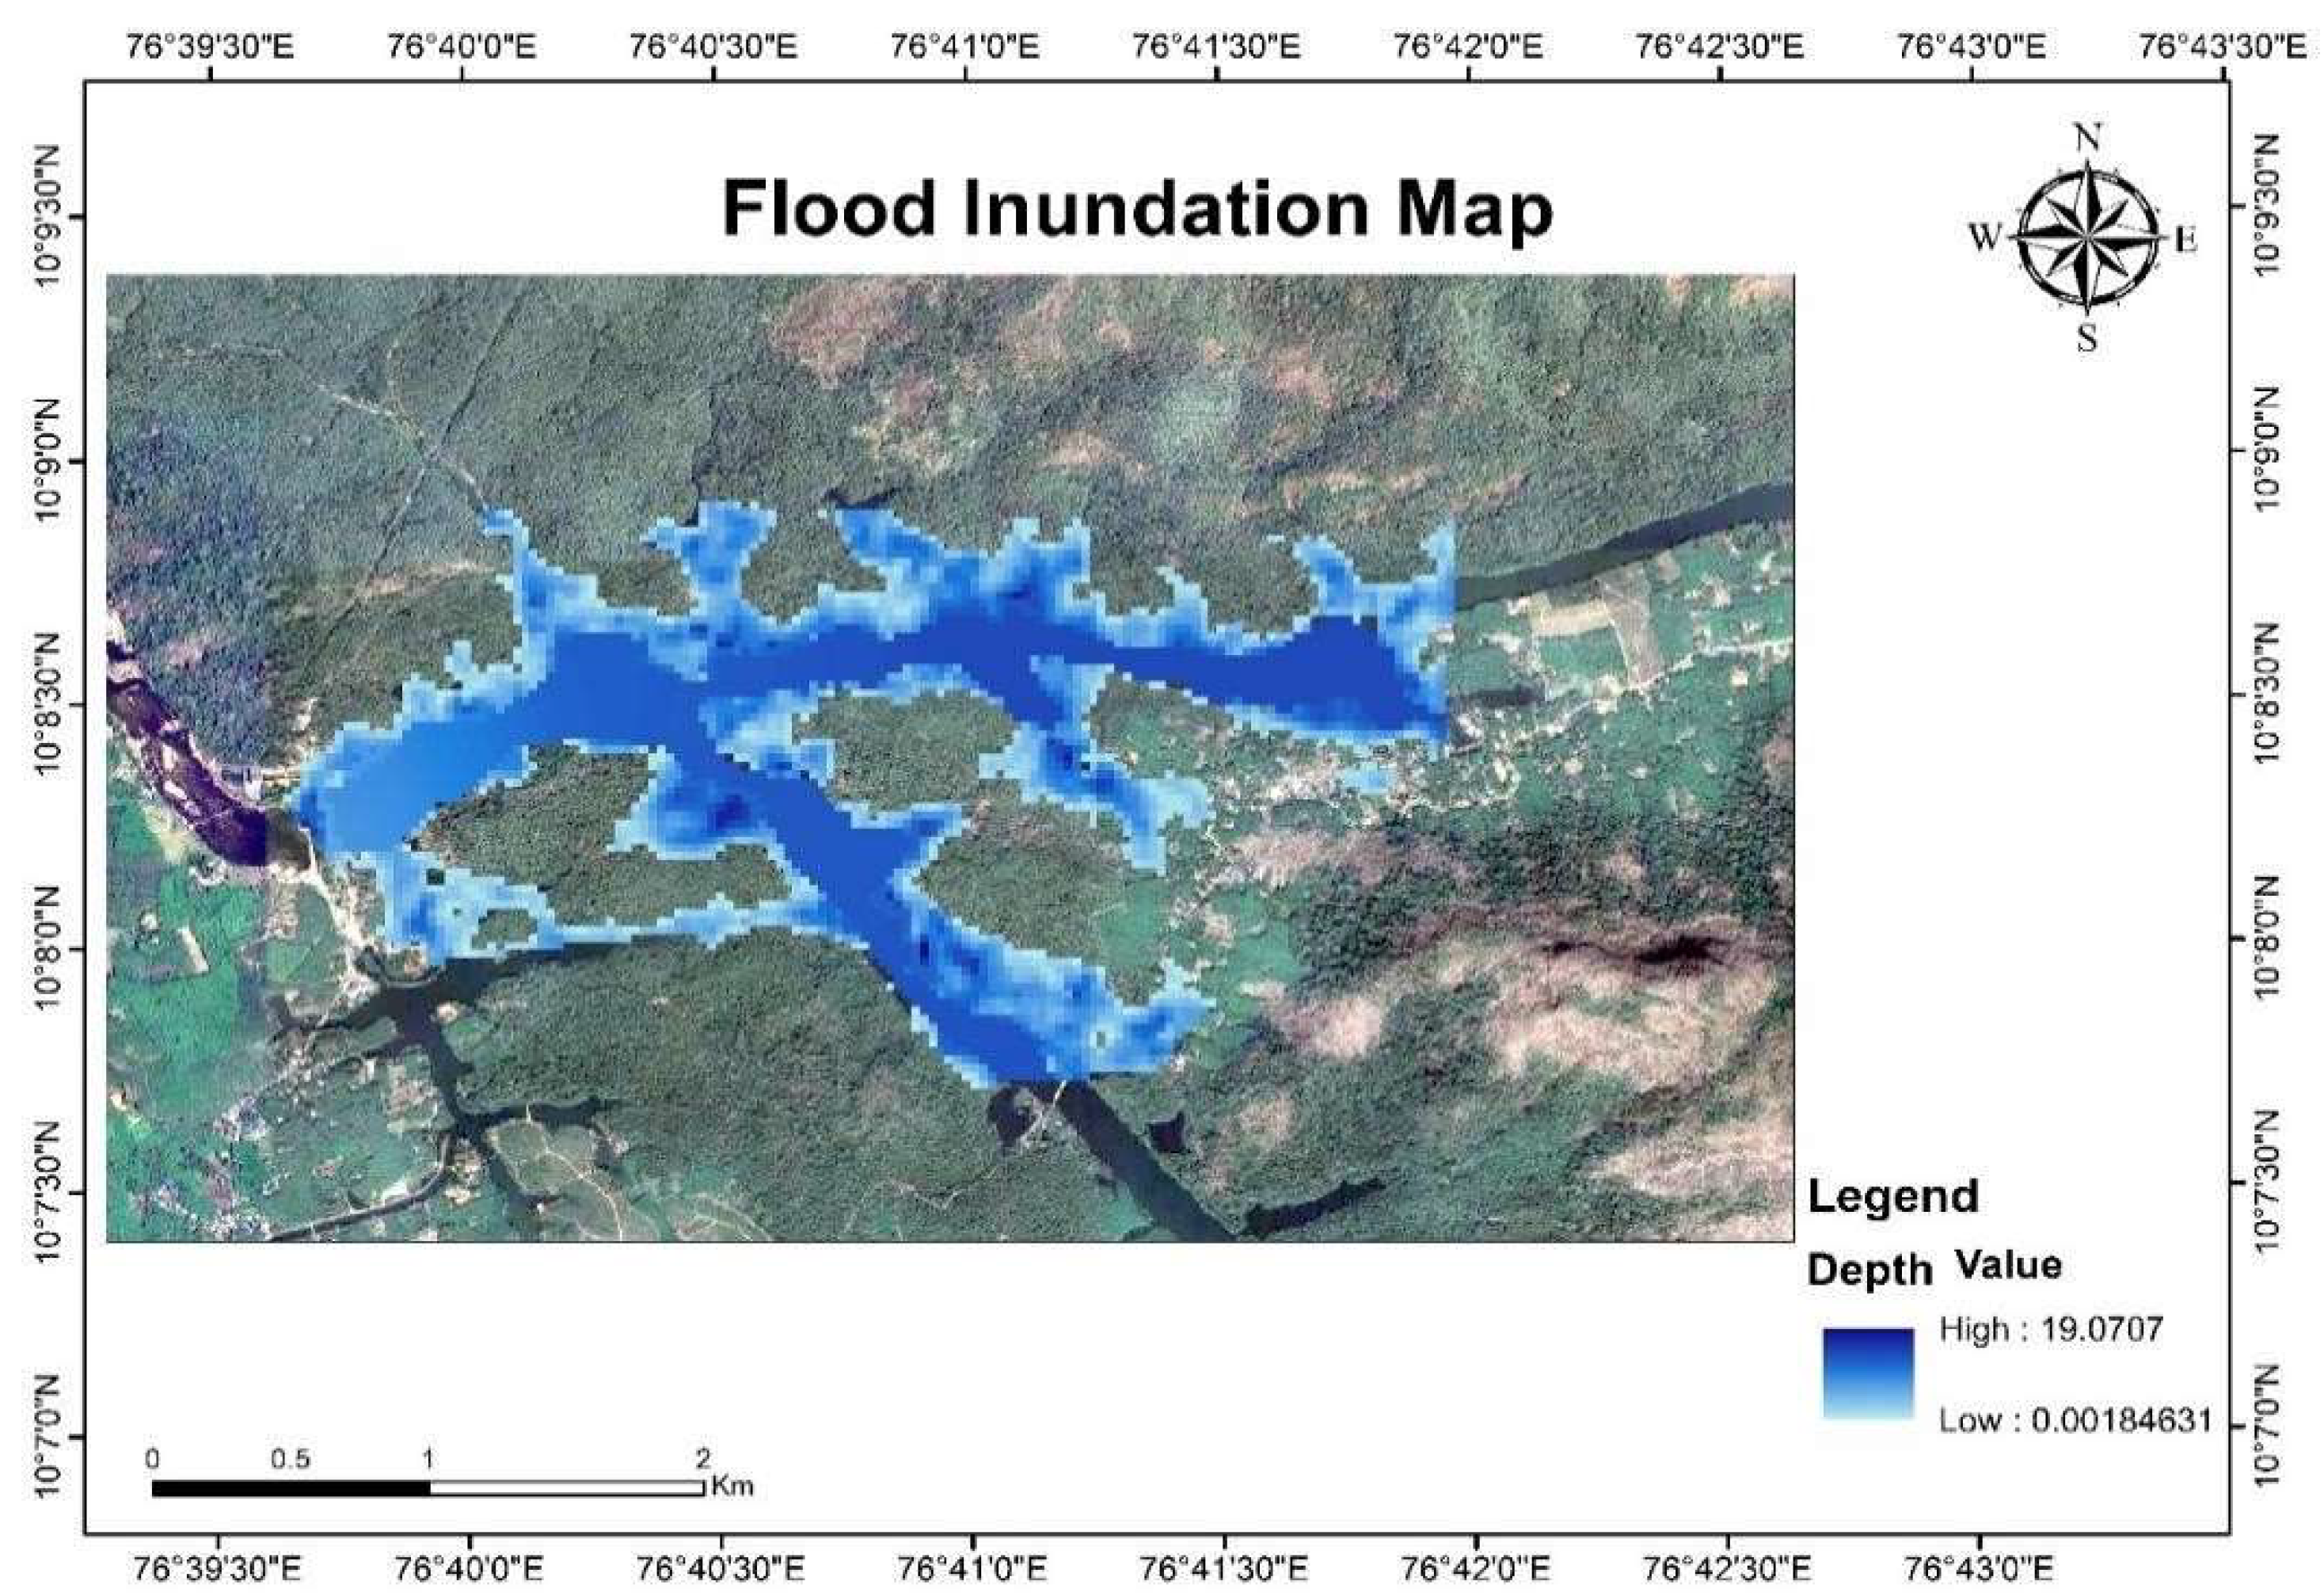
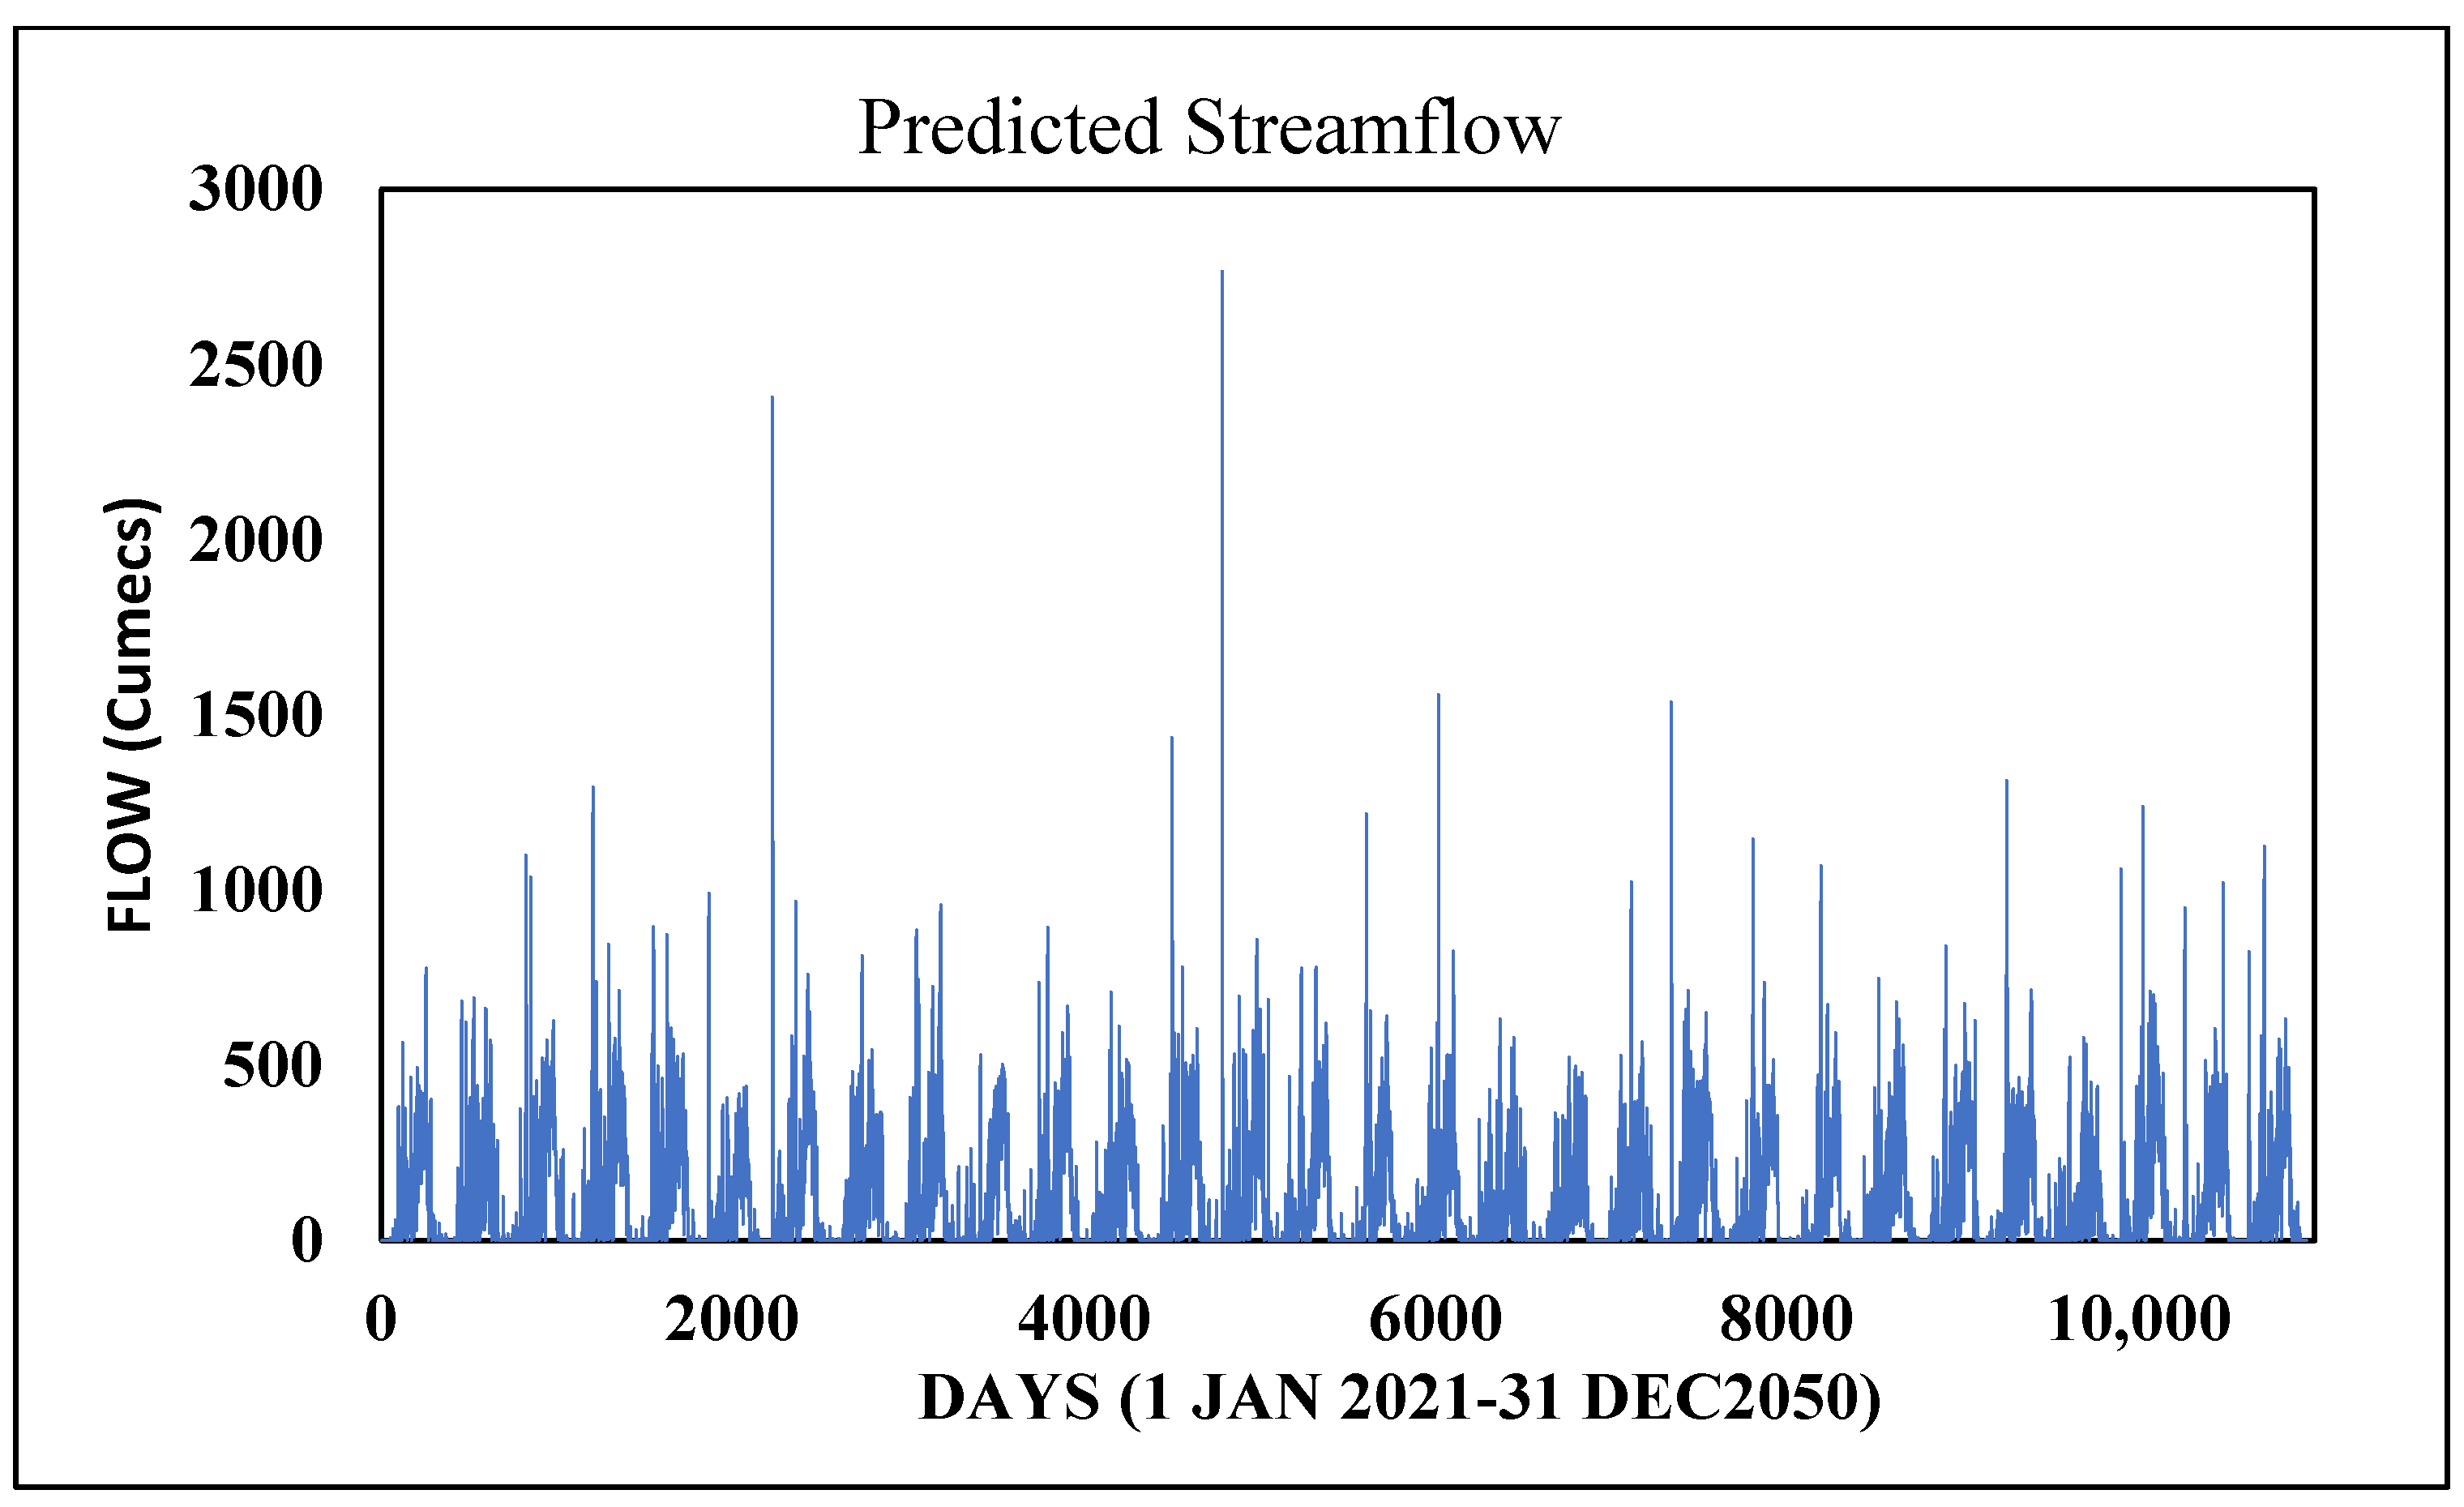
Future rainfall data for the period from 2021 to 2050 were obtained from the EC-Earth3 Global Climate Model (GCM). These projected rainfall data, under the SSP2–4.5 scenario, were used as input to the HEC-HMS model to simulate future discharge. Using the Gumbel distribution method, a flood frequency analysis was conducted to estimate discharge values corresponding to a 100-year return period. Based on the HEC-RAS simulation results, the maximum flood depths under the SSP2–4.5 scenario were found to be 12.79 m at Upstream 1, 11.91 m at Upstream 2, and 8.48 m at the downstream location (Figure 15 and Figure 16).
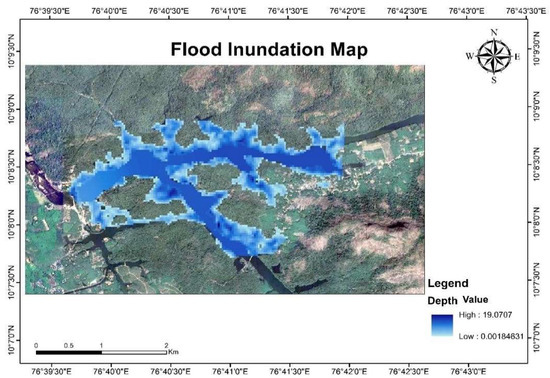
Figure 15.
Flood inundation map under the SSP2–4.5 scenario based on the HEC-RAS simulation.

Figure 16.
Simulated streamflow under the SSP2–4.5 scenario (2021–2050) using HEC-HMS with the EC-Earth3 precipitation input.
In comparison, the 2018 flood inundation map (Figure 14) shows a maximum depth of 19.67 m. Under the future SSP2–4.5 scenario, the maximum depth is slightly lower, at 19.07 m. The spatial extent of inundation is nearly identical in both cases. The 2018 Kerala flood, however, was an extreme hydrometeorological event triggered by highly intense and prolonged rainfall, compounded by reservoir releases and already saturated catchment conditions.
While a 100-year return period flood under the SSP2–4.5 scenario represents a statistically rare and severe event based on long-term climate projections, it may not fully capture the influence of localized extremes, short-term variability, or compounding factors such as overland flow, soil saturation, and urban runoff. These elements—along with teleconnections—likely contributed to the severity of the 2018 flood, emphasizing the importance of considering both statistical trends and real-world complexities in future flood risk assessments.
4. Conclusions
In this study, the floodplains of the Aluva region within the Periyar River Basin were mapped using an integrated hydrological and hydraulic modeling approach for both historical and future periods. The basin includes numerous storage and diversion schemes that can significantly influence the hydrological response, and consequently, peak flow. However, these details were not incorporated into the HEC-HMS model due to limitations in the availability of storage and release data. A key finding is that one should not rely solely on physically based models in data-scarce and complex basins. This limitation served as the primary motivation for developing the hybrid model.
A hybrid HEC-HMS-ANN model was implemented to improve predictive accuracy and capture nonlinear hydrological responses. The results demonstrate that the hybrid model outperformed the standalone HEC-HMS model, particularly in simulating complex hydrological interactions. However, both models showed limitations in accurately predicting peak flow values. One potential improvement is the inclusion of reservoir outflow as an additional input to the hydrological models—an element not considered in the present study. Future work could also explore advanced hybrid frameworks incorporating deep learning techniques.
To further analyze extreme flood events, flood frequency analysis was performed to estimate peak discharges for a 100-year return period. These peak flows were used as boundary conditions in the HEC-RAS model to simulate hydraulic behavior and delineate floodplain extents. Future studies may extend this analysis to include inundation extents for additional return periods.
The findings of this study offer valuable insights for water resource managers, policymakers, and urban planners in strengthening flood risk assessment and developing effective flood mitigation and adaptation strategies. By integrating climate change projections, this approach supports sustainable water management and informs resilient infrastructure planning in vulnerable regions.
Author Contributions
S.R.: Conceptualization, methodology, formal analysis, investigation, data collection, validation, visualization, and writing—original draft. B.S.N.R.: Conceptualization, methodology, formal analysis, investigation, data curation, validation, visualization, and writing—review and editing. S.S., S., and V.L.: Conceptualization, methodology, formal analysis, investigation, data curation, validation, and visualization. S.K.P.: Conceptualization, methodology, validation, supervision, and writing—review and editing. V.S.: validation and writing—review and editing. All authors have read and agreed to the published version of the manuscript.
Funding
This research received no external funding
Data Availability Statement
The data that support the findings of this study are available from the corresponding author upon request.
Acknowledgments
The corresponding author’s (V. Sridhar) effort was funded in part as a Fulbright-Nehru senior scholar by the United States India Educational Foundation.
Conflicts of Interest
The authors declare no conflicts of interest.
References
- Khan, I.; Lei, H.; Shah, A.A.; Khan, I.; Muhammad, I. Climate change impact assessment, flood management, and mitigation strategies in Pakistan for sustainable future. Environ. Sci. Pollut. Res. 2021, 28, 29720–29731. [Google Scholar] [CrossRef] [PubMed]
- Ashhar, M.; Keesara, V.R.; Sridhar, V. Flood inundation mapping of a river Stretch using machine learning algorithms in the Google Earth Engine environment. J. Flood Risk Manag. 2025, 18, e70062. [Google Scholar] [CrossRef]
- Aznar-Crespo, P.; Aledo, A.; Melgarejo-Moreno, J.; Vallejos-Romero, A. Adapting social impact assessment to flood risk management. Sustainability 2021, 13, 3410. [Google Scholar] [CrossRef]
- Sridhar, V.; Modi, P.; Billah, M.M.; Valayamkunnath, P.; Goodall, J. Precipitation Extremes and Flood Frequency in a Changing Climate in Southeastern Virginia. J. Am. Water Resour. Assoc. 2019, 55, 780–799. [Google Scholar] [CrossRef]
- Venkata Rao, G.; Keesara, V.R.; Sridhar, V.; Srinivasan, R.; Umamahesh, N.V.; Pratap, D. Spatio-Temporal Analysis of Rainfall Extremes in the Flood-prone Nagavali and Vamsadhara Basins in Eastern India. Weather Clim. Extrem. 2020, 29, 100265. [Google Scholar] [CrossRef]
- Kotrike, T.; Keesara, V.R.; Sridhar, V. Analysis of the Causes of Extreme Precipitation in Major Cities of Peninsular India Using Remotely Sensed Data. Remote Sens. Appl. Soc. Environ. 2024, 33, 101082. [Google Scholar] [CrossRef]
- Li, S.; Chen, Y.; Wei, W.; Fang, G.; Duan, W. The increase in extreme precipitation and its proportion over global land. J. Hydrol. 2024, 628, 130456. [Google Scholar] [CrossRef]
- Hiraga, Y.; Tahara, R.; Meza, J. A methodology to estimate Probable Maximum Precipitation (PMP) under climate change using a numerical weather model. J. Hydrol. 2025, 652, 132659. [Google Scholar] [CrossRef]
- Kazemi Garajeh, M.; Haji, F.; Tohidfar, M.; Sadeqi, A.; Ahmadi, R.; Kariminejad, N. Spatiotemporal monitoring of climate change impacts on water resources using an integrated approach of remote sensing and Google Earth Engine. Sci. Rep. 2024, 14, 5469. [Google Scholar] [CrossRef]
- Kurniawan, T.A.; Bandala, E.R.; Othman, M.H.D.; Goh, H.H.; Anouzla, A.; Chew, K.W.; Aziz, F.; Al-Hazmi, H.E.; Nisa’ul Khoir, A. Implications of climate change on water quality and sanitation in climate hotspot locations: A case study in Indonesia. Water Supply 2024, 24, 517–542. [Google Scholar] [CrossRef]
- Gholami, F.; Sedighifar, Z.; Zhang, J.L.; Kisekka, I.; Li, Y. Comprehensive Analysis of the Impact of Land Use Dynamics and Climate Change Scenarios on Hydrological Processes. J. Environ. Inform. 2025, 45, 144–158. [Google Scholar] [CrossRef]
- Hillard, U.; Sridhar, V.; Lettenmaier, D.P.; McDonald, K.C. Assessing snow melt dynamics with NASA Scatterometer (NSCAT) data and a hydrologic process model. Remote Sens. Environ. 2003, 86, 52–69. [Google Scholar] [CrossRef]
- Venkata Rao, G.; Keesara, V.R.; Sridhar, V.; Srinivasan, R.; Umamahesh, N.V.; Pratap, D. Real-Time Flood Forecasting Using an Integrated Hydrologic and Hydraulic Model for the Vamsadhara and Nagavali Basins, Eastern India, Natural Hazards. Nat. Hazards 2024, 120, 6011–6039. [Google Scholar] [CrossRef]
- Thomas, J.; Joseph, S.; Thrivikramji, K.P.; Arunkumar, K.S. Sensitivity of digital elevation models: The scenario from two tropical mountain river basins of the Western Ghats, India. Geosci. Front. 2014, 5, 893–909. [Google Scholar] [CrossRef]
- Chymyrov, A. Comparison of different DEMs for hydrological studies in the mountainous areas. Egypt. J. Remote Sens. Space Sci. 2021, 24, 587–594. [Google Scholar] [CrossRef]
- Akhila, R.; Pramada, S.K. Suitability of different Digital Elevation Models in the estimation of LS factor and soil loss. Environ. Monit. Assess. 2025, 197, 511. [Google Scholar] [CrossRef] [PubMed]
- Thomas, J.; Prasannakumar, V. Comparison of basin morphometry derived from topographic maps, ASTER and SRTM DEMs: An example from Kerala, India. GeocartoInternational 2015, 30, 346–364. [Google Scholar] [CrossRef]
- Sridhar, V.; Jaksa, W.; Fang, B.; Lakshmi, V.; Hubbard, K.; Jin, X. Evaluating bias corrected AMSR-E soil moisture using in-situ observations and model estimates. Vadose Zone J. 2013, 12, 1–13. [Google Scholar] [CrossRef]
- Leon, A.S.; Kanashiro, E.A.; Valverde, R.; Sridhar, V. Dynamic framework for intelligent control of river flooding—Case study. ASCE J. Water Resour. Plan. Manag. 2014, 140, 258–268. [Google Scholar] [CrossRef]
- Whitehurst, D.; Friedman, B.; Kochersberger, K.; Sridhar, V.; Weeks, J. Drone-based community assessment, planning, and disaster risk management for sustainable development. Remote Sens. 2021, 13, 1739. [Google Scholar] [CrossRef]
- Reddy, B.S.N.; Pramada, S.K. A hybrid artificial intelligence and semi-distributed model for runoff prediction. Water Supply 2022, 22, 6181–6194. [Google Scholar] [CrossRef]
- Khatun, A.; Nisha, M.N.; Chatterjee, S.; Sridhar, V. A novel insight on input variable and time lag selection in daily streamflow forecasting using deep learning models. Environ. Model. Softw. 2024, 179, 106126. [Google Scholar] [CrossRef]
- Desalegn, H.; Mulu, A. Mapping flood inundation areas using GIS and HEC-RAS model at Fetam River, Upper Abbay Basin, Ethiopia. Sci. Afr. 2021, 12, e00834. [Google Scholar] [CrossRef]
- Afzal, M.A.; Ali, S.; Nazeer, A.; Khan, M.I.; Waqas, M.M.; Aslam, R.A.; Cheema, M.J.M.; Nadeem, M.; Saddique, N.; Muzammil, M.; et al. Flood Inundation Modeling by Integrating HEC–RAS and Satellite Imagery: A Case Study of the Indus River Basin. Water 2022, 14, 2984. [Google Scholar] [CrossRef]
- Namara, W.G.; Damisse, T.A.; Tufa, F.G. Application of HEC-RAS and HEC-GeoRAS model for flood inundation mapping, the case of Awash bello flood plain, upper Awash River Basin, oromiya regional state, Ethiopia. Model. Earth Syst. Environ. 2022, 8, 1449–1460. [Google Scholar] [CrossRef]
- Abbas, N.; Wasimi, S.A.; Al-Ansari, N.; Nasrin Baby, S. Recent trends and long-range forecasts of water resources of northeast Iraq and climate change adaptation measures. Water 2018, 10, 1562. [Google Scholar] [CrossRef]
- Ahn, J.M.; Kwon, H.G.; Yang, D.S.; Kim, Y.S. Assessing environmental flows of coordinated operation of dams and weirs in the Geum River basin under climate change scenarios. Sci. Total Environ. 2018, 643, 912–925. [Google Scholar] [CrossRef]
- Abdessamed, D.; Abderrazak, B. Coupling HEC-RAS and HEC-HMS in rainfall–runoff modeling and evaluating floodplain inundation maps in arid environments: Case study of Ain Sefra city, Ksour Mountain. SW of Algeria. Environ. Earth Sci. 2019, 78, 586. [Google Scholar] [CrossRef]
- Jayasimha Reddy, N.V.; Arunkumar, R. Development of flood inundation maps for the Chaliyar Basin, Kerala under climate change scenarios. Water Pract. Technol. 2023, 18, 2372–2383. [Google Scholar] [CrossRef]
- Sivan, S.D.; Pramada, S.K. Spatiotemporal analysis of historic and future drought characteristics over a monsoon dominated humid region (Kerala) in India. Environ. Dev. Sustain. 2024, 1–25. [Google Scholar] [CrossRef]
- Renu, S.; Pramada, S.K. Use of grace and in-situ data to characterize groundwater status along the coast of Kerala. J. Earth Syst. Sci. 2023, 132, 137. [Google Scholar] [CrossRef]
- Renu, S.; Pramada, S.K.; Yadav, B.K. Seawater intrusion susceptibility and modeling: A case study of Kerala, India. Acta Geophys. 2024, 73, 1927–1945. [Google Scholar] [CrossRef]
- Sudheer, K.P.; Murty Bhallamudi, S.; Narasimhan, B.; Thomas, J.; Bindhu, V.M.; Vema, V.; Kurian, C. Role of dams on the floods of August 2018 in Periyar River Basin, Kerala. Curr. Sci. 2019, 116, 780–794. [Google Scholar] [CrossRef]
- Nitha, V.; Pramada, S.K.; Praseed, N.S.; Sridhar, V. Performance Evaluation of Numerical Weather Prediction Models in Forecasting Rainfall Events in Kerala, India. Atmosphere 2025, 16, 372. [Google Scholar] [CrossRef]
- Hamdan, A.N.A.; Almuktar, S.; Scholz, M. Rainfall-runoff modeling using the hec-hms model for the al-adhaim river catchment, northern iraq. Hydrology 2021, 8, 58. [Google Scholar] [CrossRef]
- Kalra, A.; Joshi, N.; Baral, S.; Pradhan, S.N.; Mambepa, M.; Paudel, S.; Xia, C.; Gupta, R. Coupled 1D and 2D HEC-RAS floodplain modeling of pecos river in New Mexico. In Proceedings of the World Environmental and Water Resources Congress 2021: Planning a Resilient Future along America’s Freshwaters—Selected Papers from the World Environmental and Water Resources Congress, virtually, 7–11 June 2021; pp. 165–178. [Google Scholar] [CrossRef]
- Hu, R.; Fang, F.; Pain, C.C.; Navon, I.M. Rapid spatio-temporal flood prediction and uncertainty quantification using a deep learning method. J. Hydrol. 2019, 575, 911–920. [Google Scholar] [CrossRef]
- Satish Kumar, K.; AnandRaj, P.; Sreelatha, K.; Bisht, D.S.; Sridhar, V. Monthly and seasonal drought characterization using GRACE-based groundwater drought index and its link to teleconnections across South Indian river basins. Climate 2021, 9, 56. [Google Scholar] [CrossRef]
- Nevo, S.; Morin, E.; Gerzi Rosenthal, A.; Metzger, A.; Barshai, C.; Weitzner, D.; Voloshin, D.; Kratzert, F.; Elidan, G.; Dror, G.; et al. Flood forecasting with machine learning models in an operational framework. Hydrol. Earth Syst. Sci. 2022, 26, 4013–4032. [Google Scholar] [CrossRef]
- Faruq, A.; Marto, A.; Abdullah, S.S. Flood forecasting of Malaysia Kelantan River using support vector regression technique. Comput. Syst. Sci. Eng. 2021, 39, 297–306. [Google Scholar] [CrossRef]


Disclaimer/Publisher’s Note: The statements, opinions and data contained in all publications are solely those of the individual author(s) and contributor(s) and not of MDPI and/or the editor(s). MDPI and/or the editor(s) disclaim responsibility for any injury to people or property resulting from any ideas, methods, instructions or products referred to in the content. |
© 2025 by the authors. Licensee MDPI, Basel, Switzerland. This article is an open access article distributed under the terms and conditions of the Creative Commons Attribution (CC BY) license (https://creativecommons.org/licenses/by/4.0/).