Previous Issue
Volume 13, June


Climate, Volume 13, Issue 7 (July 2025) – 16 articles

  • Issues are regarded as officially published after their release is announced to the table of contents alert mailing list.
  • You may sign up for e-mail alerts to receive table of contents of newly released issues.
  • PDF is the official format for papers published in both, html and pdf forms. To view the papers in pdf format, click on the "PDF Full-text" link, and use the free Adobe Reader to open them.
Order results
Result details
Section
Select all
Export citation of selected articles as:
22 pages, 2775 KiB  
Article
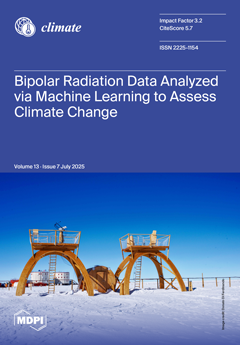
Surface Broadband Radiation Data from a Bipolar Perspective: Assessing Climate Change Through Machine Learning
by Alice Cavaliere, Claudia Frangipani, Daniele Baracchi, Maurizio Busetto, Angelo Lupi, Mauro Mazzola, Simone Pulimeno, Vito Vitale and Dasara Shullani
Climate 2025, 13(7), 147; https://doi.org/10.3390/cli13070147 (registering DOI) - 13 Jul 2025
Abstract
Clouds modulate the net radiative flux that interacts with both shortwave (SW) and longwave (LW) radiation, but the uncertainties regarding their effect in polar regions are especially high because ground observations are lacking and evaluation through satellites is made difficult by high surface [...] Read more.
Clouds modulate the net radiative flux that interacts with both shortwave (SW) and longwave (LW) radiation, but the uncertainties regarding their effect in polar regions are especially high because ground observations are lacking and evaluation through satellites is made difficult by high surface reflectance. In this work, sky conditions for six different polar stations, two in the Arctic (Ny-Ålesund and Utqiagvik [formerly Barrow]) and four in Antarctica (Neumayer, Syowa, South Pole, and Dome C) will be presented, considering the decade between 2010 and 2020. Measurements of broadband SW and LW radiation components (both downwelling and upwelling) are collected within the frame of the Baseline Surface Radiation Network (BSRN). Sky conditions—categorized as clear sky, cloudy, or overcast—were determined using cloud fraction estimates obtained through the RADFLUX method, which integrates shortwave (SW) and longwave (LW) radiative fluxes. RADFLUX was applied with daily fitting for all BSRN stations, producing two cloud fraction values: one derived from shortwave downward (SWD) measurements and the other from longwave downward (LWD) measurements. The variation in cloud fraction used to classify conditions from clear sky to overcast appeared consistent and reasonable when compared to seasonal changes in shortwave downward (SWD) and diffuse radiation (DIF), as well as longwave downward (LWD) and longwave upward (LWU) fluxes. These classifications served as labels for a machine learning-based classification task. Three algorithms were evaluated: Random Forest, K-Nearest Neighbors (KNN), and XGBoost. Input features include downward LW radiation, solar zenith angle, surface air temperature (Ta), relative humidity, and the ratio of water vapor pressure to Ta. Among these models, XGBoost achieved the highest balanced accuracy, with the best scores of 0.78 at Ny-Ålesund (Arctic) and 0.78 at Syowa (Antarctica). The evaluation employed a leave-one-year-out approach to ensure robust temporal validation. Finally, the results from cross-station models highlighted the need for deeper investigation, particularly through clustering stations with similar environmental and climatic characteristics to improve generalization and transferability across locations. Additionally, the use of feature normalization strategies proved effective in reducing inter-station variability and promoting more stable model performance across diverse settings. Full article
(This article belongs to the Special Issue Addressing Climate Change with Artificial Intelligence Methods)
Show Figures

Figure 1

30 pages, 2861 KiB  
Article
Objectifying Inland Shipping Decision Frameworks: A Case Study on the Climate Resilience of Dutch Inland Waterway Transport Policies
by Frederik Vinke, Cornelis van Dorsser and Mark van Koningsveld
Climate 2025, 13(7), 146; https://doi.org/10.3390/cli13070146 (registering DOI) - 12 Jul 2025
Abstract
Inland waterway transport (IWT) is a key function of river systems worldwide. It is vulnerable to climate change, specifically to discharge extremes, and competes for water with multiple other functions. A clear framework describing its interests to inform decision-making during regular conditions as [...] Read more.
Inland waterway transport (IWT) is a key function of river systems worldwide. It is vulnerable to climate change, specifically to discharge extremes, and competes for water with multiple other functions. A clear framework describing its interests to inform decision-making during regular conditions as well as during climate extremes is as yet unavailable in the literature. To address this gap we examine how inland shipping is taken into account in waterway policies in the Netherlands. We apply the frame of reference method to `objectify’ current inland waterway transport (IWT) policies, addressing the themes of waterway capacity, safety, service level, and sustainability. By ’objectifying’ we mean turning the implicit into an explicit `object’ of study on the one hand and revealing underlying `objectives’ on the other. We show that policies for waterway capacity and service level are well developed, while waterway safety policies are more implicit, and waterway resilience lacks a quantitative decision framework. We furthermore show that current policies mainly focus on regular conditions, leaving it unclear what changes under extreme river discharge conditions. The results provide important insights into shipping-related decision challenges during climate extremes, highlighting aspects that should be developed further to improve the climate resilience of inland shipping. While some of these implications are specific to the Dutch case, the method applied here can also be used for other river systems that support multiple functions. Full article
(This article belongs to the Section Policy, Governance, and Social Equity)
19 pages, 2465 KiB  
Article
Long-Term Variations in Extreme Rainfall in Japan for Predicting the Future Trend of Rain Attenuation in Radio Communication Systems
by Yoshio Karasawa
Climate 2025, 13(7), 145; https://doi.org/10.3390/cli13070145 - 9 Jul 2025
Viewed by 56
Abstract
Rain attenuation of radio waves with frequencies above 10 GHz causes a serious problem in wireless communications. For wireless systems design, highly accurate methods for estimating the magnitude of attenuation have long been studied. ITU-R recommends a calculation method for rain attenuation using [...] Read more.
Rain attenuation of radio waves with frequencies above 10 GHz causes a serious problem in wireless communications. For wireless systems design, highly accurate methods for estimating the magnitude of attenuation have long been studied. ITU-R recommends a calculation method for rain attenuation using R0.01, the 1 min rainfall rate that is exceeded for 0.01% of an average year. Accordingly, an R0.01 database suitable for this calculation has been constructed. In recent years, global warming has emerged as an important climatological issue. If the predicted rise in temperatures associated with global warming induces a significant effect on rainfall characteristics, the existing R0.01 database will need to be revised. However, there is currently no information for quantitatively evaluating the likely long-term change in R0.01. In our previous study, the long-term trend in annual maximum values for 1-day, 1 h, and 10 min rainfall in Japan was estimated from a large amount of meteorological data and a 95% confidence interval approach was used to identify an increasing trend of more than 10% over approximately 100 years. In this paper, we investigate the long-term trend in greater detail using non-linear approximations for three types of rainfall and adopt the Akaike Information Criterion to determine the optimal order of the non-linear approximation. The future trend of R0.01 is then estimated based on the long-term change in annual maximum 1 h rainfall, exploiting the strong correlation between long-term average annual maximum 1 h rainfall and R0.01. Full article
Show Figures

Figure 1

15 pages, 2489 KiB  
Article
Interannual Variability in Barotropic Sea Level Differences Across the Korea/Tsushima Strait and Its Relationship to Upper-Ocean Current Variability in the Western North Pacific
by Jihwan Kim, Hanna Na and SeungYong Lee
Climate 2025, 13(7), 144; https://doi.org/10.3390/cli13070144 - 9 Jul 2025
Viewed by 119
Abstract
The barotropic sea level difference (SLD) across the Korea/Tsushima Strait (KTS) is considered an index of the volume transport into the East/Japan Sea. This study investigates the interannual variability of the barotropic SLD (the KTS inflow) from 1985 to 2017 and its relationship [...] Read more.
The barotropic sea level difference (SLD) across the Korea/Tsushima Strait (KTS) is considered an index of the volume transport into the East/Japan Sea. This study investigates the interannual variability of the barotropic SLD (the KTS inflow) from 1985 to 2017 and its relationship to upper-ocean (<300 m) current variability in the western North Pacific. An increase in the KTS inflow is associated with a weakening of the Kuroshio current through the Tokara Strait and upper-ocean cooling in the North Pacific Subtropical Gyre, characteristic of a La Niña-like state. Diagnostic analysis reveals that the KTS inflow variability is linked to at least two statistically distinct and concurrent modes of oceanic variability. The first mode is tied to the El Niño–Southern Oscillation through large-scale changes in the Kuroshio system. The second mode, which is linearly uncorrelated with the first, is associated with regional eddy kinetic energy variability in the western North Pacific. The identification of these parallel pathways suggests a complex regulatory system for the KTS inflow. This study provides a new framework for understanding the multi-faceted connection between the KTS and upstream oceanic processes, with implications for the predictability of the ocean environmental conditions in the East/Japan Sea. Full article
Show Figures

Figure 1

13 pages, 392 KiB  
Article
The Range of Projected Change in Vapour Pressure Deficit Through 2100: A Seasonal and Regional Analysis of the CMIP6 Ensemble
by Jiulong Xu, Mingyang Yao, Yunjie Chen, Liuyue Jiang, Binghong Xing and Hamish Clarke
Climate 2025, 13(7), 143; https://doi.org/10.3390/cli13070143 - 9 Jul 2025
Viewed by 198
Abstract
Vapour pressure deficit (VPD) is frequently used to assess the impact of climate change on wildfires, vegetation, and other phenomena dependent on atmospheric moisture. A common aim of projection studies is to sample the full range of changes projected by climate models. Although [...] Read more.
Vapour pressure deficit (VPD) is frequently used to assess the impact of climate change on wildfires, vegetation, and other phenomena dependent on atmospheric moisture. A common aim of projection studies is to sample the full range of changes projected by climate models. Although characterization of model spread in projected temperature and rainfall is common, similar analyses are lacking for VPD. Here, we analyze the range of change in projected VPD from a 15-member CMIP6 model ensemble using the SSP-370 scenario. Projected changes are calculated for 2015–2100 relative to the historical period 1850–2014, and the resulting changes are analyzed on a seasonal and regional basis, the latter using continents based on IPCC reference regions. We find substantial regional differences including higher increases in VPD in areas towards the equatorial regions, indicating increased vulnerability to climate change in these areas. Seasonal assessments reveal that regions in the Northern Hemisphere experience peak VPD changes in summer (JJA), correlating with higher temperatures and lower relative humidity, while Southern Hemisphere areas like South America see notable increases in all seasons. We find that the mean projected change in seasonal VPD ranges from 0.02–0.23 kPa in Europe, 0.04–0.19 kPa in Asia, 0.02–0.16 kPa in North America, 0.15–0.33 kPa in South America, 0.10–0.18 kPa in Oceania, and 0.21–0.31 kPa in Africa. Our analysis suggests that for most regions, no two models span the range of projected change in VPD for all seasons. The overall projected change space for VPD identified here can be used to interpret existing studies and support model selection for future climate change impact assessments that seek to span this range. Full article
(This article belongs to the Section Weather, Events and Impacts)
Show Figures

Figure 1

18 pages, 15684 KiB  
Article
The Calculation and Mapping of the Moisture Indices of the East Kazakhstan Region for the Preventive Assessment of the Climate–Hydrological Background
by Dmitry Chernykh, Kamilla Rakhymbek, Roman Biryukov, Andrey Bondarovich, Lilia Lubenets and Yerzhan Baiburin
Climate 2025, 13(7), 142; https://doi.org/10.3390/cli13070142 - 8 Jul 2025
Viewed by 197
Abstract
The assessment of the hydrological functions of landscapes and the landscape–hydrological background is an important instrument for minimizing damage from rivers and preventing water conflicts under conditions of data scarcity for hydrological modeling. To assess the climate–hydrological background of the East Kazakhstan region, [...] Read more.
The assessment of the hydrological functions of landscapes and the landscape–hydrological background is an important instrument for minimizing damage from rivers and preventing water conflicts under conditions of data scarcity for hydrological modeling. To assess the climate–hydrological background of the East Kazakhstan region, the Selyaninov Hydro-thermal Coefficient and the Vysotsky–Ivanov Moisture Coefficient were used. The East Kazakhstan region is a typical continental arid and semi-arid region. The presence of mountain ranges, such as the Altai, makes the climate and environment in the region highly varied. A dataset from 30 weather stations for the period 1961–2023 was used for calculations. Three interpolation methods and landscape extrapolation were used to construct maps of the coefficients. Over the observation period, the values of the moisture indices at the weather stations in the region fluctuated within a wide range. Both coefficients are in the range from extra arid to extra humid climates. Full article
Show Figures

Figure 1

28 pages, 7776 KiB  
Article
Climate Risk and Vulnerability Assessment in the Province of Almeria (Spain) Under Different Climate Change Scenarios
by Sara Barilari, Yaiza Villar-Jiménez, Giusy Fedele, Alfredo Reder and Iván Ramos-Diez
Climate 2025, 13(7), 141; https://doi.org/10.3390/cli13070141 - 4 Jul 2025
Viewed by 160
Abstract
Climate change represents a major global challenge, with semi-arid regions like the province of Almería being particularly vulnerable. Almería’s dependence on climate-sensitive sectors such as agriculture and tourism, coupled with the absence of perennial rivers, increases its exposure to extreme events including heatwaves, [...] Read more.
Climate change represents a major global challenge, with semi-arid regions like the province of Almería being particularly vulnerable. Almería’s dependence on climate-sensitive sectors such as agriculture and tourism, coupled with the absence of perennial rivers, increases its exposure to extreme events including heatwaves, droughts, and extreme precipitation events like storms. This study proposes a semi-quantitative methodology to assess climate risk across different sectors at the municipal level, combining indicators of hazard, exposure and vulnerability within the framework of the IPCC AR6. Exposure and vulnerability indicators were derived from regional, national and European datasets, while hazards were characterized using downscaled Essential Climate Variables. After data collection, the indicators were normalized using a percentile-based approach to ensure their comparison and replicability, especially in data-scarce contexts. The results reveal both sectoral and spatial patterns of risk under three different climate change scenarios, highlighting municipalities with a higher level of exposure, vulnerability and risk. Although the static nature of exposure and vulnerability indicators represents a limitation in future risk quantification, the findings remain valuable for identifying priority areas for targeted adaptation and mitigation strategies. The proposed semi-quantitative risk methodology based on indicators is of great interest and relevance for understanding differences at local scales, as well as for implementing adaptation and mitigation solutions adjusted to the real needs of each municipality. Full article
(This article belongs to the Special Issue Climate Change Impacts at Various Geographical Scales (2nd Edition))
Show Figures

Figure 1

24 pages, 4645 KiB  
Article
The Impact of Climate Change and Water Consumption on the Inflows of Hydroelectric Power Plants in the Central Region of Brazil
by Filipe Otávio Passos, Benedito Cláudio da Silva, José Wanderley Marangon de Lima, Marina de Almeida Barbosa, Pedro Henrique Gomes Machado and Rafael Machado Martins
Climate 2025, 13(7), 140; https://doi.org/10.3390/cli13070140 - 4 Jul 2025
Viewed by 143
Abstract
There is a consensus that climate change has affected society. The increase in temperature and reduction in precipitation for some regions of the world have had implications for the intensity and frequency of extreme events. This scenario is worrying for various sectors of [...] Read more.
There is a consensus that climate change has affected society. The increase in temperature and reduction in precipitation for some regions of the world have had implications for the intensity and frequency of extreme events. This scenario is worrying for various sectors of water use, such as hydroelectric power generation and agriculture. Reduced flows in river basins, coupled with increased water consumption, can significantly affect energy generation and food production. Within this context, this paper presents an analysis of climate change impacts in a large basin of Brazil between the Amazon and Cerrado biomes, considering the effects of water demands. Inflow projections were generated for seven power plant reservoirs in the Tocantins–Araguaia river basin, using projections from five climate models. The results indicate significant reductions in flows, with decreases of more than 50% in the average flow. For minimum flows, there are indications of reductions of close to 85%. The demand for water, although growing, represents a smaller part of the effects, but should not be disregarded, since it impacts the dry periods of the rivers and can generate conflicts with energy production. Full article
(This article belongs to the Section Climate and Economics)
Show Figures

Figure 1

29 pages, 3813 KiB  
Article
Addressing Climate Resilience in the African Region: Prioritizing Mental Health and Psychosocial Well-Being in Disaster Preparedness and Response Planning for Mainstream Communities and Migrants
by Belayneh Fentahun Shibesh and Nidhi Nagabhatla
Climate 2025, 13(7), 139; https://doi.org/10.3390/cli13070139 - 3 Jul 2025
Viewed by 315
Abstract
Climate change represents a complex and multifaceted challenge for health systems, particularly in the African region, where the research has predominantly focused on physical health impacts while overlooking critical mental health dimensions. Our central hypothesis is that integrating culturally adapted mental health and [...] Read more.
Climate change represents a complex and multifaceted challenge for health systems, particularly in the African region, where the research has predominantly focused on physical health impacts while overlooking critical mental health dimensions. Our central hypothesis is that integrating culturally adapted mental health and psychosocial support (MHPSS) into climate resilience frameworks and disaster response planning will significantly reduce psychological distress (e.g., anxiety, depression, and trauma) and enhance adaptive capacities among both mainstream and migrant communities in disaster-prone African regions. This rapid review methodology systematically explores the intricate relationships between climate change, mental health, and migration by examining the existing literature and identifying significant information gaps. The key findings underscore the urgent need for targeted research and strategic interventions that specifically address mental health vulnerabilities in the context of climate change. This review highlights how extreme weather events, environmental disruptions, and forced migration create profound psychological stressors that extend beyond immediate physical health concerns. This research emphasizes the importance of developing comprehensive adaptation strategies integrating mental health considerations into broader climate response frameworks. Recommendations emerging from this assessment call for immediate and focused attention on developing specialized research, policies, and interventions that recognize the unique mental health challenges posed by climate change in African contexts. We also note the current limitations in the existing national adaptation plans, which frequently overlook mental health dimensions, thereby underscoring the necessity of a more holistic and nuanced approach to understanding climate change’s psychological impacts. In this exploratory study, we intended to provide a crucial preliminary assessment of the complex intersections between climate change, mental health, and migration, offering valuable insights for policymakers, researchers, and healthcare professionals seeking to develop more comprehensive and responsive strategies in an increasingly challenging environmental landscape. Full article
(This article belongs to the Special Issue Coping with Flooding and Drought)
Show Figures

Figure 1

18 pages, 2010 KiB  
Article
Frequency Analysis and Trend of Maximum Wind Speed for Different Return Periods in a Cold Diverse Topographical Region of Iran
by Leila Alimohamadian and Raoof Mostafazadeh
Climate 2025, 13(7), 138; https://doi.org/10.3390/cli13070138 - 2 Jul 2025
Viewed by 163
Abstract
This study examines the trends and statistical characteristics of daily maximum wind speed across various synoptic stations in Ardabil Province, Iran, with diverse topography. Using daily wind speed data from multiple synoptic stations, the research focuses on three primary objectives: assessing changes in [...] Read more.
This study examines the trends and statistical characteristics of daily maximum wind speed across various synoptic stations in Ardabil Province, Iran, with diverse topography. Using daily wind speed data from multiple synoptic stations, the research focuses on three primary objectives: assessing changes in daily maximum wind speed, fitting various statistical distributions to the data, and estimating wind speed values for different return periods. In this research, the temporal changes were evaluated while analyzing the frequency of the data, and then the maximum wind speed values were calculated and analyzed for different return periods by fitting frequency distributions. The analysis reveals notable variability in maximum wind speeds across stations. The trend analysis, conducted using the nonparametric Mann–Kendall method, reveals significant positive trends in maximum wind speed at Meshgin-Shahr and Sareyn (p < 0.05). Meanwhile, data from Khalkhal station displays a significant decreasing trend, while other stations, like Ardabil and Parsabad, show no meaningful trends. According to the statistical distributions analysis, the Fisher–Tippett T2 mirrored distribution demonstrates the best fit for Ardabil, with an absolute difference of 2.52%, while the Laplace distribution yields the lowest discrepancies for Bilesavar (3.50%) and Ardabil Airport (3.83%). This ranking indicates that, despite similar first-ranked distributions in some stations, secondary models show variability, suggesting localized influences on wind speed that modify distributional fit. As a conclusion, the Laplace (std) distribution stands out as the best-fit model for several stations, showing relative consistency across several stations. These findings demonstrate the necessity of site-specific statistical modeling to accurately represent wind speed patterns across the diverse landscapes of Ardabil Province. Based on the results, comparing the wind characteristics in the study area with those of other regions in Iran, as well as analyzing the reported trends, can be useful in determining the impact of the region’s climatic conditions and topography on wind patterns. This research offers key insights into wind speed variability and trends in Ardabil, crucial for climate adaptation and risk management of extreme wind events. Full article
(This article belongs to the Special Issue Wind‑Speed Variability from Tropopause to Surface)
Show Figures

Figure 1

23 pages, 3151 KiB  
Article
Should We Use Quantile-Mapping-Based Methods in a Climate Change Context? A “Perfect Model” Experiment
by Mathieu Vrac, Harilaos Loukos, Thomas Noël and Dimitri Defrance
Climate 2025, 13(7), 137; https://doi.org/10.3390/cli13070137 - 1 Jul 2025
Viewed by 367
Abstract
This study assesses the use of Quantile-Mapping methods for bias correction and downscaling in climate change studies. A “Perfect Model Experiment” is conducted using high-resolution climate simulations as pseudo-references and coarser versions as biased data. The focus is on European daily temperature and [...] Read more.
This study assesses the use of Quantile-Mapping methods for bias correction and downscaling in climate change studies. A “Perfect Model Experiment” is conducted using high-resolution climate simulations as pseudo-references and coarser versions as biased data. The focus is on European daily temperature and precipitation under the RCP 8.5 scenario. Six methods are tested: an empirical Quantile-Mapping approach, the “Cumulative Distribution Function—transform” (CDF-t) method, and four CDF-t variants with different parameters. Their performance is evaluated based on univariate and multivariate properties over the calibration period (1981–2010) and a future period (2071–2100). The results show that while Quantile Mapping and CDF-t perform similarly during calibration, significant differences arise in future projections. Quantile Mapping exhibits biases in the means, standard deviations, and extremes, failing to capture the climate change signal. CDF-t and its variants show smaller biases, with one variant proving particularly robust. The choice of discretization parameter in CDF-t is crucial, as the low number of bins increases the biases. This study concludes that Quantile Mapping is not appropriate for adjustments in a climate change context, whereas CDF-t, especially a variant that stabilizes extremes, offers a more reliable alternative. Full article
Show Figures

Figure 1

17 pages, 897 KiB  
Article
The Gender–Climate–Security Nexus: A Case Study of Plateau State
by T. Oluwaseyi Ishola and Isaac Luginaah
Climate 2025, 13(7), 136; https://doi.org/10.3390/cli13070136 - 30 Jun 2025
Viewed by 324
Abstract
This study investigates the gendered nexus between climate change, food insecurity, and conflict in Plateau State, Nigeria. This region in north-central Nigeria is marked by recurring farmer–herder clashes and climate-induced environmental degradation. Drawing on qualitative methods, including interviews, gender-disaggregated focus groups, and key [...] Read more.
This study investigates the gendered nexus between climate change, food insecurity, and conflict in Plateau State, Nigeria. This region in north-central Nigeria is marked by recurring farmer–herder clashes and climate-induced environmental degradation. Drawing on qualitative methods, including interviews, gender-disaggregated focus groups, and key informant discussions, the research explores how climate variability and violent conflict interact to exacerbate household food insecurity. The methodology allows the capture of nuanced perspectives and lived experiences, particularly emphasizing the differentiated impacts on women and men. The findings reveal that irregular rainfall patterns, declining agricultural yields, and escalating violence have disrupted traditional farming systems and undermined rural livelihoods. The study also shows that women, though they are responsible for household food management, face disproportionate burdens due to restricted mobility, limited access to resources, and a heightened exposure to gender-based violence. Grounded in Conflict Theory, Frustration–Aggression Theory, and Feminist Political Ecology, the analysis shows how intersecting vulnerabilities, such as gender, age, and socioeconomic status, shape experiences of food insecurity and adaptation strategies. Women often find creative and local ways to cope with challenges, including seed preservation, rationing, and informal trade. However, systemic barriers continue to hinder sustainable progress. This study emphasized the need for integrating gender-sensitive interventions into policy frameworks, such as land tenure reforms, targeted agricultural support for women, and improved security measures, to effectively mitigate food insecurity and promote sustainable livelihoods, especially in conflict-affected regions. Full article
Show Figures

Figure 1

28 pages, 3178 KiB  
Article
Satellite-Based Seasonal Fingerprinting of Methane Emissions from Canadian Dairy Farms Using Sentinel-5P
by Padmanabhan Jagannathan Prajesh, Kaliaperumal Ragunath, Miriam Gordon and Suresh Neethirajan
Climate 2025, 13(7), 135; https://doi.org/10.3390/cli13070135 - 27 Jun 2025
Viewed by 319
Abstract
Methane (CH4) emissions from dairy farming represent a substantial yet under-quantified share of agricultural greenhouse gas emissions. This study provides an in-depth, satellite-based fingerprinting analysis of methane emissions from Canada’s dairy sector, using Sentinel-5P/TROPOMI data. We utilized a robust quasi-experimental design, [...] Read more.
Methane (CH4) emissions from dairy farming represent a substantial yet under-quantified share of agricultural greenhouse gas emissions. This study provides an in-depth, satellite-based fingerprinting analysis of methane emissions from Canada’s dairy sector, using Sentinel-5P/TROPOMI data. We utilized a robust quasi-experimental design, pairing 14 dairy-intensive zones with eight non-dairy reference regions, to analyze methane emissions from 2019 to 2024. A dynamic, region-specific baseline approach was implemented to remove temporal non-stationarity and isolate dairy-specific methane signals. Dairy regions exhibited consistently higher methane concentrations than reference areas, with an average methane anomaly of 17.4 ppb. However, this concentration gap between dairy and non-dairy regions notably narrowed by 57.23% (from 24.42 ppb in 2019 to 10.44 ppb in 2024), driven primarily by accelerated methane increases in non-dairy landscapes and a pronounced one-year contraction during 2022–2023 (−39.29%). Nationally, atmospheric methane levels rose by 3.83%, revealing significant spatial heterogeneity across provinces. Notably, an inverse relationship between the initial methane concentrations in 2019 and subsequent growth rates emerged, indicating spatial convergence. The seasonal analysis uncovered consistent spring minima and fall–winter maxima across regions, reflecting the combined effects of seasonal livestock management practices, atmospheric transport dynamics, and biogeochemical processes. The diminishing dairy methane anomaly suggests complex interplay of intensifying background methane emissions from climate-driven wetland fluxes, increasing fossil fuel extraction activities, and diffuse agricultural emissions. These findings underscore the emerging challenges in attributing sector-specific methane emissions accurately from satellite observations, highlighting both the capabilities and limitations of current satellite monitoring approaches. Full article
Show Figures

Figure 1

44 pages, 7948 KiB  
Article
Key Motivations, Barriers, and Enablers Toward Net-Zero Cities: An Integrated Framework and Large Survey in Japan
by Fedor Myasoedov and Dimiter Savov Ialnazov
Climate 2025, 13(7), 134; https://doi.org/10.3390/cli13070134 - 25 Jun 2025
Viewed by 936
Abstract
Ensuring consistent progress toward cities’ net-zero emission goals requires understanding key dimensions of urban climate governance—particularly the motivations driving municipalities toward net zero and the critical barriers and enablers along this pathway. Current knowledge on these critical aspects is fragmented, lacking a holistic [...] Read more.
Ensuring consistent progress toward cities’ net-zero emission goals requires understanding key dimensions of urban climate governance—particularly the motivations driving municipalities toward net zero and the critical barriers and enablers along this pathway. Current knowledge on these critical aspects is fragmented, lacking a holistic framework and empirical prioritization of key factors. We developed an integrated analytical framework and empirically distilled the most salient motivations, barriers, and enablers through a large-scale survey targeting 489 net-zero-committed municipalities—known as “Zero Carbon Cities”—across Japan. With responses from 309 municipalities, we deliver the first systematic mapping of factors perceived as most influential by Japanese local authorities. The results indicate that municipalities are primarily motivated by seizing local economic development opportunities (enhanced local energy conditions, financial gains and savings, and local industry revitalization), future-proofing communities against disasters, and enhancing the local quality of life. Key barriers and enablers were identified across four categories: municipal resources and authority (budgets, dedicated staff, and empowered climate agencies), knowledge and expertise (staff climate competence), institutional coherence (cross-departmental coordination and stakeholder involvement), and political will and leadership (the presence of climate champions and awareness within city halls and among residents). Accordingly, we discuss implications and derive recommendations toward strengthened local action in Japan and beyond. Full article
(This article belongs to the Section Policy, Governance, and Social Equity)
Show Figures

Figure 1

23 pages, 2459 KiB  
Review
Climate-Sensitive Health Outcomes in Kenya: A Scoping Review of Environmental Exposures and Health Outcomes Research, 2000–2024
by Jessica Gerard, Titus Kibaara, Iris Martine Blom, Jane Falconer, Shamsudeen Mohammed, Zaharat Kadri-Alabi, Roz Taylor, Leila Abdullahi, Robert C. Hughes, Bernard Onyango and Ariel A. Brunn
Climate 2025, 13(7), 133; https://doi.org/10.3390/cli13070133 - 20 Jun 2025
Viewed by 1573
Abstract
Climate change threatens health and social development gains in Kenya, necessitating health policy planning for risk reduction and mitigation. To understand the state of knowledge on climate-related health impacts in Kenya, a scoping review of 25 years of environmental health research was conducted. [...] Read more.
Climate change threatens health and social development gains in Kenya, necessitating health policy planning for risk reduction and mitigation. To understand the state of knowledge on climate-related health impacts in Kenya, a scoping review of 25 years of environmental health research was conducted. In compliance with a pre-registered protocol, nine bibliographic databases and grey literature sources were searched for articles published from 2000 to 2024. Of 19,234 articles screened, 816 full texts were reviewed in duplicate, and a final 348 articles underwent data extraction for topic categorisation, trend analysis, and narrative summary. Most of the studies (97%, n = 336) were journal articles, with 64% published after 2014 (n = 224). The health topics centred on vector-borne diseases (45%, n = 165), primarily vector abundance (n = 111) and malaria (n = 67), while mental health (n = 12) and heat exposure (n = 9) studies were less frequent. The research was geographically concentrated on the Lake Victoria Basin, Rift Valley, and Coastal regions, with fewer studies from the northern arid and semi-arid regions. The findings show a shift from a focus on infectious diseases towards broader non-communicable outcomes, as well as regional disparities in research coverage. This review highlights the development of baseline associations between environmental exposures and health outcomes in Kenya, providing a necessary foundation for evidence-informed climate change and health policy. However, challenges in data and study designs limit some of the evidentiary value. Full article
(This article belongs to the Special Issue Climate, Ecosystem and Human Health: Impacts and Adaptation)
Show Figures

Figure 1

26 pages, 4052 KiB  
Article
Adaptation and Mitigation Strategies of the Populations of Abuja and Ouagadougou in West Africa to the Various Impacts of Extreme Climate Events in Urban Areas
by Aliou Gadiaga, Appollonia Aimiosino Okhimamhe, Michael Thiel and Oble Neya
Climate 2025, 13(7), 132; https://doi.org/10.3390/cli13070132 - 20 Jun 2025
Viewed by 509
Abstract
Urban settings in West Africa are increasingly experiencing extreme weather events, such as heat waves, floods, and windstorms. Climate phenomena exacerbated by global climate change are not unique to this region but reflect a broader trend of worldwide environmental changes. However, how local [...] Read more.
Urban settings in West Africa are increasingly experiencing extreme weather events, such as heat waves, floods, and windstorms. Climate phenomena exacerbated by global climate change are not unique to this region but reflect a broader trend of worldwide environmental changes. However, how local communities in tropical cities in the global south adapt to these extreme events is not fully understood. Understanding local adaptation strategies is crucial in enhancing our ability to develop context-specific policies that address climate vulnerabilities. This study aimed to analyse the adaptation and mitigation strategies employed by the urban residents of Abuja and Ouagadougou in response to recurrent floods, heat waves, and windstorms. To investigate adaptation and mitigation strategies for climate change in urban areas, this study collected quantitative data from a sample of 840 households in Abuja and 840 households in Ouagadougou. The results revealed that the participants of each city used different strategies to adapt to and mitigate heat waves, floods, and windstorms. However, the level of adoption of these measures differed among the respondents. The findings revealed a low level of adoption of climate change mitigation measures. Context-specific policies must prioritise strengthening local adaptation strategies, addressing socioeconomic disparities, and fostering urban design solutions tailored to each city’s unique environmental and infrastructural challenges. Full article
Show Figures

Figure 1

Previous Issue
Back to TopTop