Article

Climate Risk and Vulnerability Assessment in the Province of Almeria (Spain) Under Different Climate Change Scenarios

1
CARTIF Technology Centre, Boecillo Technology Park, P205, 47151 Valladolid, Spain
2
CMCC Foundation—Euro-Mediterranean Center on Climate Change, 81100 Caserta, Italy
*
Author to whom correspondence should be addressed.
Climate 2025, 13(7), 141; https://doi.org/10.3390/cli13070141
Submission received: 30 April 2025 / Revised: 27 June 2025 / Accepted: 3 July 2025 / Published: 4 July 2025
(This article belongs to the Special Issue Climate Change Impacts at Various Geographical Scales (2nd Edition))

Abstract

Climate change represents a major global challenge, with semi-arid regions like the province of Almería being particularly vulnerable. Almería’s dependence on climate-sensitive sectors such as agriculture and tourism, coupled with the absence of perennial rivers, increases its exposure to extreme events including heatwaves, droughts, and extreme precipitation events like storms. This study proposes a semi-quantitative methodology to assess climate risk across different sectors at the municipal level, combining indicators of hazard, exposure and vulnerability within the framework of the IPCC AR6. Exposure and vulnerability indicators were derived from regional, national and European datasets, while hazards were characterized using downscaled Essential Climate Variables. After data collection, the indicators were normalized using a percentile-based approach to ensure their comparison and replicability, especially in data-scarce contexts. The results reveal both sectoral and spatial patterns of risk under three different climate change scenarios, highlighting municipalities with a higher level of exposure, vulnerability and risk. Although the static nature of exposure and vulnerability indicators represents a limitation in future risk quantification, the findings remain valuable for identifying priority areas for targeted adaptation and mitigation strategies. The proposed semi-quantitative risk methodology based on indicators is of great interest and relevance for understanding differences at local scales, as well as for implementing adaptation and mitigation solutions adjusted to the real needs of each municipality.

1. Introduction

Climate change is one of the greatest global challenges of the 21st century, with significant impacts on ecosystems, societies and economies [1], and the Mediterranean region in which Almería is located, is a climate change hotspot [2]. Climate change is intensifying natural and socio-economic risks at the local scale, particularly in vulnerable regions such as the province of Almería, where arid conditions, pressure on water resources, and the exposure of key sectors—such as agriculture—amplify adverse effects [3]. The increase in climate variability, as well as the frequency and severity of extreme events such as heat waves, droughts and floods in this Mediterranean region, require robust approaches for climate risk assessment, in which the interaction between climate hazard, exposure and vulnerability is evaluated [4,5]. In this context, risk assessment methodologies integrating the three main risk components are essential for informing adaptation planning and decision-making based on scientific evidence. Taking this into account, access to information about potential climate-related risks is essential in effectively planning adaptation measures and justifying their implementation [6].
Vulnerability and risk assessments that highlight the risks related to climate change have become a growing trend, helping to bridge the knowledge gap in risk quantification [7,8]. Traditional climate risk assessment approaches can be classified as qualitative, semi-quantitative, and quantitative. While qualitative methods rely on expert knowledge about the risk, quantitative approaches use mathematical models and complex simulations to calculate the risk [9]. However, quantitative approaches may be limited by data availability and the uncertainty inherent in climate projections due to the limitations of models, like the resolution or the comprehension of systems and related interlinkages. In this regard, semi-quantitative methodologies, which combine the flexibility of qualitative approaches with the objectivity of quantitative techniques, have gained relevance in climate risk assessment [10]. Its adoption is justified when a limited availability of quantitative data is identified, the systems involved are complex, and the multiple dimensions of risk need to be integrated: hazard, exposure and vulnerability [9]. Semi-quantitative methods employ quantifiable indicators that allow for the normalization and aggregation of information to systematically characterize the different components of risk [11]. Indicator selection is key to avoiding biases in the risk characterization if they do not clearly represent the specificities of each sector. Although these semi-quantitative methods do not constitute a full and comprehensive quantitative risk analysis, they allow for a structured, transparent, and flexible risk characterization, which is especially valuable in decision-making environments that require a trade-off between technical quality and practical applicability [12]. Furthermore, they allow for the capture of subjective opinions, fostering debate and serving as a foundation to identify areas where additional analytical effort is needed [13]. These methods have been successfully tested in situations where uncertainty is high or knowledge is incomplete, supporting systematic reasoning and the communication of risk [14].
The Fifth and Sixth Assessment Reports of the IPCC (AR5 and AR6) have established a conceptual framework for climate risk assessment based on the interaction of the three main risk dimensions: hazard, exposure and vulnerability [15]. This IPCC framework has been used in many studies to determine the potential risks associated with climate change and extreme events [16,17]. The use of indicators has become a useful tool for operationalizing the risk assessment under the IPCC framework. Indicators enable the translation of climate and socio-economic variables into comparable and scalable metrics, facilitating the identification of the most vulnerable areas, the main hazard to be studied, as well as the sectors exposed and affected by climate-change-associated impacts [18,19].
The normalization of indicators is a critical step in the implementation of the semi-quantitative risk assessment methodology, ensuring indicator comparison and allowing different types of data to be integrated into a common scale for the risk characterization [20]. Common normalization techniques include Min-Max Scaling, Z-score transformation and percentile-based classes [8]. These techniques help to generate comparable indicators within the basis of a boundary, generating understandable patterns for the areas under assessment. The choice of one or another normalization method has direct implications for the interpretation of the risk components and results, being crucial for the identification of priority areas and sectors for adaptation to climate change.
In this study, we present a semi-quantitative methodology for climate risk characterization based on the normalization and application of indicators, following IPCC guidelines, to evaluate the risk of each municipality in Almería according to three different climate hazards. This methodology is designed to provide a replicable and adaptable approach at different spatial scales and sectors of analysis, making it easy to understand climate risk from a multisectoral perspective. Through a set of selected indicators per variable (hazard, exposure and vulnerability) and sector, the proposed risk characterization framework assesses the interaction between hazard, exposure and vulnerability, offering a valuable tool for planning adaptation and mitigation strategies for climate change. To test the robustness of this methodology, the article describes its application in the province of Almería (Spain), allowing one to collect insights about its ability to understand climate change risks in an arid region like Almería that is highly affected by climate change and suffers from significant heat waves and long periods of drought. The study area has not been addressed in multi-sectoral studies on risk quantification and evaluation, which generally limit themselves to evaluations in a specific sector, as in the case of water resources and their implication in the sustainability of economic activities [3].

2. Materials and Methods
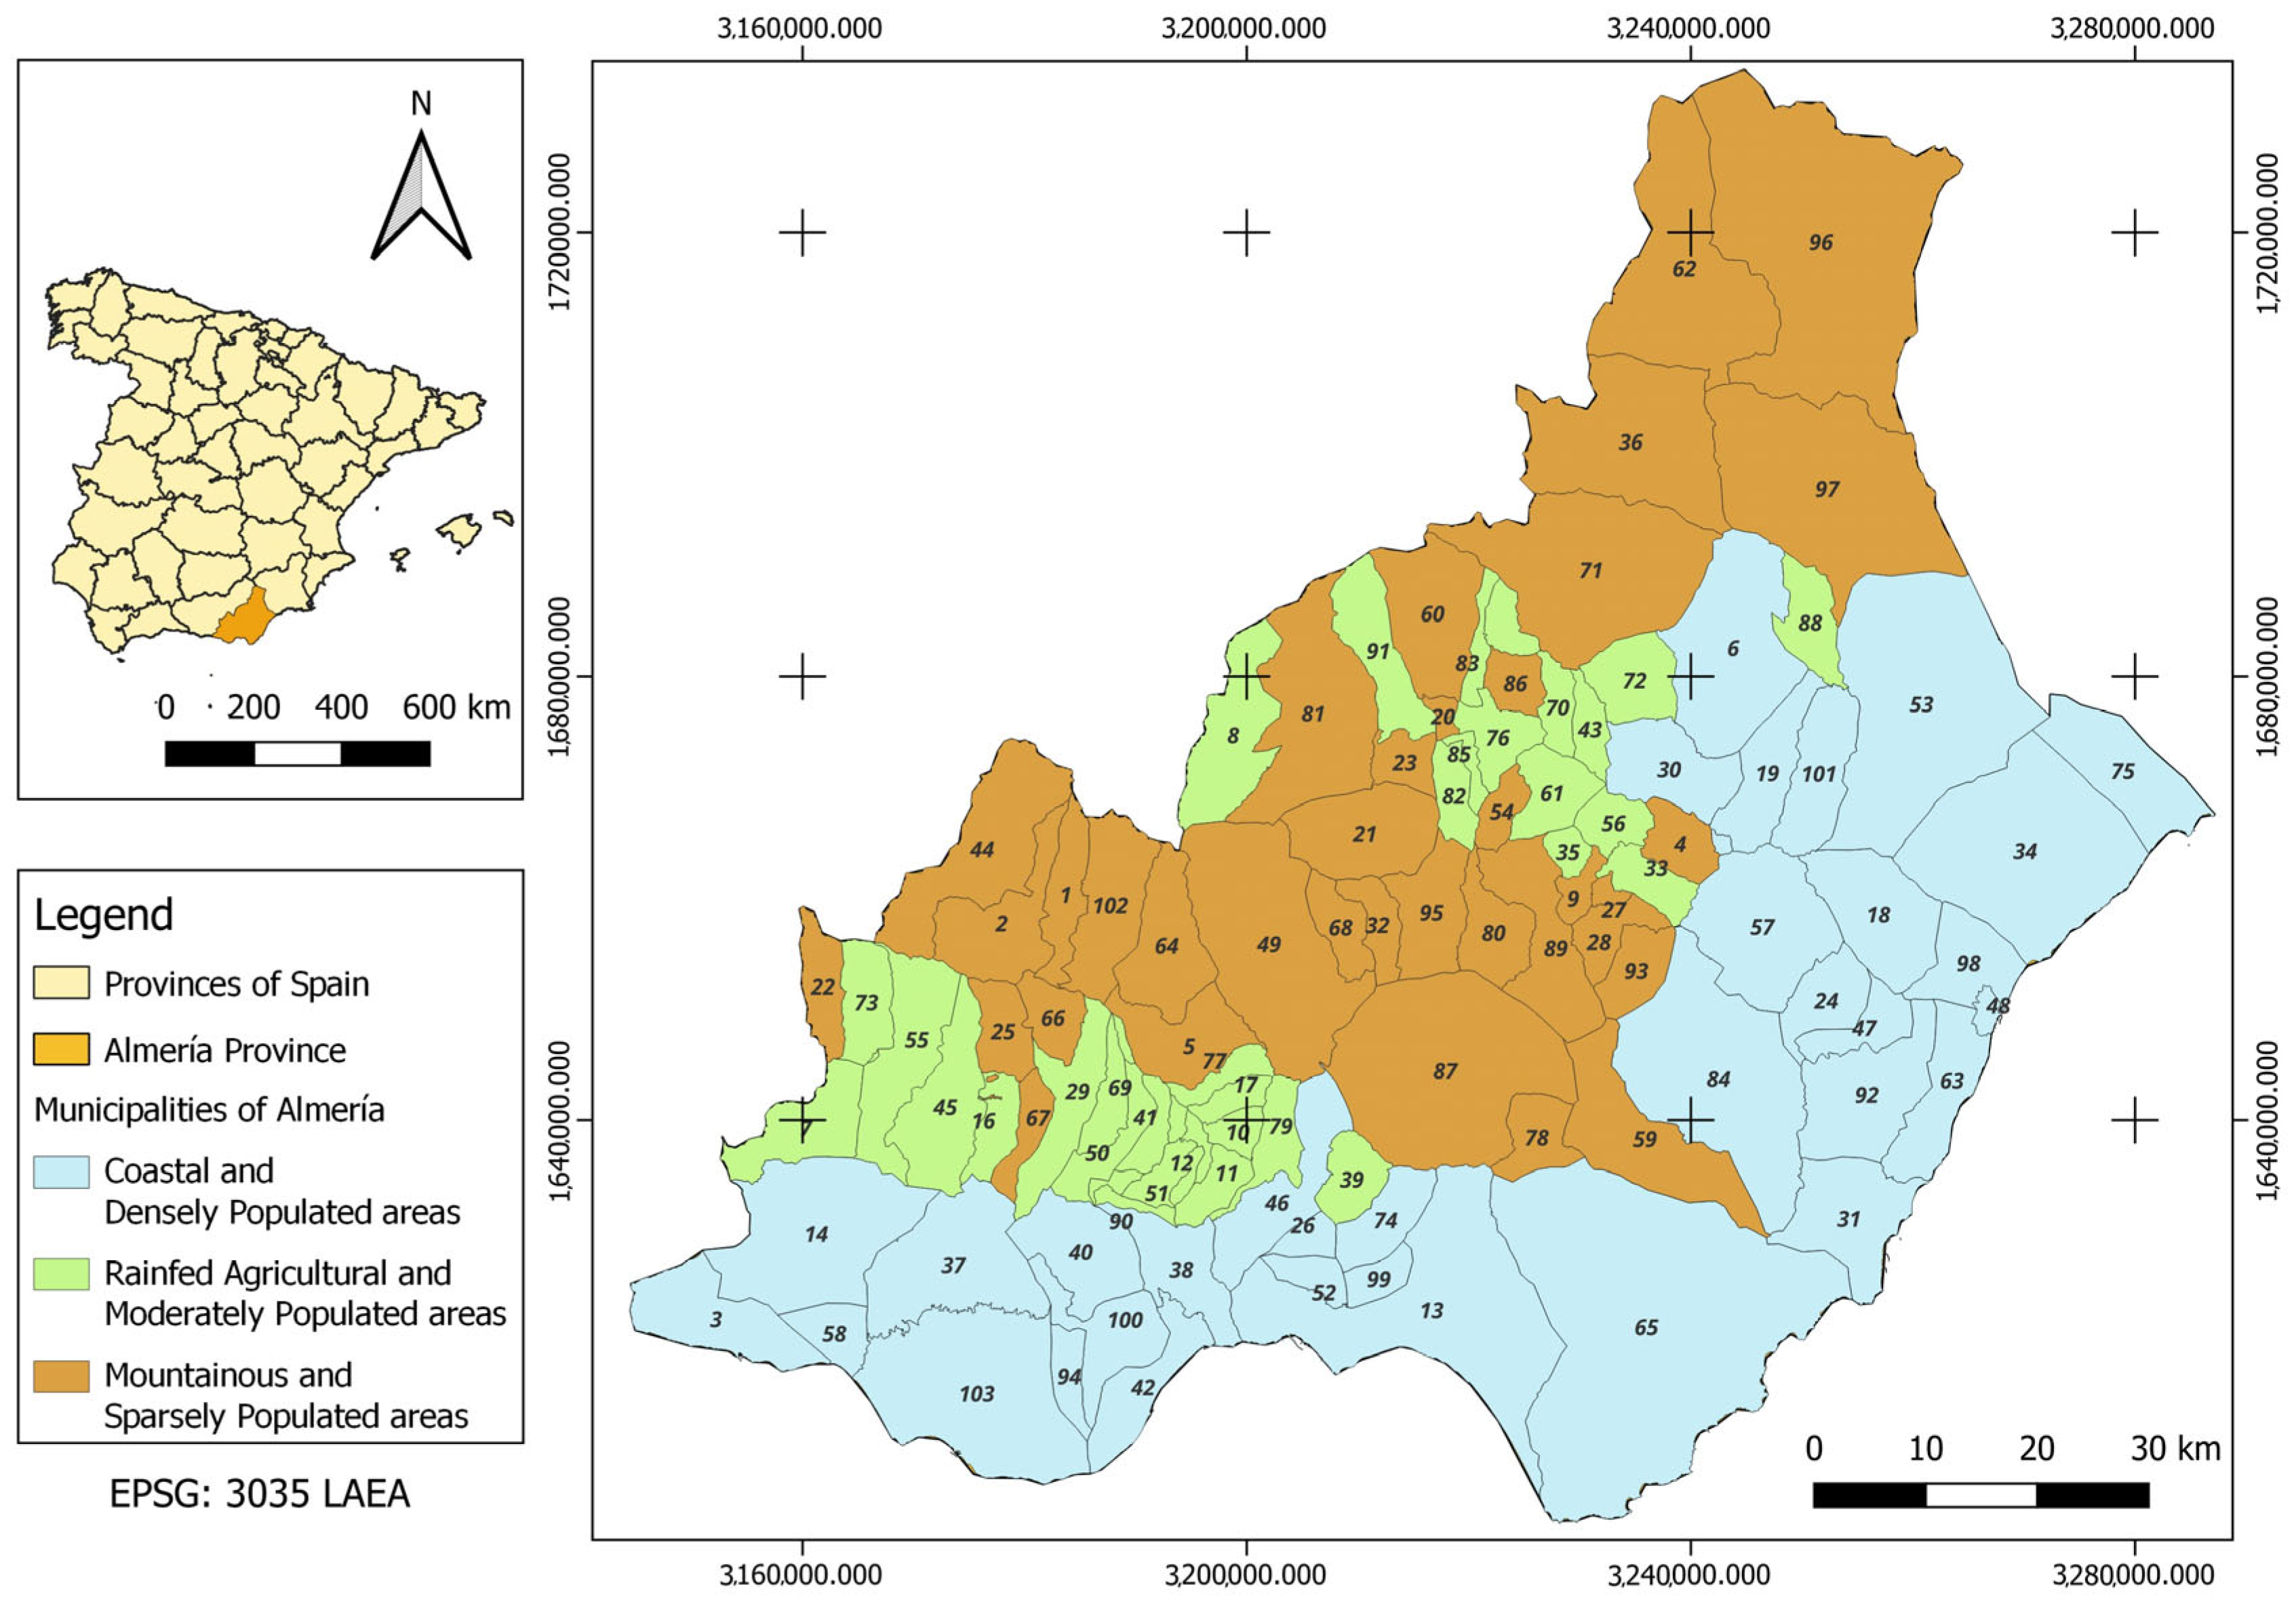
2.1. Study Area

The study area used for the risk assessment semi-quantitative methodology is the Province of Almería. It includes 103 municipalities and is located in southeastern Spain within the Andalucía region (Figure 1). It has a semi-arid Mediterranean climate, characterized by low rainfall and generally high temperatures. The region frequently experiences extreme droughts, and the absence of perennial rivers means that aquifer systems, together with desalination, serve as the primary water source for both irrigation and consumption. However, these aquifers are severely overexploited, with agricultural water extraction negatively affecting not only the quantity but also the quality of water [3,21,22]. This, in turn, aggravates desertification processes, reducing land productivity.
Despite these challenges, Almería’s dry climate and abundant sunshine throughout the year have created significant opportunities for agricultural production. Thanks to a combination of a subtropical climate and fertile soils, horticulture has become the province’s most important economic sector. The region’s greenhouses produce over three million tons of fruit and vegetables annually, much of which is exported to the rest of Europe. The agricultural sector has also played a key role in the region’s demographic and socioeconomic transformation. Over the past 50 years, Almería has evolved from being one of Spain’s poorest provinces to one of the wealthiest. The development of agriculture has driven continuous migration flows, particularly from Africa, as many migrants seek economic opportunities in the sector. However, this growth has come at a cost. The agricultural industry places immense pressure on water resources, threatens biodiversity, and has been subject to international scrutiny for its exploitation of migrant workers, who often live and work under poor conditions [3].
Tourism is the second-largest consumer of water in the province after agriculture. This sector has long been a key driver of the local economy, attracting both domestic and international visitors. With long beaches and year-round sunshine, the region is a popular winter sun destination. However, tourism in the area is highly seasonal, peaking during the summer months when warm temperatures also drive high water demand. Managing this challenge is essential to ensuring the industry’s sustainability throughout the year. In recent years, golf tourism has also gained popularity, leading to the development of numerous courses and resorts that further increase water consumption. This not only adds to the already high year-round demand but also causes spikes in energy and water usage during the summer, precisely when natural replenishment through rainfall is minimal or nonexistent [23].

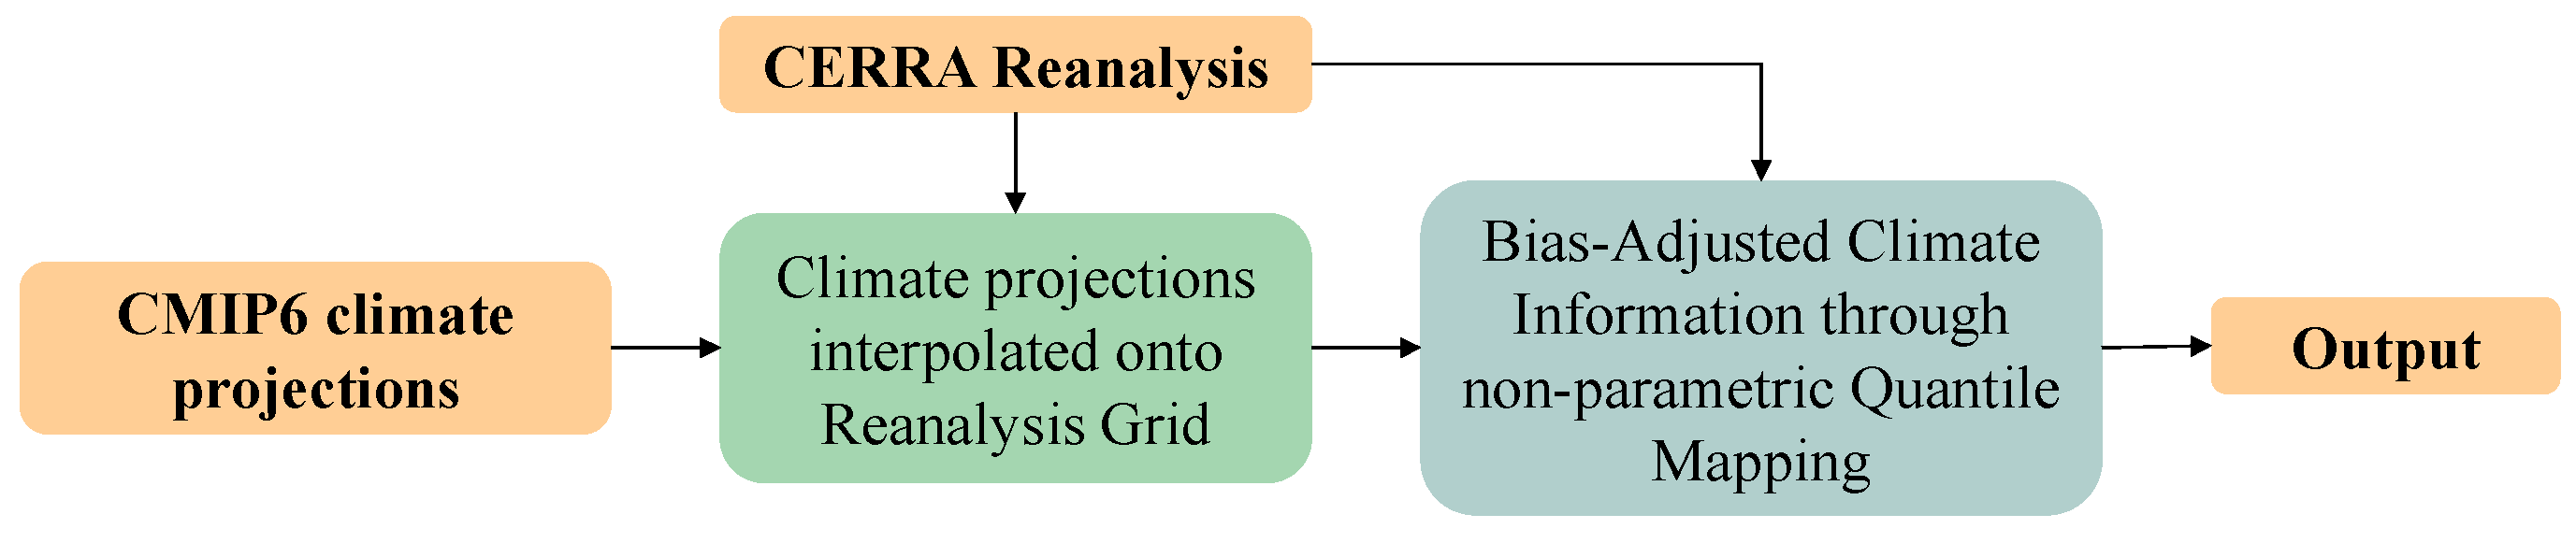
2.2. High-Resolution Datasets Under Different Scenarios of Climate Change

To obtain high-resolution climate datasets for Almeria, information from Global Climate Models (GCMs) was statistically downscaled at a finer spatial resolution (5.5 km) using a non-parametric Empirical Quantile Mapping (EQM) method [24]. Eight CMIP6 models (ACCESS-CM2, CESM2, CNRM-ESM2-1, EC-Earth3-Veg-LR, HadGEM3-GC31-LL, IPSL-CM6A-LR, MIROC6 and NorESM2-MM), defined in [25], have been used to generate downscaled climate information for specific Essential Climate Variables (ECVs) (mean, maximum and minimum daily temperature, daily accumulated precipitation and mean daily wind speed) in Almeria province as the case study area, selecting three different climate scenarios (SSP1-2.6, SSP2-4.5 and SSP5-8.5). These climate data are requested as the basis for hazard characterization and quantification. The EQM method was used to retrieve point-by-point statistical relationships between interpolated climate projections (GCM to CERRA climate reanalysis [26]) and reference time series (CERRA climate reanalysis) during training, and to apply these relationships in the prediction mode (downscaled GCMs). EQM is a method that trains transfer functions over a control period, mapping all the quantiles from the model output’s empirical Cumulative Distribution Function (CDF) onto the corresponding reference distribution [24,27,28]. Figure 2 shows the statistical downscaling workflow implemented to obtain high-resolution ECVs. The adoption of a non-parametric approach for the EQM adds flexibility to the method, avoiding the selection of specific statistical functions to fit the empirical CDFs. This flexibility shows that the method could be used for any climate variable, regardless of the statistical function that best represents it.

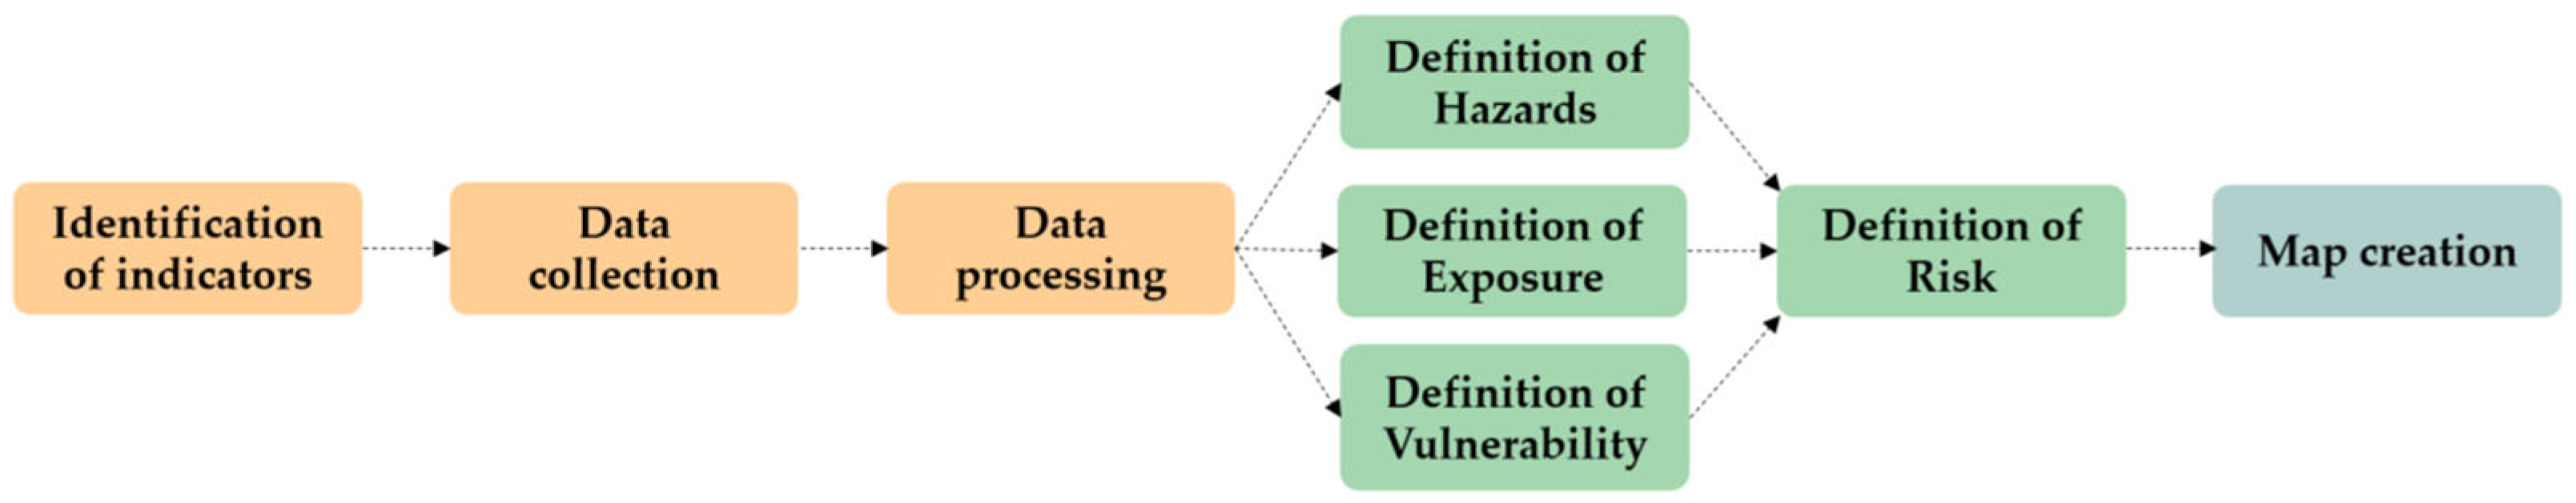
2.3. Semi-Quantitative Risk Methodology

The risk assessment method employed in this paper follows a semi-qualitative approach that implements quantitative indicators to derive qualitative values for Hazard, Exposure, Vulnerability (combining Sensitivity and Adaptive Capacity) and Risk. This indicator-based approach is among the most widely used risk assessment and mapping methods, alongside quantitative risk assessment, event tree analysis, and the risk matrix approach [29]. It is particularly applied when quantitative risk analysis is unfeasible due to data limitations that compromise the quantification of components such as hazard frequency, intensity, and physical vulnerability. Furthermore, the indicator-based approach enables the inclusion of social and environmental vulnerability and facilitates comparisons between different areas or communities, which can be challenging in quantitative methods. The approach used in this study is inspired by [20], which defines an indicator-based approach procedure for ecosystem-based adaptation measures.
The steps followed for the risk assessment in this study are displayed in Figure 3 and further described in the next subsections.

2.4. Selection of Indicators for the Risk Components and Data Collection

The initial step of the quantification process involves identifying the indicators of hazard, exposure, sensitivity and adaptive capacity. These indicators were collected from a literature review [10,30,31], previous studies in the province and region [32] and have been adapted based on Almería’s climate and geographical conditions. An additional criterion for indicator selection was the availability of data at the municipality level, which was crucial for risk characterization. Finally, complementary indicators were defined by the authors to fit the specific characteristics of the study area, ensuring the representation of its key sectors such as agriculture, energy, industry, forest and biodiversity, tourism, society, transport, urban and water management. After the identification of the indicators, these were assigned to each risk component and sector. An indicator could be included in more than one sector. The list of indicators with their descriptions and units is displayed in Table A2 of Appendix A.2.
After defining a set of indicators for exposure, sensitivity, and adaptive capacity, their values were extracted from regional, national, and European databases for each municipality in the case study area. Data are provided in Excel files (alphanumeric values) or spatial layers (vector or raster) and processed using spreadsheets and geographic information systems such as QGIS version 3.40.8 (with techniques such as raster statistics analysis, spatial joins or interpolation analysis) to obtain indicator values for each municipality. The results are integrated and stored in the municipality database using an identifier per municipality to ensure that all data have a spatial correspondence.
The hazard characterization involves not only describing the hazard indicator, but also establishing thresholds derived from the literature for each indicator. These thresholds (e.g., temperatures exceeding 25 °C), along with climate variables (e.g., temperature), are gathered for the historical period and various climate change scenarios (SSP1-2.6, SSP2-4.5, SSP5-8.5), and are used to determine hazard exceedance/occurrence probabilities (e.g., the likelihood of hot days). The most significant hazards selected for the risk assessment of Almería province are heatwaves, droughts, and storms. These hazards are aligned with the region’s climate challenges and territorial constraints, particularly the absence of perennial rivers. Table 1 presents the thresholds and definitions used for the characterization of the hazards affecting the study area.

2.5. Data Processing

As outlined in the previous section, hazard exceedance/occurrence probabilities are calculated by applying thresholds to relevant variables and determining the probability values for each hazard across the historical period and future scenarios within the study area. The project considers three scenarios, each further divided into three future time periods: 2015–2040, 2041–2070, and 2071–2100.
The collected values for exposure, sensitivity, adaptive capacity, and hazard probabilities are normalized by assigning each indicator and municipality a value of 1, 2, or 3. These values are determined based on the 25th and 75th percentiles of all municipal data, where 3 represents the highest risk and 1 the lowest for hazard, exposure, and sensitivity indicators. For instance, if the percentage of protected area exceeds the 75th percentile, a value of 3 is assigned, as a larger protected area increases risk. On the other hand, for adaptive capacity, a value of 3 indicates the highest ability to cope with the effects of climate change. For example, if the available water supply surpasses the 75th percentile, a value of 3 is assigned, reflecting an improved level of adaptive capacity. The use of percentiles is a common technique to assign a range discretization in risk quantification [33,34]. The decision on the selection of 25th and 75th percentiles is based on statistical robustness, resistance to outliers, and consistency with widely accepted methodologies in vulnerability and risk assessment [35,36,37]. Taking this into account, the selected percentiles allow for a balanced, interpretable, and stable segmentation of the risk variables. Although incorporating additional risk categories or using a more granular scale could increase analytical precision, this would also complicate interpretation, especially for non-expert audiences. Given that one of the goals of this assessment is to inform local decision-makers and foster public understanding, we prioritized a more accessible classification system. This trade-off ensures that the results remain actionable and easily communicable without requiring specialized technical knowledge.
Following the normalization step, the indicators for exposure, sensitivity, and adaptive capacity are integrated within each sector to derive a single value for each municipality. This process involves calculating the arithmetic mean (μ), standard deviation (σ), and coefficient of variation (σ/μ) for all indicators within the same sector. The final single value (N) is then determined for each sector (i) and municipality.
N i , m = μ i , m σ i , m μ i , m
Moreover, an arithmetic mean of the normalized values is calculated to combine the values of all the sectors in a single general indicator. The complete normalization process was implemented using Python-based statistical routines (version 3.12).

2.6. Exposure and Vulnerability Quantification

Exposure is defined by the assets impacted by climate change. The individual values for the exposure indicator, which were calculated in the previous step, are normalized by categorizing them into three levels (1, 2, or 3) based on the 25th and 75th percentiles. This normalization process determines the final exposure indicators, which are then used to generate maps and assess risk. Vulnerability (V) is determined by combining the sensitivity (S) and adaptive capacity (A) for each sector (i) and municipality (m), as expressed in the following equation:
V i , m = S i , m A i , m
The calculated values are then normalized using percentiles, assigning a score of 1, 2, or 3 to each sector and municipality, where 3 indicates the highest level of vulnerability. These standardized values enable the visualization of vulnerability through geolocated maps for each sector.

2.7. Hazard Quantification

Hazards are assessed by comparing the probability of the exceedance and occurrence of an event during the historical period with its probability in future periods. This analysis is conducted for each selected timeframe using downscaled Essential Climate Variables at the case study level. The exceedance probability refers to the likelihood that a specific value will be exceeded within a predefined future period. It is calculated as follows:
P X > x = 1 F X ( x )
where P(X > x) is the likelihood that a variable X will exceed the threshold x. FX(x) is the cumulative distribution function (CDF) of the variable X. The CDF describes the probability distribution of a random variable and is defined as follows:
F X ( x ) = P X x
The equations presented before are used to determine the exceedance probability of Almería’s selected hazards. Hazard quantification was integrated into a Python-based processing algorithm, which utilizes the ensemble mean derived from the set of climate model simulations at the study area level along with the geographical boundaries used for hazard assessment. The algorithm uses the Cumulative Distribution Function (CDF) derived from the daily values to compute the exceedance probabilities using the Python-based statistical routines
Additionally, the interrelationships between hazards need to be explored. The temporal probability of the exceedance/occurrence of such coupled events occurring at the same time could be the same as that linked to the probability of the exceedance of the triggering mechanism. However, the type of dependency between events would have to be categorized to see if this statement would make sense.
To evaluate the probabilities, first it is relevant to consider if the hazard events have a dependent (direct relation between the hazard events) or independent (no direct relation between hazard events) relation.
If the relation is independent, as it is for heatwave and drought, the probabilities could be calculated as the product of the specific probabilities of each hazard.
The results include hazards exceeding probabilities at the study area scale and coupled probabilities under a multi-hazard approach. Additionally, geolocated and normalized hazard results are computed at the municipality level. These normalized hazard probabilities serve as the basis for risk assessment in both the historical period and future hazard scenarios.

2.8. Risk Quantification

The risk is obtained through the arithmetic mean of hazard probability (H), exposure (E) and vulnerability (V) for each sector (i), each hazard scenario (j) and for each municipality (m):
R i , j , m = ( H j , m + E i , m + V i , m ) 3
The risk indicators are then normalized with the 25th and 75th percentiles as it was described in the data processing section. The final risk values are used to create bar charts showing the percentage of municipalities with low, medium, and high-risk levels for the three territorial groups in Almería, by scenario and sector. The three groups are spatially represented in Figure 1 and are defined as follows:
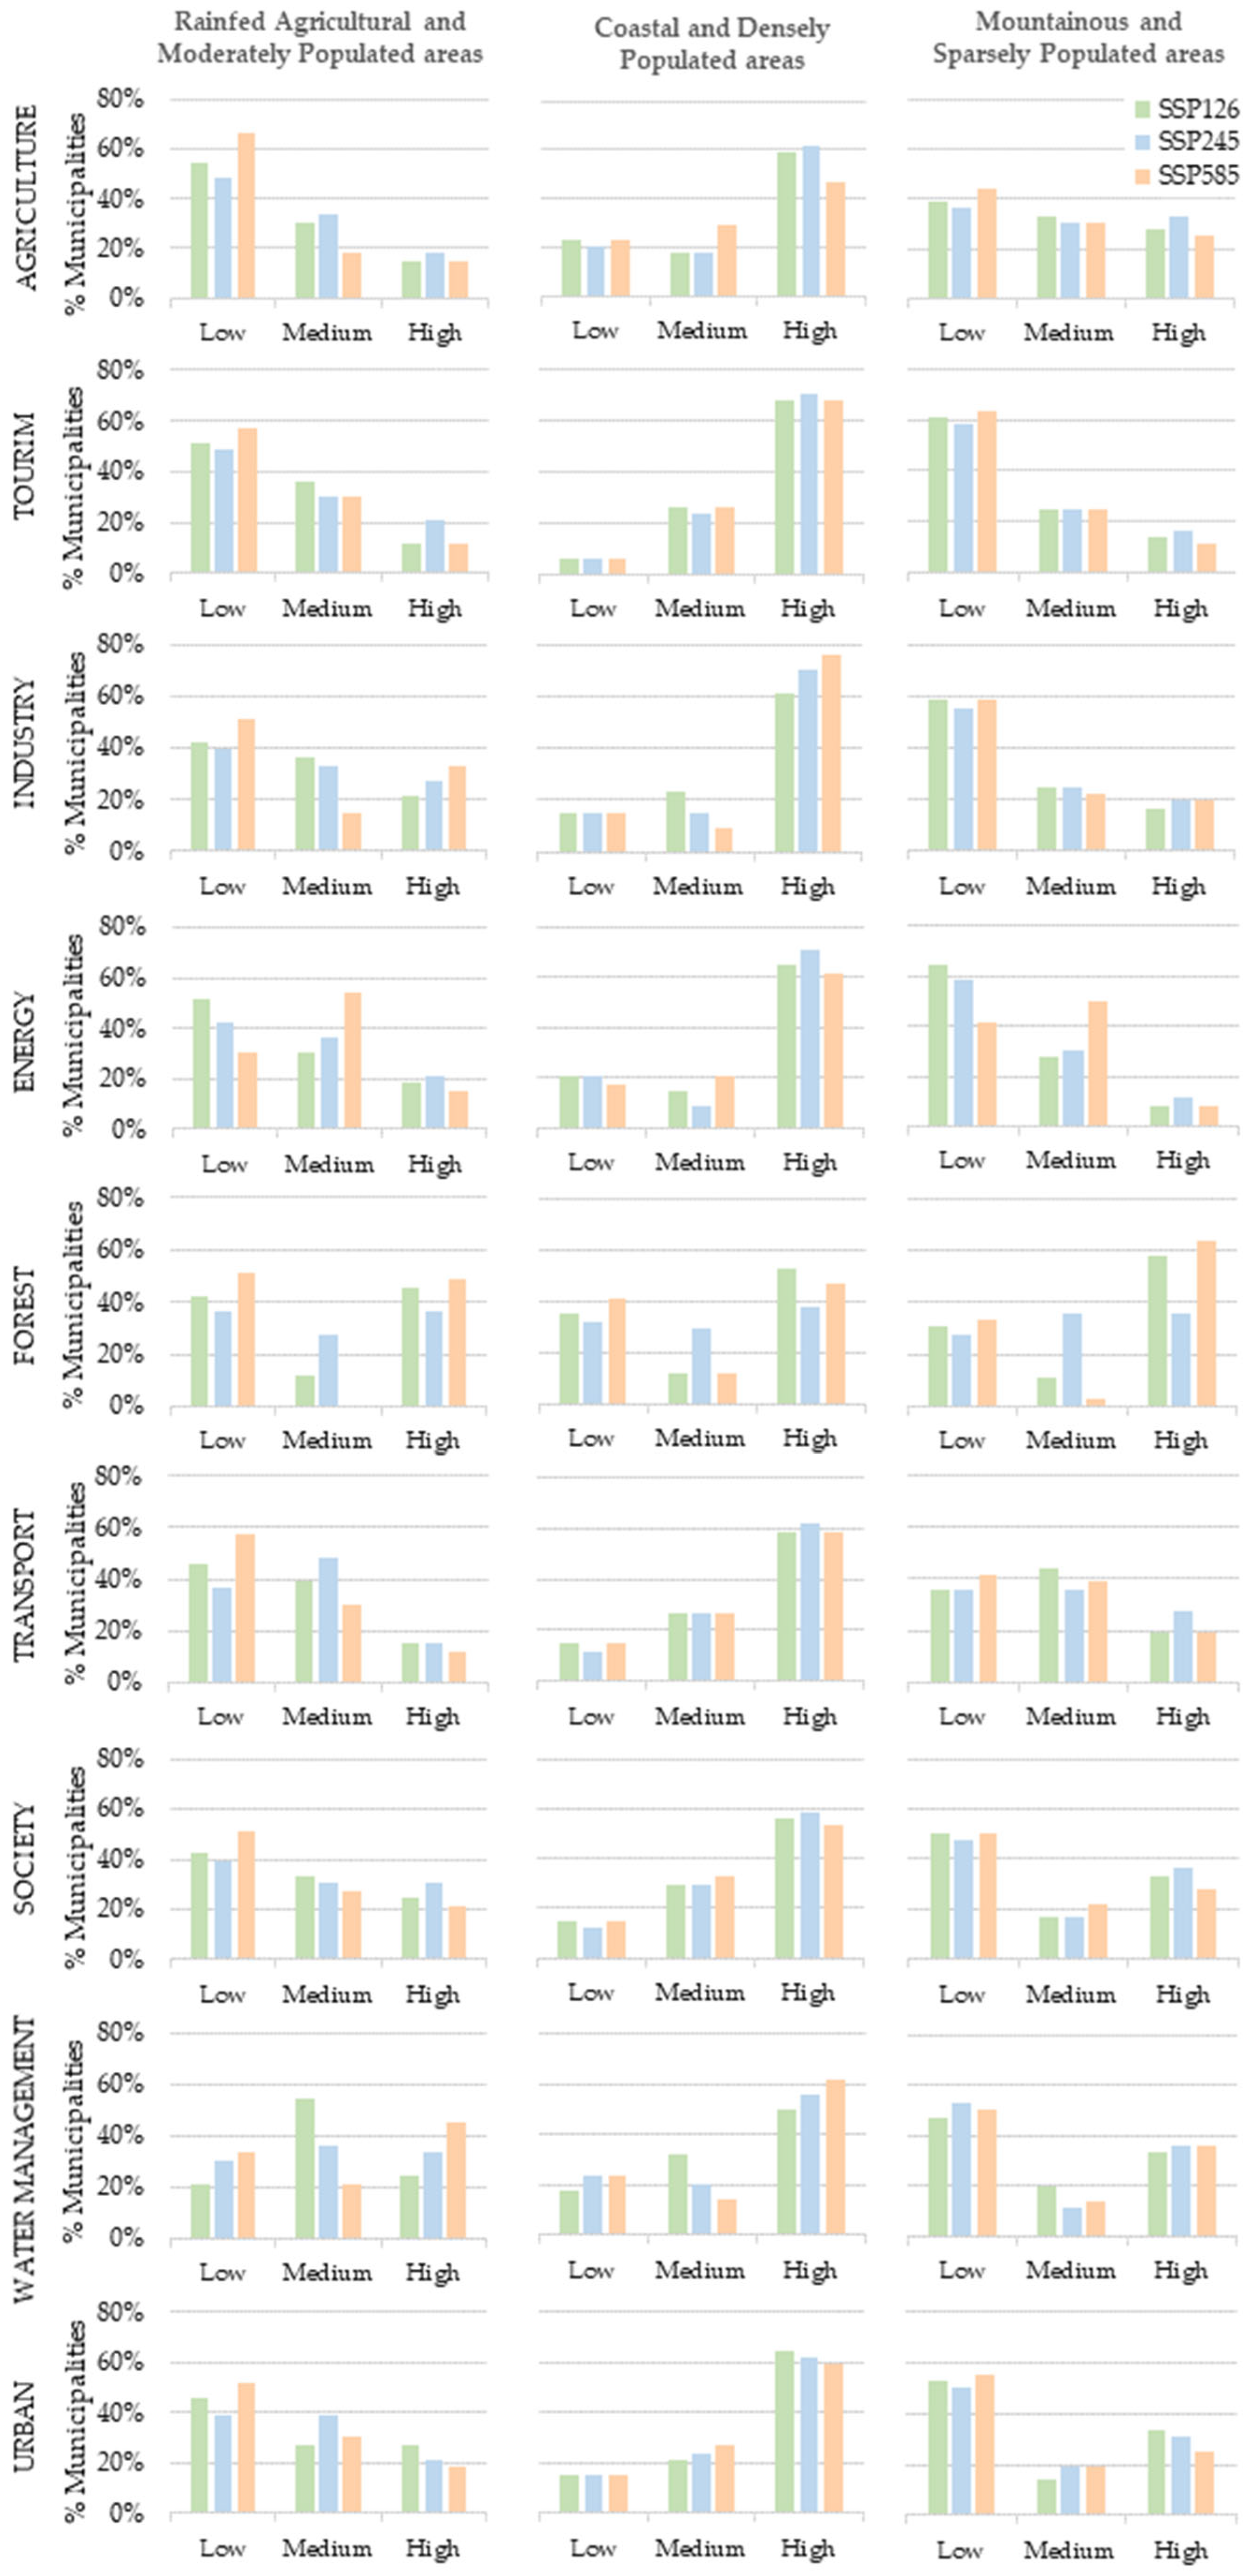
  • Coastal and Densely Populated areas include municipalities located along the coast and within highly urbanized, densely populated areas with significant economic activity.
  • Rainfed Agricultural and Moderately Populated areas comprise inland municipalities characterized by a moderate population density, agricultural land use, and transitional terrain between the coast and mountains.
  • Mountainous and Sparsely Populated areas consist of highland or mountainous areas with a low population density, limited infrastructure, and typically rural or natural land use.
The bar charts are constructed by averaging the risk values for the three future time periods (2015–2040, 2041–2070, and 2071–2100) under each scenario (SSP1-2.6, SSP2-4.5, and SSP5-8.5). For each territorial group and sector, the number of municipalities with low (score = 1), medium (score = 2), and high (score = 3) risk is counted. These counts are then converted into percentages by dividing them by the total number of municipalities in each territorial group: 34 in Coastal and Densely Populated areas, 33 in Rainfed Agricultural and Moderately Populated areas, and 36 in Mountainous and Sparsely Populated areas.
In addition to the bar charts, heatmaps are produced to provide a more detailed, municipality-level representation of risk across scenarios and time periods.

2.9. Geolocated Mapping of Exposure and Vulnerability

The individual normalized values of exposure and vulnerability for each sector are extracted and converted into CSV files. The exposure and vulnerability files are then loaded into QGIS version 3.40.8, joining the data with the boundaries of the municipality to provide a geolocated visualization of each specific variable.

3. Results

This section presents and describes the results obtained from applying the approach defined in the methodological section (Section 2). These results include:
  • High-resolution datasets under climate scenarios.
  • Hazard exceedance probabilities and coupled probabilities for each scenario.
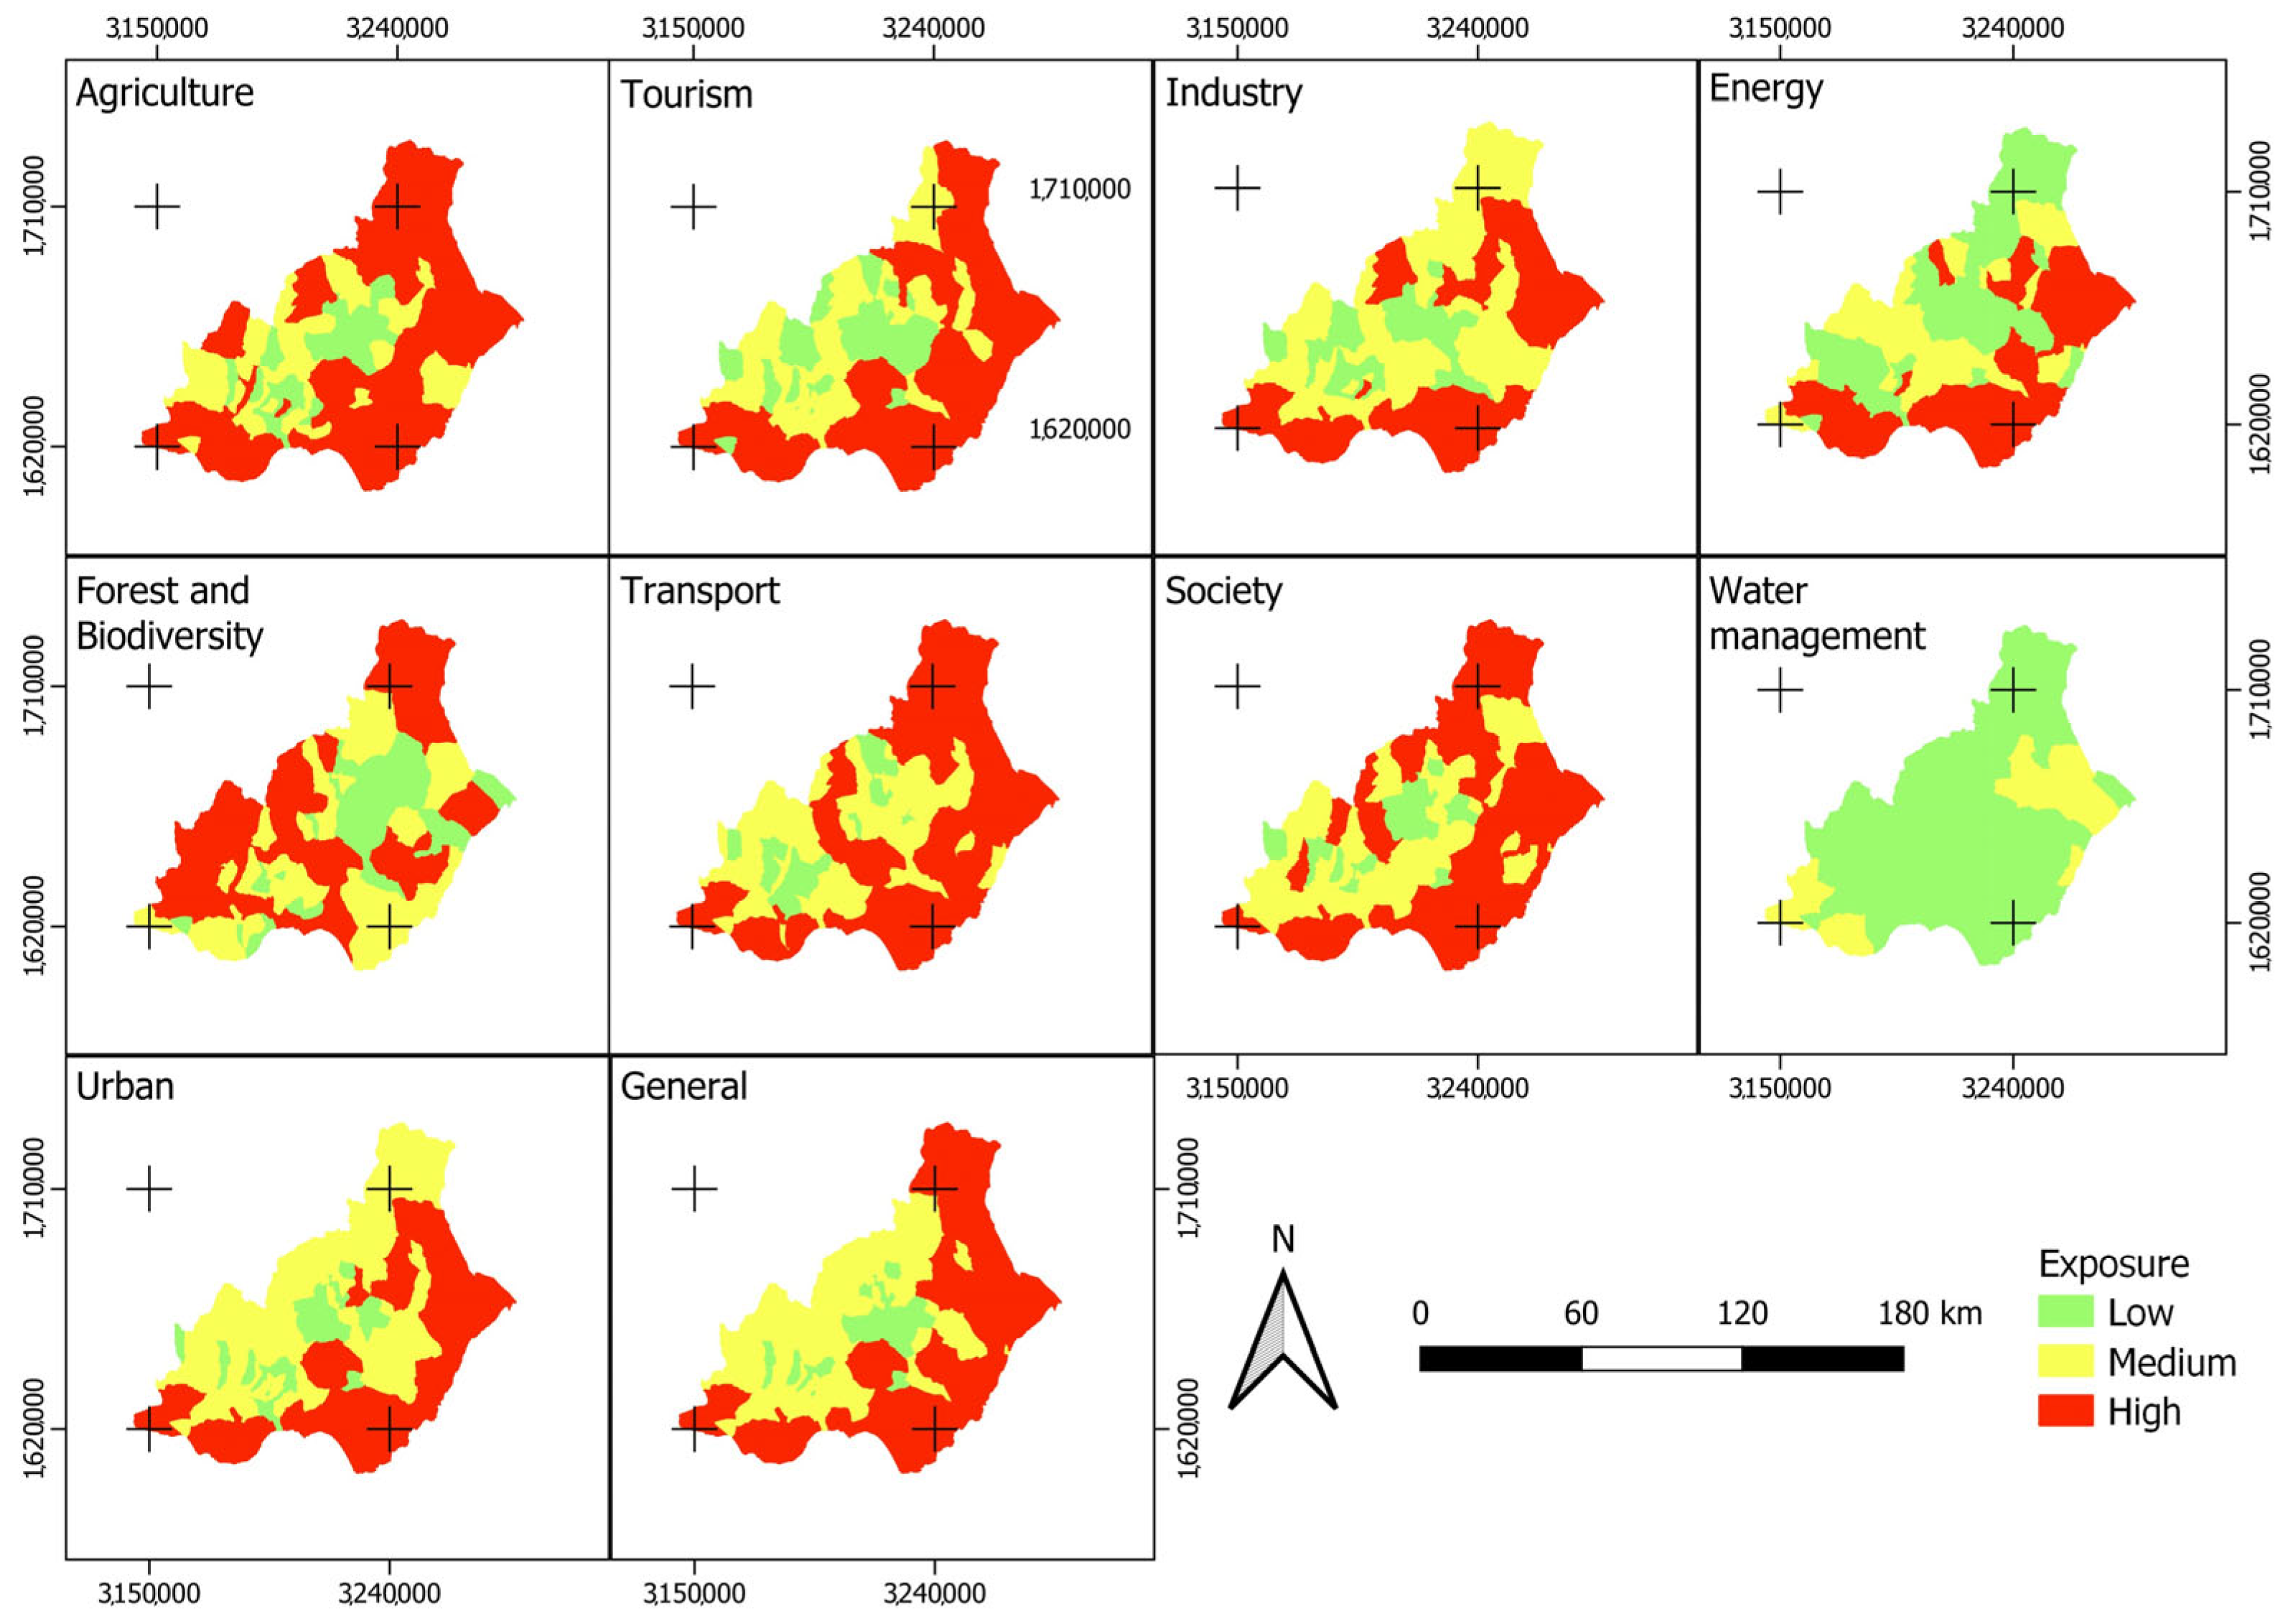
  • Exposure maps for each sector.
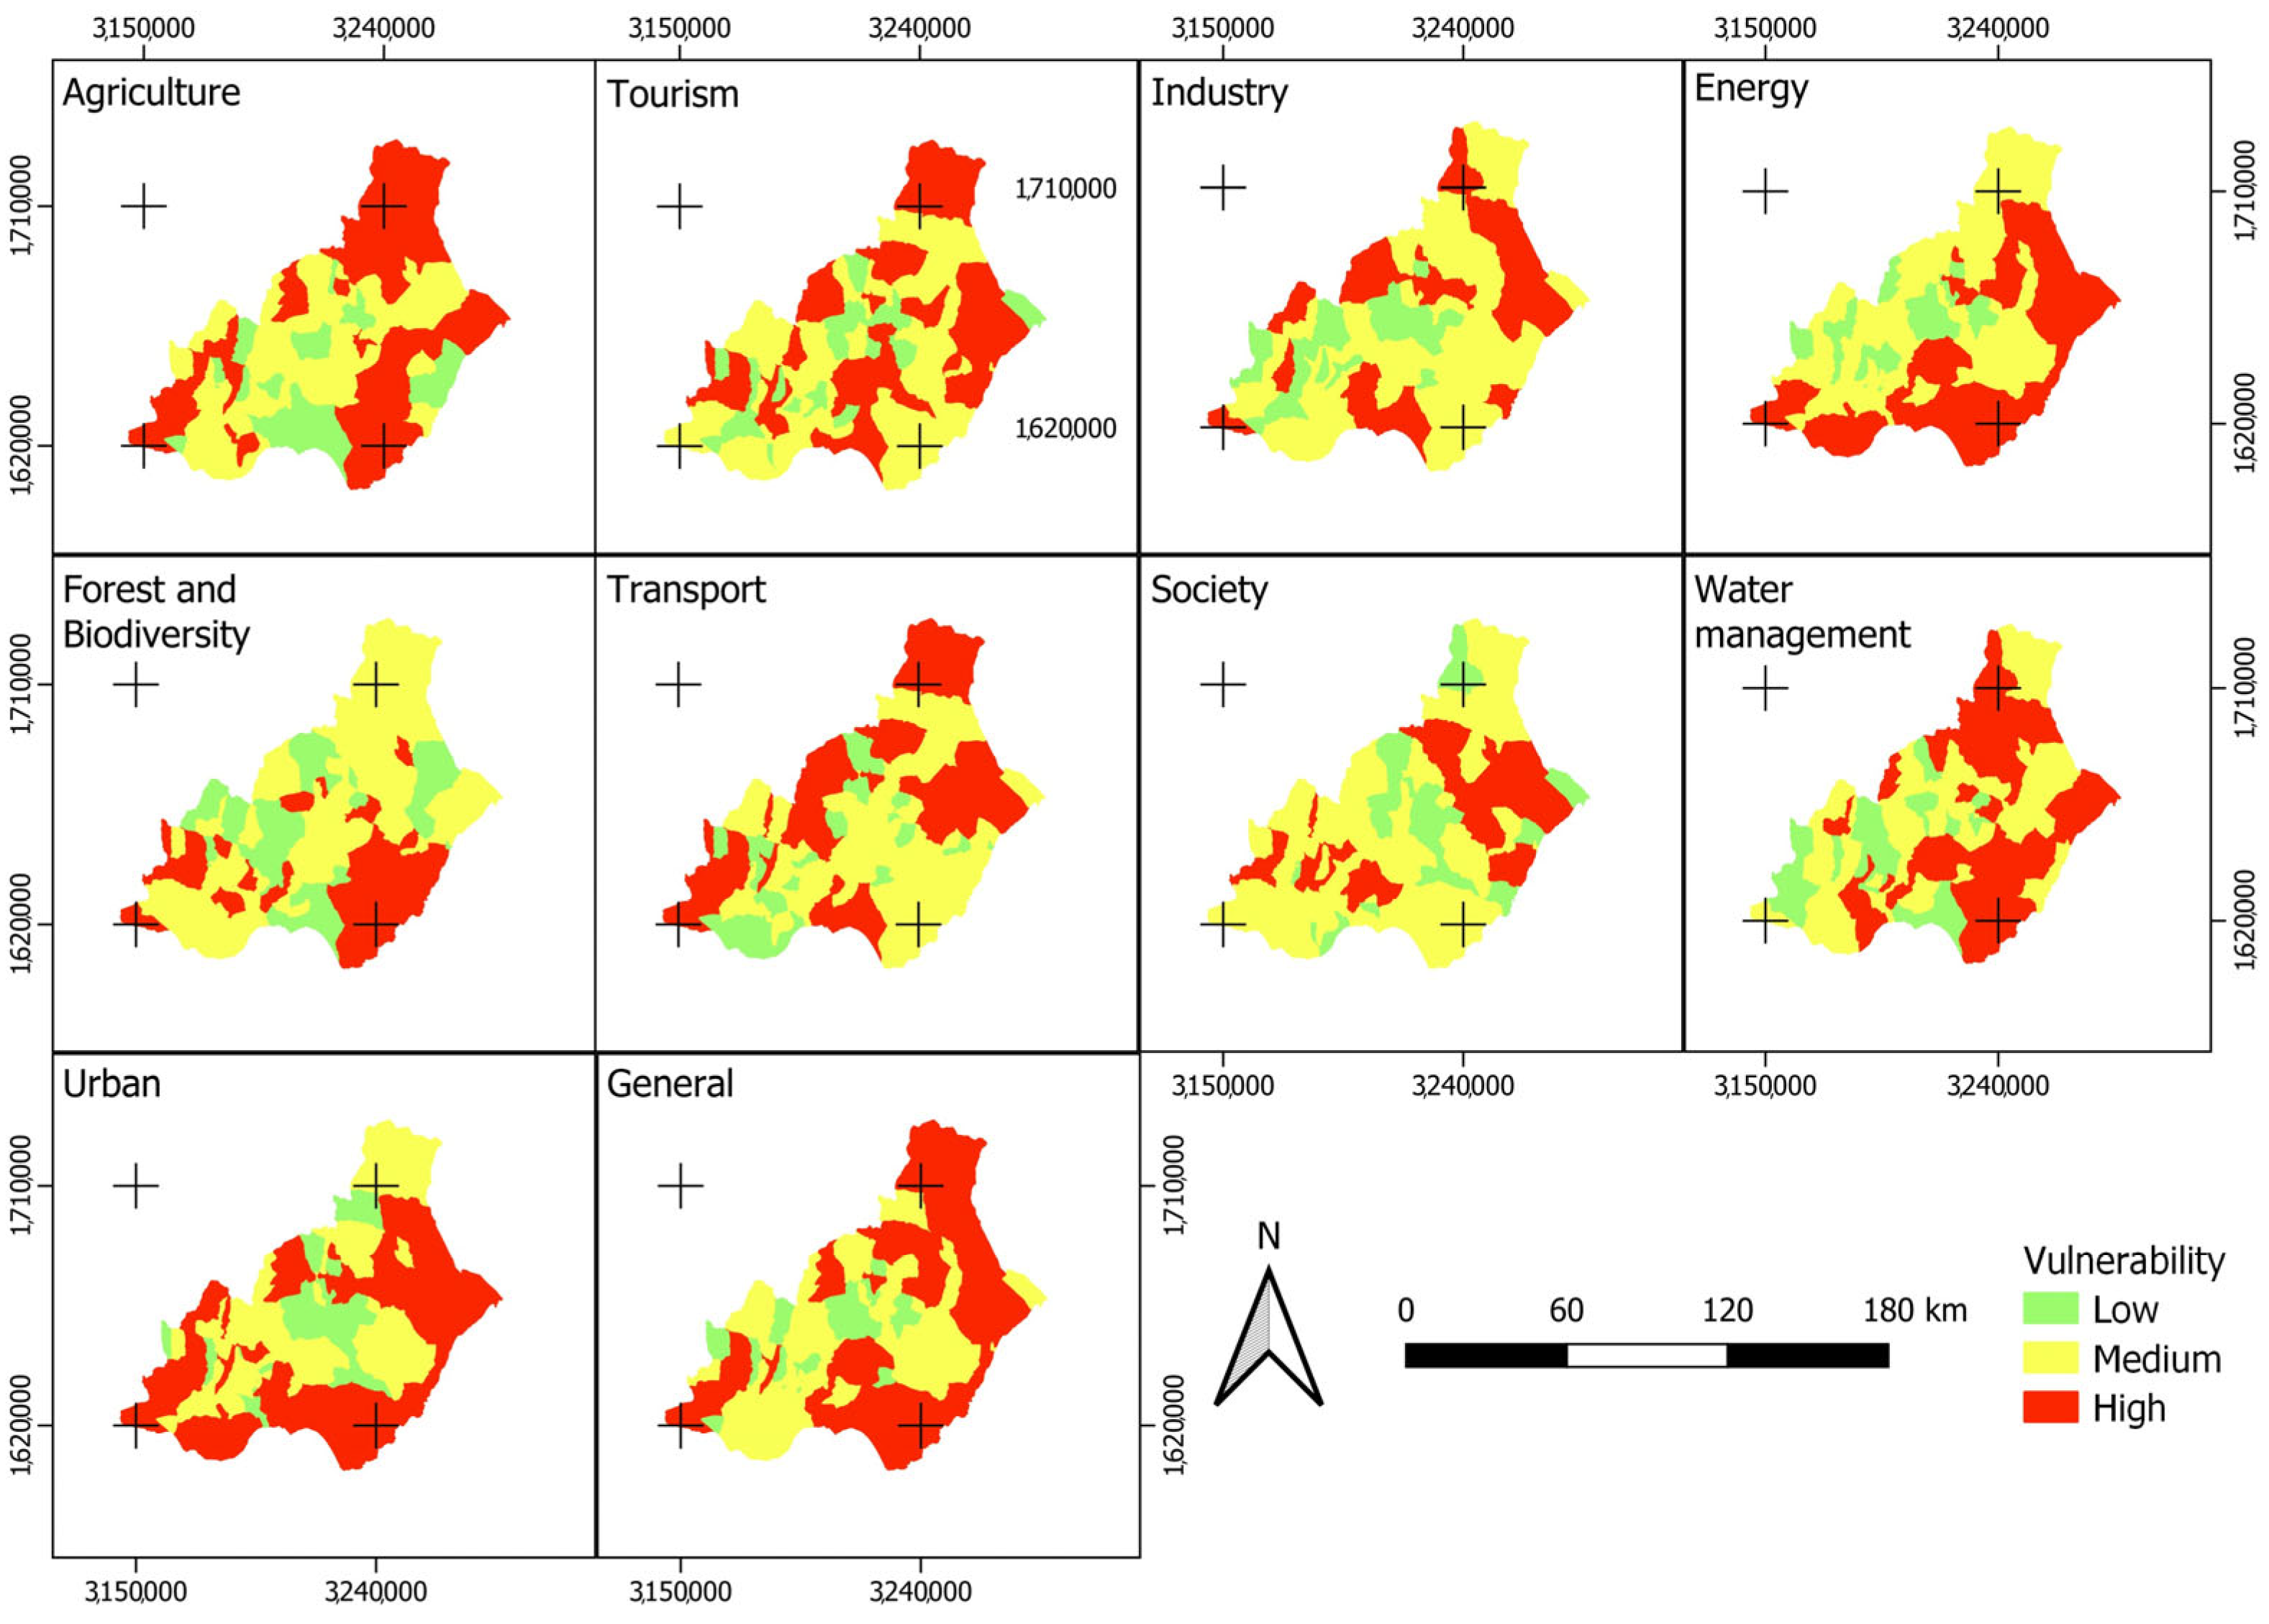
  • Vulnerability maps for each sector.
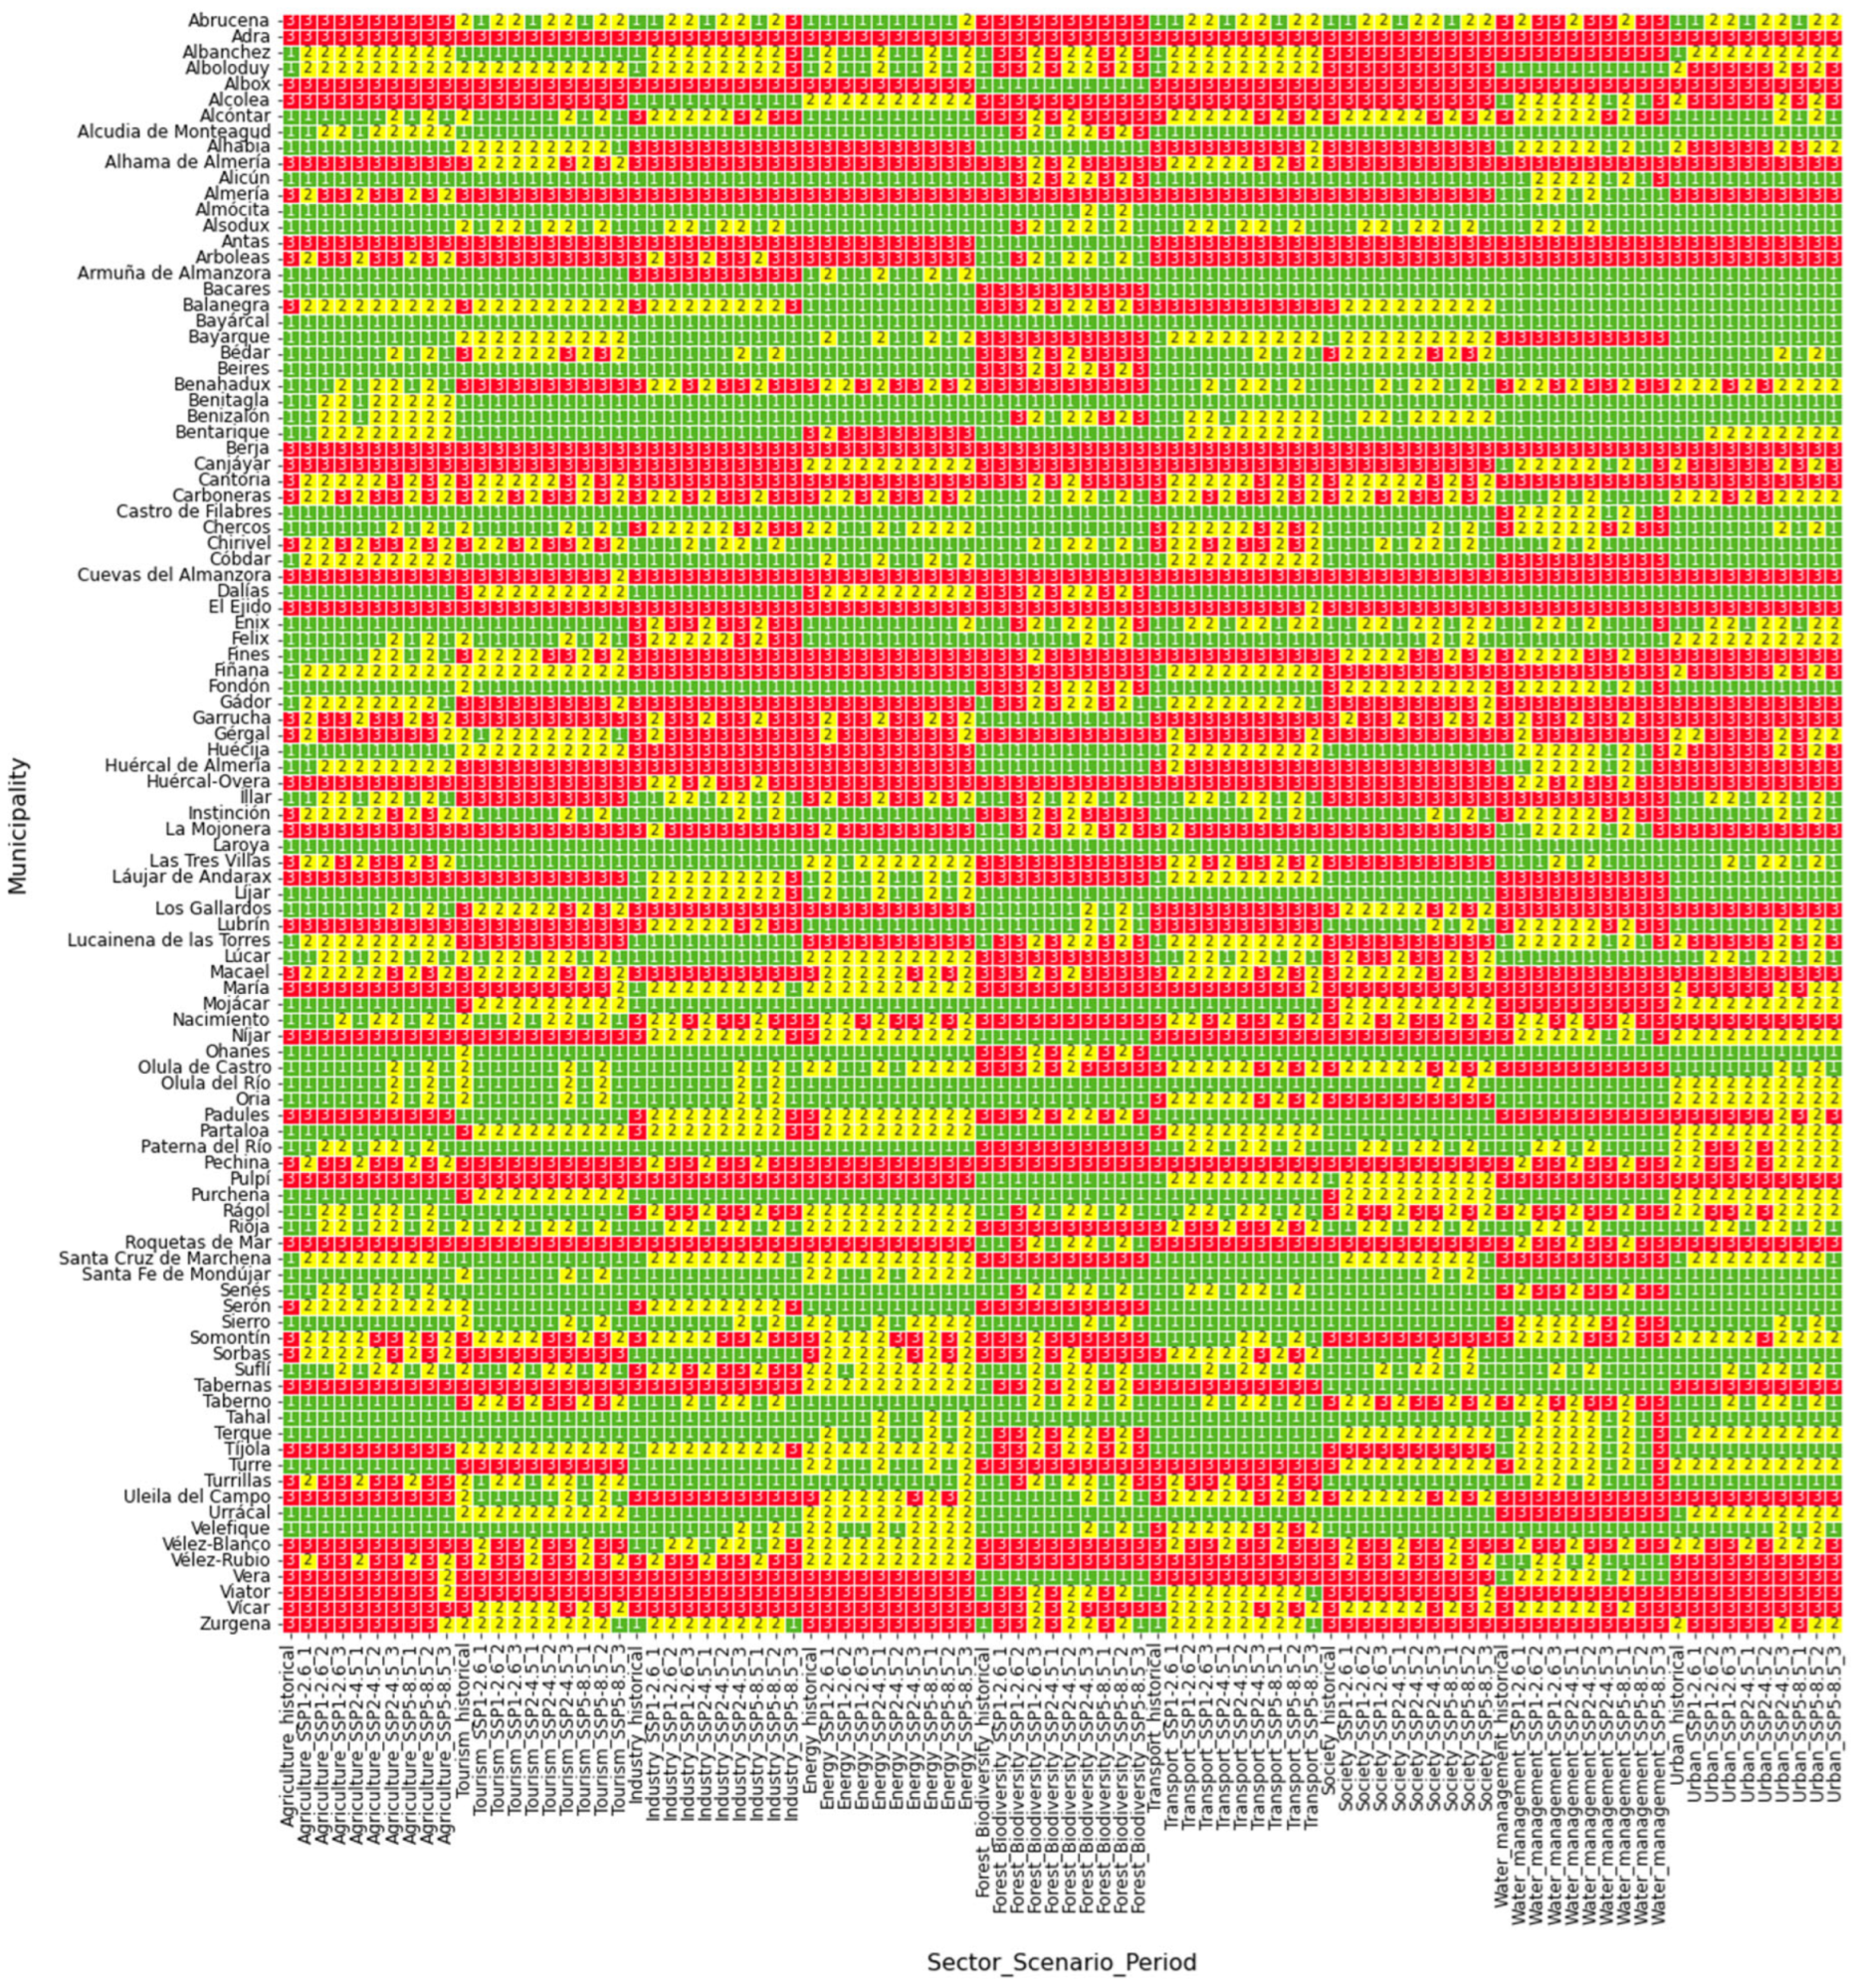
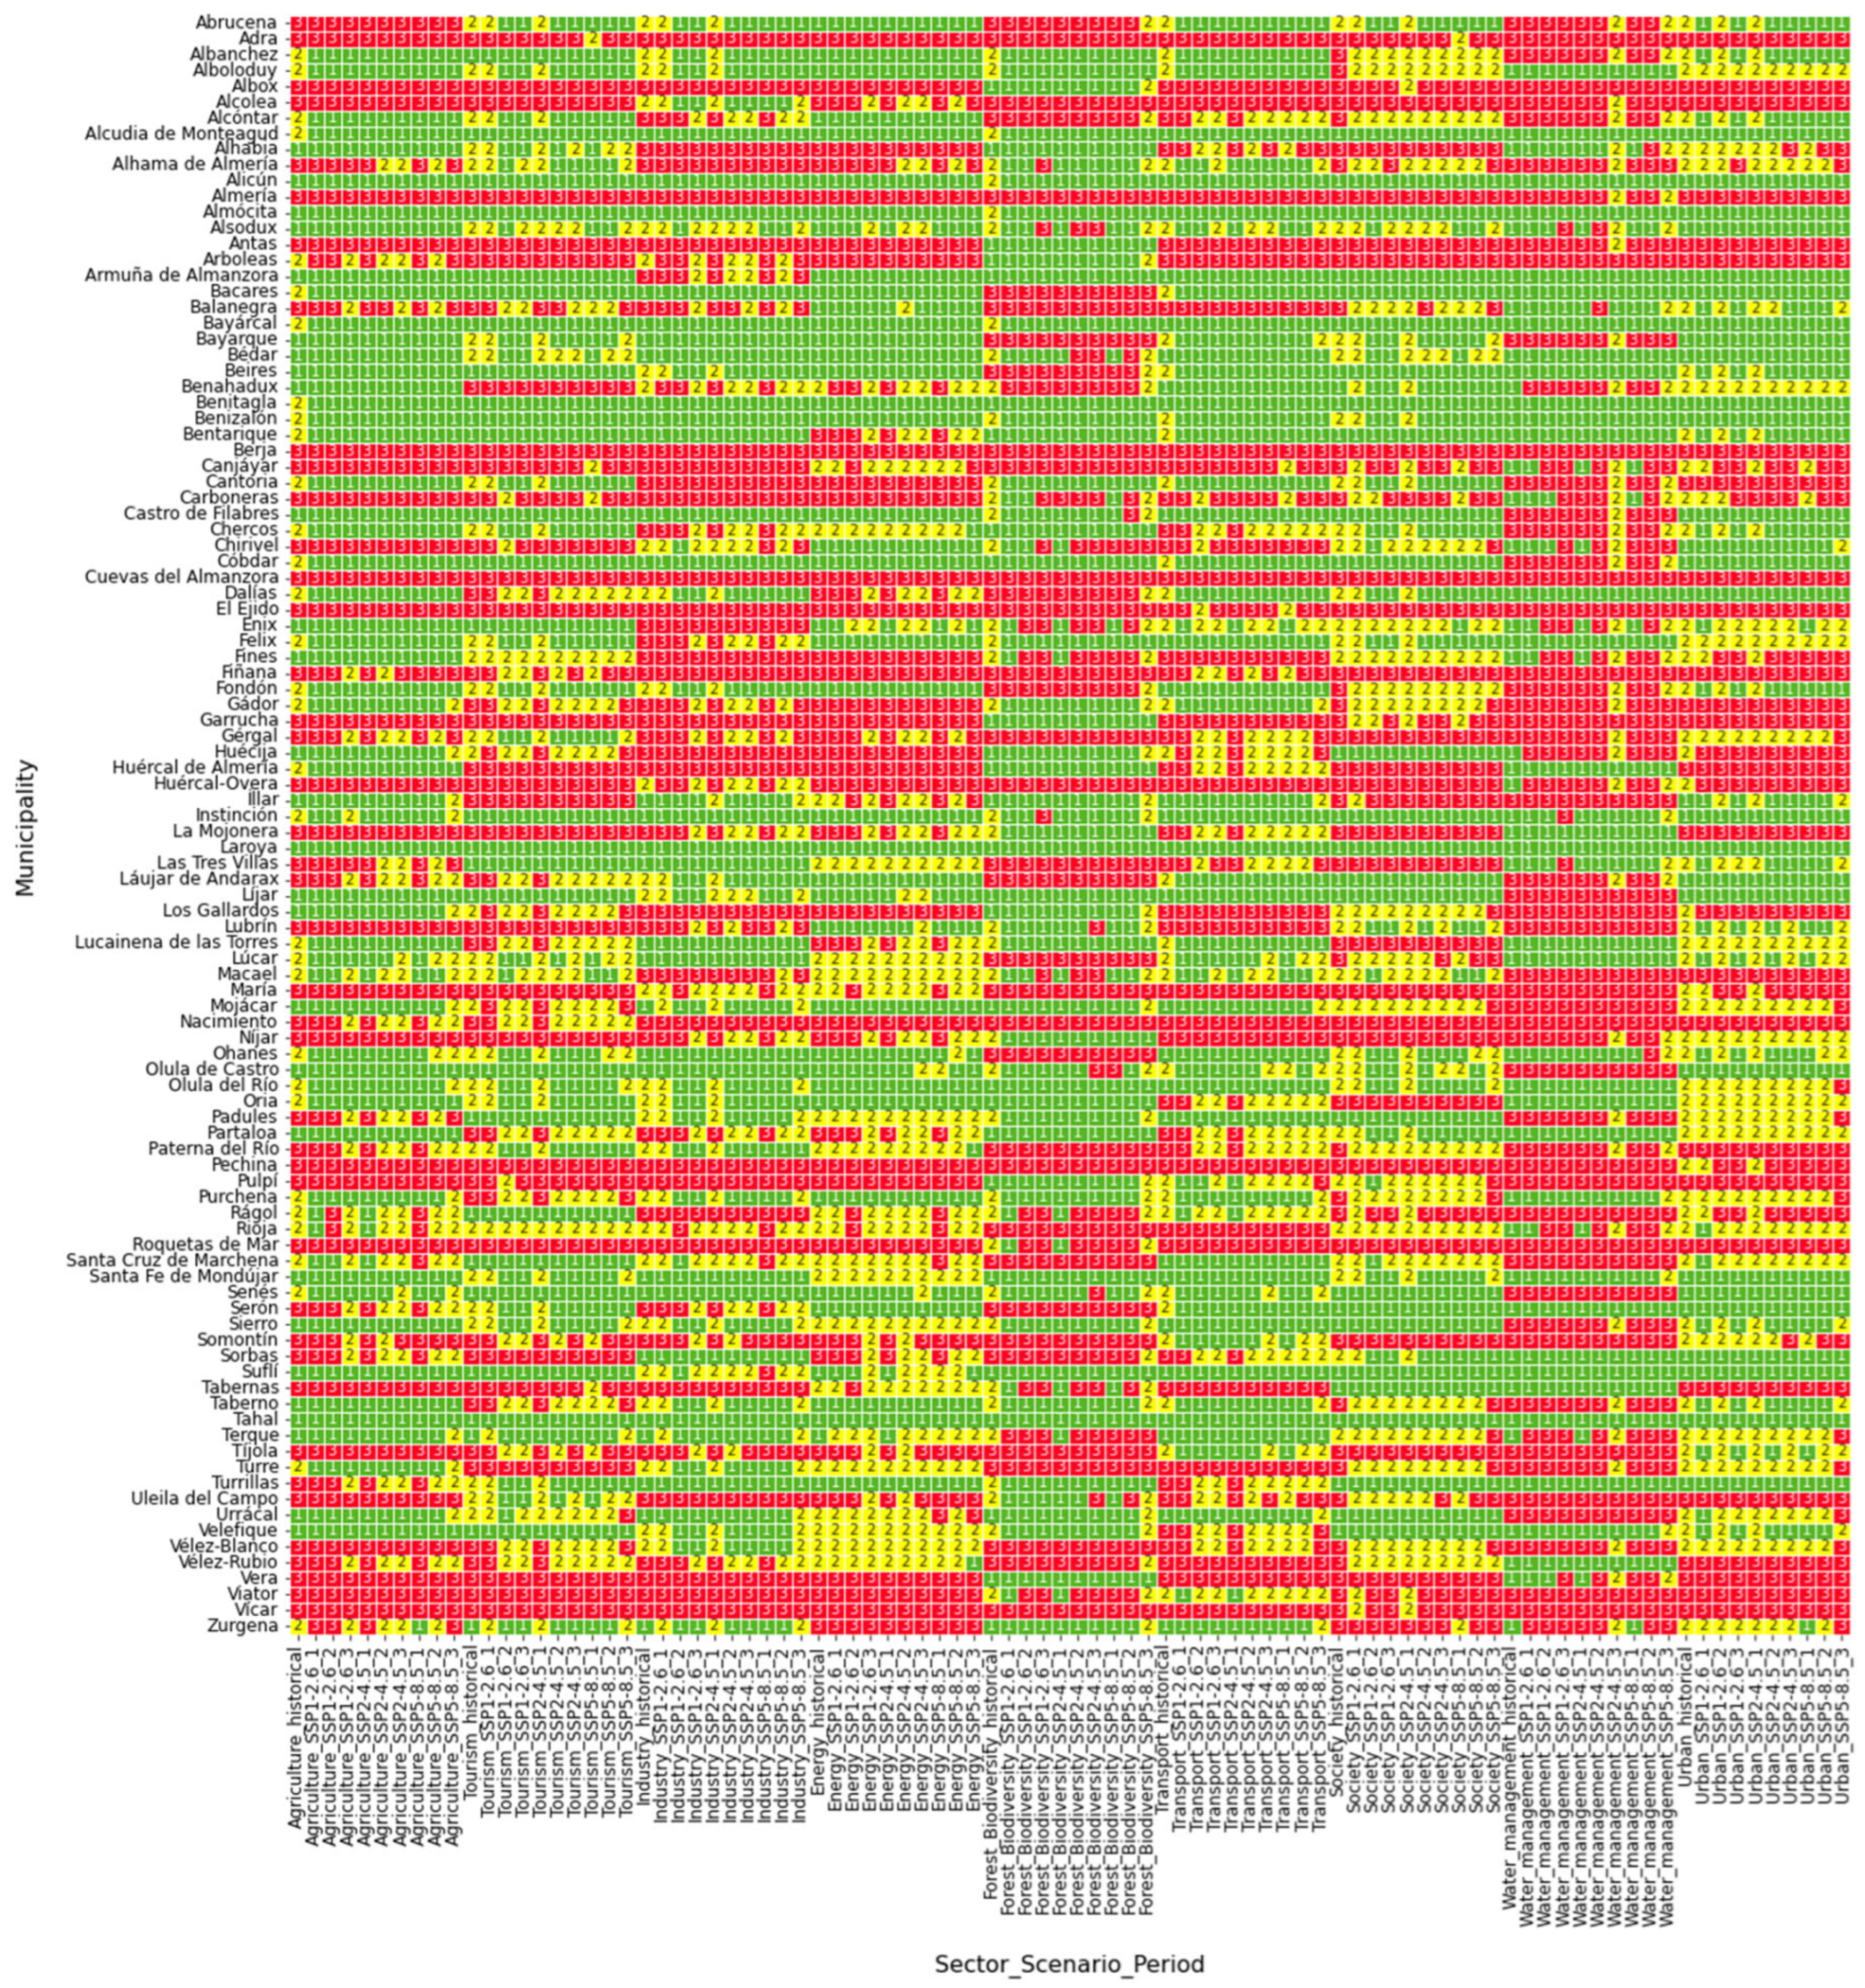
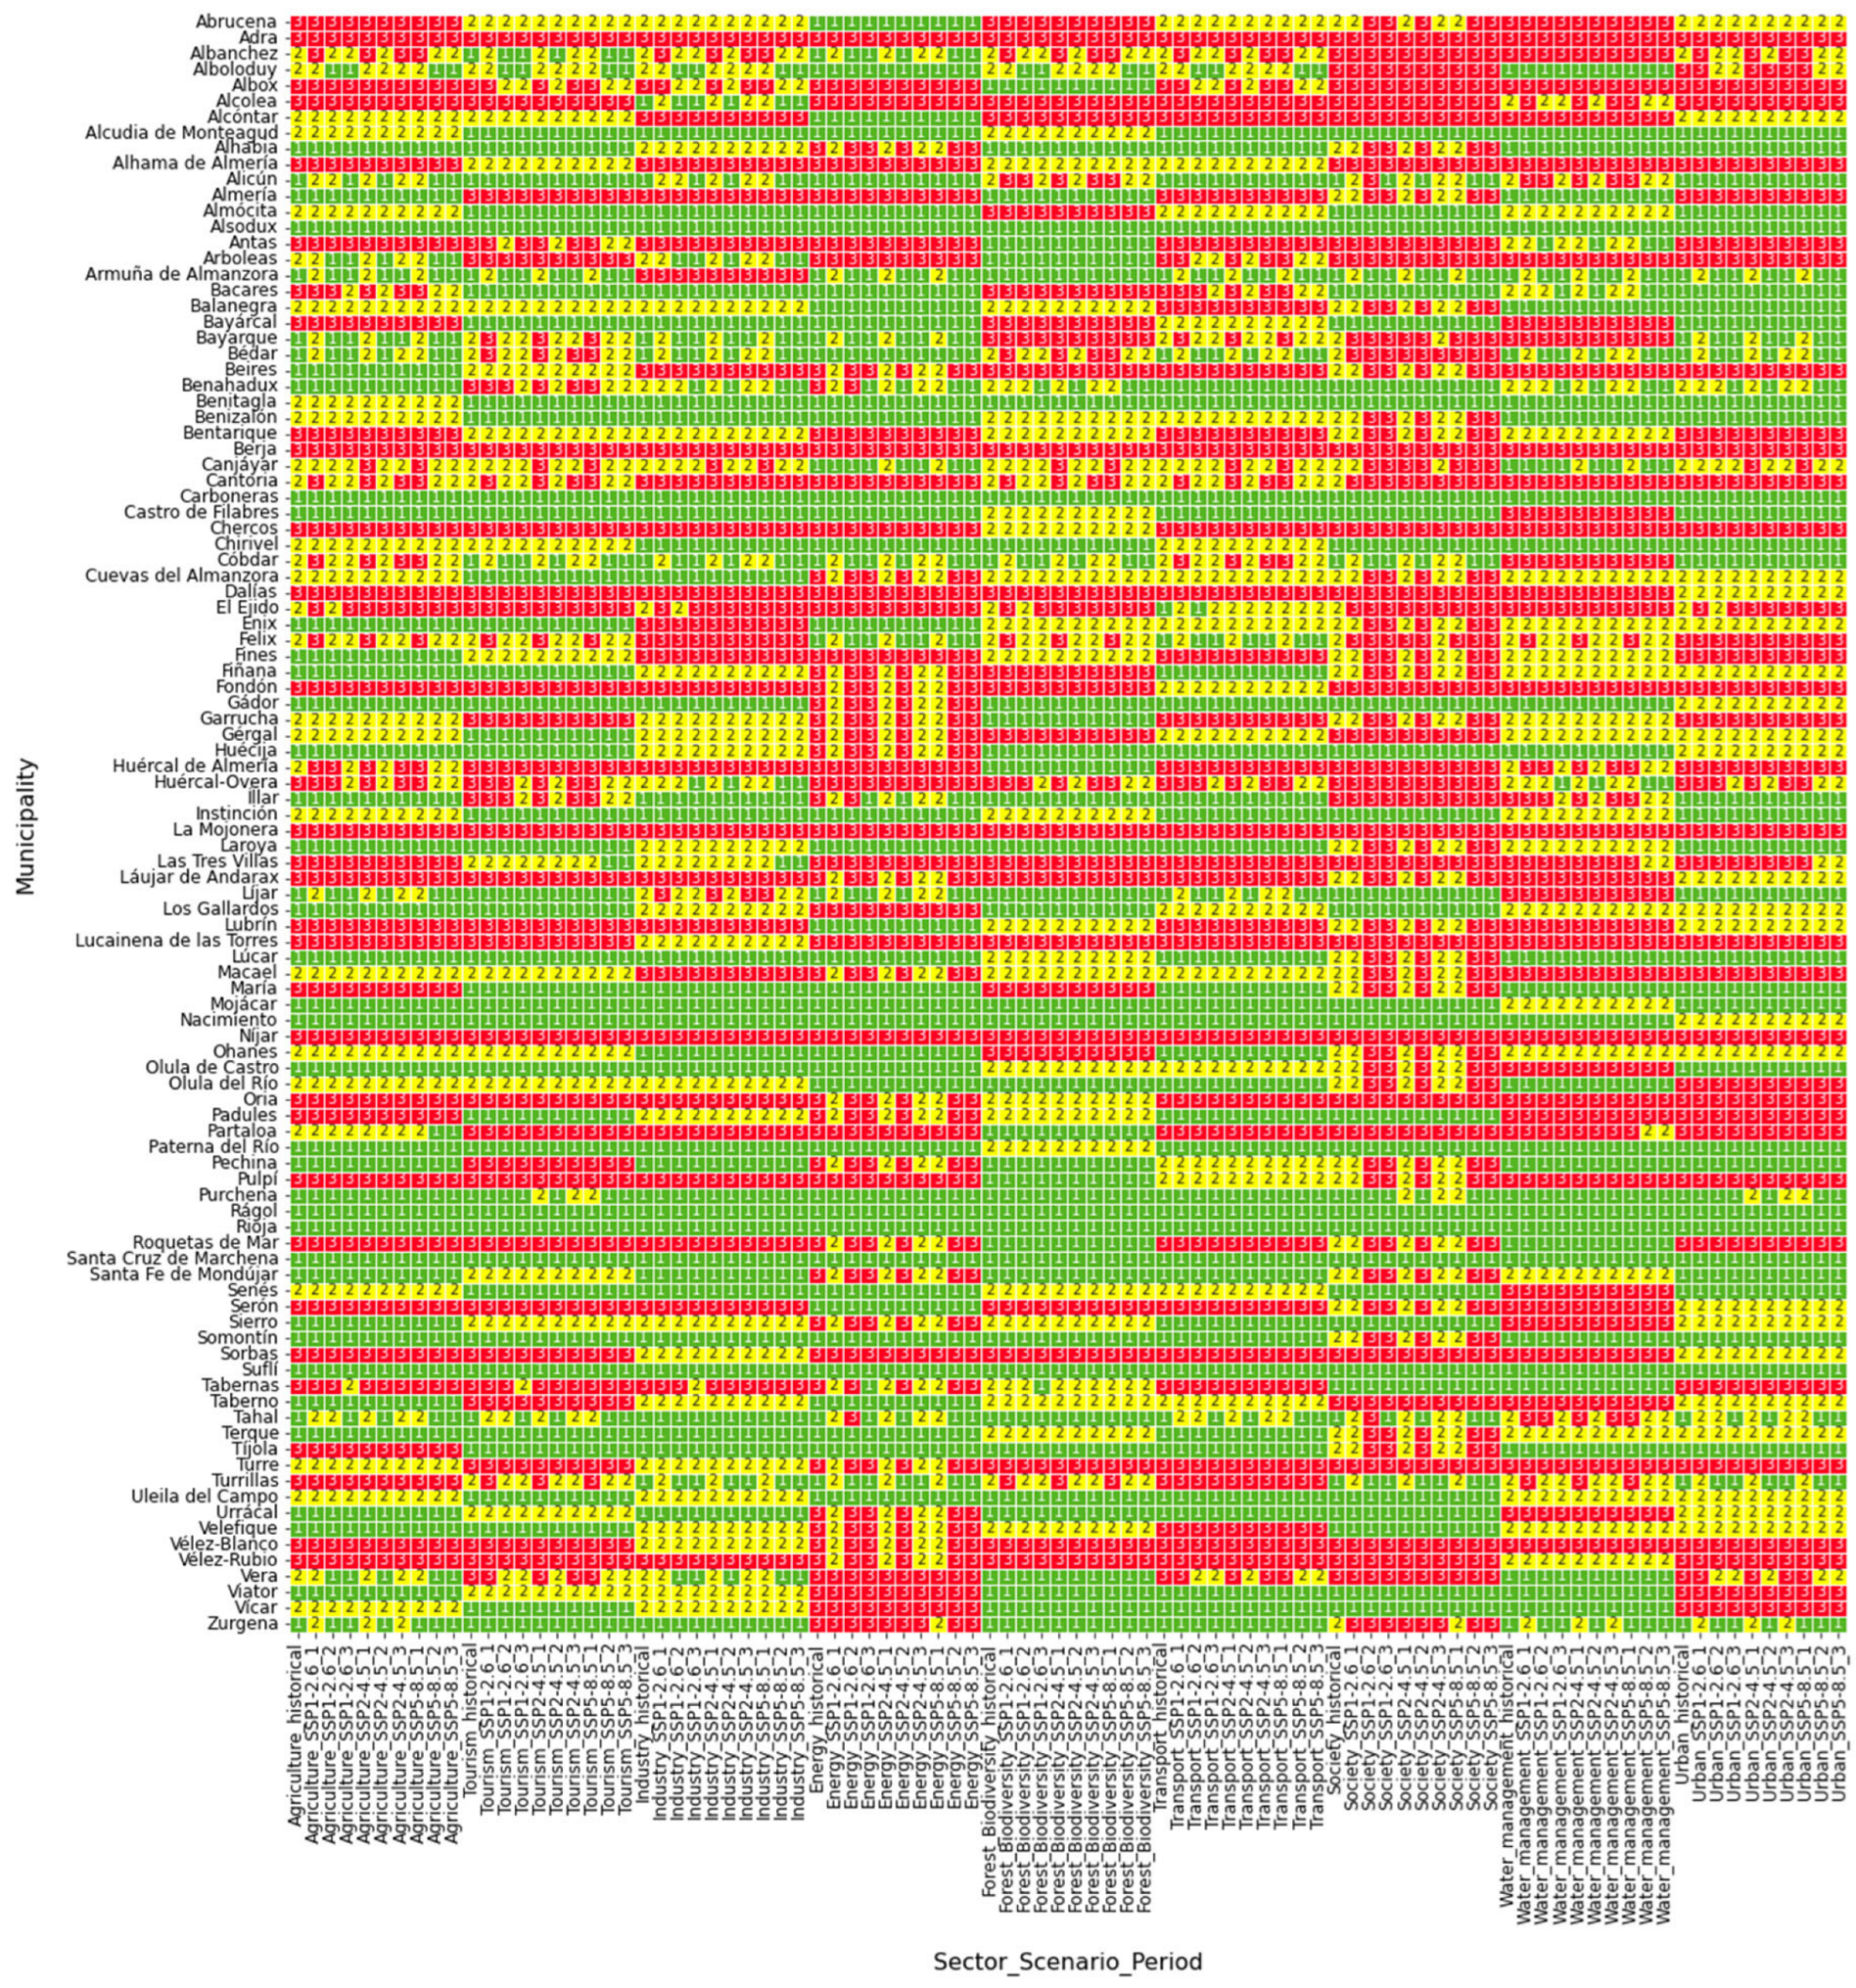
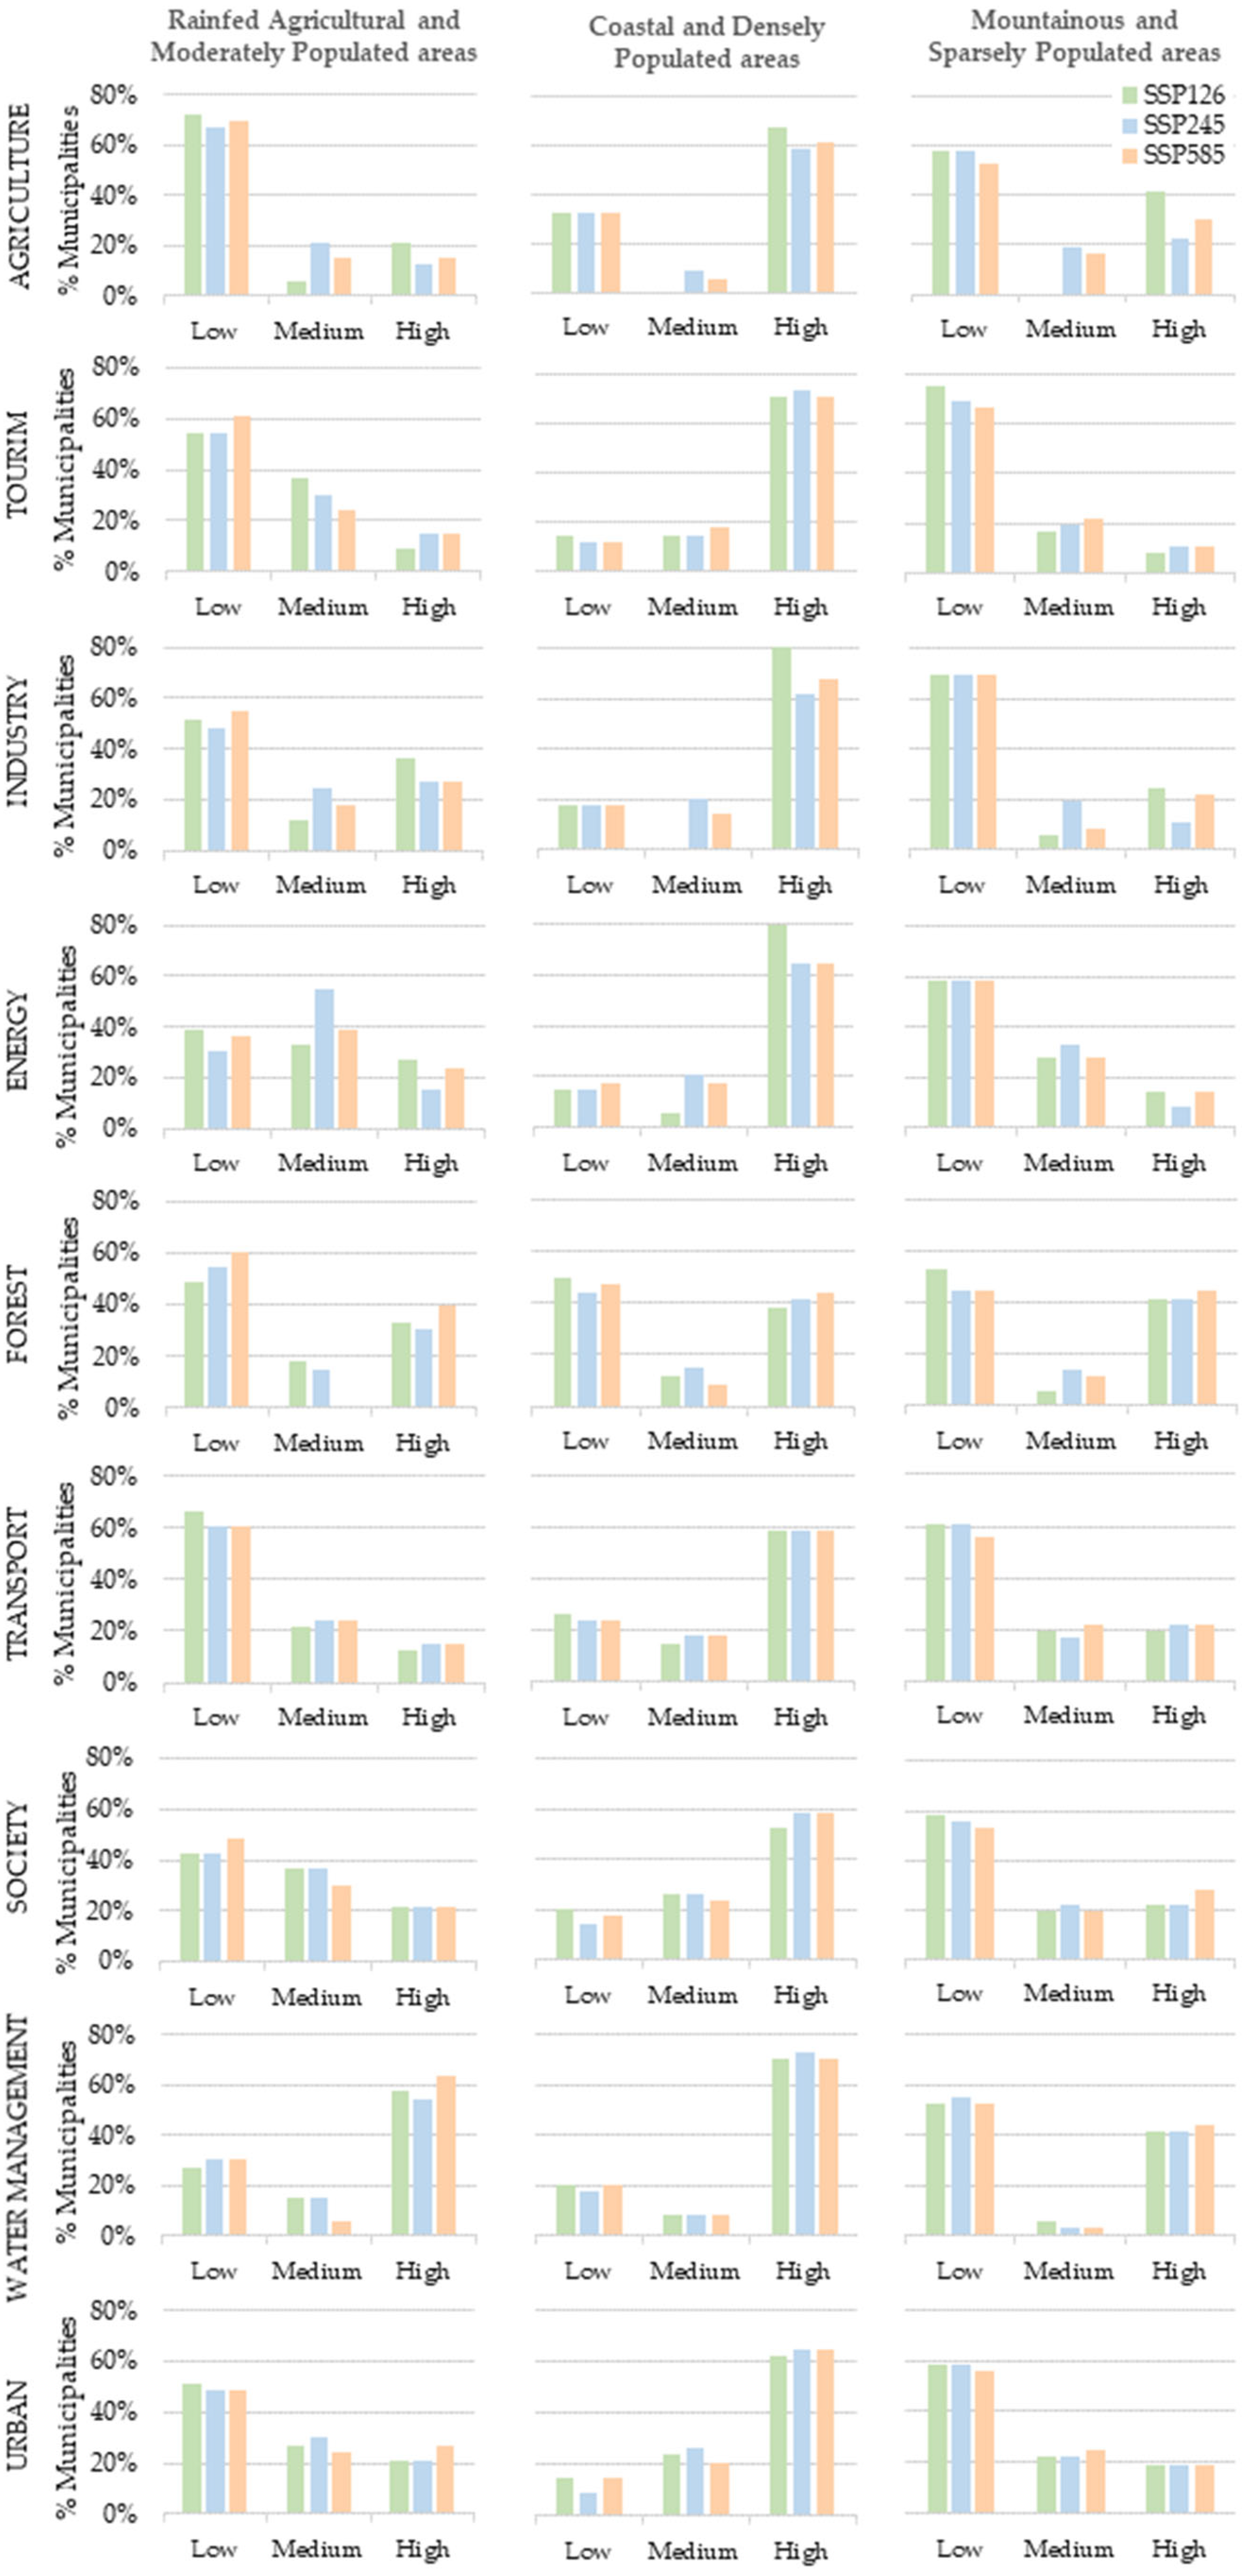
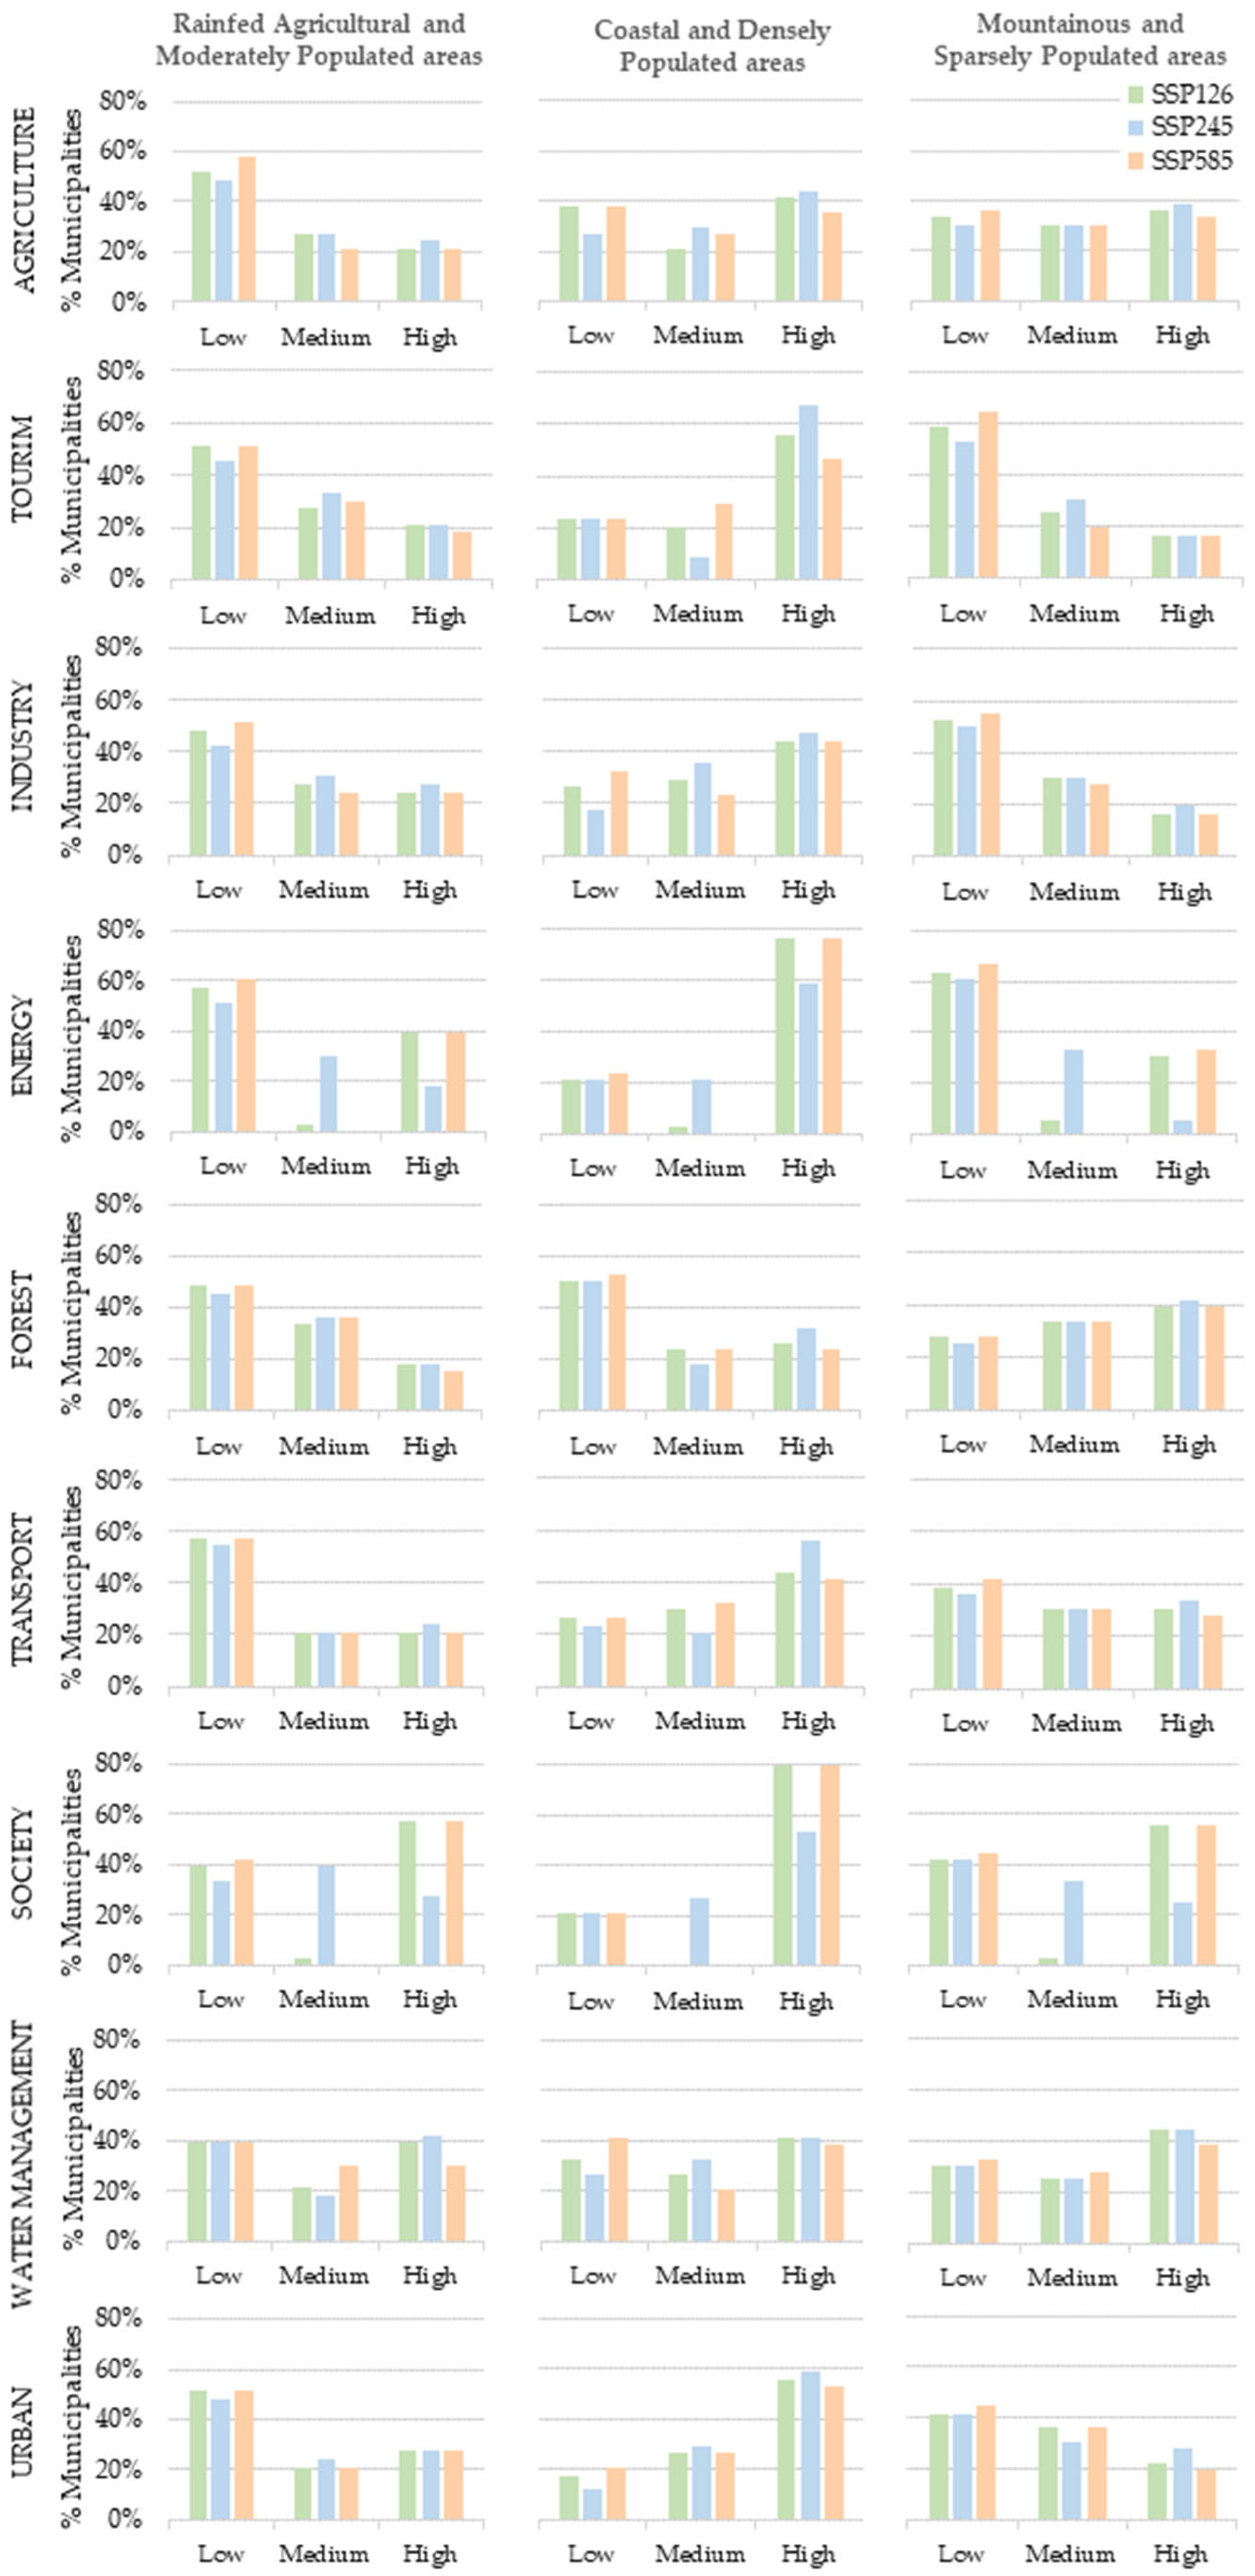
  • Bar charts of risk levels by municipality group, sector, and scenario, and risk heatmaps for each sector and scenario.

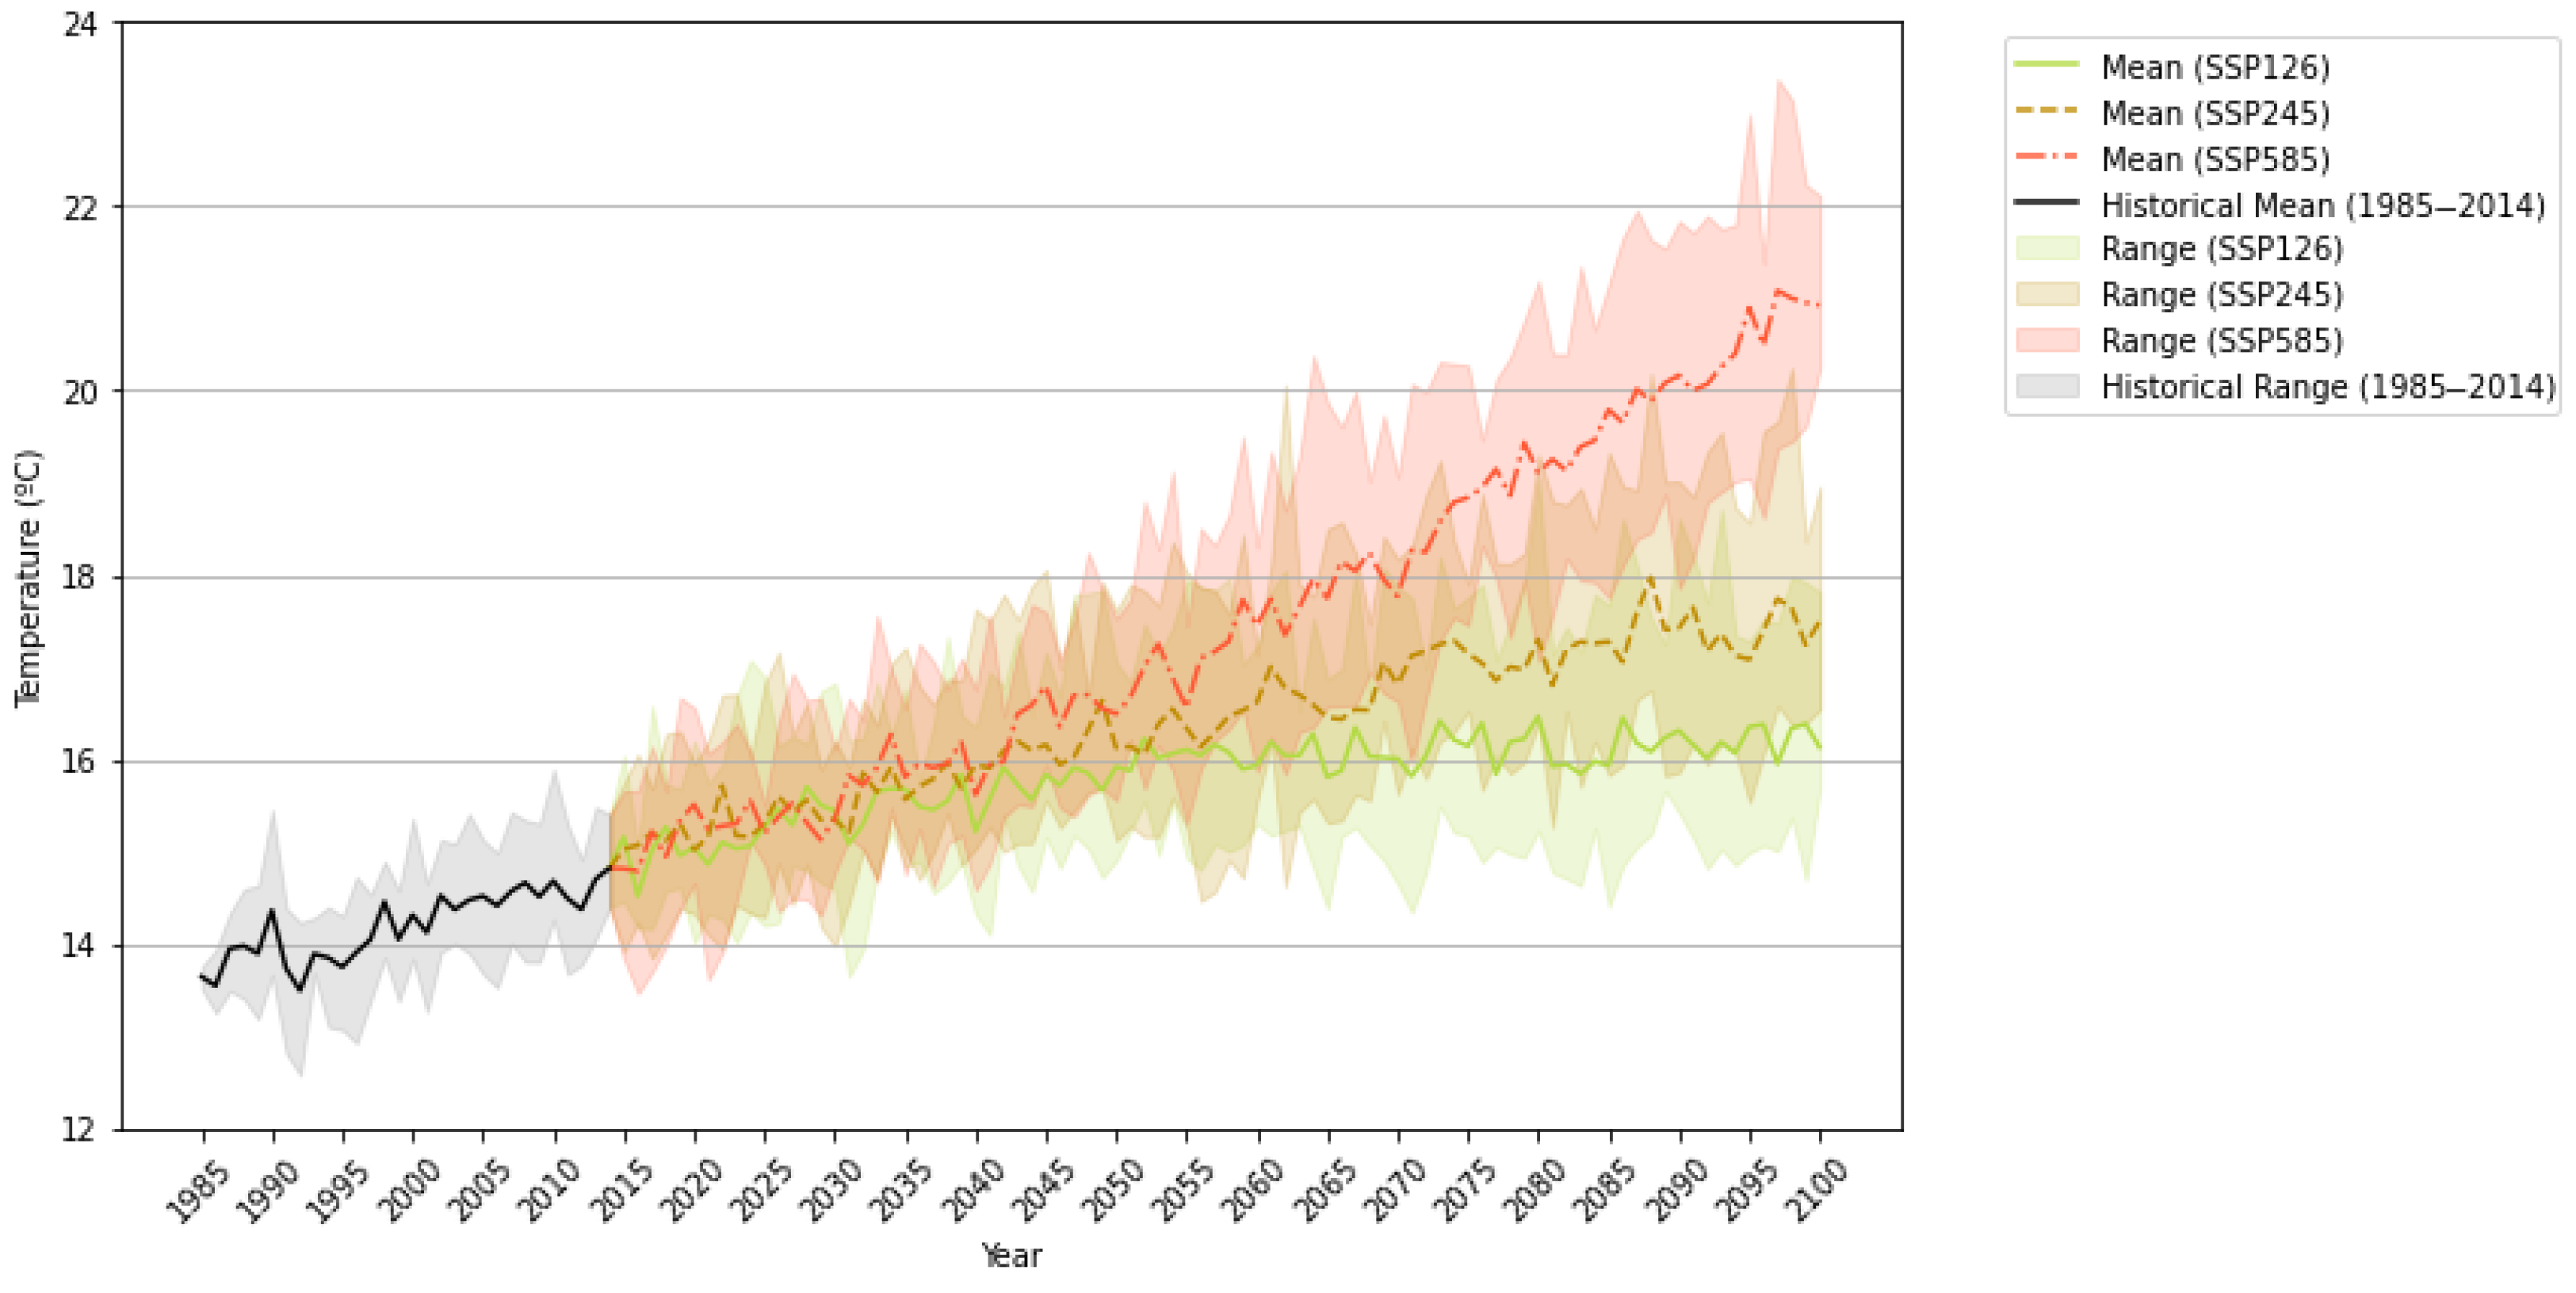
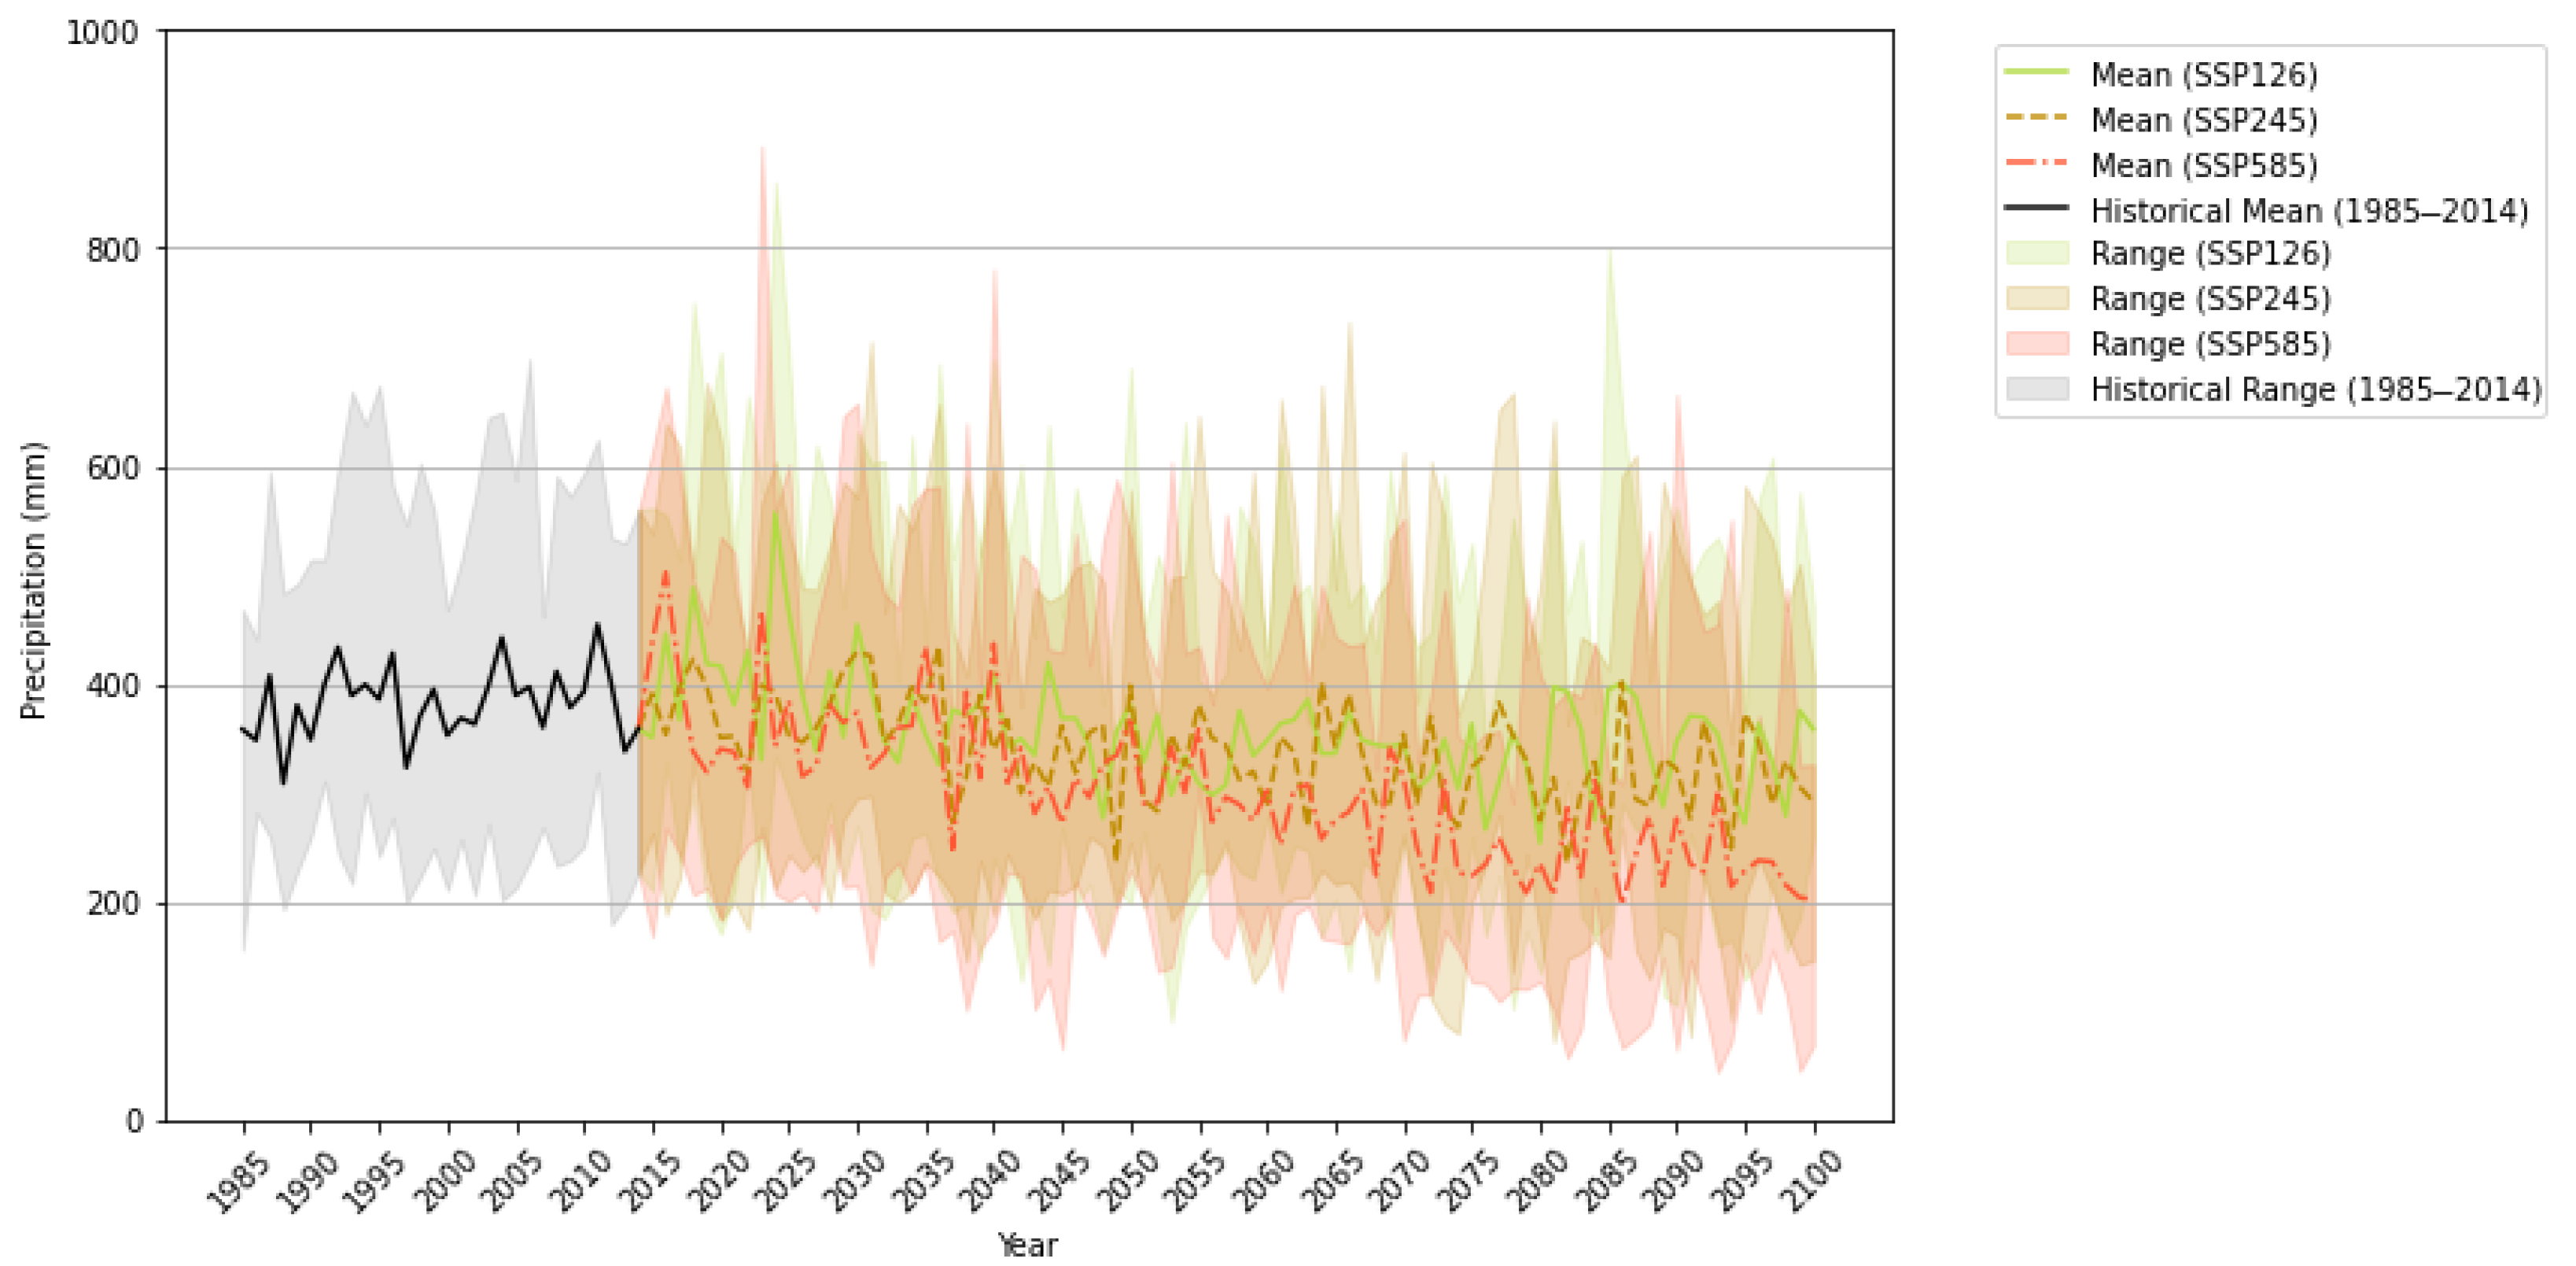
3.1. Future Climate in Almería

The section presents how climate variables such as temperature and precipitation are projected to change in Almería under different future scenarios, providing insight into the region’s evolving climate risks.
High-resolution climate datasets (5.5 km) covering the most relevant ECVs in Almería have been obtained. These datasets are crucial to understand how the climate will be in the future according to different scenarios (SSP1-2.6, SSP2-4.5 and SSP5-8.5). As was explained in the methodology, the combination of ECVs is key to quantifying the main hazards in the region and understanding the probability of occurrence or exceedance according to a set of defined thresholds.
Figure 4 represents the mean temperature in the region considering the historical and three future scenarios. The mean temperature is positive and higher than 14 °C with a thermal gradient between the coast and the interior land. The long-term increase in the temperature could reach 10 °C. On the other hand, precipitation is very low (average of 200 mm/year) (Figure 5), with a trend that anticipates a decrease of 50% in the future. This potential decrease could generate negative consequences for productive crop systems based on irrigation and intensive production.

3.2. Hazard Results

3.2.1. Hazard Exceedance Probability and Coupled Probabilities

The following results show how the probability of relevant climate-related hazards, such as heatwaves, droughts, and storms, is expected to change under future climate scenarios in Almería.
The results of the hazard probability calculations are presented in Table 2 for a single heatwave and drought event, as well as for storms with a threshold of 50 mm of rainfall. The curves representing the probability of exceedance of these hazards are displayed in Figure 6. Figure 6 and Table 2 present the resulting probabilities, which, as anticipated, are lower in the historical period than in future scenarios. This trend is driven by rising temperatures and a prolonged duration of extreme heat, as the effects of climate change, along with extended dry periods and greater weather variability, lead to an increase in convective storms.
The probability of exceedance for a single heatwave event remains relatively stable across all future scenarios, with the most severe scenario (SSP5-8.5) exhibiting the lowest probability. This slight variation among future scenarios may be a consequence of uncertainties in the modelling process.
On the other hand, the exceedance probability of droughts varies significantly across scenarios, with SSP5-8.5 showing the highest probability, followed by SSP2-4.5 and SSP1-2.6, which is the least severe scenario. This trend aligns with expectations, as the worst-case scenario is more heavily impacted by climate change.
For storms, the probability of exceedance is lower compared to the other hazards. Moreover, the difference between historical trends and future scenarios is minimal, though slightly higher in the most severe scenario. Given the climatic characteristics of the Almería region, heatwaves and droughts emerge as the most significant hazards.

3.2.2. Hazard Coupled Probabilities

The outcomes of the multi-hazard probability approach for independent hazards is included in Table 3. The probabilities of droughts and heatwaves are combined due to their strong positive relationship. Heatwaves consist of consecutive days with high temperatures, and droughts are typically linked to extended periods without precipitation, both of which are generally connected in Almería for its semi-arid climatic conditions. In contrast, storms do not have a direct relationship with either of them.

3.3. Exposure Results

The exposure results are presented as maps to highlight the municipalities in Almería that are most exposed to hazardous events across key sectors.
As outlined in the methodology section, exposure values are defined for each selected sector, as well as for the overall average across all sectors, representing the elements at risk in each sector. Figure 7 presents exposure maps illustrating these values for each sector and their average at the municipal level in Almería. Municipalities with the highest levels of exposure in each sector are shown in red, while those with the lowest levels are displayed in green.

3.4. Vulnerability Results

In this section, vulnerability maps of Almería’s municipalities across key sectors are presented, identifying where the consequences of extreme events may be most severe.
The results of the vulnerability assessment for the province of Almería are defined across the following sectors: agriculture, tourism, industry, energy, forests and biodiversity, transport, society, water management, and urban development. Vulnerability values are computed for each selected sector as well as for the average across all sectors. Figure 8 presents the vulnerability maps illustrating the qualitative vulnerability value for each sector and their average (general) at the municipal level in Almería. Municipalities with the highest levels of vulnerability in each sector are shown in red, while those with the lowest levels are displayed in green.
Figure 8. Vulnerability maps of each sector and the average values of all the sectors in each municipality of the Almería province.
Climate 13 00141 g008

3.5. Risk Results

The risk results highlight how Almería’s municipalities are affected by climate hazards under different future scenarios, helping identify the most at-risk sectors and areas.
The risk outcomes for each municipality of Almeria are presented in Figure 9, Figure 10 and Figure 11 as bar charts and in Figure A1, Figure A2 and Figure A3 of Appendix A3 as heatmaps. The bar charts highlight differences among the three territorial groups in Almería by showing the percentage of municipalities with low, medium, and high risks of extreme events across the region’s key sectors. The heatmaps illustrate risk values for droughts, heatwaves, and storms under different socio-economic scenarios and time periods (short, mid, and long term), as well as for the sectors identified as priorities for the region. Considering the methodology proposed for the quantification and determination of the variability of the risk data obtained between municipalities, an average risk value, as a composed indicator for the region as a whole and aggregating the municipalities, is not recommended due to the heterogeneity of the data. On the other hand, the bar charts and heatmaps provide a comprehensive framework able to identify which sectors are at risk and to assess the level of risk (high, medium, or low), respectively, for each territorial group and for each municipality. This understanding is essential before selecting and implementing climate change adaptation measures, as it offers insights into the region’s specific vulnerabilities.
The results obtained from the risk assessment across the municipalities that make up the province of Almería show that the risk varies within each analyzed sector, considering the climate scenario under which the risk is quantified. However, it is important to note that the only variable that dynamically changes in the results is the one corresponding to the hazard, which is associated with climate projections according to the different climate scenarios, while exposure and vulnerability remain constant without variation compared to the historical scenario. This assumption used in the calculation leads to a lower variability in the results, although it is important to highlight the complexity involved in simulating and geolocating the evolution of the physical and socioeconomic variables that contribute to the quantification of exposure and vulnerability.
In general terms, it can be concluded that water management is significantly affected by all types of hazards, particularly droughts, and in all territorial groups. This aligns with the characteristics of the region, as Almería is defined by a semi-arid climate and limited water availability. The urban and societal sectors in densely populated areas are especially sensitive to changes in precipitation patterns, such as storms, which are expected to intensify in the future. In the agricultural sector, the impact of heatwaves and droughts particularly affects coastal areas, where intensive horticultural production has a significant socio-economic and territorial influence. The tourism sector in Coastal and Densely Populated Areas is also negatively impacted by high temperatures and the effects of droughts and heatwaves. This is largely due to the nature of recreational activities in the region—such as golf—that require substantial water resources for their upkeep.
Focusing on the territorial groups, the bar charts indicate that the Coastal and Densely Populated Areas contain the highest number of municipalities with elevated risk levels across all the sectors. This aligns with the socio-economic and land use characteristics of Almería, where the main economic activities, intensive horticulture and tourism, are concentrated along the coast. These sectors exert significant pressure on already scarce water resources, contributing to higher risk levels, particularly in the domain of water management.
On the other hand, both the Rainfed Agricultural and Moderately Populated areas and the Mountainous and Sparsely Populated areas show a high percentage of municipalities with elevated risk levels for water management. This highlights water management as a widespread concern across the province. In contrast, these areas display lower risk levels for agriculture and tourism. The reduced agricultural risk is mainly attributed to a lower dependency on irrigation and less intensive soil exploitation, typical of rainfed farming systems.

4. Discussion

In this section, the results obtained from the risk analysis in Almería are analyzed, emphasizing each of the components that contribute to risk generation.

4.1. Hazard Result Discussion

Building on the probability patterns and trends observed in Section 3.2, this discussion delves into the implications of future hazard dynamics across climate scenarios.
The results of the threshold exceedance probabilities for hazards reveal a clear increasing trend across future scenarios, especially under the most pessimistic scenario (SSP5-8.5), which is aligned with the projections from the IPCC [5] and other studies focused on the Mediterranean basin [32]. While the exceedance probability for heatwaves remains relatively consistent across the three evaluated scenarios, heatwaves emerge as a recurrent risk in the region. In contrast, droughts show significant variation among scenarios, highlighting both the inherent uncertainty of climate models and the differential impact according to the selected socioeconomic pathways.
Regarding storms, their exceedance probabilities remain low across all scenarios, confirming their lower relevance in Almería’s climatic context. Although the analyzed scenarios show this trend, it should be noted that despite being in a dry region, extreme precipitation events generate a great impact on the territory. Finally, it is necessary to highlight that the multi-hazard analysis reveals interdependence between heatwaves and droughts, a linkage already highlighted by [20], justifying their combined evaluation under an integrated risk management perspective.
In terms of climate uncertainties in hazard characterization, the use of an ensemble of eight CMIP6 climate models significantly reduces structural uncertainty by capturing a wide range of model-to-model variability in physical schemes and parameterizations, avoiding reliance on any single model prediction [38,39,40]. The inclusion of various socioeconomic emissions scenarios (e.g., SSP1-2.6, SSP2-4.5, SSP5-8.5) further incorporates scenario uncertainty, thus reflecting a broader spectrum of plausible futures—especially under high-impact pathways [41,42]. Additionally, analyzing discrete future periods (short, medium and long-term) complements model and scenario diversity by addressing temporal uncertainty and capturing the progression of climatic changes over time [41]. Together, this multi-pronged approach—multiple models, scenarios, and timeframes—yields a robust and comprehensive uncertainty envelope, enhancing confidence in future projections and aiding the development of resilient adaptation and mitigation strategies.

4.2. Exposure Result Discussion

The spatial patterns observed in the exposure results (Figure 7) directly inform this discussion, where coastal and intensively cultivated areas emerge as hotspots of risk due to their high exposure to climate hazards.
Each sector in the exposure map corresponds to a specific exposed element, which may vary across municipalities based on territorial and economic characteristics.
Starting with the agricultural sector, areas with higher exposure to destructive climatic events are located near the coast, where most horticultural activities are concentrated, as well as in the northern part of the province, which is characterized by strong agricultural activity focused mainly on rainfed crops.
The tourism sector also shows high levels of exposure along the coastline, where a large number of tourists gather to enjoy Almería’s beaches and golf courses for several months of the year, attracted by the region’s semi-arid climate.
Municipalities with higher population densities are more exposed to risks, as seen in the city of Almería, the largest municipality in the province. These characteristics reflect also on the urban sector for which larger cities with extensive built-up areas create limitations in accessing green spaces [23]. The transport sector is also included in this reasoning, since it includes critical infrastructure that could be disrupted by extreme events, especially in densely populated or coastal zones.
The water management sector shows only low to medium exposure levels across the province. This is largely due to the lack of significant surface water resources in Almería, meaning there are few water bodies at risk.
In the forest and biodiversity sector, exposed areas tend to coincide with natural parks and reserves. These ecosystems are especially vulnerable to degradation, which is driven by key human-induced pressures in the Mediterranean, including the conversion of land to intensive agriculture, urbanization (particularly in coastal tourist areas), and the overexploitation of natural resources—especially overgrazing [43].
The energy sector considers both the electricity grid and energy production sites. The findings are consistent with the map of Almería’s energy infrastructure in [44], locating the energy installations mainly in coastal and densely populated areas.
Finally, the exposure results highlight areas where the environment, population, and economy are most exposed, indicating that the implementation of adaptation measures should be prioritized in these locations if not already undertaken. Overall, the maps show high exposure in coastal and agricultural zones, densely populated urban areas, and tourism hotspots. Forests, biodiversity, and energy infrastructure are also at risk due to human pressures and their location within populated municipalities, while water management exhibits relatively low exposure because of limited water resources.

4.3. Vulnerability Result Discussion

The vulnerability maps presented in Figure 8 provide the basis for this interpretation, highlighting municipalities where a limited adaptive capacity aggravate the impacts of hazardous events.
Vulnerability patterns vary significantly by location and sector. The assessment developed in the province of Almeria shows that interior municipalities with lower economic development and limited adaptive infrastructure exhibit the highest vulnerability levels. This finding is aligned with [18], which emphasizes that adaptive capacity is critical for reducing vulnerability, even in areas with high sensitivity.
Sectors such as society, urban planning, and water management display high vulnerability due to pressure on services, irregular access to resources with a focus on water availability, and dense urban populations. This is aligned with assessments of urban vulnerabilities, highlighting that dense populations and infrastructure stress amplify vulnerability [45]. Likewise, water management challenges in semi-arid contexts are well documented, where limited water availability drives systemic sectoral vulnerability [3,46]. In the other hand, sectors with better planning or greater investment, such as energy and industry, tend to exhibit lower vulnerability levels.
The obtained results underline the importance of differentiated approaches when adaptation strategies are under development. These strategies need to be tailored to each sector’s capacity and territorial context in order to increase the adaptation capacity while the system sensitivity is reduced.

4.4. Risk Result Discussion

The risk heatmaps and bar charts (respectively in Section 3.4 and Appendix A.3) define how the interaction between hazard, exposure, and vulnerability leads to differentiated risk patterns across sectors and municipalities.
The risk results reflect high spatial heterogeneity across the Almería province. The highest risks are concentrated in key sectors such as agriculture and tourism, especially under severe scenarios and long-term climate projections. These results highlight the urgency of prioritizing adaptation measures in these sectors, as is recommended by the IPCC [5].
The findings also show that municipalities with high exposure but moderate vulnerability (e.g., coastal areas with tourism infrastructure) may reach similar risk levels as those with high vulnerability but lower exposure. This validates the integrated risk quantification approach presented in this study. Additionally, the heterogeneity of results discourages the aggregation of sectoral risk indicators at province level, reinforcing the need for local-scale analysis and planning, that help to identify suitable adaptation and mitigation solutions, with a focus on the specific concerns that could appear at the local level.
The use of geolocated, normalized indicators enhances the differentiation of critical areas, supporting informed decision-making. However, it is important to remark the limitations of the semi-quantitative approach: while it enables the integration of diverse variables and data sources to generate a qualitative indicator [29], it does not yield direct economic estimations of the expected losses associated with risk occurrence. To this end, quantitative methodologies, such as that proposed in [47], are of great interest in quantifying the effect that risk generates. Future research on risk analysis should address the multi-hazard scenarios with concurrent extreme events and incorporate economic loss estimations to further enhance climate risk evaluations and support comprehensive resilience strategies.

5. Conclusions

This study presents a semi-quantitative methodology for local-level climate risk assessment in the province of Almería, integrating hazard, exposure and vulnerability indicators based on the IPCC AR6 conceptual framework [5]. The results identified sectoral and spatial risk patterns for heatwaves, droughts and storms under three different climate change scenarios, providing clear insights on how the region will be affected in the future.
Although the results show the variability of risk in the analyzed sectors considering the different climate change scenarios, it is important to highlight the limitation regarding the dynamic evolution of the indicators associated with exposure and vulnerability. However, this limitation should not be regarded as a major issue, and the results remain highly relevant for drawing conclusions and prioritizing the implementation of adaptation and mitigation measures in the sectors with the highest potential risk, particularly in relation to the most predominant hazards that could appear in the region.
The findings of this study can support risk adaptation planning, allowing the prioritization of adaptation measures and the technical justification of climate-resilient public policies. The indicator-based methodology using percentile normalization that was applied in this work enables a replicable and adaptable assessment approach in data-limited contexts, supporting both local planning and regional comparisons. It helps to give the user visualize how climate change will generate risks in the future. Finally, it is necessary to highlight that future risk research should investigate the interactions between multiple hazards occurring at the same time and incorporate economic estimates of potential damages to enhance climate risk evaluations.

Author Contributions

Conceptualization, I.R.-D. and S.B.; Methodology, S.B., I.R.-D., A.R., G.F.; Investigation, I.R.-D., S.B. and Y.V.-J.; Writing—original draft preparation, S.B. and I.R.-D.; Writing—review and editing, S.B., I.R.-D., Y.V.-J., G.F. and A.R. All authors have read and agreed to the published version of the manuscript.

Funding

This work was supported by the Horizon 2020 European project “RethinkAction”, under Grant Agreement No. 101037104.

Data Availability Statement

Data are contained within the article. High-resolution datasets for Almeria are available in the Zenodo (https://zenodo.org/communities/rethinkaction/records?q=&l=list&p=1&s=10&sort=newest) repository of the project.

Acknowledgments

The authors would like thank you FCiências.ID—Associação para a Investigação e Desenvolvimento de Ciências (FC.ID) with special attention to Ricardo Encarnação Coelho as WP6 leader of RethinkAction project and Robert Oakes (UNU-EHS) for their support with the coordination and data collection at case study level. Moreover, the authors are grateful to the collective efforts of the global scientific community in developing the CMIP6 models, and the Copernicus program for providing access to both the CMIP6 models and the CERRA dataset.

Conflicts of Interest

The authors declare no conflicts of interest.

Abbreviations

The following abbreviations are used in this manuscript:
ACCESS-CM2Australian Community Climate and Earth System Simulator Coupled Model
ARAssessment Report
CERRACopernicus European Regional Reanalysis
CESM2Community Earth System Model v2
CDFCumulative Distribution Function
CMCCEuro-Mediterranean Centre on Climate Change
CMIP6Coupled Model Intercomparison Project
CNRM-ESM2-1National Centre of Meteorological Research—Earth System model
CSVComma-Separated Values
EC-Earth3-Veg-LREarth Consortium—Earth system model
ECVEssential Climate Variables
EQMEmpirical Quantile Mapping
FC.IDAssociation for Research and Development in Sciences
GCMGlobal Climate Model
HadGEM3-GC31LLHadley Centre Global Environment Model 3—Global Coupled v3.1
IDIdentification number
IPCCIntergovernmental Panel on Climate Change
IPSL-CM6A-LRInstitut Pierre Simon Laplace Climate Model
MIROC6Model for Interdisciplinary Research on Climate
NorESM2-MMNorwegian Earth System Model
QGISQuantum Geographic Information System
SSPShared Socioeconomic Pathways
UNU-EHSUnited Nations University for Environment and Human Security

Appendix A

Appendix A.1

Table A1 presents the municipalities of Almería province, each assigned a unique identification number (ID), which facilitates their identification on the map shown in Figure 1.
Table A1. Identification number for each municipality in Almería.
IDMunicipalityIDMunicipalityIDMunicipality
1Abla36Chirivel70Pechina
2Abrucena37Dalías71Pulpí
3Adra38Enix72Purchena
4Albanchez39Felix73Rágol
5Alboloduy40Fines74Rioja
6Albox41Fiñana75Roquetas de Mar
7Alcolea42Fondón76Santa Cruz de Marchena
8Alcóntar43Gádor77Santa Fe de Mondújar
9Alcudia de Monteagud44Los Gallardos78Senés
10Alhabia45Garrucha79Serón
11Alhama de Almería46Gérgal80Sierro
12Alicún47Huécija81Somontín
13Almería48Huércal de Almería82Sorbas
14Almócita49Huércal-Overa83Suflí
15Alsodux50Íllar84Tabernas
16Antas51Instinción85Taberno
17Arboleas52Laroya86Tahal
18Armuña de Almanzora53Láujar de Andarax87Terque
19Bacares54Líjar88Tíjola
20Bayárcal55Lubrín89Turre
21Bayarque56Lucainena de las Torres90Turrillas
22Bédar57Lúcar91Uleila del Campo
23Beires58Macael92Urrácal
24Benahadux59María93Velefique
25Benitagla60Mojácar94Vélez-Blanco
26Benizalón61Nacimiento95Vélez-Rubio
27Bentarique62Níjar96Vera
28Berja63Ohanes97Viator
29Canjáyar64Olula de Castro98Vícar
30Cantoria65Olula del Río99Zurgena
31Carboneras66Oria100Las Tres Villas
32Castro de Filabres67Padules101El Ejido
33Cóbdar68Partaloa102La Mojonera
34Cuevas del Almanzora69Paterna del Río103Balanegra
35Chercos----

Appendix A.2

The exposure and vulnerability indicators used for the risk calculation are listed in Table A2. The table also specifies the corresponding sector (agriculture, tourism, industry, energy, forest and biodiversity, transport, society, water management, and urban), the type of risk component (exposure, sensitivity, or adaptive capacity), and the respective units. These indicators were processed and implemented according to the methodology described in Section 2.
Table A2. List of indicators used for risk assessment together with the respective sector, risk component and units.
SectorRisk ComponentIndicatorUnits
AgricultureExposureAgricultural areakm2
AgricultureExposurePeople working in agricultural sectorN° of people
TourismExposureNumber of overnight staysN° of stays
TourismExposureNumber of accommodationsN° of rooms
IndustryExposureNumber of industrial facilitiesN° of facilities
EnergyExposurePower grid lengthm
EnergyExposureNumber of energy production centreNº of centres
Forest and BiodiversityExposureProtected areakm2
Forest and BiodiversityExposureForest areakm2
TransportExposureTransport networkm
SocietyExposurePopulationNº of people
SocietyExposureNumber of sanitary centresNº of centres
SocietyExposureImmigrants exposedNº of people
Water managementExposureAquifers and water areakm2
UrbanExposureUrban areakm2
UrbanExposureInfrastructures and assetsNº of assets
UrbanExposureHouseholdsNº of households
AgricultureSensitivityRatio of irrigated area over total area%
AgricultureSensitivitySensitivity to riversm
AgricultureSensitivityRatio of agricultural are over total area%
AgricultureSensitivityRatio of cereals over total area%
AgricultureSensitivityRatio of fruit cultivation over total area%
AgricultureSensitivityRatio of vineyard over total area%
AgricultureSensitivityRatio of olive cultivation over total area%
AgricultureSensitivityEconomic weight of the agricultural sector%
AgricultureSensitivityPropensity to fireNº of fires
AgricultureSensitivityRisk of soil erosiont/(ha·y)
AgricultureSensitivityQuantity of fertilizers in agriculturetons
AgricultureAdaptive capacityRainfed agricultural area in relation to the total agricultural area%
AgricultureAdaptive capacityZones of High Risk of Fire-
AgricultureAdaptive capacityIrrigated area in relation to the total surface area%
AgricultureAdaptive capacityAgricultural facilities in the territoryNº of facilities
AgricultureAdaptive capacityRatio of water resources over total area%
AgricultureAdaptive capacityPresence of riversm
AgricultureAdaptive capacityEconomic weight of the agricultural sector%
TourismSensitivitySensitivity to riversm
TourismSensitivityMunicipal degree of danger of fire in forest combined with the tourist accommodationNº of accommodations
TourismSensitivityTourism weight per municipalities%
TourismSensitivityPropensity to fireNº of fires
TourismAdaptive capacityZones of High Risk of Fire-
TourismAdaptive capacityTourism weight per municipalities%
IndustrySensitivitySensitivity to riversm
IndustrySensitivityWeight of the industrial sector in the economy%
IndustrySensitivityPercentage of workers in industry and services%
IndustryAdaptive capacityRelationship between energy consumption and average gross incomeMWh/€
IndustryAdaptive capacityRelationship between water consumption and average gross incomeL/day/€
IndustryAdaptive capacityWeight of the industrial sector in the economy%
EnergySensitivityMunicipal energy consumptionMWh
EnergyAdaptive capacityMunicipal energy production facilitiesNº of facilities
EnergyAdaptive capacityMunicipal energy consumptionMWh
EnergyAdaptive capacityRelationship between energy consumption and average gross incomeMWh/€
Forest and BiodiversitySensitivityPropensity to fireNº of fires
Forest and BiodiversitySensitivityRisk of soil erosiont/(ha·y)
Forest and BiodiversitySensitivityRatio of protected area over total area%
Forest and BiodiversitySensitivityRatio of area of wetlands and waterbodies over total area%
Forest and BiodiversityAdaptive capacityZones of High Risk of Fire-
Forest and BiodiversityAdaptive capacityPresence of riversm
Forest and BiodiversityAdaptive capacityRatio of protected wetlands and waterbodies over total protected area%
Forest and BiodiversityAdaptive capacityRatio of forest area over agricultural area%
Forest and BiodiversityAdaptive capacityRatio of forest area over total area%
Forest and BiodiversityAdaptive capacityRatio of bare soil over total area%
Forest and BiodiversityAdaptive capacityArea protected with management plans and/or protection measures over total area%
TransportSensitivitySensitivity to riversm
TransportSensitivityMunicipal degree of danger of fire in forest combined with the km of road network that passes through the municipalitykm
TransportSensitivityPropensity to fireNº of fires
TransportAdaptive capacityZones of High Risk of Fire-
SocietySensitivitySensitivity to riversm
SocietySensitivityMunicipal water consumptionL/day
SocietySensitivityRatio of population of children (0–14 years) and older than 65 years, over total population%
SocietySensitivityPopulation density in the urban area of the municipalityInhab/km2
SocietySensitivityIncome inequality (GINI index)-
SocietySensitivityRatio of immigrants over total population%
SocietyAdaptive capacityRatio of green area coverage over total urban area%
SocietyAdaptive capacityAverage gross income per person per municipality (INE)
SocietyAdaptive capacityDependency index%
Water managementSensitivityEconomic weight of the agricultural sector%
Water managementSensitivityTourism weight per municipalities%
Water managementSensitivityMunicipal water consumptionL/day
Water managementSensitivityWeight of the industrial sector in the economy%
Water managementAdaptive capacityRatio of water resources over total area%
Water managementAdaptive capacityPresence of riversm
Water managementAdaptive capacityTourism weight per municipalities%
Water managementAdaptive capacityRatio of protected wetlands and waterbodies over total protected area%
Water managementAdaptive capacityMunicipal water consumptionL/day
Water managementAdaptive capacityEconomic weight of the agricultural sector%
Water managementAdaptive capacityWeight of the industrial sector in the economy%
UrbanSensitivitySensitivity to riversm
UrbanSensitivityPopulation density in the urban area of the municipalityInhab/km2
UrbanSensitivityRatio of green urban area over total urban area%
UrbanAdaptive capacityMunicipal energy consumptionMWh
UrbanAdaptive capacityMunicipal water consumptionL/day
UrbanAdaptive capacityRatio of green area coverage over urban area%

Appendix A.3

The risk outcomes for each municipality of Almeria are summarized with heatmaps in Figure A1, Figure A2 and Figure A3.
Figure A1. Risk quantified by sector, scenario and period (1: short-term (2015–2040); 2: mid-term (2041–2070); 3: long-term (2071–2100) results) for heatwaves in Almeria region. Red denotes high risk, yellow denotes medium risk and green denotes low risk.
Climate 13 00141 g0a1
Figure A2. Risk quantified by sector, scenario and period (1: short-term (2015–2040); 2: mid-term (2041–2070); 3: long-term (2071–2100) results) for droughts in Almeria region. Red denotes high risk, yellow denotes medium risk and green denotes low risk.
Climate 13 00141 g0a2
Figure A3. Risk quantified by sector, scenario and period (1: short-term (2015–2040); 2: mid-term (2041–2070); 3: long-term (2071–2100) results) for storms in Almeria region. Red denotes high risk, yellow denotes medium risk and green denotes low risk.
Climate 13 00141 g0a3

References

  1. IPCC. Climate Change 2023: Synthesis Report. Contribution of Working Groups I, II and III to the Sixth Assessment Report of the Intergovernmental Panel on Climate Change; Pirani, A., Matthews, R., Chen, M.B., Goldfarb, L., Gomis, M., Huang, T., Leitzell, K., Lonnoy, E., Matthews, J.B.R., Maycock, T.K., et al., Eds.; IPCC: Geneva, Switzerland, 2023; 85p.
  2. Lionello, P.; Scarascia, L. The Relation between Climate Change in the Mediterranean Region and Global Warming. Reg. Environ. Change 2018, 18, 1481–1493. [Google Scholar] [CrossRef]
  3. Caparrós-Martínez, J.L.; Rueda-Lópe, N.; Milán-García, J.; de Pablo Valenciano, J. Public Policies for Sustainability and Water Security: The Case of Almeria (Spain). Glob. Ecol. Conserv. 2020, 23, e01037. [Google Scholar] [CrossRef]
  4. Oppenheimer, M.; Campos, M.; Warren, R.; Birkmann, J.; Luber, G.; O’Neill, B.; Takahashi, K. Emergent Risks and Key Vulnerabilities. In Climate Change 2014: Impacts, Adaptation, and Vulnerability. Contribution of Working Group II to the Fifth Assessment Report of the Intergovernmental Panel on Climate Change; Field, C.B., Barros, V.R., Dokken, D.J., Mach, K.J., Mastrandrea, M.D., Bilir, T.E., Chatterjee, M., Ebi, K.L., Estrada, Y.O., Genova, R.C., et al., Eds.; Cambridge University Press: Cambridge, UK, 2014. [Google Scholar]
  5. IPCC. Climate Change 2022: Impacts, Adaptation, and Vulnerability. Contribution of Working Group II to the Sixth Assessment Report of the Intergovernmental Panel on Climate Change; Cambridge University Press: Cambridge, UK, 2022.
  6. Aryal, A.; Bosch, R.; Lakshmi, V. Climate Risk and Vulnerability Assessment of Georgian Hydrology under Future Climate Change Scenarios. Climate 2023, 11, 222. [Google Scholar] [CrossRef]
  7. Preston, B.L.; Yuen, E.J.; Westaway, R.M. Putting Vulnerability to Climate Change on the Map: A Review of Approaches, Benefits, and Risks. Sustain. Sci. 2011, 6, 177–202. [Google Scholar] [CrossRef]
  8. Jurgilevich, A.; Räsänen, A.; Groundstroem, F.; Juhola, S. A systematic review of dynamics in climate risk and vulnerability assessments. Environ. Res. Lett. 2017, 12, 013002. [Google Scholar] [CrossRef]
  9. Cardona, O.D.; van Aalst, M.K.; Birkmann, J.; Fordham, M.; McGregor, G.; Perez, R.; Pulwarty, R.S.; Schipper, E.L.F.; Tan Sinh, B.; Davis, I.; et al. Determinants of Risk: Exposure and Vulnerability. In Managing the Risks of Extreme Events and Disasters to Advance Climate Change Adaptation; Field, C.B., Barros, V., Stocker, T.F., Qin, D., Dokken, D.J., Ebi, K.L., Mastrandrea, M.D., Mach, K.J., Plattner, G.-K., Allen, S.K., et al., Eds.; Cambridge University Press: Cambridge, UK, 2012; pp. 65–108. [Google Scholar]
  10. KC, B.; Shepherd, J.M.; King, A.W.; Johnson Gaither, C. Multi-hazard climate risk projections for the United States. Nat. Hazards 2021, 105, 1963–1976. [Google Scholar] [CrossRef]
  11. Füssel, H.M. Vulnerability: A generally applicable conceptual framework for climate change research. Glob. Environ. Change 2007, 17, 155–167. [Google Scholar] [CrossRef]
  12. Gallina, V.; Torresan, S.; Critto, A.; Sperotto, A.; Glade, T.; Marcomini, A. A Review of Multi-Risk Methodologies for Natural Hazards: Consequences and Challenges for a Climate Change Impact Assessment. J. Environ. Manag. 2016, 168, 123–132. [Google Scholar] [CrossRef]
  13. Poljanšek, K.; Marín Ferrer, M.; De Groeve, T.; Clark, I. (Eds.) Science for Disaster Risk Management 2017: Knowing Better and Losing Less; EUR 28034 EN; Publications Office of the European Union: Luxembourg, 2017; ISBN 978-92-79-60678-6. [Google Scholar] [CrossRef]
  14. Aven, T. Risk Assessment and Risk Management: Review of Recent Advances on Their Foundation. Eur. J. Oper. Res. 2016, 253, 1–13. [Google Scholar] [CrossRef]
  15. IPCC. Climate Change 2014: Impacts, Adaptation, and Vulnerability. Part A: Global and Sectoral Aspects. Contribution of Working Group II to the Fifth Assessment Report of the Intergovernmental Panel on Climate Change; Field, C.B., Barros, V.R., Dokken, D.J., Mach, K.J., Mastrandrea, M.D., Bilir, T.E., Chatterjee, M., Ebi, K.L., Estrada, Y.O., Genova, R.C., et al., Eds.; Cambridge University Press: Cambridge, UK; New York, NY, USA, 2014; 1132p.
  16. Berman, K.; Kuleshov, Y. Assessing Tropical Cyclone Risk in Australia Using Community Exposure–Vulnerability Indices. Climate 2023, 11, 235. [Google Scholar] [CrossRef]
  17. Marín-Monroy, E.A.; Hernández-Trejo, V.; Romero-Vadillo, E.; Ivanova-Boncheva, A. Vulnerability and Risk Factors due to Tropical Cyclones in Coastal Cities of Baja California Sur, Mexico. Climate 2020, 8, 144. [Google Scholar] [CrossRef]
  18. Birkmann, J.; Cardona, O.D.; Carreño, M.L.; Barbat, A.H.; Pelling, M.; Schneiderbauer, S.; Kienberger, S.; Keiler, M.; Alexander, D.; Zeil, P.; et al. Framing vulnerability, risk and societal responses: The MOVE framework. Nat. Hazards 2013, 67, 193–211. [Google Scholar] [CrossRef]
  19. Westen, C.J. Remote sensing and GIS for natural hazards assessment and disaster risk management. Treatise Geomorphol. 2013, 3, 259–298. [Google Scholar] [CrossRef]
  20. Hagenlocher, M.; Renaud, F.G.; Haas, S.; Sebesvari, Z. Vulnerability and risk of deltaic social-ecological systems exposed to multiple hazards. Sci. Total Environ. 2018, 631, 71–80. [Google Scholar] [CrossRef]
  21. Custodio, E.; Andreu-Rodes, J.M.; Aragón, R.; Estrela, T.; Ferrer, J.; García-Aróstegui, J.L.; Manzano, M.; Rodríguez-Hernández, L.; Sahuquillo, A.; del Villar, A. Groundwater Intensive Use and Mining in South-Eastern Peninsular Spain: Hydrogeological, Economic and Social Aspects. Sci. Total Environ. 2016, 559, 302–316. [Google Scholar] [CrossRef]
  22. Aznar-Sánchez, J.A.; Belmonte-Ureña, L.J.; Velasco-Muñoz, J.F.; Valera, D.L. Aquifer Sustainability and the Use of Desalinated Seawater for Greenhouse Irrigation in the Campo de Níjar, Southeast Spain. Int. J. Environ. Res. Public Health 2019, 16, 898. [Google Scholar] [CrossRef]
  23. Navas González, Á.; Hewitt, R.J.; Martínez-Vega, J. Green Infrastructure Mapping in Almeria Province (Spain) Using Geographical Information Systems and Multi-Criteria Evaluation. Land 2024, 13, 1916. [Google Scholar] [CrossRef]
  24. Reder, A.; Fedele, G.; Manco, I.; Cionni, I.; Terzi, S.; Mercogliano, P. Estimating Pros and Cons of Statistical Downscaling Based on EQM Bias Adjustment as a Complementary Method to Dynamical Downscaling. Sci. Rep. 2025, 15, 621. [Google Scholar] [CrossRef]
  25. Eyring, V.; Bony, S.; Meehl, G.A.; Senior, C.A.; Stevens, B.; Stouffer, R.J.; Taylor, K.E. Overview of the Coupled Model Intercomparison Project Phase 6 (CMIP6) Experimental Design and Organization. Geosci. Model Dev. 2016, 9, 1937–1958. [Google Scholar] [CrossRef]
  26. Ridal, M.; Bazile, E.; Le Moigne, P.; Randriamampianina, R.; Schimanke, S.; Andrae, U.; Berggren, L.; Brousseau, P.; Dahlgren, P.; Edvinsson, L.; et al. CERRA, the Copernicus European Regional Reanalysis System. Q. J. R. Meteorol. Soc. 2024, 150, 3385–3411. [Google Scholar] [CrossRef]
  27. Piani, C.; Weedon, G.P.; Best, M.; Gomes, S.M.; Viterbo, P.; Hagemann, S.; Haerter, J.O. Statistical Bias Correction of Global Simulated Daily Precipitation and Temperature for the Application of Hydrological Models. J. Hydrol. 2010, 395, 199–215. [Google Scholar] [CrossRef]
  28. Lafon, T.; Dadson, S.; Buys, G.; Prudhomme, C. Bias Correction of Daily Precipitation Simulated by a Regional Climate Model: A Comparison of Methods. Int. J. Climatol. 2013, 33, 1367–1381. [Google Scholar] [CrossRef]
  29. Westen, C.J.; Greiving, S. Multi-hazard risk assessment and decision making. In Environmental Hazards Methodologies for Risk Assessment and Management; IWA Publishing: London, UK, 2017; pp. 31–94. [Google Scholar] [CrossRef]
  30. Weng, X.; Yuan, C.; Li, X.; Li, H. Research on the Construction of a Risk Assessment Indicator System for Transportation Infrastructure Investment under Public–Private Partnership Model. Buildings 2024, 14, 1679. [Google Scholar] [CrossRef]
  31. Wang, W.-J.; Kim, D.; Han, H.; Kim, K.T.; Kim, S.; Kim, H.S. Flood Risk Assessment Using an Indicator-Based Approach Combined with Flood Risk Maps and Grid Data. J. Hydrol. 2023, 627, 130396. [Google Scholar] [CrossRef]
  32. Agulles, M.; Melo-Aguilar, C.; Jordà, G. Risk of Loss of Tourism Attractiveness in the Western Mediterranean under Climate Change. Front. Clim. 2022, 4, 1019892. [Google Scholar] [CrossRef]
  33. Menezes, J.A.; Confalonieri, U.; Madureira, A.P.; Duval, I.B.; dos Santos, R.B.; Margonari, C. Mapping Human Vulnerability to Climate Change in the Brazilian Amazon: The Construction of a Municipal Vulnerability Index. PLoS ONE 2018, 13, e0190808. [Google Scholar] [CrossRef]
  34. Yu, J.; Castellani, K.; Forysinski, K.; Gustafson, P.; Lu, J.; Peterson, E.; Tran, M.; Yao, A.; Zhao, J.; Brauer, M. Geospatial Indicators of Exposure, Sensitivity, and Adaptive Capacity to Assess Neighbourhood Variation in Vulnerability to Climate Change-Related Health Hazards. Environ. Health 2021, 20, 31. [Google Scholar] [CrossRef]
  35. Bündnis Entwicklung Hilft; Institute for International Law of Peace and Armed Conflict (IFHV), Ruhr University Bochum. WorldRiskReport 2021: WorldRiskIndex 2021. Focus—Social Protection. 2021. Available online: https://weltrisikobericht.de/wp-content/uploads/2021/09/WorldRiskReport_2021_Online.pdf (accessed on 20 June 2025).
  36. Field, C.B.; Barros, V.; Stocker, T.F.; Dahe, Q.; Dokken, D.J.; Ebi, K.L.; Mastrandrea, M.D.; Mach, K.J.; Plattner, G.K.; Allen, S.K.; et al. Managing the Risks of Extreme Events and Disasters to Advance Climate Change Adaptation; A Special Report of Working Groups I and II of the Intergovernmental Panel on Climate Change (IPCC); Cambridge University Press: Cambridge, UK, 2012; pp. 1–582. Available online: https://www.ipcc.ch/report/managing-the-risks-of-extreme-events-and-disasters-to-advance-climate-change-adaptation/ (accessed on 2 July 2025).
  37. OECD. National Risk Assessments: A Cross Country Perspective; OECD Publishing: Paris, France, 2018. [CrossRef]
  38. Kim, Y.-H.; Min, S.-K.; Zhang, X.; Sandstad, M. Evaluation of the CMIP6 Multi-Model Ensemble for Climate Extreme Indices. Weather. Clim. Extrem. 2020, 28, 100269. [Google Scholar] [CrossRef]
  39. Jebeile, J.; Crucifix, M. Multi-model ensembles in climate science: Mathematical structures and expert judgements. Stud. Hist. Philos. Sci. Part A 2020, 81, 142–157. [Google Scholar] [CrossRef]
  40. Snyder, A.; Prime, N.; Tebaldi, C.; Dorheim, K. Quantifying uncertainty in climate projections with multi-model ensembles. Earth Syst. Dyn. 2024, 15, 1301–1318. [Google Scholar] [CrossRef]
  41. Evin, G.; Ribes, A.; Corre, L. Assessing CMIP6 uncertainties at global warming levels. Clim. Dyn. 2024, 62, 123–145. [Google Scholar] [CrossRef]
  42. Falloon, P.; Challinor, A.; Dessai, S.; Hoang, L.; Johnson, J.; Koehler, A.-K. Ensembles and uncertainty in climate change impacts. Front. Environ. Sci. 2014, 2, 33. [Google Scholar] [CrossRef]
  43. Ciobotaru, A.-M.; Patel, N.; Pintilii, R.-D. Tree Cover Loss in the Mediterranean Region—An Increasingly Serious Environmental Issue. Forests 2021, 12, 1341. [Google Scholar] [CrossRef]
  44. Navarro Rodríguez, P. Energías Renovables y Sostenibilidad en la Provincia de Almería: Régimen Jurídico, Infraestructuras y Planes de Optimización Energética; Instituto de estudios Almerienses, Diputación de Almería: Almería, Spain, 2014. [Google Scholar]
  45. Junquera, V.; Rubenstein, D.I.; Levin, S.A.; Hormaza, J.I.; Vadillo Pérez, I.; Jiménez Gavilán, P. Hydrological Collapse in Southern Spain under Expanding Irrigated Agriculture: Meteorological, Hydrological, and Structural Drought. arXiv 2024. [Google Scholar] [CrossRef]
  46. Adger, W.N.; Revi, A.; Parnell, S.; Archer van Garderen, E.; Bai, X.; Barau, A.S.; Birkmann, J.; Campos, M.; Chanza, N.; Colenbrander, S.; et al. Urban Systems and Settlements. In Climate Change 2022: Impacts, Adaptation and Vulnerability. Contribution of Working Group II to the Sixth Assessment Report of the Intergovernmental Panel on Climate Change; Pörtner, H.-O., Roberts, D.C., Tignor, M., Poloczanska, E.S., Mintenbeck, K., Alegría, A., Craig, M., Langsdorf, S., Löschke, S., Möller, V., et al., Eds.; Cambridge University Press: Cambridge, UK; New York, NY, USA, 2022; Chapter 4; Available online: https://www.ipcc.ch/report/ar6/wg2/chapter/chapter-4/ (accessed on 2 July 2025).
  47. Nofal, O.; Lindt, J. Understanding flood risk in the context of community resilience modeling for the built environment: Research needs and trends. Sustain. Resilient Infrastruct. 2020, 7, 171–187. [Google Scholar] [CrossRef]
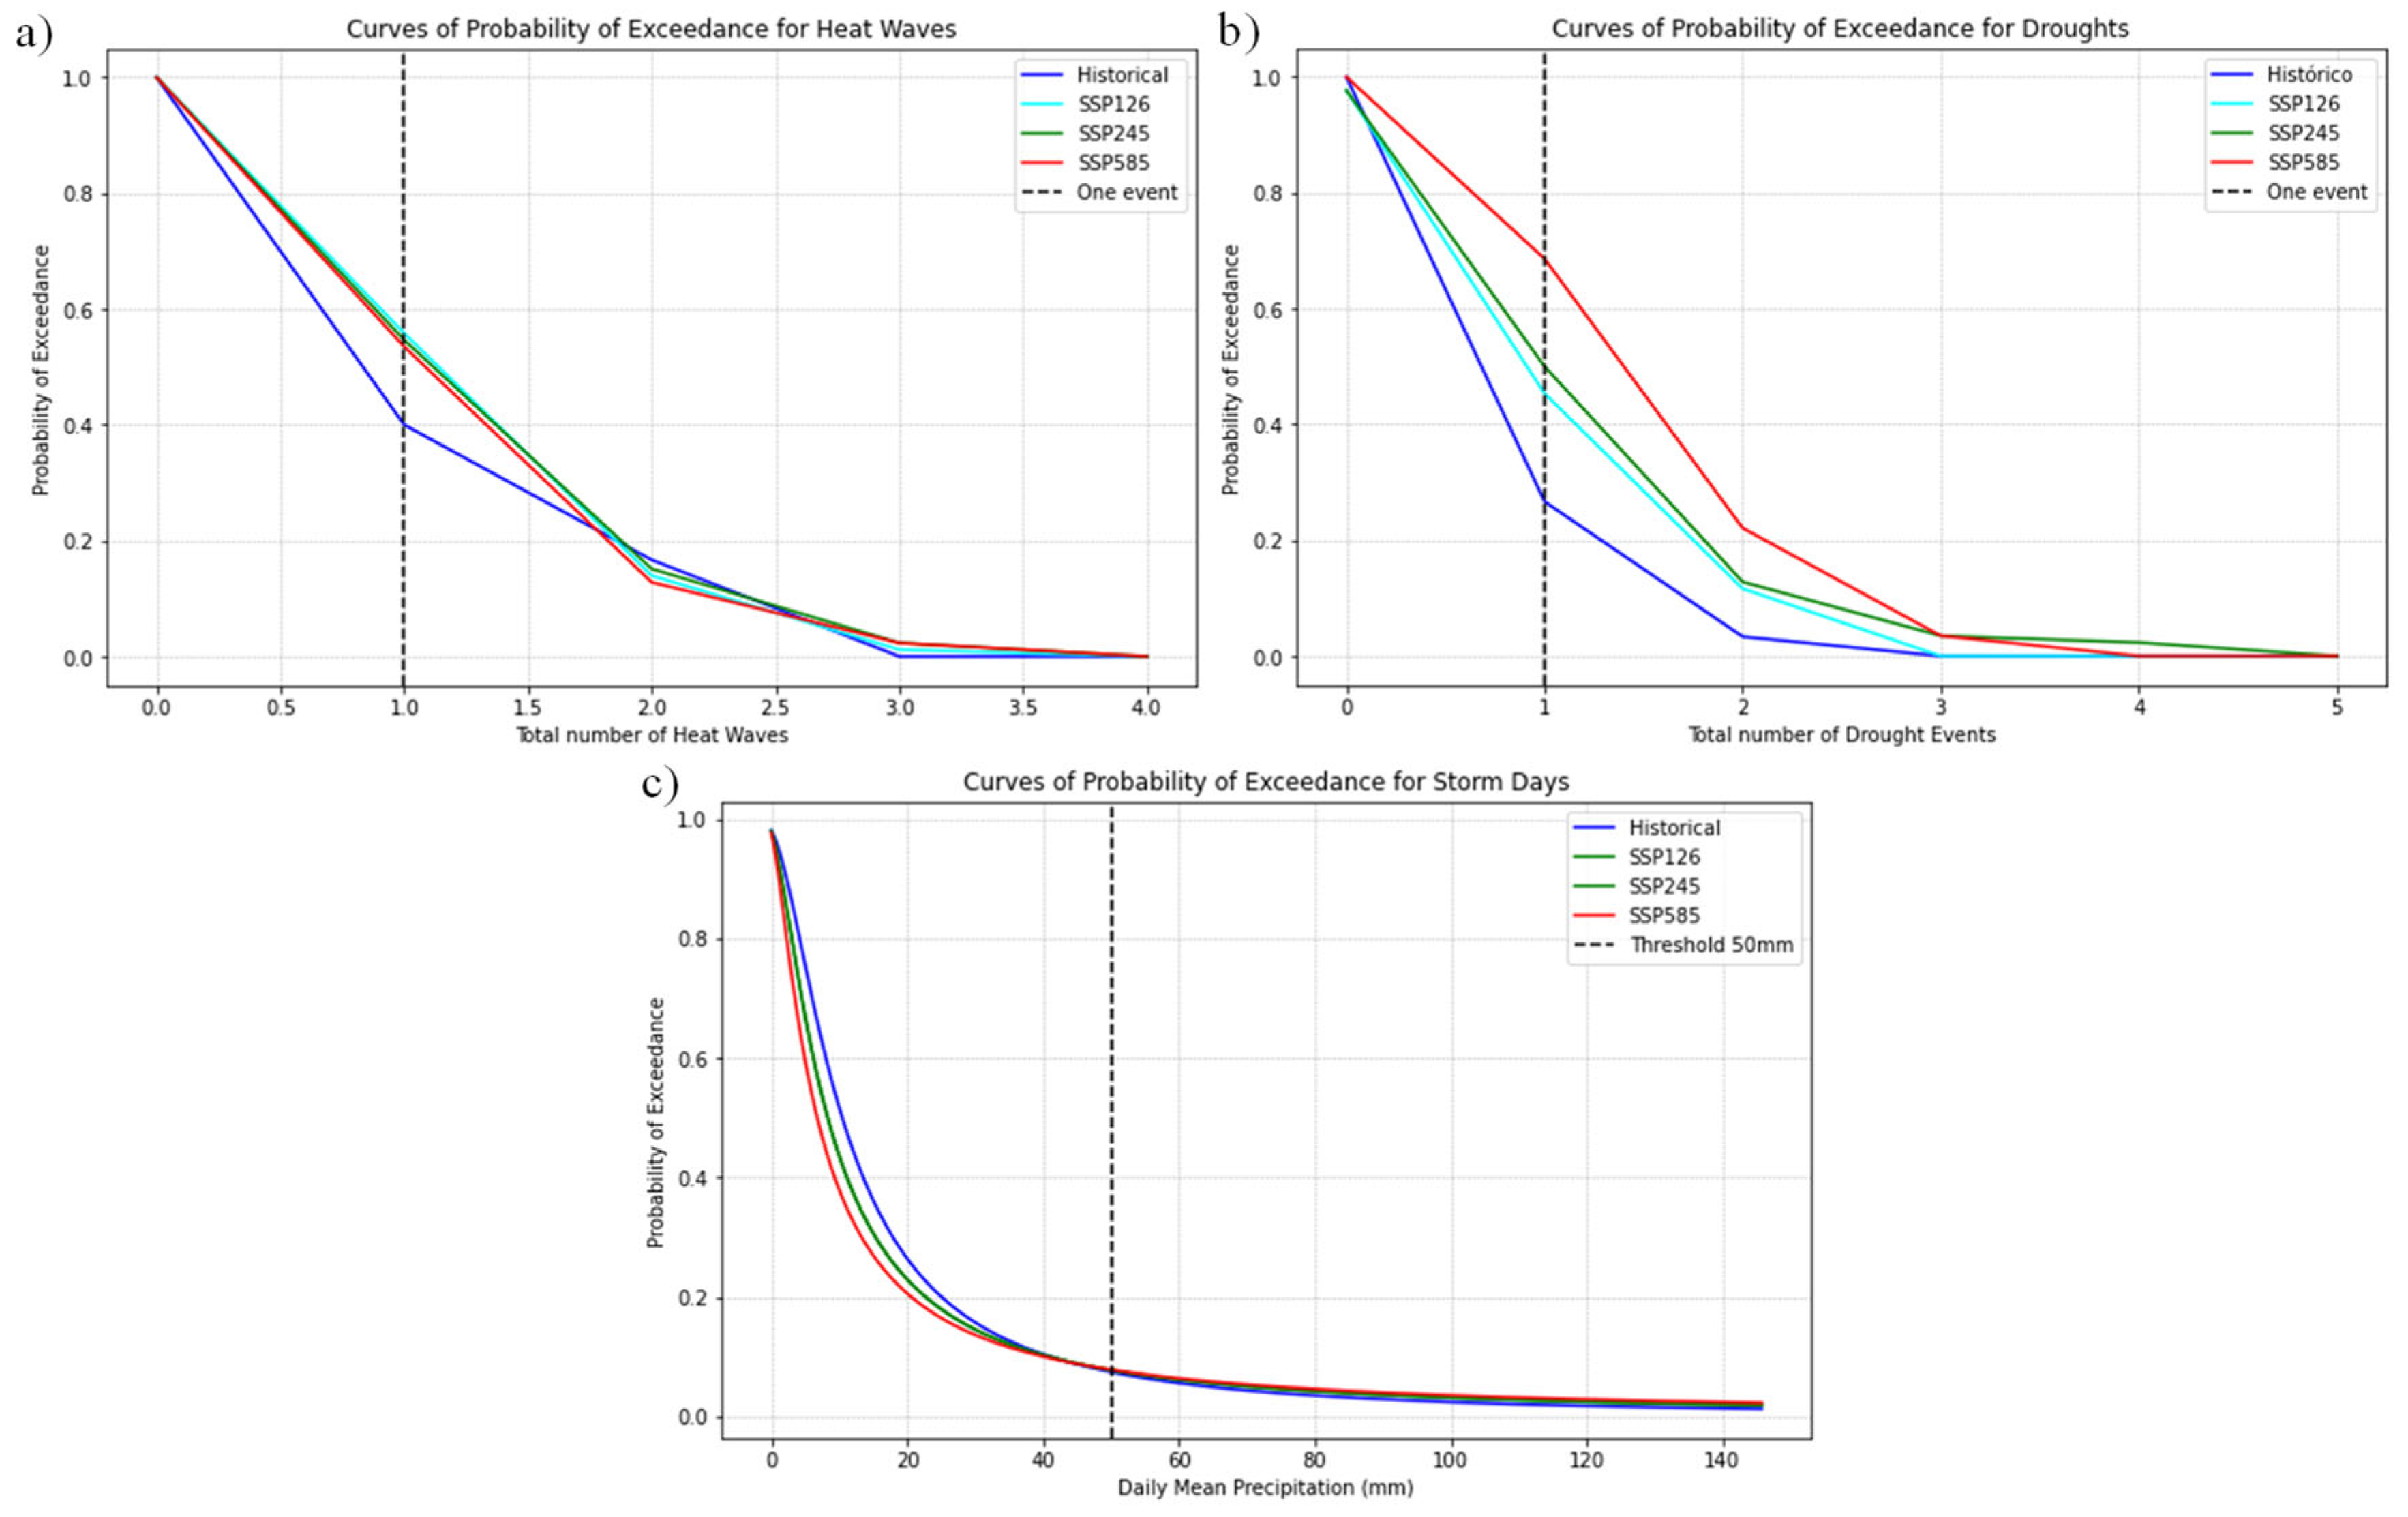
Figure 1. Map of the municipalities in Almería with each unique identification number (ID) listed in Table A1 of Appendix A.1, and grouped by population density and territorial characteristics as Coastal and Densely Populated areas, Rainfed Agricultural and Moderately Populated areas, and Mountainous and Sparsely Populated areas.
Climate 13 00141 g001
Figure 2. Statistical downscaling workflow.
Climate 13 00141 g002
Figure 3. Workflow of the quantification and mapping of Risk and its components.
Climate 13 00141 g003
Figure 4. Temperature in Almería under different climate scenarios.
Climate 13 00141 g004
Figure 5. Precipitation in Almería under different climate scenarios.
Climate 13 00141 g005
Figure 6. Exceedance probability of heatwaves (a), droughts (b) and storms (c) in Almería.
Climate 13 00141 g006
Figure 7. Exposure maps of each sector and the average values of all the sectors in each municipality of the Almería province.
Climate 13 00141 g007
Figure 9. Percentage of municipalities in Coastal and Densely Populated areas, Rainfed Agricultural and Moderately Populated areas, and Mountainous and Sparsely Populated areas with low, medium, and high heatwave risk levels, by scenario and sector.
Climate 13 00141 g009
Figure 10. Percentage of municipalities in Coastal and Densely Populated areas, Rainfed Agricultural and Moderately Populated areas, and Mountainous and Sparsely Populated areas with low, medium, and high drought risk levels, by scenario and sector.
Climate 13 00141 g010
Figure 11. Percentage of municipalities in Coastal and Densely Populated areas, Rainfed Agricultural and Moderately Populated areas, and Mountainous and Sparsely Populated areas with low, medium, and high storm risk levels, by scenario and sector.
Climate 13 00141 g011
Table 1. Selected hazards for Almería province including the description and calculation threshold.
HazardDescription
Heatwave5 consecutive days with Maximum Temperature higher than the 90th percentile of a reference period
DroughtAt least 30 consecutive days without precipitation
StormNumber of days with Precipitation higher than 50 mm
Table 2. Exceedance probabilities for the selected hazards in Almería.
ScenarioProbability of Exceedance for Heatwaves (%)Probability of Exceendance for Droughts (%)Probability of Exceedance for Storms (%)
Historical40.026.77.4
SSP1-2.655.845.47.7
SSP2-4.554.750.07.7
SSP5-8.553.568.67.8
Table 3. Multi-hazards probabilities for Almería province.
Multi-Hazards ProbabilityHeatwaveDroughtStorm
Heatwave-SSP126: 25.3 %
SSP245: 27.3 %
SSP585: 36.7 %
X
DroughtSSP126: 25.3 %
SSP245: 27.3 %
SSP585: 36.7 %
-X
StormXX-
Disclaimer/Publisher’s Note: The statements, opinions and data contained in all publications are solely those of the individual author(s) and contributor(s) and not of MDPI and/or the editor(s). MDPI and/or the editor(s) disclaim responsibility for any injury to people or property resulting from any ideas, methods, instructions or products referred to in the content.

