


Abstract
During fermentation, bacterial and fungal species synthesize substrate-specific enzymes to obtain nutrients. During this process, potential allergenic products, including immunologically important gluten peptides, can be created. Current protocols for assessing the levels of these peptides often overlook the specific gluten source. In this study, wheat sources provided by commercial enzyme suppliers underwent gluten extraction before being pooled into a Complete Gluten Mix, which then underwent variations of hydrolysis utilizing the digestive enzymes, pepsin and trypsin complexes. The resulting gluten peptide profiles were examined using the Wes automated Western blot system to confirm the presence of small, immunologically relevant gluten peptides. These hydrolysates were further tested for suitability as a relevant calibrant against commercially available ELISA standards. The PT3 calibrant, a hydrolyzed version of the Complete Gluten Mix, was found to be the most suitable, as it contained <50 kDa gluten peptides and gave similar absorbance readings to the majority of ELISA kit standards tested, and overlaid the GlutenTox® Competitive G12 antibody calibration curve, which was designed against the 33-mer immunogenic peptide from wheat. Additionally, no gluten bands were observed on the Wes for the enzymes of interest, which was confirmed through ELISA analysis.
Keywords:
gluten; fermentation; hydrolysis; calibrant; supplemental enzymes; automated Western blot; ELISA 1. Introduction
The term “gluten” refers to a collection of storage proteins found in cereal grains, including wheat, rye, barley, and oats [1]. In wheat, gluten proteins are comprised of gliadin and glutenin, which constitute 85–90% of the entire protein content of the wheat kernel (or “berry”), with albumin and globulin (the water/salt-soluble fraction) making up the remaining 10–15% protein content [1]. The ratio of gliadins to glutenins is often estimated at 1:1 in Triticum aestivum-derived wheat, also referred to as “common wheat” due to this species comprising 95% of the wheat produced worldwide [2]. Gliadins and glutenins both contain high concentrations of the amino acids glutamine (Q) and proline (P), but are classified separately due to a number of structural and chemical differences [3,4]. Gliadins from wheat belong to the larger prolamin storage protein group, with other members comprising hordein from barley, secalin from rye, and avenin from oats [5].
A portion of gluten proteins are capable of eliciting an adverse immune response in individuals, who are referred to as gluten intolerant [6]. Gluten intolerance generally refers to three major disorders: autoimmune celiac disease (CD), allergy to wheat, and non-celiac gluten sensitivity (NCGS), all of which have different underlying causes, markers for identification, and histopathological manifestations in the intestine [6]. When gluten-containing products are ingested, the larger proteins are only partially hydrolyzed by human digestive enzymes (pepsin, trypsin, and chymotrypsin), resulting in the production of small potentially immunogenic peptides within the intestines [7].
A number of important immunogenic gluten epitopes have been linked with gluten intolerance, with different specific peptides being implicated in different disorders [5,8,9,10]. In the cases of CD and NCGS, the only currently available effective treatment capable of healing intestinal damage is adopting a gluten-free diet (GFD), while wheat allergy management is achieved through dietary avoidance, although oral immunotherapy (OIT) also shows potential to an extent [6,11].
The US Food and Drug Administration’s (FDA) definition of a “gluten-free” product is one that has been prepared without any cereals containing gluten or one that has undergone processing or refining to remove the gluten content [12]. A gluten-free product can only be considered as such after analysis confirms a gluten content of less than 20 parts per million (ppm), meeting the tolerable daily intake (TDI) for sub-chronic and chronic exposure of 0.4 and 7.0 mg gluten/day, respectively [12,13,14]. For foods that have undergone fermentation, quantifying intact gluten within a hydrolyzed matrix is complex, and the use of routine analytical methods have led to inaccurate gluten readings [12,15]. Accurate gluten quantification is further complicated by the absence of appropriate fermented/hydrolyzed gluten standards that are accurately representative of the peptide profiles generated within that particular type of fermented food [12,15]. Thus, the FDA has ruled that fermented foods cannot be labeled “gluten-free”, and this ruling has extended to unintentionally include supplemental enzymes ingested by gluten-sensitive individuals for further hydrolysis and reduction of immunogenic gluten peptides [12].
This study aimed to determine whether gluten residues persist in processed enzyme preparations that are used as dietary supplements, but are originally derived from bacteria that are grown on a starting wheat substrate. In order to be more definitive, we selected the actual wheat sources that the tested enzymes are prepared with and created a concentrated blend with these wheat sources. From this we created a hydrolyzed gluten calibrant and were able to detect several gluten-containing components including one of approximately the same size as the well-documented 33-mer sensitizing protein using various antibodies. Subsequently, we assessed the gluten content of the complete gluten mix, the hydrolyzed calibrant, and enzyme preparations using ELISA and immunoblotting techniques, employing various commercially available gluten detection kits. These findings demonstrate that there is no gluten in the enzyme blends tested as there are no detectable bands in the automated Western blot system, while there were several bands in the actual wheat sources as expected. The findings from this work suggest that great care has to be taken in the selection of the antibody such that is selective for the original gluten sources, and further suggests that ELISA-based detection kits alone may not be sufficient to verify the absence of potentially sensitizing peptides. For future work with fermented food products, it is proposed that a combination of methodologies should be used to assess the presence of gluten and that the appropriate detection kits are used for the starting gluten-containing product.
2. Materials and Methods
2.1. Wheat Samples
Wheat samples used in this study originated from wheat brans, wheat germ, and wheat gluten flour, and were obtained from five companies as shown in Table A1.
2.2. Albumin and Globulin Removal
The entire extraction process of prolamins from wheat, including removal of albumin, globulin, some salts, and starch, was conducted based on the methods described by Schall et al., 2020 and patent ES 2 392 412 A1, with modifications (Appendix A) [16]. Five grams of a single wheat sample were added to a 50 mL centrifuge tube and made up to 40 mL with 0.4 M NaCl solution, followed by shaking and vortexing for 5 min at RT (Analog vortex mixer, FisherbrandTM, Pittsburg, PA, USA). The tubes were horizontally positioned and incubated at room temperature (RT) (20–23 °C) for shaking at 100 rpm for 10 min (222DS, Labnet Cary, NC, USA). The suspension was centrifuged at 2500 rpm for 10 min at RT (SorvallTM ST8, Thermo Scientific, Waltham, NA, USA), and the supernatant was removed through aspiration using serological pipette. The pellets were re-suspended in 0.4 M NaCl, and the supernatant was removed in the same manner [16].
2.3. Salt and Starch Removal
Following albumin and globulin removal, pellets were suspended in 40 mL autoclaved tap water to remove residual salt and some starch. The suspension was incubated at RT, shaking (100 rpm) for 10 min. The samples were pelleted via centrifugation (2500 rpm for 10 min at RT) and aspiration of the supernatant. The procedure for removal of salts and starch was repeated once more [16]. Prior to gluten extraction, the pellets were washed two times with 40 mL sterile deionized water (DI-H2O) with shaking (100 rpm) for 5 min at RT, followed by centrifugation at 2500 rpm for 10 min at RT.
2.4. Gluten Extraction
The extraction of prolamins from the 11 pellets was based on patent ES 2 392 412 A1. Each pellet was evenly suspended with 40 mL of 0.5 M L-arginine (Thermo Fisher Scientific #A15738, Norcross, GA, USA) containing 0.1% bronidox (TCI America #B3156, Portland, OR, USA). The suspension was incubated in a water bath at 50 °C for 40 min (IsoTemp Deluxe, FisherbrandTM, Pittsburg, PA, USA), with periodic vortexing for one minute every 10 min. The suspension was centrifuged at 2500 rpm for 10 min at RT, and the supernatant was removed by aspiration. The pellets were suspended in 60% ethanol and incubated, shaking (100 rpm), at 30 °C for 1 h (patent ES 2 392 412 A1, see Appendix A). After centrifugation at 8500 rpm for 10 min at RT, the supernatant was aspirated and transferred into a new tube.
2.5. Determination of Protein Concentration
Throughout this study, protein concentrations were determined using the PierceTM BCA Protein Assay kit (Thermo Fisher Scientific #23227, Norcross, GA, USA). The assay was conducted by two researchers with duplicated samples and three trials per person. BCA protein concentrations were calculated using three standard curves: linear as the protocol (Appendix A), polynomial, and logarithmic. Each protein concentration was determined by the averaged value after the outliers were removed by applying the method of Iglewicz and Hoaglin outlier determination (threshold of z-score = 1.5) [17].
2.6. Preparation of Complete Gluten Mix and Dialysis
Following extraction and measurement of protein concentration, all 11 extracts were diluted to match the protein concentration of the extract with the lowest measured protein level (2.0~2.2 mg/mL), using an autoclaved acidic buffer solution (PH2.0) as the diluent. PH2.0 was the buffer solution made of DI-H2O with pH adjusted to 2.0 using 85% O-phosphoric acid. Initially, 25 mL of each diluted extract was mixed in an autoclaved Duran bottle to give the Complete Gluten Mix (CGM). Four identical pieces of dialysis tubing (approximately 20 cm in length) (FisherbrandTM #S25645C, Pittsburg, PA, USA) were wet with PH2.0 solution, and 30 mL of the CGM was transferred to each tube. The CGM was dialyzed against PH2.0 by stirring at 150 rpm at RT (IsoTemp hotplate stirr, FisherbrandTM, Pittsburg, PA, USA) in 800 mL of PH2.0 for two 2 h incubations, followed by an overnight incubation (approximately 20 h), with fresh PH2.0 for each incubation. The four freshly dialyzed CGMs were mixed together in an autoclaved bottle. The protein concentration of the dialyzed CGM was determined with the BCA protein assay (1.2~1.5 mg/mL).
2.7. Hydrolysis of CGM Using Pepsin and Trypsin Complex
Pepsin 10x (≥10,000 FCC/mg) (13421) was obtained from Chongqing Quanxinxiangsheng Bio-Biopharmaceutical Co. (Chongqing, China), and the complex of trypsin (2400~7600 USP/mg) and chymotrypsin (400~800 USP/mg) (11611) was obtained from Sichuan Deebio Pharmaceutical Co. (Guanghan, China). The sequential hydrolysis using pepsin and the trypsin complex (PT-hydrolysis) was conducted according to the modified hydrolysis procedure [18]. The protein concentration of the mixed, dialyzed CGM was adjusted to 1.0 mg/mL with PH2.0. Initially, 20 mL of the CGM was added to a 50 mL centrifuge tube and 50 mL was added to a sterile 125 mL bottle. For pepsin hydrolysis, 10 mg/mL pepsin was prepared in PH2.0 and added to the 125 mL bottle for a final pepsin concentration of 25 µg/mL, while the corresponding volume of PH2.0 was added to the 50 mL tube to match the CGM concentration for an enzyme-free control. All tubes were incubated at 37 °C with shaking (80 rpm) for two hours in a horizontal position.
The pH of all solutions was increased to 8.0 with 70% NaOH. The pepsin-hydrolyzed CGM was divided into four 50 mL centrifuge tubes with 20 mL in each tube. The 10, 1, 0.1, or 0.01 mg/mL trypsin solution was added to make 30 (PT30), 3 (PT3), 0.3 (PT0.3), or 0.03 µg/mL (PT0.03) in the corresponding tube, while the corresponding volume of PBS (pH8.0) was added to the control tube containing CGM. All tubes were incubated at 37 °C, shaking (80 rpm), for one hour in a horizontal position. Following pepsin–trypsin hydrolysis, all tubes were immediately incubated in a boiling bath (SBB Aqua 5 plus, Gran instruments Ltd., Beaver Falls, PA, USA) for 10 min to permanently inactivate the enzymes.
2.8. Preparation of Enzyme Samples for ELISA and Immunoblotting
For ELISA analysis, 0.25 g of each supplemental enzyme (ENZ) was suspended in 1 mL of autoclaved MilliQ H2O in a 50 mL centrifuge tube and vortexed at 3000 rpm until the mixture was uniform (minimum 30 s). The solutions were then centrifuged at 10,000 rpm at RT for 1 min, followed by additional vortexing at 3000 rpm if no longer uniform. All ENZ solutions were then incubated in boiling H2O (100 °C) for 30 min. Following heat-inactivation, ENZ solutions were allowed to cool to RT. For ENZs that underwent a consistency change during inactivation, a sterile metal spatula was used to physically break apart the jelly/gel formation and scrape the jelly/gel off of the sides of the tube to allow better overall exposure to the extraction Solution. Gluten extraction was then performed as per the ELISA kit instructions, with some modifications (Table A2). Gluten concentration in each ELISA was calculated as per the manufacturer’s instructions.
For immunoblotting, one gram of each ENZ was suspended in 2.5 mL of 0.5 M L-arginine in a 50 mL tube. The tubes were incubated in a boiling bath for 30 min, vortexed for 10 s, and cooled at RT. Then, 60% ethanol was added to 10 mL (100 mg/mL in total), and the tubes were vortexed for at least 30 s to be evenly suspended. The tubes were incubated at 30 °C with 100 rpm for one hour in a horizontal position. After centrifugation (8500 rpm for 10 min), the supernatant was transferred into a new tube and stored at 4 °C until used. To completely liquefy, it was necessary that the extracted samples were incubated at 50 °C for 10 min just before use.
2.9. Commercial ELISAs
The concentrations of gluten in each ENZ extract were determined through use of the following ELISAs, as per the manufacturer’s instructions, in duplicate wells: GlutenTox® Competitive G12 (KIT3012, Hygiena, New Castle, DE, USA), RIDASCREEN® Gliadin Competitive R5 (R7021, R-Biopharm AG, Darmstadt, Germany), Morinaga Wheat/Gluten ELISA MIoBS (M2103, Crystal Chem, Elk Grove Village, IL, USA), Aller-Tex Gluten ELISA Skerritt (510821, ELISA technologies Inc., Gainesville, FL, USA), Generation 3 Gluten Residue Detection Kit 2D4 (ESGLT3-48, ELISA Systems, Seattle, WA, USA), and Veratox® for Gliadin USDA (8480, Neogen®, Lansing, MI, USA). For the production of CGM, PT3, and PT0.3 standard curves, hydrolysates were diluted to reflect the same concentrations of the standards in each kit. When being used as the internal protein control (INC_PT3), 2X PT3 and 2X ENZ extract were combined in a 1:1 ratio to yield a PT3 concentration that fell within the range of each kit’s standard curve (Table A3). ENZ extract concentrations in the presence and absence of the INC_PT3 were the same.
2.10. Immunoblot Using Automated Capillary Electrophoretic-Based Immunoassay
Wes™ (ProteinSimple, 004-600, Bio-techne, Minneapolis, MN, USA), an automated immunoblot assay, was performed based on the protocol of WesTM and Nelson et al., 2017 [19]. In this Wes assay, 2–40 kDa or 12–230 kDa pre-filled plates containing separation matrices along with 25 capillary cartridges and premade reagents were used. For the analysis of PT-hydrolysis products or the ENZs, the six HRP-conjugated antibodies shown in Table A3 were applied. As the G12 antibody in the ELISA kit (Table A4) was embedded in the wells, we conjugated HRP to 200 ng/mL of G12 antibody using the Lightning-Link®HRP antibody labeling kit (Abcam #ab102890, Waltham, MA, USA) as per protocol (Appendix A).
For the analysis of PT-hydrolysis products, CGM, PT3, and PT0.3, hydrolysates were diluted to 400, 200, 40, and 20 µg/mL using 0.1x sample buffer. For the analysis of ENZs, the extracts were diluted to 10 mg/mL with 0.1x sample buffer. When being used as the internal protein control (INC_PT3), PT3 was diluted to 250 µg/mL with 0.1x sample buffer. As each ENZ extract was diluted to 2 mg/mL in INC_PT3 (ENZ_PT3) or 0.1x sample buffer, and the final concentration of PT3 became 200 or 0 µg/mL, respectively. Instead of ENZ extract, the 0.1x sample buffer was added to INC_PT3 to make 200 µg/mL of PT3 (PT3_200). The loading samples were made with addition of standard master mix (Appendix A) [19].
The 12–230 kDa separation module was used for the analysis of PT-hydrolysis products, while the 2–40 kDa separation module was used in the analysis of ENZs versus ENZ_PT3. HRP-conjugated antibodies were used at their given concentrations as per the ELISA kit or diluted with the antibody diluent as shown in Table A3. The loading samples, diluted (or undiluted) antibodies, the prepared ladders, and other reagents, as per the protocol, were dispensed into the corresponding wells in the corresponding assay plate. The capillary cartridge and assay plate were inserted into Wes, and after three-hour running time, the data from electropherogram and band images were collected and analyzed using Compass for SW (ver. 6.3.0) (Appendix A) [19].
3. Results
3.1. Wes Simple Western Protein Characterization of Selected Pepsin/Trypsin Hydrolysates
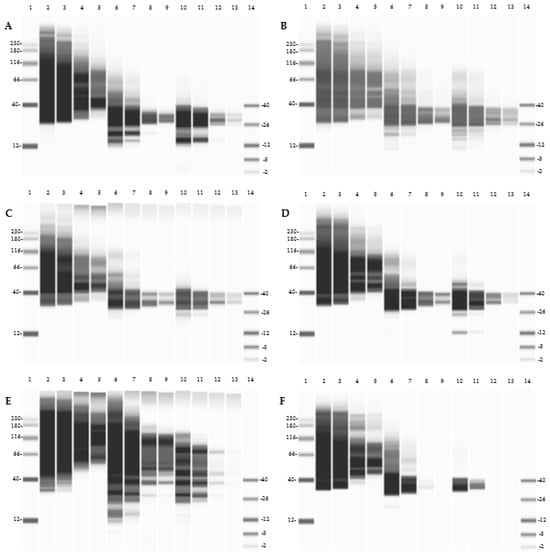
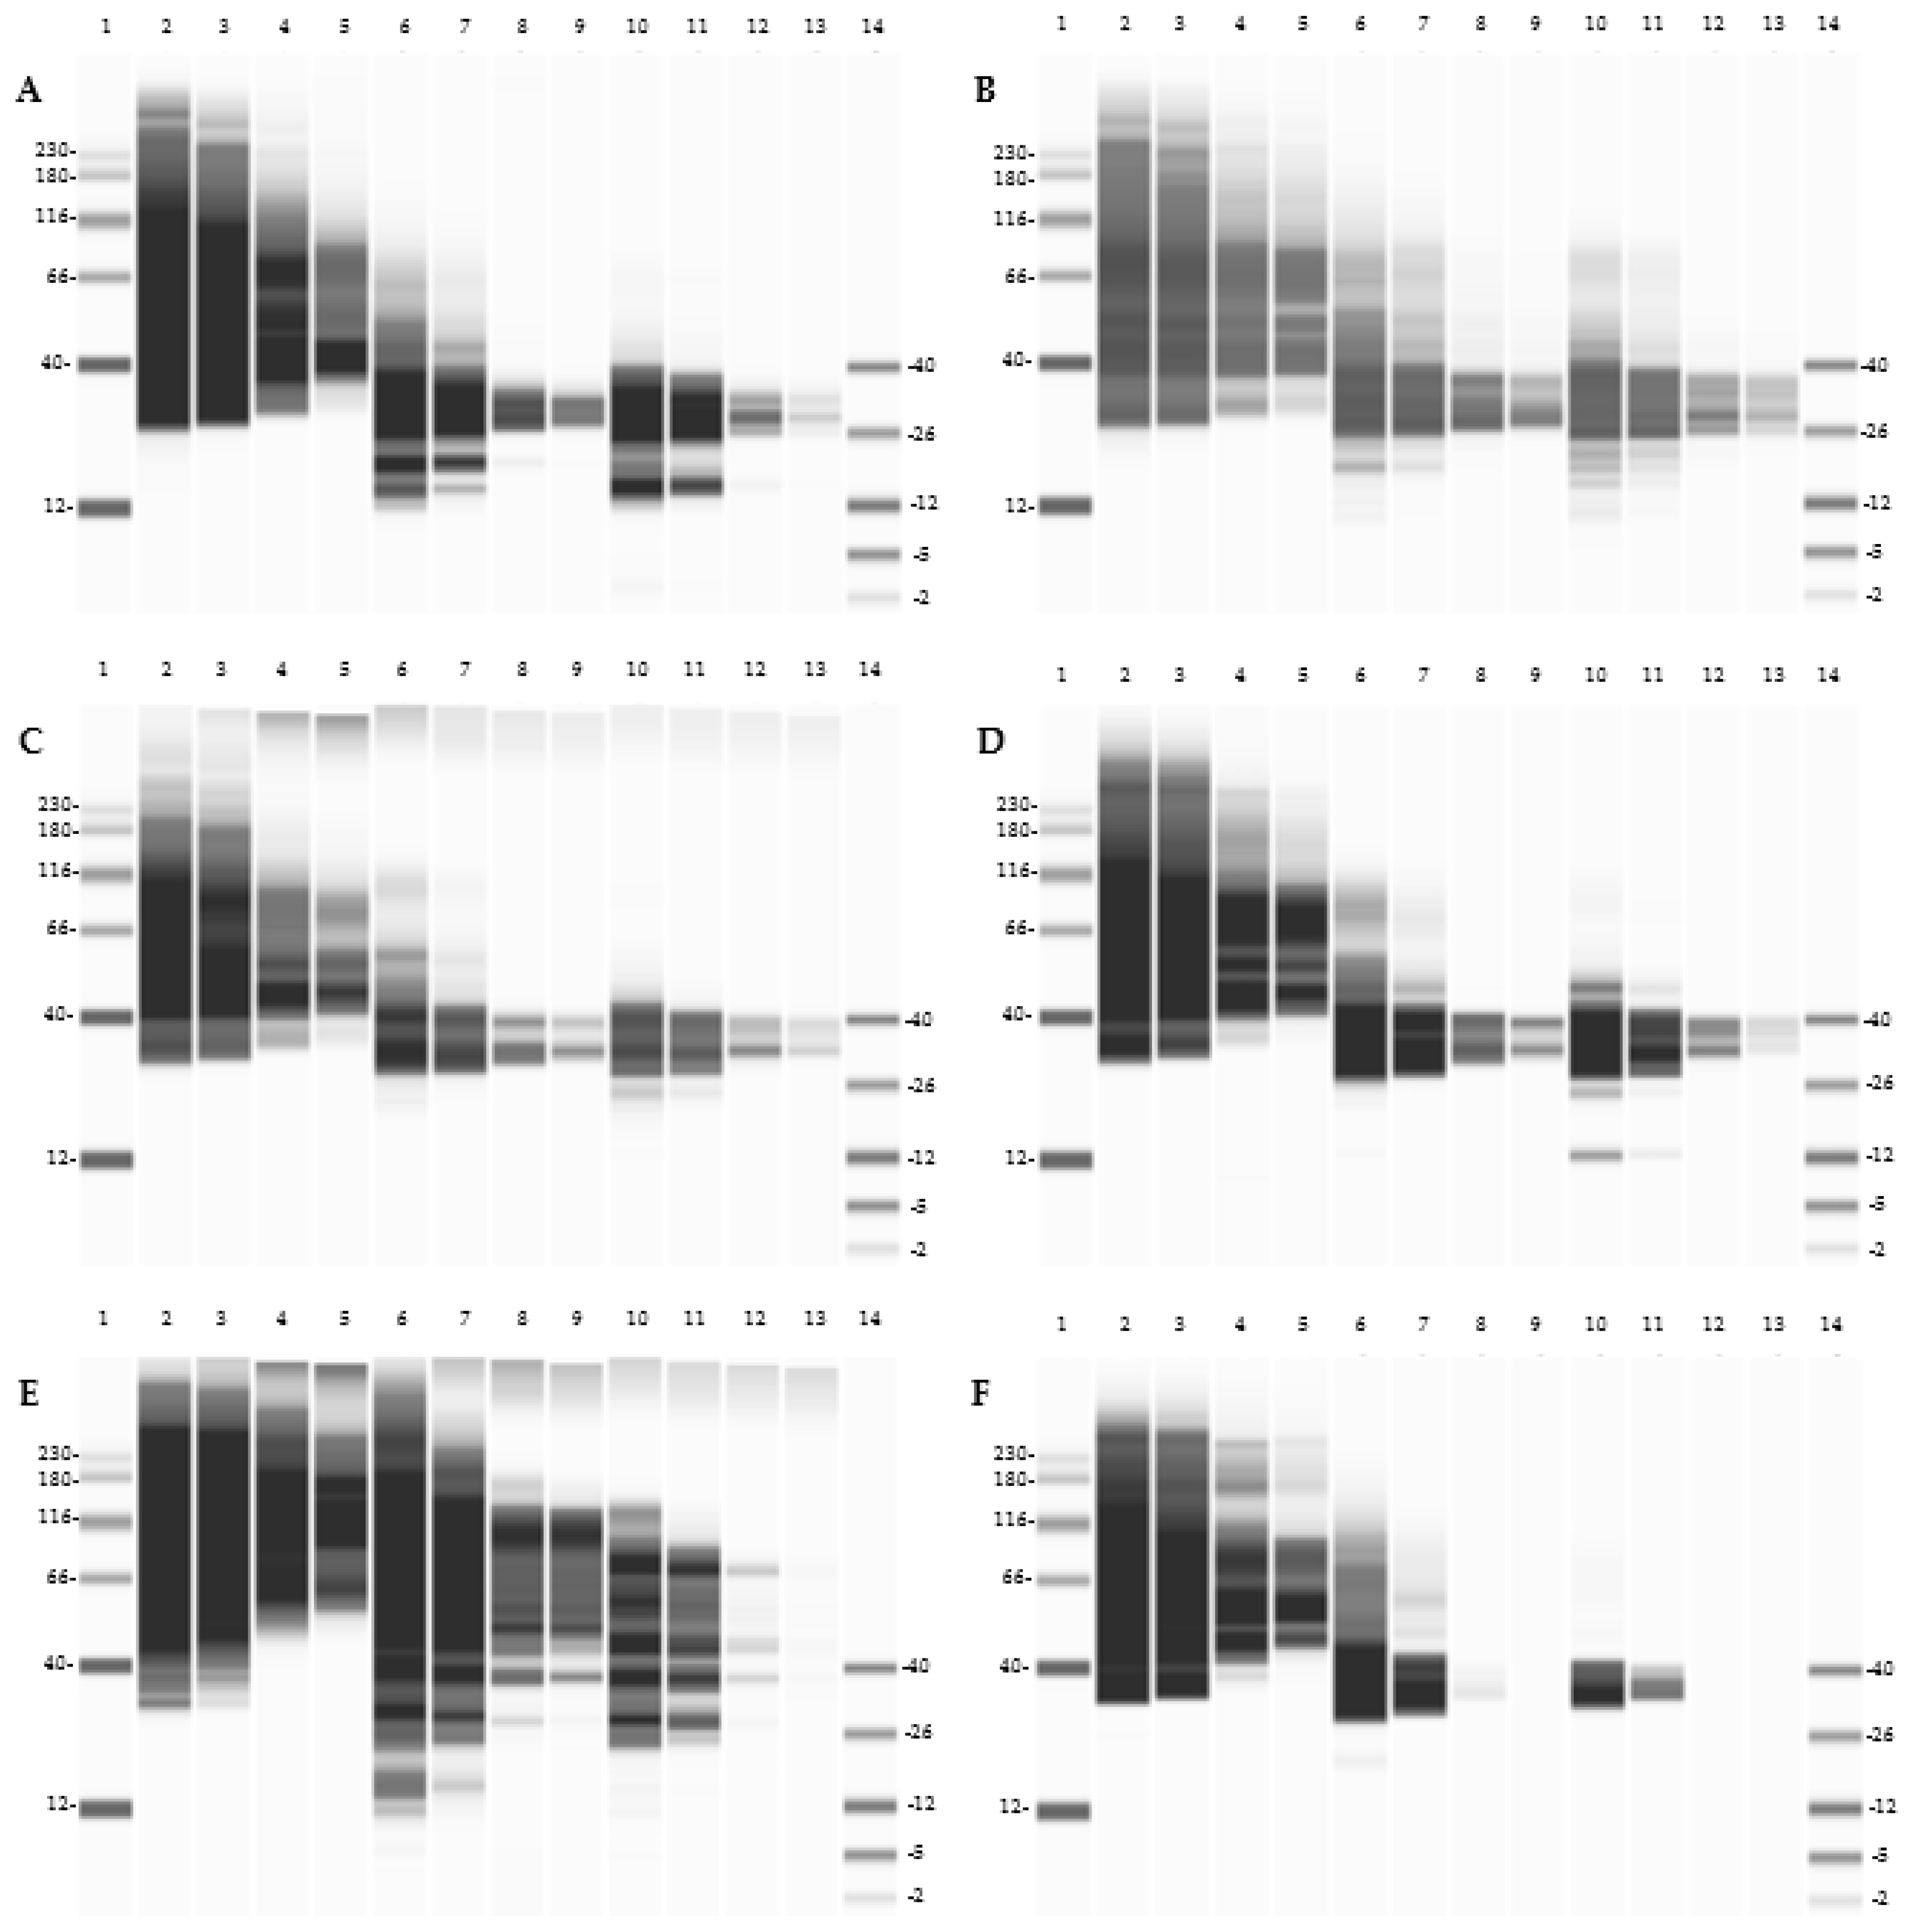
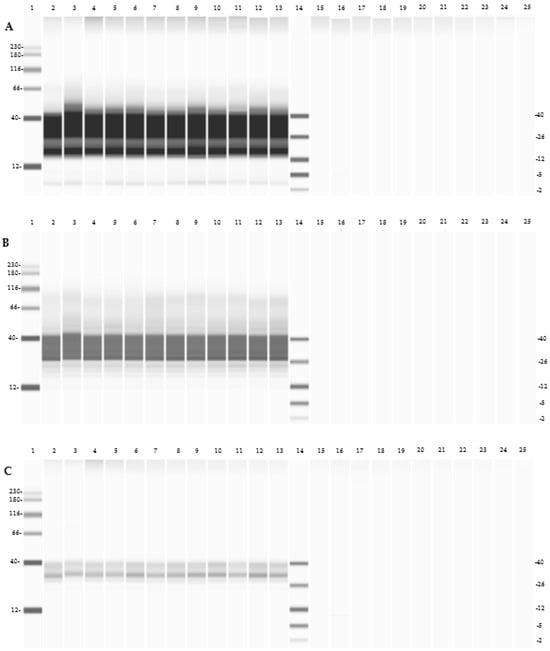
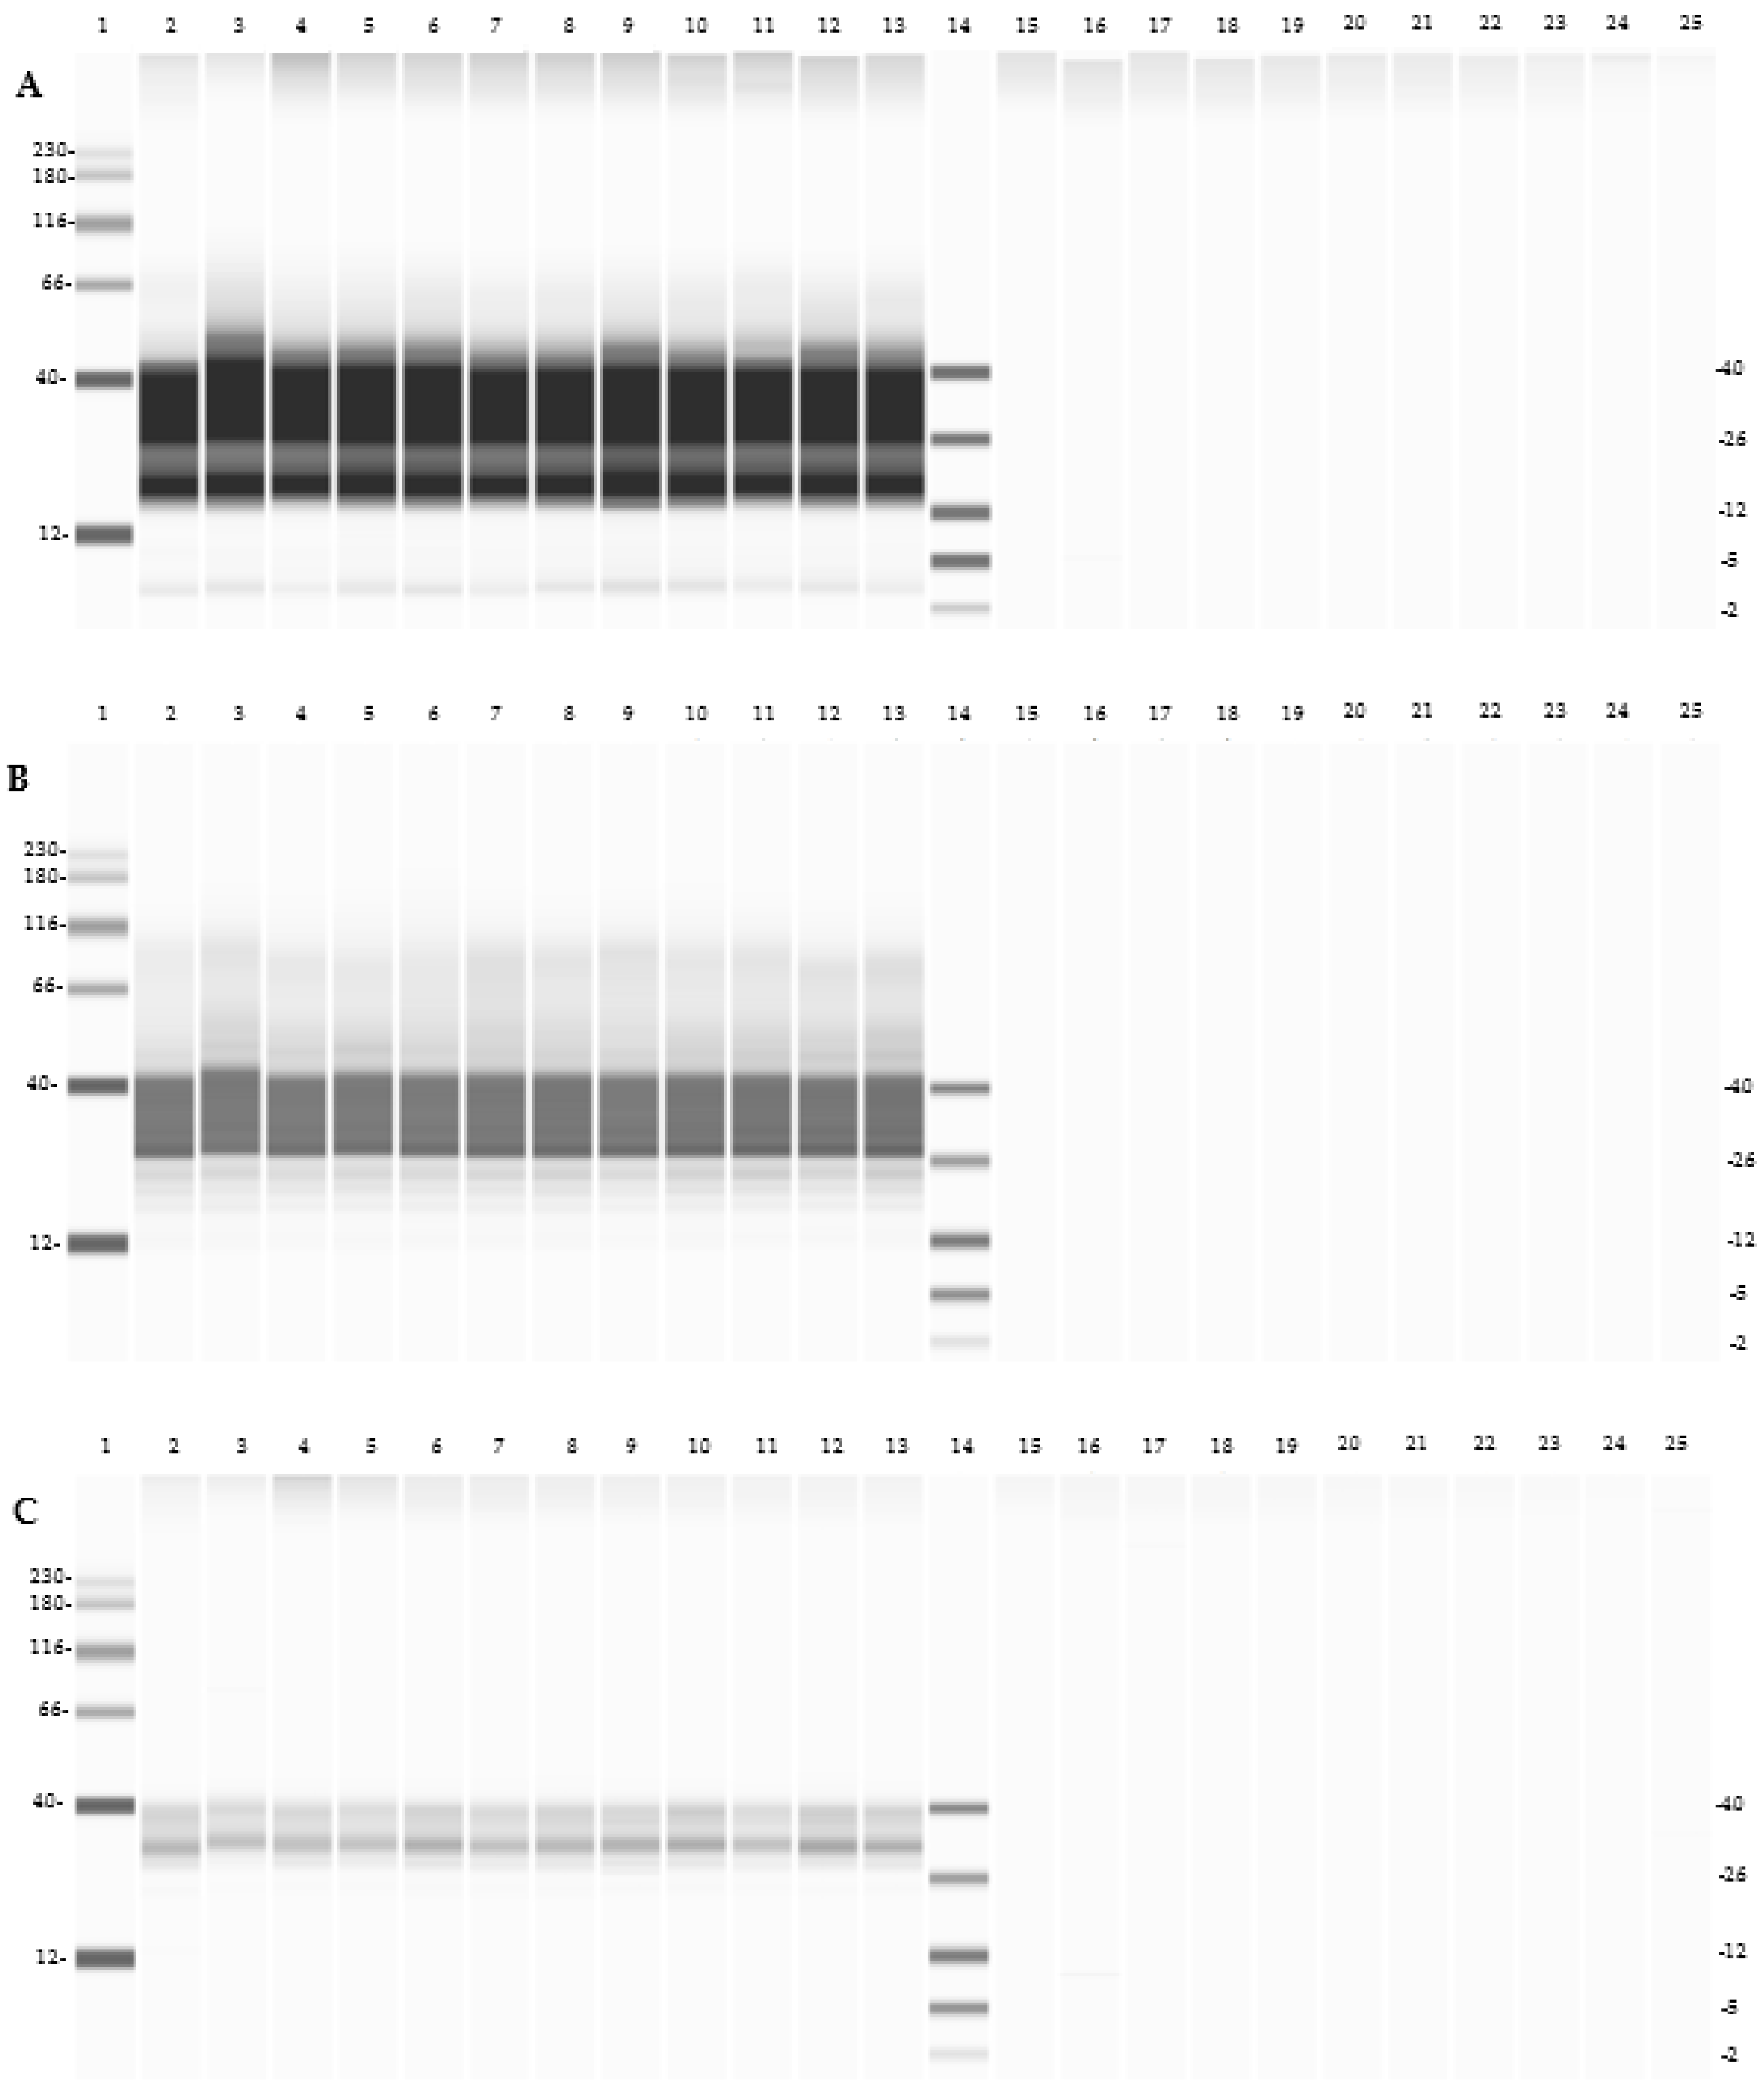
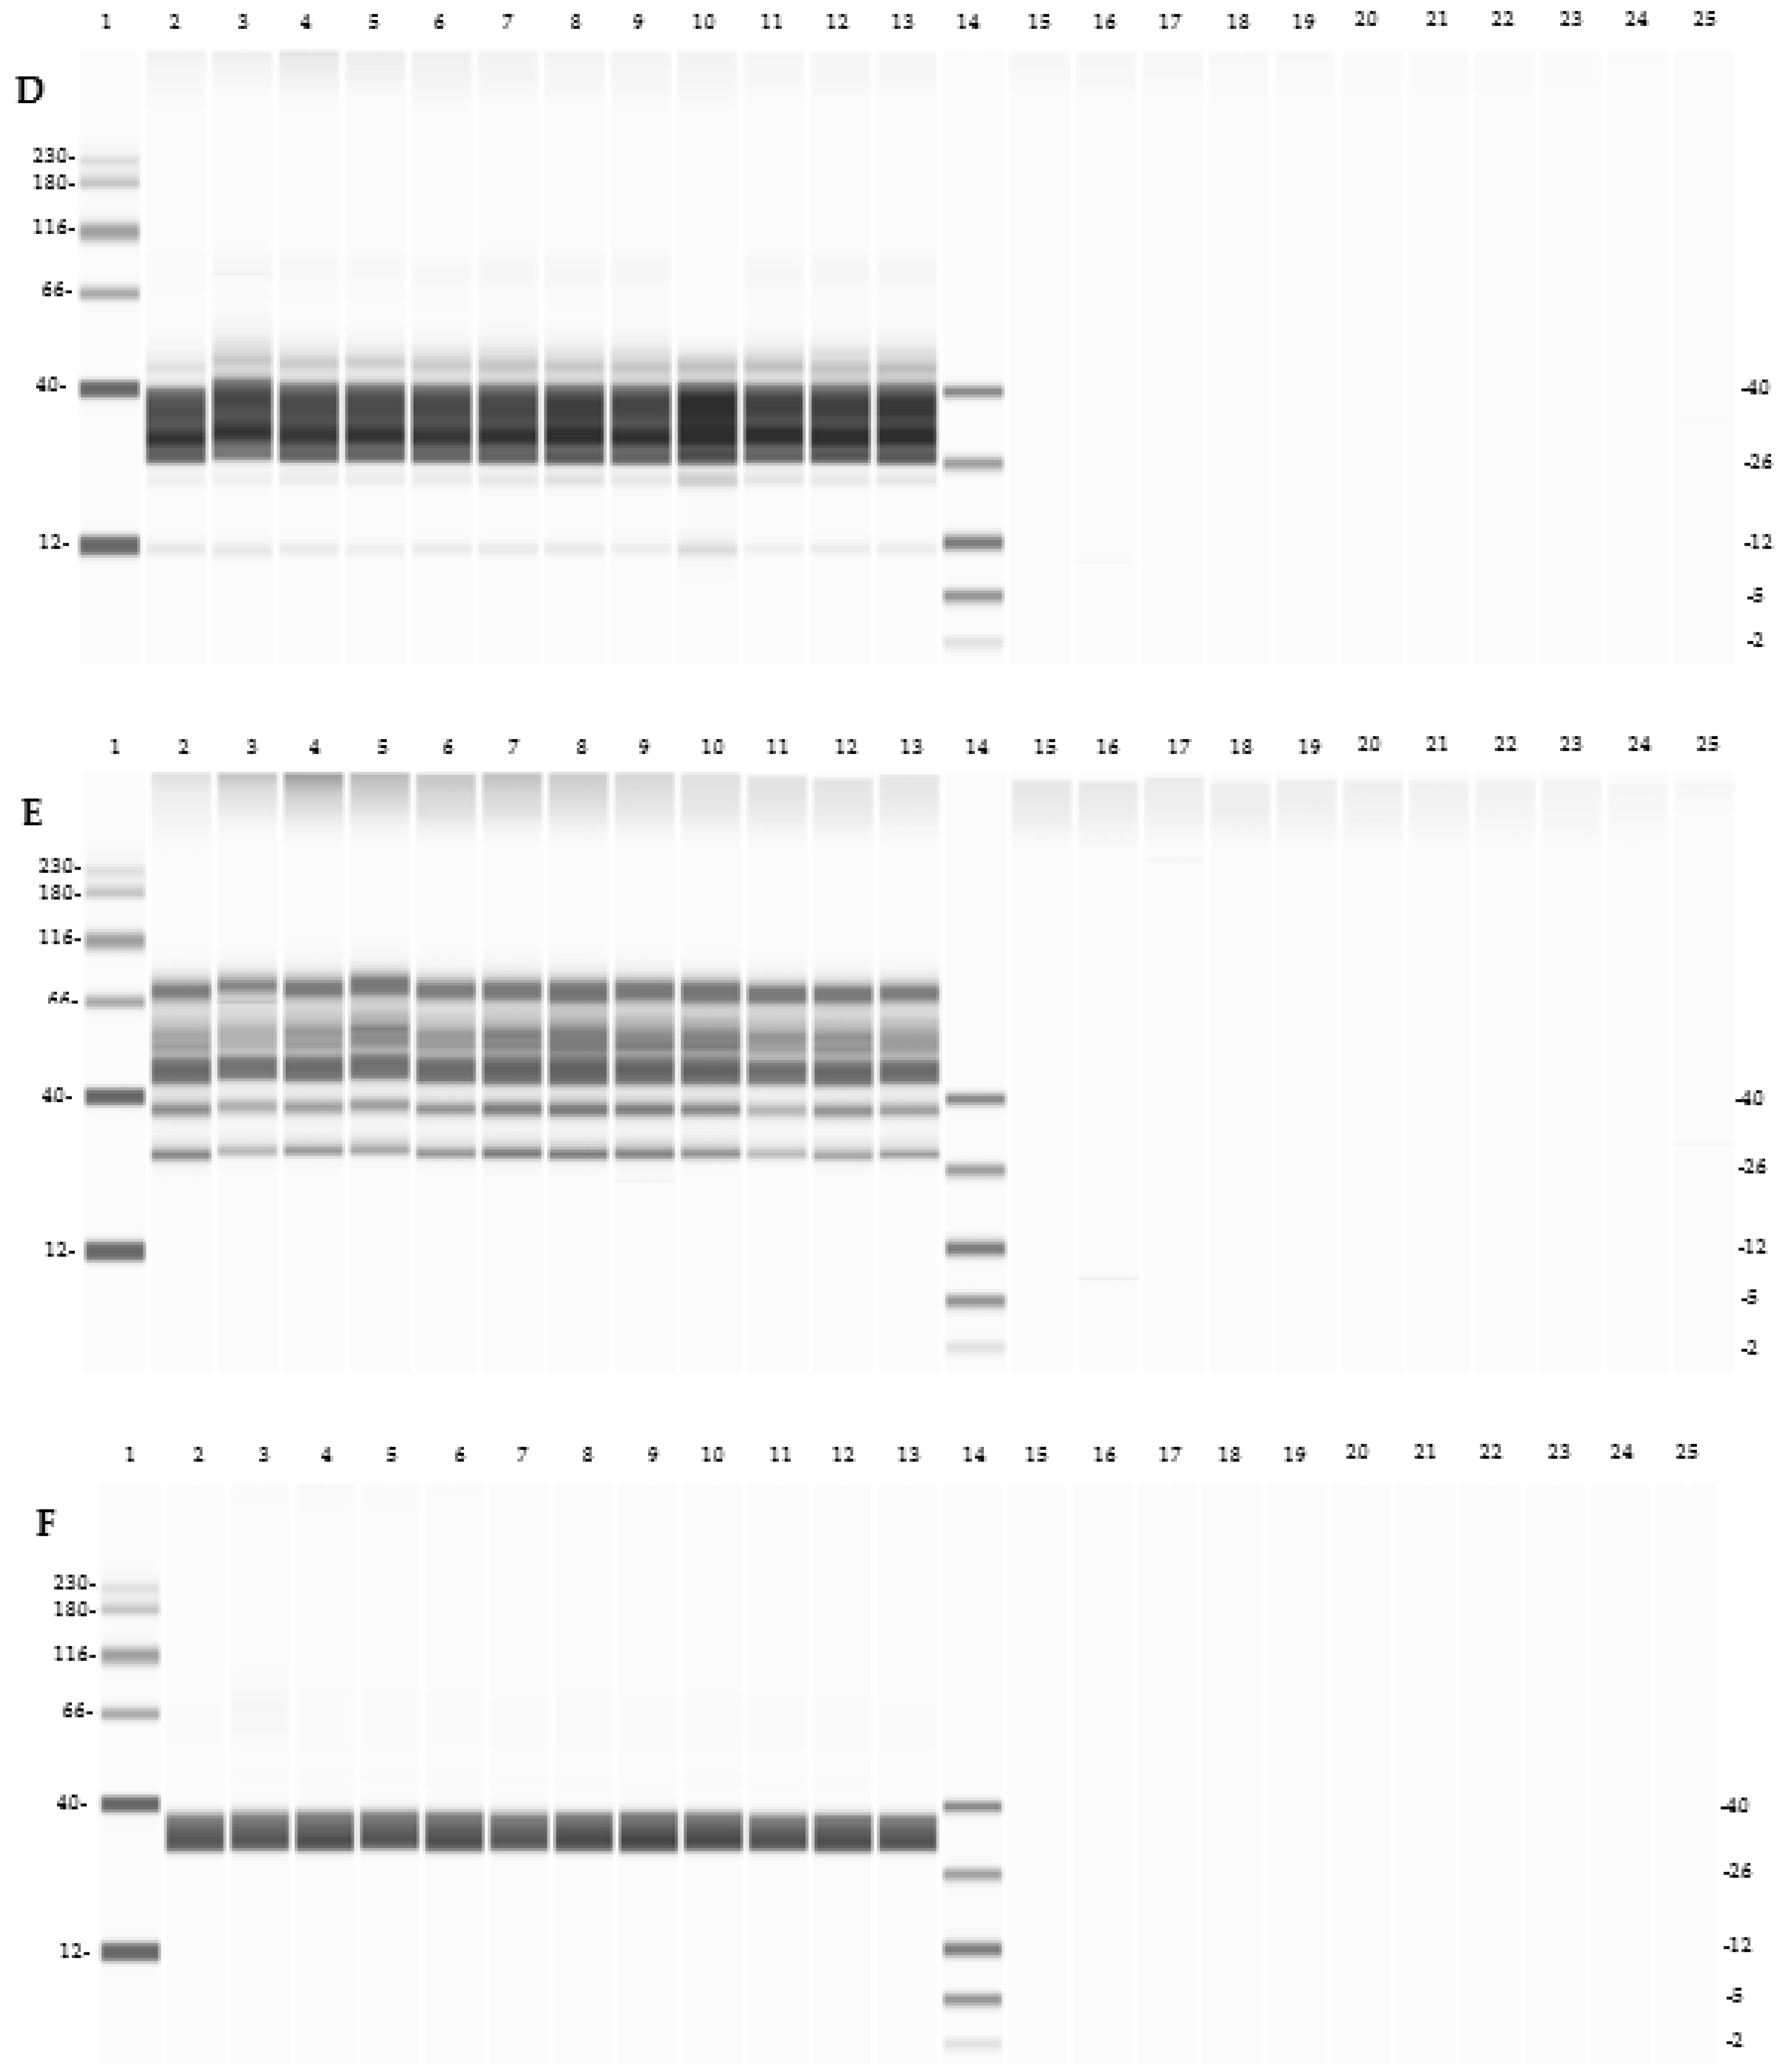
A Wes capillary electrophoresis approach was taken with two of the most promising calibrants, PT3 and PT0.3, as well as the CGM control that was not exposed to either the pepsin or trypsin complex. These three samples were run on 12–230 kDa separation modules at concentrations of 400, 200, 40, and 20 µg/mL (ppm). The inclusion of the CGM control aided visual confirmation of whether sufficient breakdown of gluten had occurred in the PT hydrolysate samples for accurate representation of the gluten breakdown that would occur during microbial fermentation and subsequent enzyme production. With the six different gluten-targeting antibodies, gluten bands were observed at lower kDa ranges than in the CGM control following hydrolysis (Figure 1). The differences in banding patterns for different antibodies can be seen between immunoblots.
Figure 1.
Wes banding patterns of CGM, PT0.3, and PT3 at concentrations of 400, 200, 40, and 20 µg/mL with (A) G12, (B) R5, (C) MIoBS, (D) 2D4, (E) Skerritt, and (F) USDA. Each figure represents images obtained at a high dynamic range of 4.0 in Wes with different contrast settings for visualization of low-signal-intensity proteins or peptide bands. Lane information for immunoblots: 1Molecular Weight Ladder (12–230 kDa); 2—400 µg/mL CGM; 3—200 µg/mL CGM; 4—40 µg/mL CGM; 5—20 µg/mL CGM; 6—400 µg/mL PT0.3; 7—200 µg/mL PT0.3; 8—40 µg/mL PT0.3, 9—20 µg/mL PT0.3; 10—400 µg/mL PT3; 11—200 µg/mL PT3; 12—40 µg/mL PT3; 13—20 µg/mL PT3; 14—Molecular Weight Ladder (2–40 kDa).
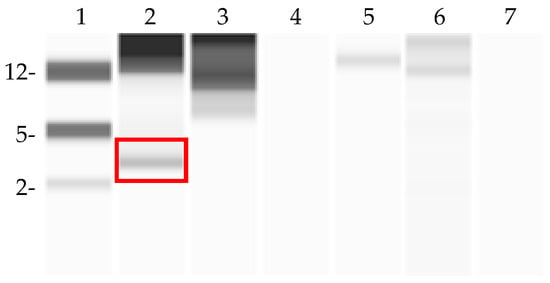
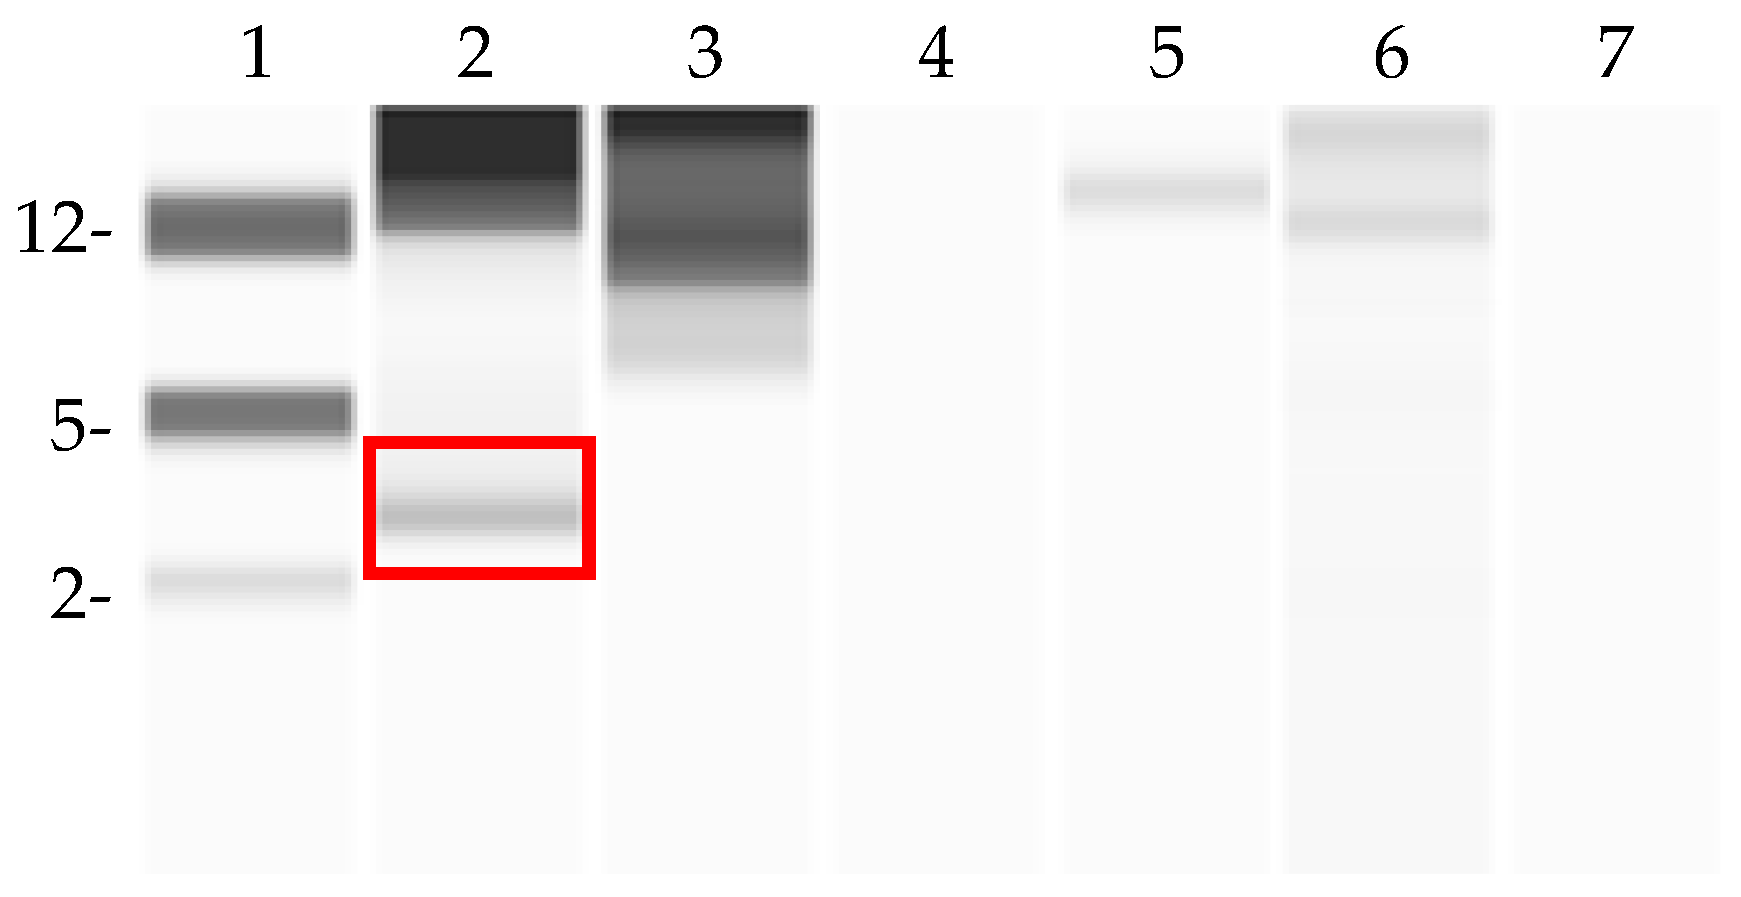
Additionally, when run on a 2–40 kDa cartridge for better resolution of the smaller bands, with the contrast parameter set to the maximum, a peptide band was observed in the PT3 sample at 400 µg/mL for the G12 antibody between the 2 and 5 kDa molecular weight markers (Figure 2). This may indicate the presence of the 33-mer (theoretical molecular weight of 3.9 kDa), a peptide that is highly stimulatory towards T-cells and is often referred to as the “most immunodominant” of gluten proteins, as the G12 antibody was produced specifically against a sequence within this α2-gliadin [20,21,22].
Figure 2.
Wes banding patterns of PT3 at 400 µg/mL after maximized contrast with all 6 gluten-targeting antibodies on a 2–40 kDa cartridge. The <5 kDa gluten peptide was only recognized by the G12 antibody as indicated in the highlighted box. Lane information for immunoblot: 1—Molecular Weight Ladder (2–40 kDa); 2—G12; 3—R5; 4—MioBS; 5—2D4; 6—Skerritt; 7—USDA.
3.2. ELISA Characterization of Selected Hydrolysates Against Kit Standards
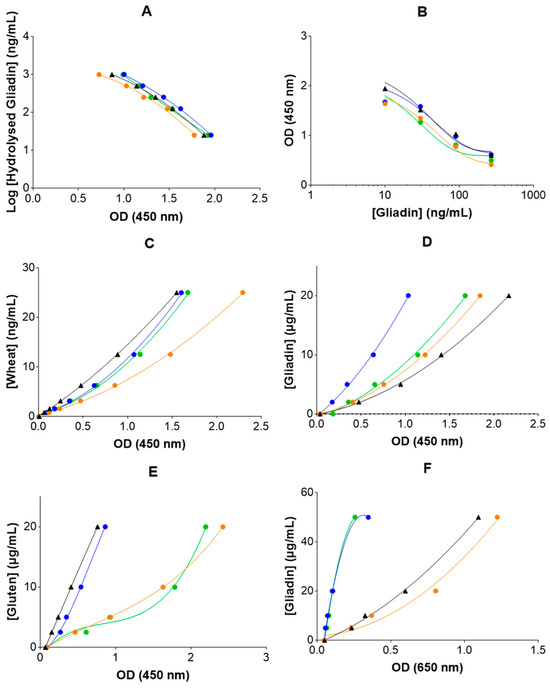
The hydrolysates PT3 and PT0.3 (along with the unhydrolyzed CGM control) were run on commercially available, gluten-detecting ELISA kits, at concentrations that matched those of the kit standards. The purpose of this was to determine whether the antibodies of each kit exhibited recognition of the potential calibrants to the same extent as the native kit standards. Recognition of the hydrolysates differed depending on the antibody (Figure 3). PT3 hydrolysate curves were most comparable to the standard curves generated by the R5, MIoBS, and Skerritt antibodies (Figure 3B,C,E). Additionally, while the PT0.3 data points were closer, the PT3 curve produced by the G12 antibody also displayed promising comparability with the standard-generated curve (Figure 3A). The 2D4 and USDA antibodies appeared to respond more accurately to the non-hydrolyzed control, CGM, with the USDA antibody in particular showing poor recognition towards the hydrolyzed PT3 and PT0.3 samples (Figure 3D,F).
Figure 3.
Commercial ELISA standard curves with PT hydrolysates at the same concentrations, as per the kit specifications, for antibodies (A) G12, (B) R5, (C) MIoBS, (D) 2D4, (E) Skerritt, and (F) USDA. Each data point represents the average of duplicate analysis of a single biological replicate.  Kit standard;
  CGM;
CGM;  PT3;
PT3;  PT0.3.
Kit standard; CGM; PT3; PT0.3.
3.3. Wes Detection of Gluten in Dietary Enzyme Supplements
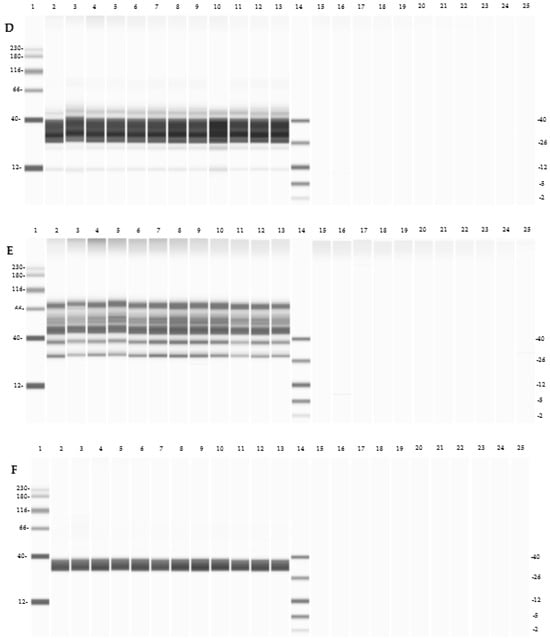
Wes immunoblotting was utilized in order to confirm the absence of gluten in the ENZs. Additionally, lanes containing ENZ_PT3 were run in parallel, to ensure that the ENZ matrices were not interfering with the Wes capillary electrophoresis system (Figure 4). No bands were observed for the majority of the ENZ samples, while inclusion of the INC_PT3 resulted in the presence of gluten banding patterns that corresponded with the antibody-specific bands observed for PT3 alone at 200 µg/mL in the previous Wes results (Figure 1, lane 11). The only ENZ sample where a band was observed was in the AFP sample in the presence of the G12, MIoBS, 2D4, and Skerritt antibodies, between the 5–12 kDa position (Figure 4A,C,D,E, lane 16). This, however, appears to be an artefact and not a peptide being bound by the antibody, as the band does not appear in the corresponding AFP/INC_PT3 lane (Figure 4A,C,D,E, lane 4). The Wes immunoblotting has clearly demonstrated that the gluten concentrations in the ENZs is negligible to non-existent when tested against commercially available, gluten-specific antibodies.
Figure 4.
Wes banding patterns of ENZs (2 mg/mL) in the presence (lanes 3–13) and absence (lanes 15–25) of PT3 (200 µg/mL), bound by the antibodies (A) G12, (B) R5, (C) MIoBS, (D) 2D4, (E) Skerritt, and (F) USDA. Each figure represents images obtained at a high dynamic range of 4.0 in Wes with different contrast settings for visualization of low-signal-intensity proteins or peptide bands. Lane information for immunoblots: 1—Molecular Weight Ladder (12–230 kDa); 2—200 µg/mL PT3; 3—FPA+PT3; 4—AFP+PT3; 5—BP+PT3; 6—AlphaG+PT3; 7—CellAN+PT3; 8—FL+PT3; 9—LipAN+PT3; 10—Pep-I+PT3; 11—Pep-II+PT3; 12—INV+PT3; 13—LAA+PT3; 14—Molecular Weight Ladder (2–40 kDa); 15—FPA; 16—AFP; 17—BP; 18—AlphaG; 19—CellAN; 20—FL; 21—LipAN; 22—Pep-I; 23—Pep-II; 24—INV; 25—LAA.
3.4. Gluten Detection in Dietary Enzyme Supplements Using Commercial ELISA Kits
In addition to the Wes, the presence of gluten in the ENZs was checked using the six commercial ELISA kits corresponding with the gluten antibodies that were run on the immunoblots (Figure 4). Gluten concentrations for tested ENZs were below the imposed 20 ppm restriction, with the majority having <1 ppm gluten when calculated against either the native or PT3 standard (Table 1). These results coincide with the similar Wes results above (Figure 4). Gluten concentration for BP in the RIDASCREEN® R5 assay was an obvious exception. However, as BP has previously been shown to interfere with competitive ELISAs and does not exhibit high gluten levels in any other ELISA, this is not a concern [23]. Additionally, while the Veratox® native standards resulted in acceptable gluten concentrations, use of the PT3 standard in the same kit led to one unusually high reading (LipAN) and one that was out of calculable range (Table 1). This can be explained through the incompatibility of using hydrolyzed gluten as a standard in this particular kit, as only the non-hydrolyzed CGM control gave a curve resembling the native standard previously (Figure 3F). The PT3 calibrant was run in parallel, as both a separate standard curve (with concentrations that matched the concentrations of each of the individual kit standards) and as the INC_PT3 in combination with each ENZ extract in order to ensure that the products were not interfering with the ELISAs (Table 1). The concentration for the INC_PT3 for each ELISA kit was based on the previously generated PT3 curves that fell within quantification range of the kit standard (Figure 3). The interference of BP was also seen in some instances when run in combination with the INC_PT3 (Table 1). In the Hygiena and RIDASCREEN® kits, against both the native and PT3 standard curves, BP plus INT_PT3 gave much higher gluten readings than the INT_PT3 alone, with readings of the RIDASCREEN kit in particular being so high that they were out of range. In contrast, BP plus INC_PT3 readings for the Aller-Tek® and Veratox® were so low that they were non-detectable.
Table 1.
Gluten concentration in ppm (µg/mL) in each ENZ and ENZ_PT3 quantified with commercial ELISA kits. High: higher than the highest concentration point on each standard curve. ND: non-detectable or below the limit of detection (LOD).
ELISA analysis utilizing six different gluten-targeting antibodies has confirmed the lack of or extremely low gluten concentrations in all tested ENZs.
4. Discussion
Through the use of six commercially available, gluten-targeting antibodies, we have demonstrated that the ENZs produced during microbial fermentation in the presence of wheat contain no or negligible concentrations of gluten as determined by two different modalities: Wes immunoblots and ELISA analysis. This study also demonstrated the variability in results when testing gluten using different gluten-detecting ELISA kits. This is evident from both the ELISA results and the automated Western blot data where there were different bands corresponding to different weights with each of the different antibodies. Each antibody from the respective gluten detection kits recognizes a unique antigen pattern and will only bind to this sequence. These antibodies can be highly specific (e.g., G12 targets a short amino acid sequence in α2 wheat gliadin) or more general (e.g., the Skerrit antibody that targets HMW glutenin) [24]. In all the non-hydrolyzed samples, the molecular weights of the bands was 26 kDa or higher, but after hydrolysis, each antibody gave a unique profile. Thus, depending on where the different gluten-containing peptides were cleaved, and the recognition sites for the antibodies in these peptides, each antibody will give a different banding pattern. In the lanes where there was less starting CGM added, there are again lower-molecular-weight bands likely because the enzymes have had more time to interact with the substrate hydrolyzing them further than the more concentrated samples.
Important gluten peptides are classified as “toxic” if they have been tested in vivo or via organ culture, or “immunogenic” if T-cell tests have been used instead [25,26]. In general, the sequences containing toxic peptides are found in the α/β-gliadins, in the repetitive N-terminal domains [25]. In particular, the well-documented 33-mer peptide (LQLQPFPQPQLPYPQPQLPYPQPQLPYPQPQPF) from the α2-gliadin contains three T-cell epitopes that overlap in its sequence and is particularly resistant to hydrolysis via intestinal peptidases [20]. This resistance is largely a result of the inability of human pepsin, trypsin and chymotrypsin to cleave peptides at positions prior to- and following either P or Q residues [27]. For patients with allergy to wheat, ω5-gliadin and HMW glutenin are the major allergens of import, although the World Health Organization-International Union of Immunological Societies (WHO-IUIS) nomenclature database has listed 28 wheat allergens in total [28]. Additionally, wheat proteins in the water-soluble fraction are also known contributors to allergic reactions in the presence of wheat, examples of which include α-amylase inhibitor, wheat profilin, and nonspecific lipid transfer protein [28].
Accurate measurements of gluten within hydrolyzed/fermented matrices are difficult to obtain, especially when coupled with the absence of an appropriately hydrolyzed gluten standard containing smaller peptides more representative of those within the processed food of interest for gluten content to be measured against [12,15]. Preparation and investigation of novel gluten standards or “reference markers” on commercial ELISA kits (among other gluten detection methods) have been attempted by various researchers, although this usually just involves a blend of multiple cultivars for preparation of a single flour, potentially containing a greater variety of intact gluten proteins and, thus, leading to a more “universal” standard [16,29,30,31]. In this study, we attempted to prepare a gluten standard or “calibrant” containing hydrolyzed gluten peptides that accurately represented those that still potentially remained in our ENZs following microbial fermentation and downstream processing. A similar study was carried out previously by Gessendorfer and colleagues (2009), whereby the prolamin factions of wheat, rye, and barley were hydrolyzed via digestive enzymes and used in combination with the RIDASCREEN® R5 Competitive ELISA (the same kit used here) for a more accurate representation of gluten content in food [18]. By using the actual substrates that are used in the individual enzyme preparations, any gluten-containing molecules can only be from this source, and would potentially match if there were any gluten in the ENZ samples themselves. To this end, we sourced 11 different wheats that are supplemented into the fermenters during ENZ manufacture to ensure the relevant gluten proteins were present. We carried out a series of pepsin/trypsin complex digestions on this mixture (that differed only in trypsin complex concentration), based on modified methods used previously by our group and others [12,32]. This enabled the breakdown of the larger gluten proteins for creation of smaller, immunologically relevant peptides that are known to be resistant to further breakdown by digestive enzymes, such as the 33-mer (3.9 kDa) [7,29,33]. Wheat gliadin proteins range in size from approximately 30–80 kDa, and are subdivided into α/β-, γ-, ω1,2-, and ω5-gliadins [4,34]. Gliadins are also primarily monomeric, potentially containing intrachain disulfide bonds, and are soluble in aqueous alcohol solutions, but not water or salt solutions [4,35]. Glutenins are simply classified based on whether they are L- or HMW gluten proteins, and range in size from 30–140 kDa [2]. Additionally, they are polymeric, with glutenin proteins being linked via interchain disulfide bonds, and are only soluble in weak acids/bases unless a reducing agent is employed to disrupt these bonds [3,6]. Once reduced, glutenins then become soluble in aqueous alcohol [3].
Selection of a suitable calibrant through Wes immunoblotting and ELISA assays determined the PT3 to be the better of the two candidates discussed here. Examination of the immunoblots revealed satisfactory breakdown of both PT3 and PT0.3 in comparison to whole wheat, with the presence of gluten bands at lower kDa than in the CGM control (Figure 1). Differences in gluten targeting are also apparent upon examination of the different banding patterns observed between antibodies for the same samples. The Skerritt antibody appeared to bind the most indiscriminately, regardless of level of hydrolysis (Figure 1E). In contrast, the 2D4 antibody revealed the least amount of bands of the 6 tested for the PT3 hydrolysate (Figure 1F). PT3 was seen as the more desirable candidate due to standard curves generated from this sample bearing a close resemblance to the kit standards in 4 of the 6 chosen ELISAs (Figure 3). The presence of the low-molecular-weight band observed in the presence of the G12 antibody also indicated that the hydrolysis was sufficient for production of these smaller, immunogenic peptides (Figure 2).
The chosen PT3 calibrant was taken forward and run in parallel when testing the ENZs for gluten concentration. In the Wes immunoblots, PT3 inclusion served as an internal control to account for any potential matrix effects that the ENZs may have caused when visualizing bands. However, all ENZ_PT3 samples ran normally, and ENZ-only lanes displayed little to no gluten bands (Figure 4). When included in ELISA analysis, the PT3 calibrant served as both an internal control for each ENZ extract, and a separate standard curve against which ENZ absorbance readings could be plotted. As the PT3 calibrant was generated from the hydrolyzed wheat sources used in the production of these ENZs, generating gluten concentrations against this as a standard could potentially result in more accurate gluten concentration readings overall. In 4 of the 6 ELISA kits used, ENZ gluten concentrations were consistently <20 ppm, regardless of when measured against the kit or PT3 standard curves (Table 1). BP gave unusually high gluten readings in the RIDASCREEN® R5 for both kit (284 ppm) and PT3 (359 ppm) standards (Table 1). BP is known for interfering with competitive ELISA readouts, and contained <20 ppm gluten in all other ELISA readouts [12,23]. Conflicting results were also observed with the Veratox® USDA kit, whereby all ENZ gluten readings were <20 ppm when measured against the USDA standard but not against PT3 (Table 1). This artefact is likely driven by the fact that the Veratox® USDA standard differed greatly from the PT3 standard and could not accurately detect hydrolyzed gluten (Figure 3F). Therefore, the choice of ELISA when quantifying gluten in fermented/processed foods requires careful consideration. Bruins and colleagues (2015) investigated the ability of 14 different ELISA kits to detect and quantify gluten in processed foods with varying matrix complexity, and concluded that no single ELISA worked accurately for all foods investigated [36].
Our study has demonstrated, through 2 different techniques, that microbial fermentation with wheat for production of ENZs does not result in products containing residual gluten. This may be due to the microbes themselves being capable of completely hydrolyzing even the smaller gluten peptides, or gluten may be removed during downstream processing. The complete breakdown of gluten peptides by microbes has been previously documented, with some groups highlighting the potential for such microbes as a digestive aid to individuals suffering from gluten intolerance [7,27,37]. Additionally, we developed a hydrolyzed calibrant from the original wheat sources utilized during microbial fermentation, to create gluten peptide profile that would more accurately represent those found in the ENZs. The PT3 standard curves closely resembled 4 of the 6 commercial ELISA kit standard curves (GlutenTox® Competitive G12, RIDASCREEN® R5, Wheat/Gluten MIoBS, and Gluten Skerritt). Use of the G12 antibody on the PT3 calibrant also identified smaller gluten bands that may have clinical relevance, which were not picked up by the other 5 antibodies. This indicates that the GlutenTox® Competitive G12 ELISA from Hygiena is one commercially available ELISA that may suitable for ENZ gluten determination from wheat substrates.
5. Conclusions
The combination of automated Western immunoblots and commercial ELISAs has demonstrated very low to the complete absence of gluten in the tested supplemental enzyme products, in comparison to the starting complete gluten mix, which demonstrated several different gluten-containing bands. The antibodies from the gluten detection kits gave different banding patterns based on the recognition sequence of the antibodies, and this was more evident after hydrolysis, likely due to the recognition sites being displayed on different peptides post-cleaving. These peptide products corresponding to these bands would emulate what is happening in the intestines post-hydrolysis by pepsin and trypsin. These data strongly infer that the enzymes secreted by bacteria during the fermentation of wheat comprehensively hydrolyze the glutenergic proteins to utilize wheat as their nutrient source. The development of a relevant calibrant and subsequent testing has also shown the necessity for choosing an ELISA capable of the accurate detection of hydrolyzed gluten, as not all are suitable. Classically, one of the main concerns for adequate gluten testing has been extracting the gluten from the food matrices, as well as the selection of the correct epitope for analysis [36]. Enzymes are processed from the lysate of bacterial fermentation and are not subject to the same restrictions of food matrices; thus, the extraction of all the gluten from the product is more feasible. These findings suggest that for the adequate testing of gluten content, the matrices and extraction method should be considered; one should employ more than one method of analysis, with the appropriate testing kits, and further utilize the gluten source and hydrolysis breakdown products thereof as realistic relevant markers to compare against to verify the absence of gluten-containing peptides.
Author Contributions
Conceptualization, J.D. and K.R.; methodology, J.D., J.C., K.R., P.K., and N.K.L.; formal analysis, P.K. and N.K.L.; investigation, K.R.; resources, J.N.C.; data curation, P.K. and N.K.L.; writing—original draft preparation, P.K. and N.K.L.; writing—review and editing, P.K., N.K.L. and K.R.; supervision, K.R., J.N.C. and J.D.; project administration, K.R. and J.D. All authors have read and agreed to the published version of the manuscript.
Funding
This research was funded by Archer Daniels Midland/Deerland Probiotics & Enzymes.
Institutional Review Board Statement
Not applicable.
Informed Consent Statement
Not applicable.
Data Availability Statement
The original contributions presented in this study are included in the article. Further inquiries can be directed to the corresponding author.
Conflicts of Interest
P.K., N.K.L., J.N.C., J.D., J.C. and K.R. were employed by Archer Daniels Midland. The authors of the paper declare that the research was conducted in the absence of any commercial or financial relationships that could be construed as a potential conflict of interest.
Abbreviations
| RT | Room temperature, 20–23 °C |
| DI-H2O | Deionized water |
| PH2.0 | Acidic buffer solution pH 2.0 |
| CGM | The mixture of diluted wheat sources at equal concentrations |
| ENZ | Dietary enzyme |
| PT-hydrolysis | Sequential hydrolysis of pepsin and then trypsin complex. |
| PT3 | Sequentially PT-hydrolyzed product with 25 µg/mL of pepsin and 3 µg/mL of trypsin complex |
| PT0.3 | Sequentially PT-hydrolyzed product with 25 µg/mL of pepsin and 0.3 µg/mL of trypsin complex |
| INC_PT3 | Diluent containing PT3; PT3 in 0.1x sample buffer; [PT3] = 250 µg/mL. |
| PT3_200 | Internal protein control only; [PT3] = 200 µg/mL |
| ENZ_PT3 | ENZ plus internal protein control PT3; [ENZ] = 2 mg/mL, [PT3] = 200 µg/mL in final preparation. |
| LOD | Limit of detection of gluten. |
Appendix A
- Abcam. ab102890—HRP Conjugation Kit Protocol Version 5. (December 2018); accessed on 30 May 2024.
- Cebolla Ramírez, Á.; Siglez Granado, M.; Pedrajas Jurado, J.; Tabraue Chavez, M. Solution for gluten extraction and methods of use. (Spain Patent No. ES 2 392412A1). Spanish office of Patent and Trademarks.
- ProteinSimple, Compass for Simple Western User Guide Revision G. (October 2022); Compass.book (https://www.proteinsimple.com, accessed on 17 July 2024).
- ProteinSimple. Simple Western Size Assay Development Guide, Revision 1. (March 2014); Wes_manual.book (https://www.proteinsimple.com, accessed on 17 July 2024).
- ThermoScientific. PierceTM BCA protein Assay Kit (#23227) User guide (https://assets.thermofisher.com, accessed on 16 July 2024).
Table A1.
Enzyme and enzyme supplements used in this study.
Table A2.
Commercial ELISA kits and the corresponding gluten extraction methods used on fermented enzyme products.
Table A3.
LOD and INC_PT3 concentrations for each ELISA kit.
Table A4.
Gluten detection kits, antibodies, and antibody dilutions necessary for Wes immunoblotting. a HRP-conjugated prior to use.
References
- Biesiekierski, J.R. What is gluten? J. Gastroenterol. Hepatol. 2017, 32, 78–81. [Google Scholar] [CrossRef] [Scilit]
- Žilić, S.; Barać, M.; Pešić, M.; Dodig, D.; Ignjatović-Micić, D. Characterization of Proteins from Grain of Different Bread and Durum Wheat Genotypes. Int. J. Mol. Sci. 2011, 12, 5878–5894. [Google Scholar] [CrossRef] [Scilit] [PubMed]
- Wieser, H. Chemistry of gluten proteins. Food Microbiol. 2007, 24, 115–119. [Google Scholar] [CrossRef] [Scilit]
- Wieser, H.; Koehler, P.; Scherf, K.A. Chemistry of wheat gluten proteins: Qualitative composition. Cereal Chem. 2023, 100, 23–35. [Google Scholar] [CrossRef] [Scilit]
- Cebolla, Á.; Moreno, M.L.; Coto, L.; Sousa, C. Gluten Immunogenic Peptides as Standard for the Evaluation of Potential Harmful Prolamin Content in Food and Human Specimen. Nutrients 2018, 10, 1927. [Google Scholar] [CrossRef] [Scilit] [PubMed]
- Balakireva, A.V.; Zamyatnin, A.A. Properties of Gluten Intolerance: Gluten Structure, Evolution, Pathogenicity and Detoxification Capabilities. Nutrients 2016, 8, 644. [Google Scholar] [CrossRef] [Scilit] [PubMed]
- Lee, G.-Y.; Jung, M.-J.; Kim, B.-M.; Jun, J.-Y. Identification and Growth Characteristics of a Gluten-Degrading Bacterium from Wheat Grains for Gluten-Degrading Enzyme Production. Microorganisms 2023, 11, 2884. [Google Scholar] [CrossRef] [Scilit] [PubMed]
- Nye-Wood, M.G.; Juhász, A.; Bose, U.; Colgrave, M.L. Proteome Analysis and Epitope Mapping in a Commercial Reduced-Gluten Wheat Product. Front. Nutr. 2021, 8. [Google Scholar] [CrossRef] [Scilit]
- Hardy, M.Y.; Henneken, L.M.; Russell, A.K.; Okura, Y.; Mizoroki, A.; Ozono, Y.; Kobayashi, S.; Murakami, Y.; Tye-Din, J.A. A bispecific antibody targeting HLA-DQ2.5-gluten peptides potently blocks gluten-specific T cells induced by gluten ingestion in patients with celiac disease. Clin. Immunol. 2024, 264, 110259. [Google Scholar] [CrossRef] [Scilit]
- Shewry, P.R.; Tatham, A.S. Improving wheat to remove coeliac epitopes but retain functionality. J. Cereal Sci. 2016, 67, 12–21. [Google Scholar] [CrossRef] [Scilit]
- Ricci, G.; Andreozzi, L.; Cipriani, F.; Giannetti, A.; Gallucci, M.; Caffarelli, C. Wheat Allergy in Children: A Comprehensive Update. Medicina 2019, 55, 400. [Google Scholar] [CrossRef] [Scilit]
- Khokhlova, E.; Kim, P.; Colom, J.; Bhat, S.; Curran, A.M.; Jouini, N.; Rea, K.; Phipps, C.; Deaton, J. Assessing Hydrolyzed Gluten Content in Dietary Enzyme Supplements Following Fermentation. Fermentation 2022, 8, 203. [Google Scholar] [CrossRef] [Scilit]
- Decloedt, A.; Watson, H.; Gheysen, G.; Van Landschoot, A. Characteristics and Immunogenicity of Gluten Peptides in Enzyme-Treated and -Untreated Beers for Celiac Patients. Fermentation 2024, 10, 277. [Google Scholar] [CrossRef] [Scilit]
- FDA. Food Labeling; Gluten-free Labeling of Fermented or Hydrolyzed Foods. In Federal Register; Department of Health and Human Services: Washington, DC, USA, 2020; Volume 85, pp. 49240–49261. [Google Scholar]
- Panda, R.; Boyer, M.; Garber, E.A.E. A multiplex competitive ELISA for the detection and characterization of gluten in fermented-hydrolyzed foods. Anal. Bioanal. Chem. 2017, 409, 6959–6973. [Google Scholar] [CrossRef] [Scilit]
- Schall, E.; Scherf, K.A.; Bugyi, Z.; Török, K.; Koehler, P.; Schoenlechner, R.; Tömösközi, S. Further Steps Toward the Development of Gluten Reference Materials—Wheat Flours or Protein Isolates? Front. Plant Sci. 2020, 11, 906. [Google Scholar] [CrossRef] [Scilit]
- Iglewicz, B.; Hoaglin, D.C. How to Detect and Handle Outliers. In The ASQC Basic References in Quality Control: Statistical Techniques; Mykytka, E.F., Ed.; ASQC, Quality Press: Milwaukee, WI, USA, 1993; Volume 16. [Google Scholar]
- Gessendorfer, B.; Koehler, P.; Wieser, H. Preparation and characterization of enzymatically hydrolyzed prolamins from wheat, rye, and barley as references for the immunochemical quantitation of partially hydrolyzed gluten. Anal. Bioanal. Chem. 2009, 395, 1721–1728. [Google Scholar] [CrossRef] [Scilit]
- Nelson, G.M.; Guynn, J.M.; Chorley, B.N. Procedure and Key Optimization Strategies for an Automated Capillary Electrophoretic-based Immunoassay Method. J. Vis. Exp. 2017, 127, e55911. [Google Scholar] [CrossRef] [Scilit]
- Schalk, K.; Lang, C.; Wieser, H.; Koehler, P.; Scherf, K.A. Quantitation of the immunodominant 33-mer peptide from α-gliadin in wheat flours by liquid chromatography tandem mass spectrometry. Sci. Rep. 2017, 7, 45092. [Google Scholar] [CrossRef] [Scilit]
- Schaart, J.G.; Salentijn, E.M.J.; Goryunova, S.V.; Chidzanga, C.; Esselink, D.G.; Gosman, N.; Bentley, A.R.; Gilissen, L.; Smulders, M.J.M. Exploring the alpha-gliadin locus: The 33-mer peptide with six overlapping coeliac disease epitopes in Triticum aestivum is derived from a subgroup of Aegilops tauschii. Plant J. 2021, 106, 86–94. [Google Scholar] [CrossRef] [Scilit] [PubMed]
- Comino, I.; Real, A.; Vivas, S.; Síglez, M.; Caminero, A.; Nistal, E.; Casqueiro, J.; Rodríguez-Herrera, A.; Cebolla, A.; Sousa, C. Monitoring of gluten-free diet compliance in celiac patients by assessment of gliadin 33-mer equivalent epitopes in feces. Am. J. Clin. Nutr. 2012, 95, 670–677. [Google Scholar] [CrossRef] [Scilit] [PubMed]
- Lacorn, M.; Lindeke, S.; Siebeneicher, S.; Weiss, T. Commercial ELISA Measurement of Allergens and Gluten: What We Can Learn from Case Studies. J. AOAC Int. 2018, 101, 102–107. [Google Scholar] [CrossRef] [Scilit] [PubMed]
- Panda, R.; Garber, E.A.E. Western blot analysis of fermented-hydrolyzed foods utilizing gluten-specific antibodies employed in a novel multiplex competitive ELISA. Anal. Bioanal. Chem. 2019, 411, 5159–5174. [Google Scholar] [CrossRef] [Scilit] [PubMed]
- Malalgoda, M.; Simsek, S. Celiac disease and cereal proteins. Food Hydrocoll. 2017, 68, 108–113. [Google Scholar] [CrossRef] [Scilit]
- Scherf, K.A.; Koehler, P.; Wieser, H. Gluten and wheat sensitivities—An overview. J. Cereal Sci. 2016, 67, 2–11. [Google Scholar] [CrossRef] [Scilit]
- Leszczyńska, J.; Szczepankowska, A.K.; Majak, I.; Mańkowska, D.; Smolińska, B.; Ścieszka, S.; Diowksz, A.; Cukrowska, B.; Aleksandrzak-Piekarczyk, T. Reducing Immunoreactivity of Gluten Peptides by Probiotic Lactic Acid Bacteria for Dietary Management of Gluten-Related Diseases. Nutrients 2024, 16, 976. [Google Scholar] [CrossRef] [Scilit] [PubMed]
- Kamath, S.D.; Bublin, M.; Kitamura, K.; Matsui, T.; Ito, K.; Lopata, A.L. Cross-reactive epitopes and their role in food allergy. J. Allergy Clin. Immunol. 2023, 151, 1178–1190. [Google Scholar] [CrossRef] [Scilit]
- van Eckert, R.; Berghofer, E.; Ciclitira, P.J.; Chirdo, F.; Denery-Papini, S.; Ellis, H.J.; Ferranti, P.; Goodwin, P.; Immer, U.; Mamone, G.; et al. Towards a new gliadin reference material–isolation and characterisation. J. Cereal Sci. 2006, 43, 331–341. [Google Scholar] [CrossRef] [Scilit]
- Huang, X.; Ma, K.; Leinonen, S.; Sontag-Strohm, T. Barley C-Hordein as the Calibrant for Wheat Gluten Quantification. Foods 2020, 9, 1637. [Google Scholar] [CrossRef] [Scilit]
- Xhaferaj, M.; Muskovics, G.; Schall, E.; Bugyi, Z.; Tömösközi, S.; Scherf, K.A. Development of a barley reference material for gluten analysis. Food Chem. 2023, 424, 136414. [Google Scholar] [CrossRef] [Scilit] [PubMed]
- Rivera Del Rio, A.; Keppler, J.K.; Boom, R.M.; Janssen, A.E.M. Protein acidification and hydrolysis by pepsin ensure efficient trypsin-catalyzed hydrolysis. Food Funct. 2021, 12, 4570–4581. [Google Scholar] [CrossRef] [Scilit] [PubMed]
- Wei, G.; Helmerhorst, E.J.; Darwish, G.; Blumenkranz, G.; Schuppan, D. Gluten Degrading Enzymes for Treatment of Celiac Disease. Nutrients 2020, 12, 2095. [Google Scholar] [CrossRef] [Scilit]
- Dahesh, M.; Banc, A.; Duri, A.; Morel, M.H.; Ramos, L. Polymeric assembly of gluten proteins in an aqueous ethanol solvent. J. Phys. Chem. B 2014, 118, 11065–11076. [Google Scholar] [CrossRef] [Scilit]
- Markgren, J.; Hedenqvist, M.; Rasheed, F.; Skepö, M.; Johansson, E. Glutenin and Gliadin, a Piece in the Puzzle of their Structural Properties in the Cell Described through Monte Carlo Simulations. Biomolecules 2020, 10, 1095. [Google Scholar] [CrossRef] [Scilit] [PubMed]
- Bruins Slot, I.D.; Bremer, M.G.E.G.; van der Fels-Klerx, I.; Hamer, R.J. Evaluating the Performance of Gluten ELISA Test Kits: The Numbers Do Not Tell the Tale. Cereal Chem. 2015, 92, 513–521. [Google Scholar] [CrossRef] [Scilit]
- Cristofori, F.; Francavilla, R.; Capobianco, D.; Dargenio, V.N.; Filardo, S.; Mastromarino, P. Bacterial-Based Strategies to Hydrolyze Gluten Peptides and Protect Intestinal Mucosa. Front. Immunol. 2020, 11, 567801. [Google Scholar] [CrossRef] [Scilit] [PubMed]

Disclaimer/Publisher’s Note: The statements, opinions and data contained in all publications are solely those of the individual author(s) and contributor(s) and not of MDPI and/or the editor(s). MDPI and/or the editor(s) disclaim responsibility for any injury to people or property resulting from any ideas, methods, instructions or products referred to in the content. |
© 2025 by the authors. Licensee MDPI, Basel, Switzerland. This article is an open access article distributed under the terms and conditions of the Creative Commons Attribution (CC BY) license (https://creativecommons.org/licenses/by/4.0/).