Next Issue
Volume 8, August
Previous Issue
Volume 8, June
 
 
remotesensing-logo

Journal Browser

Journal Browser

Remote Sens., Volume 8, Issue 7 (July 2016) – 83 articles

Cover Story (view full-size image): 
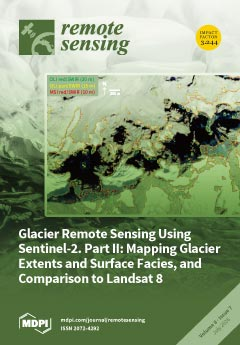
The cover image shows a close-up view of a Sentinel 2 (S2) scene (32TMS) acquired on 29 August 2015 over the European Alps with the debris-covered Breithornglacier in the Lau-terbrunnen Valley (Switzerland) to the left. The S2 image with its 10-m resolution resolves the issue of glacier crevasses, thus depicting glaciers much more realistically. Paul et al. (2016) have, among other glacier mapping analyses, investigated how automated glacier mapping with S2 performs compared to Landsat 8 when using the band ratio method. The glacier outlines resulting from the three band combinations are shown in the cover image. The study revealed that (a) the 15-m Landsat 8 pan band can also be used for glacier map-ping, providing outlines with a two times higher resolution than with the red band; (b) all methods provide similar glacier extents, but (c) the 30-m red/SWIR ratio gives slightly larger (5%) extents. View [...] Read more.
  • Issues are regarded as officially published after their release is announced to the table of contents alert mailing list.
  • You may sign up for e-mail alerts to receive table of contents of newly released issues.
  • PDF is the official format for papers published in both, html and pdf forms. To view the papers in pdf format, click on the "PDF Full-text" link, and use the free Adobe Reader to open them.
Order results
Result details
Section
Select all
Export citation of selected articles as:
14 pages, 9910 KiB  
Article
Increasing the Accuracy and Automation of Fractional Vegetation Cover Estimation from Digital Photographs
by André Coy 1,*, Dale Rankine 1, Michael Taylor 1, David C. Nielsen 2 and Jane Cohen 3
1 Department of Physics, The University of the West Indies, Mona, Jamaica
2 Central Great Plains Research Station, USDA-ARS, Akron, CO 80720, USA
3 Department of Life Sciences, The University of the West Indies, Mona, Jamaica
Remote Sens. 2016, 8(7), 474; https://doi.org/10.3390/rs8070474 - 23 Jun 2016
Cited by 50 | Viewed by 8441
Abstract
The use of automated methods to estimate fractional vegetation cover (FVC) from digital photographs has increased in recent years given its potential to produce accurate, fast and inexpensive FVC measurements. Wide acceptance has been delayed because of the limitations in accuracy, speed, automation [...] Read more.
The use of automated methods to estimate fractional vegetation cover (FVC) from digital photographs has increased in recent years given its potential to produce accurate, fast and inexpensive FVC measurements. Wide acceptance has been delayed because of the limitations in accuracy, speed, automation and generalization of these methods. This work introduces a novel technique, the Automated Canopy Estimator (ACE) that overcomes many of these challenges to produce accurate estimates of fractional vegetation cover using an unsupervised segmentation process. ACE is shown to outperform nine other segmentation algorithms, consisting of both threshold-based and machine learning approaches, in the segmentation of photographs of four different crops (oat, corn, rapeseed and flax) with an overall accuracy of 89.6%. ACE is similarly accurate (88.7%) when applied to remotely sensed corn, producing FVC estimates that are strongly correlated with ground truth values. Full article
(This article belongs to the Special Issue Remote Sensing of Vegetation Structure and Dynamics)
Show Figures

Graphical abstract

24 pages, 6387 KiB  
Article
Mapping Presence and Predicting Phenological Status of Invasive Buffelgrass in Southern Arizona Using MODIS, Climate and Citizen Science Observation Data
by Cynthia S. A. Wallace 1,*, Jessica J. Walker 1, Susan M. Skirvin 2, Caroline Patrick-Birdwell 3, Jake F. Weltzin 4 and Helen Raichle 5
1 Western Geographic Science Center, U.S. Geological Survey, Tucson, AZ 85719, USA
2 Agricultural Research Station, U.S. Department of Agriculture, Tucson, AZ 85719, USA
3 Southern Arizona Buffelgrass Coordination Center, Tucson, AZ 85717, USA
4 USA National Phenology Network, U.S. Geological Survey, Tucson, AZ 85721, USA
5 Arizona Water Science Center, Tucson, AZ 85719, USA
Remote Sens. 2016, 8(7), 524; https://doi.org/10.3390/rs8070524 - 24 Jun 2016
Cited by 41 | Viewed by 11081
Abstract
The increasing spread and abundance of an invasive perennial grass, buffelgrass (Pennisetum ciliare), represents a critical threat to the native vegetation communities of the Sonoran desert in southern Arizona, USA, where buffelgrass eradication is a high priority for resource managers. Herbicidal [...] Read more.
The increasing spread and abundance of an invasive perennial grass, buffelgrass (Pennisetum ciliare), represents a critical threat to the native vegetation communities of the Sonoran desert in southern Arizona, USA, where buffelgrass eradication is a high priority for resource managers. Herbicidal treatment of buffelgrass is most effective when the vegetation is actively growing, but the remoteness of infestations and the erratic timing and length of the species’ growth periods confound effective treatment. The goal of our research is to promote buffelgrass management by using remote sensing data to detect where the invasive plants are located and when they are photosynthetically active. We integrated citizen scientist observations of buffelgrass phenology in the Tucson, Arizona area with PRISM precipitation data, eight-day composites of 250-m Moderate-resolution Imaging Spectroradiometer (MODIS) satellite imagery, and aerially-mapped polygons of buffelgrass presence to understand dynamics and relationships between precipitation and the timing and amount of buffelgrass greenness from 2011 to 2013. Our results show that buffelgrass responds quickly to antecedent rainfall: in pixels containing buffelgrass, higher correlations (R2 > 0.5) typically occur after two cumulative eight-day periods of rain, whereas in pixels dominated by native vegetation, four prior 8-day periods are required to reach that threshold. Using the new suite of phenometrics introduced here—Climate Landscape Response metrics—we accurately predicted the location of 49% to 55% of buffelgrass patches in Saguaro National Park. These metrics and the suggested guidelines for their use can be employed by resource managers to treat buffelgrass during optimal time periods. Full article
(This article belongs to the Special Issue Citizen Science and Earth Observation)
Show Figures

Graphical abstract

14 pages, 6883 KiB  
Comment
Comment on Gebhardt et al. MAD-MEX: Automatic Wall-to-Wall Land Cover Monitoring for the Mexican REDD-MRV Program Using All Landsat Data. Remote Sens. 2014, 6, 3923–3943
by Jean-François Mas 1,*, Stéphane Couturier 2, Jaime Paneque-Gálvez 1, Margaret Skutsch 1, Azucena Pérez-Vega 3, Miguel Angel Castillo-Santiago 4 and Gerardo Bocco 1
1 Centro de Investigaciones en Geografía Ambiental, Universidad Nacional Autónoma de México, Campus Morelia, Antigua Carretera a Pátzcuaro 8701, Col. Ex-Hacienda de San José de La Huerta, C.P. 58190 Morelia, Mexico
2 Instituto de Geografía, Universidad Nacional Autónoma de México, Circuito de la Investigación Científica, Ciudad Universitaria, Del. Coyoacán, C.P. 04510 México D.F., Mexico
3 Universidad de Guanajuato, Sede Belén, Av. Juárez 77, Zona Centro, C.P. 4500 Guanajuato, Mexico
4 El Colegio de la Frontera Sur, Unidad San Cristóbal, Carretera Panamericana y Periférico Sur s/n Barrio María Auxiliadora, C.P. 29290 San Cristóbal de Las Casas, Chiapas, Mexico
Remote Sens. 2016, 8(7), 533; https://doi.org/10.3390/rs8070533 - 23 Jun 2016
Cited by 9 | Viewed by 6641
Abstract
Gebhardt et al. (2014) presented the Monitoring Activity Data for the Mexican REDD+ program (MAD-MEX), an automatic nation-wide land cover monitoring system for the Mexican REDD+ MRV. Though MAD-MEX represents a valuable first effort toward establishing a national reference emissions level for the [...] Read more.
Gebhardt et al. (2014) presented the Monitoring Activity Data for the Mexican REDD+ program (MAD-MEX), an automatic nation-wide land cover monitoring system for the Mexican REDD+ MRV. Though MAD-MEX represents a valuable first effort toward establishing a national reference emissions level for the implementation of REDD+ in Mexico, in this paper, we argue that this land cover system has important limitations that may prevent it from becoming operational for REDD+ MRV. Specifically, we show that (1) the accuracy assessment of MAD-MEX land cover maps is optimistically biased; (2) the ability of MAD-MEX to monitor land cover change, including deforestation and forest degradation; is poor and (3) the use of an entirely automatic classification approach, such as that followed by MAD-MEX, is highly problematic in the case of a large and heterogeneous country like Mexico. We discuss these limitations and call into question the ability of a land cover monitoring system, such as MAD-MEX, both to elaborate a national reference emissions level and to monitor future forest cover change, as part of a REDD+ MRV system. We provide some insights with the aim of improving the development of nation-wide land cover monitoring systems in Mexico and elsewhere. Full article
Show Figures

Figure 1

4 pages, 176 KiB  
Reply
Reply to Mas et al.: Comment on Gebhardt et al. MAD-MEX: Automatic Wall-to-Wall Land Cover Monitoring for the Mexican REDD-MRV Program Using All Landsat Data. Remote Sens. 2014, 6, 3923–3943
by Michael Schmidt 1,*, Steffen Gebhardt 1, Thilo Wehrmann 1, Rainer Ressl 1, Miguel Muñoz Ruiz 2, Carmen Meneses Tovar 2, Jorge Morfin 2, Raul Rodríguez 2, Enrique Serrano 2, Lucio Santos 3, Jesús Argumedo Espinoza 4, Carlos Elemen 4, Arturo Victoria 4 and Jose Luis Ornelas 4
1 National Commission for the Knowledge and Use of Biodiversity (CONABIO), Liga Periférico-Insurgentes Sur 4903, Parques del Pedregal, 14010 Tlalpan, Mexico City, Mexico
2 National Forestry Commission (CONAFOR), Periférico Poniente 5360, San Juan de Ocotán, Zapopan, 45019 Jalisco, Mexico
3 Regional Office for Latin America and the Caribbean, Food and Agriculture Organization of the United Nations (FAO), Av. Dag Hammarskjöld 3241, Vitacura, Santiago, Chile
4 National Institute for Statistics and Geography (INEGI), Héroe de Nacozari 2301 Sur, Jardines del Parque, 20270 Aguascalientes, Aguascalientes, Mexico
Remote Sens. 2016, 8(7), 534; https://doi.org/10.3390/rs8070534 - 23 Jun 2016
Cited by 1 | Viewed by 4621
Abstract
Mas, J.F. et al. have submitted a paper [1] for publication, which aims to respond to a paper published by Gebhardt et al. [2]. Mas, J.F. et al. had received a consultancy in 2013 to assess the quality of [...] Read more.
Mas, J.F. et al. have submitted a paper [1] for publication, which aims to respond to a paper published by Gebhardt et al. [2]. Mas, J.F. et al. had received a consultancy in 2013 to assess the quality of the early prototype products partly described in Gebhardt et al. in 2014. This consultancy, although a formal non-disclosure agreement had not been demanded, was awarded under the mutual understanding that the data handed over to Mas et al. constitute the early development phase of the program. Therefore, Mas et al. had been asked to give an assessment on the quality of the prototypes to obtain a proof of concept for the proposed workflow of MAD-Mex. It was clear that this assessment would suffer from limited availability of high quality training and validation data available in 2013. Mas et al. finally did not execute the consultancy due to the limited vector processing capacities in their lab. In October 2014, we sent the latest products, version 4.2 of the MAD-Mex products, including the more than 200,000 validation points gathered from independent expert interpreters of all Mexican ecosystems. Mas et al. did not respond to this transfer or to our request to collaborate in the quality control and assessment of MAD-Mex. Full article
13 pages, 5947 KiB  
Article
Spatial Autocorrelation and Uncertainty Associated with Remotely-Sensed Data
by Daniel A. Griffith *,† and Yongwan Chun
1 School of Economic, Political and Policy Sciences, The University of Texas at Dallas, 800 West Campbell Road, Richardson, TX 75080, USA
Daniel A. Griffith is an Ashbel Smith Professor.
Remote Sens. 2016, 8(7), 535; https://doi.org/10.3390/rs8070535 - 23 Jun 2016
Cited by 41 | Viewed by 8709
Abstract
Virtually all remotely sensed data contain spatial autocorrelation, which impacts upon their statistical features of uncertainty through variance inflation, and the compounding of duplicate information. Estimating the nature and degree of this spatial autocorrelation, which is usually positive and very strong, has been [...] Read more.
Virtually all remotely sensed data contain spatial autocorrelation, which impacts upon their statistical features of uncertainty through variance inflation, and the compounding of duplicate information. Estimating the nature and degree of this spatial autocorrelation, which is usually positive and very strong, has been hindered by computational intensity associated with the massive number of pixels in realistically-sized remotely-sensed images, a situation that more recently has changed. Recent advances in spatial statistical estimation theory support the extraction of information and the distilling of knowledge from remotely-sensed images in a way that accounts for latent spatial autocorrelation. This paper summarizes an effective methodological approach to achieve this end, illustrating results with a 2002 remotely sensed-image of the Florida Everglades, and simulation experiments. Specifically, uncertainty of spatial autocorrelation parameter in a spatial autoregressive model is modeled with a beta-beta mixture approach and is further investigated with three different sampling strategies: coterminous sampling, random sub-region sampling, and increasing domain sub-regions. The results suggest that uncertainty associated with remotely-sensed data should be cast in consideration of spatial autocorrelation. It emphasizes that one remaining challenge is to better quantify the spatial variability of spatial autocorrelation estimates across geographic landscapes. Full article
(This article belongs to the Special Issue Uncertainties in Remote Sensing)
Show Figures

Graphical abstract

18 pages, 2582 KiB  
Article
A Unified Algorithm for the Atmospheric Correction of Satellite Remote Sensing Data over Land and Ocean
by Zhihua Mao 1,2,*, Delu Pan 1, Xianqiang He 1, Jianyu Chen 1, Bangyi Tao 1, Peng Chen 1, Zengzhou Hao 1, Yan Bai 1, Qiankun Zhu 1 and Haiqing Huang 1
1 State Key Laboratory of Satellite Ocean Environment Dynamics, Second Institute of Oceanography, State Oceanic Administration, 36 Bochubeilu, Hangzhou 310012, China
2 Collaborative Innovation Center for South China Sea, Nanjing University, Nanjing 210046, China
Remote Sens. 2016, 8(7), 536; https://doi.org/10.3390/rs8070536 - 24 Jun 2016
Cited by 10 | Viewed by 5910
Abstract
The atmospheric correction of satellite observations is crucial for both land and ocean remote sensing. However, the optimal approach for each area is different due to the large spectra difference in the ground reflectance between land and ocean. A unified atmospheric correction (UAC) [...] Read more.
The atmospheric correction of satellite observations is crucial for both land and ocean remote sensing. However, the optimal approach for each area is different due to the large spectra difference in the ground reflectance between land and ocean. A unified atmospheric correction (UAC) approach based on a look-up table (LUT) of in situ measurements is developed to remove this difference. The LUT is used to select one spectrum as the in situ ground reflectance needed to obtain the initial aerosol reflectance, which in turn is used for determining the two closest aerosol models. The aerosol reflectance, obtained from these aerosol models, is then used to deduce the estimated ground reflectance. This UAC model is then used to process the Sea-viewing Wide Field-of-view Sensor (SeaWiFS) data, and its performance is validated with a large number of in situ measurements. The mean bias of the land reflectance for this model is 6.59% with a root mean square error (RMSE) of 19.61%. The mean bias and RMSE of the water-leaving reflectance are 7.59% and 17.10% validated by the in situ measurements using the above-water method, while they are 13.60% and 22.53% using the in-water method. The UAC model provides a useful tool for correcting the satellite-received reflectance without separately having to deal with land and ocean pixels. Further, it can seamlessly expand the satellite ocean color data for terrestrial use and improve quantitative remote sensing over land. Full article
Show Figures

Graphical abstract

17 pages, 1775 KiB  
Article
Assessment of Several Empirical Relationships for Deriving Daily Means of UV-A Irradiance from Meteosat-Based Estimates of the Total Irradiance
by Alexandr Aculinin 1,†, Colette Brogniez 2,†, Marc Bengulescu 3,†, Didier Gillotay 4,†, Frédérique Auriol 2,† and Lucien Wald 3,*
1 Laboratory of Materials for Photovoltaics and Photonics, Institute of Applied Physics, ASM, 2028 Kishinev, Moldova
2 Laboratoire d’Optique Atmosphérique, Université de Lille, 59655 Villeneuve d’Ascq Cedex, France
3 MINES ParisTech, PSL Research University, CS 10207, 06904 Sophia Antipolis Cedex, France
4 Institut d’Aéronomie Spatiale de Belgique, Avenue Circulaire, 3, 1180 Bruxelles, Belgium
These authors contributed equally to this work.
Remote Sens. 2016, 8(7), 537; https://doi.org/10.3390/rs8070537 - 24 Jun 2016
Cited by 9 | Viewed by 6297
Abstract
Daily estimates of the solar UV-A radiation (315–400 nm) at the surface, anywhere, anytime, are needed in many epidemiology studies. Satellite-derived databases of solar total irradiance, combined with empirical relationships converting totals into daily means of UV-A irradiance I U V , are [...] Read more.
Daily estimates of the solar UV-A radiation (315–400 nm) at the surface, anywhere, anytime, are needed in many epidemiology studies. Satellite-derived databases of solar total irradiance, combined with empirical relationships converting totals into daily means of UV-A irradiance I U V , are a means to satisfy such needs. Four empirical relationships are applied to three different databases: HelioClim-3 (versions 4 and 5) and CAMS Radiation Service—formerly known as MACC-RAD—derived from Meteosat images. The results of these combinations are compared to ground-based measurements located in mid-latitude Europe, mostly in Belgium. Whatever the database, the relationships of Podstawczynska (2010) and of Bilbao et al. (2011) exhibit very large underestimation and RMSE on the order of 40%–50% of the mean I U V . Better and more acceptable results are attained with the relationships proposed by Zavodska and Reichrt (1985) and that of Wald (2012). The relative RMSE is still large and in the range 10%–30% of the mean I U V . The correlation coefficients are large for all relationships. Each of them captures most of the variability contained in the UV measurements and can be used in studies where correlation plays a major role. Full article
Show Figures

Graphical abstract

27 pages, 6723 KiB  
Article
Antarctic Sea-Ice Thickness Retrieval from ICESat: Inter-Comparison of Different Approaches
by Stefan Kern 1,*, Burcu Ozsoy-Çiçek 2 and Anthony P. Worby 3
1 Integrated Climate Data Center (ICDC), Center for Earth System Research and Sustainability (CEN), University of Hamburg, 20144 Hamburg, Germany
2 Polar Research Center (PolReC), Maritime Faculty, Istanbul Technical University (ITU), 34940 Istanbul, Turkey
3 Antarctic Climate and Ecosystems Climate Research Center (ACE CRC), University of Tasmania, 7000 Hobart, TAS, Australia
Remote Sens. 2016, 8(7), 538; https://doi.org/10.3390/rs8070538 - 24 Jun 2016
Cited by 40 | Viewed by 10077
Abstract
Accurate circum-Antarctic sea-ice thickness is urgently required to better understand the different sea-ice cover evolution in both polar regions. Satellite radar and laser altimetry are currently the most promising tools for sea-ice thickness retrieval. We present qualitative inter-comparisons of winter and spring circum-Antarctic [...] Read more.
Accurate circum-Antarctic sea-ice thickness is urgently required to better understand the different sea-ice cover evolution in both polar regions. Satellite radar and laser altimetry are currently the most promising tools for sea-ice thickness retrieval. We present qualitative inter-comparisons of winter and spring circum-Antarctic sea-ice thickness computed with different approaches from Ice Cloud and land Elevation Satellite (ICESat) laser altimeter total (sea ice plus snow) freeboard estimates. We find that approach A, which assumes total freeboard equals snow depth, and approach B, which uses empirical linear relationships between freeboard and thickness, provide the lowest sea-ice thickness and the smallest winter-to-spring increase in seasonal average modal and mean sea-ice thickness: A: 0.0 m and 0.04 m, B: 0.17 and 0.16 m, respectively. Approach C uses contemporary snow depth from satellite microwave radiometry, and we derive comparably large sea-ice thickness. Here we observe an unrealistically large winter-to-spring increase in seasonal average modal and mean sea-ice thickness of 0.68 m and 0.65 m, respectively, which we attribute to biases in the snow depth. We present a conceptually new approach D. It assumes that the two-layer system (sea ice, snow) can be represented by one layer. This layer has a modified density, which takes into account the influence of the snow on sea-ice buoyancy. With approach D we obtain thickness values and a winter-to-spring increase in average modal and mean sea-ice thickness of 0.17 m and 0.23 m, respectively, which lay between those of approaches B and C. We discuss retrieval uncertainty, systematic uncertainty sources, and the impact of grid resolution. We find that sea-ice thickness obtained with approaches C and D agrees best with independent sea-ice thickness information—if we take into account the potential bias of in situ and ship-based observations. Full article
(This article belongs to the Special Issue Sea Ice Remote Sensing and Analysis)
Show Figures

Graphical abstract

13 pages, 1898 KiB  
Article
Four National Maps of Broad Forest Type Provide Inconsistent Answers to the Question of What Burns in Canada
by Guillermo Castilla *, Sebastien Rodrigue, Rob S. Skakun and Ron J. Hall
Natural Resources Canada, Canadian Forest Service, Northern Forestry Centre, 5320 122 St Edmonton, AB T6H 3S5, Canada
Remote Sens. 2016, 8(7), 539; https://doi.org/10.3390/rs8070539 - 24 Jun 2016
Cited by 4 | Viewed by 6988
Abstract
Wildfires are burning increasingly extensive areas of forest in Canada, reducing their capacity as carbon sinks. Here we compare the answers that four independent land cover datasets, produced from different satellite images (SPOT, Landsat, and MODIS), provide for the question of what burned [...] Read more.
Wildfires are burning increasingly extensive areas of forest in Canada, reducing their capacity as carbon sinks. Here we compare the answers that four independent land cover datasets, produced from different satellite images (SPOT, Landsat, and MODIS), provide for the question of what burned in Canada in recent years. We harmonized the different datasets into a common, simpler legend consisting of three classes of forest (needle-leaf, broadleaf, and mixed) plus non-forest, and resampled them to a common pixel size (250 m). Then we used annual maps of burned area to count, for each map and year from 2011 to 2014, the number of burned pixels of each class, and we tabulated them by terrestrial ecozone and Canada-wide. While all four maps agree that needle-leaf forest is the most frequently burned class in Canada, there is great disparity in the results from each map regarding the proportion of burned area that each class represents. Proportions reported by one map can be more than double those reported by another map, and more than four times at the ecozone level. We discuss the various factors that can explain the observed discrepancies and conclude that none of the maps provides a sufficiently accurate answer for applications such as carbon accounting. There is a need for better information in areas lacking forest inventory, especially in the vast unmanaged forest of Canada. Full article
(This article belongs to the Special Issue Validation and Inter-Comparison of Land Cover and Land Use Data)
Show Figures

Graphical abstract

19 pages, 10673 KiB  
Article
Do Red Edge and Texture Attributes from High-Resolution Satellite Data Improve Wood Volume Estimation in a Semi-Arid Mountainous Region?
by Paul Schumacher 1,*, Bunafsha Mislimshoeva 1, Alexander Brenning 2, Harald Zandler 3, Martin Brandt 4, Cyrus Samimi 3,5 and Thomas Koellner 1,5
1 Professorship of Ecological Services, Faculty of Biology, Chemistry and Geosciences, University of Bayreuth, 95440 Bayreuth, Germany
2 Department of Geography, Friedrich Schiller University, 07743 Jena, Germany
3 Institute of Geography, University of Bayreuth, 95440 Bayreuth, Germany
4 Department of Geosciences and Natural Resource Management, University of Copenhagen, 1350 Copenhagen, Denmark
5 Bayreuth Center of Ecology and Environmental Research (BayCEER), University of Bayreuth, 95440 Bayreuth, Germany
Remote Sens. 2016, 8(7), 540; https://doi.org/10.3390/rs8070540 - 24 Jun 2016
Cited by 44 | Viewed by 8505
Abstract
Remote sensing-based woody biomass quantification in sparsely-vegetated areas is often limited when using only common broadband vegetation indices as input data for correlation with ground-based measured biomass information. Red edge indices and texture attributes are often suggested as a means to overcome this [...] Read more.
Remote sensing-based woody biomass quantification in sparsely-vegetated areas is often limited when using only common broadband vegetation indices as input data for correlation with ground-based measured biomass information. Red edge indices and texture attributes are often suggested as a means to overcome this issue. However, clear recommendations on the suitability of specific proxies to provide accurate biomass information in semi-arid to arid environments are still lacking. This study contributes to the understanding of using multispectral high-resolution satellite data (RapidEye), specifically red edge and texture attributes, to estimate wood volume in semi-arid ecosystems characterized by scarce vegetation. LASSO (Least Absolute Shrinkage and Selection Operator) and random forest were used as predictive models relating in situ-measured aboveground standing wood volume to satellite data. Model performance was evaluated based on cross-validation bias, standard deviation and Root Mean Square Error (RMSE) at the logarithmic and non-logarithmic scales. Both models achieved rather limited performances in wood volume prediction. Nonetheless, model performance increased with red edge indices and texture attributes, which shows that they play an important role in semi-arid regions with sparse vegetation. Full article
(This article belongs to the Special Issue Remote Sensing of Vegetation Structure and Dynamics)
Show Figures

Graphical abstract

20 pages, 48966 KiB  
Article
Characterizing Urban Fabric Properties and Their Thermal Effect Using QuickBird Image and Landsat 8 Thermal Infrared (TIR) Data: The Case of Downtown Shanghai, China
by Hao Zhang 1,*, Xing-Min Jing 1, Jia-Yu Chen 1, Juan-Juan Li 2 and Ben Schwegler 3
1 Department of Environmental Science and Engineering, Fudan University, 220 Handan Road, Shanghai 200433, China
2 Disney Research China, The Walt Disney Company (China) Limited, 624 West Jianguo Road, Shanghai 200031, China
3 Department of Civil and Environmental Engineering, Stanford University, Stanford, CA 94305, USA
Remote Sens. 2016, 8(7), 541; https://doi.org/10.3390/rs8070541 - 24 Jun 2016
Cited by 25 | Viewed by 8239
Abstract
The combined usage of high-resolution satellite images and thermal infrared (TIR) data helps understanding the thermal effect of urban fabric properties and the mechanism of urban heat island (UHI) formation. In this study, three typical urban functional zones (UFZs) of downtown Shanghai were [...] Read more.
The combined usage of high-resolution satellite images and thermal infrared (TIR) data helps understanding the thermal effect of urban fabric properties and the mechanism of urban heat island (UHI) formation. In this study, three typical urban functional zones (UFZs) of downtown Shanghai were chosen for quantifying the relationship between fine-scale urban fabric properties and their thermal effect. Nine land surfaces and 146 aggregated land parcels extracted from a QuickBird image (dated 14 April 2014) were used to characterize urban fabric properties. The thermal effect was deduced from land surface temperature (LST), intra-UHI intensity, blackbody flux density (BBFD) and blackbody flux (BBF). The net BBF was retrieved from the Landsat 8 TIR band 10 dated 13 August 2013, and 28 May 2014. The products were resampled to fine resolution using a geospatial sharpening approach and further validated. The results show that: (1) On the UFZ level, there is a significant thermal differential among land surfaces. Water, well-vegetated land, high-rises with light color and high-rises with glass curtain walls exhibited relatively low LST, UHI intensity and BBFD. In contrast, mobile homes with light steel roofs, low buildings with bituminous roofs, asphalt roads and composite material pavements showed inverse trends for LST, UHI intensity, and BBFD; (2) It was found that parcel-based per ha net BBF, which offsets the “size-effect” among parcels, is more reasonable and comparable when quantifying excess surface flux emitted by the parcels; (3) When examining the relationship between parcel-level land surfaces and per ha BBF, a partial least squares (PLS) regression model showed that buildings and asphalt roads are major contributors to parcel-based per ha BBF, followed by other impervious surfaces. In contrast, vegetated land and water contribute with a much lower per ha net BBF to parcel warming. Full article
Show Figures

Graphical abstract

19 pages, 15079 KiB  
Article
Remote Sensing Measures Restoration Successes, but Canopy Heights Lag in Restoring Floodplain Vegetation
by Samantha K. Dawson 1,*, Adrian Fisher 1,2, Richard Lucas 1, David K. Hutchinson 3, Peter Berney 4, David Keith 1, Jane A. Catford 5,6 and Richard T. Kingsford 1
1 School of Biological Earth and Environmental Sciences, University of New South Wales, Sydney, 2052 NSW, Australia
2 Joint Remote Sensing Research Program, School of Geography, Planning and Environmental Management, University of Queensland, Brisbane, 4072 QLD, Australia
3 Department of Geological Sciences and Bolin Centre for Climate Research, Stockholm University, 10691 Stockholm, Sweden
4 NSW National Parks and Wildlife Service, Narrabri, 2390 NSW, Australia
5 School of BioSciences, University of Melbourne, Melbourne, 3010 VIC, Australia
6 Fenner School of Environment and Society, Australian National University, Canberra, 2601 ACT, Australia
Remote Sens. 2016, 8(7), 542; https://doi.org/10.3390/rs8070542 - 24 Jun 2016
Cited by 12 | Viewed by 7947
Abstract
Wetlands worldwide are becoming increasingly degraded, and this has motivated many attempts to manage and restore wetland ecosystems. Restoration actions require a large resource investment, so it is critical to measure the outcomes of these management actions. We evaluated the restoration of floodplain [...] Read more.
Wetlands worldwide are becoming increasingly degraded, and this has motivated many attempts to manage and restore wetland ecosystems. Restoration actions require a large resource investment, so it is critical to measure the outcomes of these management actions. We evaluated the restoration of floodplain wetland vegetation across a chronosequence of land uses, using remote sensing analyses. We compared the Landsat-based fractional cover of restoration areas with river red gum and lignum reference communities, which functioned as a fixed target for restoration, over three time periods: (i) before agricultural land use (1987–1997); (ii) during the peak of agricultural development (2004–2007); and (iii) post-restoration of flooding (2010–2015). We also developed LiDAR-derived canopy height models (CHMs) for comparison over the second and third time periods. Inundation was crucial for restoration, with many fields showing little sign of similarity to target vegetation until after inundation, even if agricultural land uses had ceased. Fields cleared or cultivated for only one year had greater restoration success compared to areas cultivated for three or more years. Canopy height increased most in the fields that were cleared and cultivated for a short duration, in contrast to those cultivated for >12 years, which showed few signs of recovery. Restoration was most successful in fields with a short development duration after the intervention, but resulting dense monotypic stands of river cooba require future monitoring and possibly intervention to prevent sustained dominance. Fields with intensive land use histories may need to be managed as alternative, drier flood-dependent vegetation communities, such as black box (Eucalyptus largiflorens) grasslands. Remotely-sensed data provided a powerful measurement technique for tracking restoration success over a large floodplain. Full article
(This article belongs to the Special Issue What can Remote Sensing Do for the Conservation of Wetlands?)
Show Figures

Graphical abstract

16 pages, 4747 KiB  
Article
Subsidence Monitoring over the Southern Coalfield, Australia Using both L-Band and C-Band SAR Time Series Analysis
by Zheyuan Du, Linlin Ge *, Xiaojing Li and Alex Hay-Man Ng
Geoscience and Earth Observing System Group (GEOS), School of Civil and Environmental Engineering, UNSW Australia, Sydney, NSW 2052, Australia
Remote Sens. 2016, 8(7), 543; https://doi.org/10.3390/rs8070543 - 24 Jun 2016
Cited by 51 | Viewed by 8386
Abstract
Land subsidence is a global issue and researchers from all over the world are keen to know the causes of deformation and its further influences. This paper reports the findings from time series InSAR (TS-InSAR) results over the Southern Coalfield, Australia using both [...] Read more.
Land subsidence is a global issue and researchers from all over the world are keen to know the causes of deformation and its further influences. This paper reports the findings from time series InSAR (TS-InSAR) results over the Southern Coalfield, Australia using both ALOS-1 PALSAR (Phased Array type L-band Synthetic Aperture Radar) and ENVISAT ASAR (Advanced Synthetic Aperture Radar) datasets. TS-InSAR has been applied to both rural and urban areas with great success, but very few of them have been applied to regions affected by underground mining activities. The TS-InSAR analysis exploited in this paper is based on GEOS-ATSA, and Measurement Point (MP) pixels are selected according to different geophysical features. Three experiment sites with different geological settings within the study zone are analysed: (1) Wollongong city, which is a relatively stable area; (2) Tahmoor town, a small town affected by underground mining activities; and (3) the Appin underground mining site, a region containing multiple underground mining activities. The TS-InSAR results show that the performance of both C-band and L-band is equally good over Wollongong, where the subsidence gradient is not significant and most subsidence rates are between −10 mm∙yr−1 to 10 mm∙yr−1. However, over the Tahmoor and Appin sites, difference in performances has been observed. Since the maximum displacement gradients that can be detected are different for L-band and C-band-based TS-InSAR methods, some rapid changes could cause the TS-InSAR to fail to estimate the correct displacements. It is well known that L-band can perform better than C-band, especially in underground mining regions and mining-affected regions where the deformation rate is much higher than city areas because of its wavelength. Statistical analyses are also conducted to further prove the above statement. Full article
Show Figures

Graphical abstract

20 pages, 3436 KiB  
Article
Characteristics and Diurnal Cycle of GPM Rainfall Estimates over the Central Amazon Region
by Rômulo Oliveira 1,2,*, Viviana Maggioni 2, Daniel Vila 1 and Carlos Morales 3
1 Centro de Previsão de Tempo e Estudos Climáticos (CPTEC), Instituto Nacional de Pesquisas Espaciais (INPE), São Jos é dos Campos, SP 12227-010, Brazil
2 Department of Civil, Environmental, and Infrastructure Engineering, George Mason University (GMU), Fairfax, VA 22030, USA
3 Departamento de Ciências Atmosféricas (DCA), Instituto de Astronomia, Geofísica e Ciências Atmosféricas (IAG), Universidade de São Paulo (USP), São Paulo, SP 05508-900, Brazil
Remote Sens. 2016, 8(7), 544; https://doi.org/10.3390/rs8070544 - 25 Jun 2016
Cited by 50 | Viewed by 8895
Abstract
Studies that investigate and evaluate the quality, limitations and uncertainties of satellite rainfall estimates are fundamental to assure the correct and successful use of these products in applications, such as climate studies, hydrological modeling and natural hazard monitoring. Over regions of the globe [...] Read more.
Studies that investigate and evaluate the quality, limitations and uncertainties of satellite rainfall estimates are fundamental to assure the correct and successful use of these products in applications, such as climate studies, hydrological modeling and natural hazard monitoring. Over regions of the globe that lack in situ observations, such studies are only possible through intensive field measurement campaigns, which provide a range of high quality ground measurements, e.g., CHUVA (Cloud processes of tHe main precipitation systems in Brazil: A contribUtion to cloud resolVing modeling and to the GlobAl Precipitation Measurement) and GoAmazon (Observations and Modeling of the Green Ocean Amazon) over the Brazilian Amazon during 2014/2015. This study aims to assess the characteristics of Global Precipitation Measurement (GPM) satellite-based precipitation estimates in representing the diurnal cycle over the Brazilian Amazon. The Integrated Multi-satellitE Retrievals for Global Precipitation Measurement (IMERG) and the Goddard Profiling Algorithm—Version 2014 (GPROF2014) algorithms are evaluated against ground-based radar observations. Specifically, the S-band weather radar from the Amazon Protection National System (SIPAM), is first validated against the X-band CHUVA radar and then used as a reference to evaluate GPM precipitation. Results showed satisfactory agreement between S-band SIPAM radar and both IMERG and GPROF2014 algorithms. However, during the wet season, IMERG, which uses the GPROF2014 rainfall retrieval from the GPM Microwave Imager (GMI) sensor, significantly overestimates the frequency of heavy rainfall volumes around 00:00–04:00 UTC and 15:00–18:00 UTC. This overestimation is particularly evident over the Negro, Solimões and Amazon rivers due to the poorly-calibrated algorithm over water surfaces. On the other hand, during the dry season, the IMERG product underestimates mean precipitation in comparison to the S-band SIPAM radar, mainly due to the fact that isolated convective rain cells in the afternoon are not detected by the satellite precipitation algorithm. Full article
(This article belongs to the Special Issue Uncertainties in Remote Sensing)
Show Figures

Graphical abstract

20 pages, 7238 KiB  
Article
Integrating Crowdsourced Data with a Land Cover Product: A Bayesian Data Fusion Approach
by Sarah Gengler * and Patrick Bogaert
Earth and Life Institute, Environmental Sciences, Université Catholique de Louvain, Croix du Sud 2/L7.05.16, B-1348 Louvain-la-Neuve, Belgium
Remote Sens. 2016, 8(7), 545; https://doi.org/10.3390/rs8070545 - 27 Jun 2016
Cited by 17 | Viewed by 5220
Abstract
For many environmental applications, an accurate spatial mapping of land cover is a major concern. Currently, land cover products derived from satellite data are expected to offer a fast and inexpensive way of mapping large areas. However, the quality of these products may [...] Read more.
For many environmental applications, an accurate spatial mapping of land cover is a major concern. Currently, land cover products derived from satellite data are expected to offer a fast and inexpensive way of mapping large areas. However, the quality of these products may also largely depend on the area under study. As a result, it is common that various products disagree with each other, and the assessment of their respective quality still relies on ground validation datasets. Recently, crowdsourced data have been suggested as an alternate source of information that might help overcome this problem. However, crowdsourced data still remain largely discarded in scientific studies due to their inherent poor quality assurance. The aim of this paper is to present an efficient methodology that allows the user to code information brought by crowdsourced data even if no prior quality estimation is at hand and possibly to fuse this information with existing land cover products in order to improve their accuracy. It is first suggested that information brought by volunteers can be coded as a set of inequality constraints about the probabilities of the various land use classes at the visited places. This in turn allows estimating optimal probabilities based on a maximum entropy principle and to proceed afterwards with a spatial interpolation of these volunteers’ information. Finally, a Bayesian data fusion approach can be used for fusing multiple volunteers’ contributions with a remotely-sensed land cover product. This methodology is illustrated in this paper by focusing on the mapping of croplands in Ethiopia, where the aim is to improve the mapping of cropland as coming out from a land cover product with mitigated performances. It is shown how crowdsourced information can seriously improve the quality of the final product. The corresponding results also suggest that a prior assessing of remotely-sensed data quality can seriously improve the benefit of crowdsourcing campaigns, so that both sources of information need to be accounted together in order to optimize the sampling efforts. Full article
Show Figures

Graphical abstract

21 pages, 5116 KiB  
Article
In-Orbit Radiometric Calibration and Stability Monitoring of the PROBA-V Instrument
by Sindy Sterckx 1,*, Stefan Adriaensen 1, Wouter Dierckx 1 and Marc Bouvet 2
1 Flemish Institute for Technological Research (VITO)—Remote Sensing Unit, Boeretang 200, 2400 Mol, Belgium
2 ESA-ESTEC—Keplerlaan 1, PB 299, 2200 AG Noordwijk, The Netherlands
Remote Sens. 2016, 8(7), 546; https://doi.org/10.3390/rs8070546 - 29 Jun 2016
Cited by 11 | Viewed by 5935
Abstract
Since its launch in May 2013, the in-orbit radiometric performance of PROBA-V has been continuously monitored. Due to the absence of on-board calibration devices, in-flight performance monitoring and calibration relies fully on vicarious calibration methods. In this paper, the multiple vicarious calibration techniques [...] Read more.
Since its launch in May 2013, the in-orbit radiometric performance of PROBA-V has been continuously monitored. Due to the absence of on-board calibration devices, in-flight performance monitoring and calibration relies fully on vicarious calibration methods. In this paper, the multiple vicarious calibration techniques used to verify radiometric accuracy and to perform calibration parameter updates are discussed. Details are given of the radiometric calibration activities during both the commissioning and operational phase. The stability of the instrument in terms of overall radiometry and dark current is analyzed. Results of an independent comparison against MERIS and SPOT VEGETATION-2 are presented. Finally, an outlook is provided of the on-going activities aimed at improving both data consistency over time and within-scene uniformity. Full article
Show Figures

Graphical abstract

17 pages, 13189 KiB  
Article
Object-Based Assessment of Satellite Precipitation Products
by Jingjing Li 1,*, Kuo-Lin Hsu 2, Amir AghaKouchak 2 and Soroosh Sorooshian 2
1 Department of Geosciences and Environment, California State University Los Angeles, Los Angeles, CA 90032, USA
2 Center for Hydrometeorology and Remote Sensing, Department of Civil and Environmental Engineering, University of California Irvine, Irvine, CA 92697, USA
Remote Sens. 2016, 8(7), 547; https://doi.org/10.3390/rs8070547 - 27 Jun 2016
Cited by 23 | Viewed by 5850
Abstract
An object-based verification approach is employed to assess the performance of the commonly used high-resolution satellite precipitation products: Precipitation Estimation from Remotely Sensed Information using Artificial Neural Networks (PERSIANN), Climate Prediction center MORPHing technique (CMORPH), and Tropical Rainfall Measurement Mission (TRMM) Multi-Satellite Precipitation [...] Read more.
An object-based verification approach is employed to assess the performance of the commonly used high-resolution satellite precipitation products: Precipitation Estimation from Remotely Sensed Information using Artificial Neural Networks (PERSIANN), Climate Prediction center MORPHing technique (CMORPH), and Tropical Rainfall Measurement Mission (TRMM) Multi-Satellite Precipitation Analysis (TMPA) 3B42RT. The evaluation of the satellite precipitation products focuses on the skill of depicting the geometric features of the localized precipitation areas. Seasonal variability of the performances of these products against the ground observations is investigated through the examples of warm and cold seasons. It is found that PERSIANN is capable of depicting the orientation of the localized precipitation areas in both seasons. CMORPH has the ability to capture the sizes of the localized precipitation areas and performs the best in the overall assessment for both seasons. 3B42RT is capable of depicting the location of the precipitation areas for both seasons. In addition, all of the products perform better on capturing the sizes and centroids of precipitation areas in the warm season than in the cold season, while they perform better on depicting the intersection area and orientation in the cold season than in the warm season. These products are more skillful on correctly detecting the localized precipitation areas against the observations in the warm season than in the cold season. Full article
Show Figures

Graphical abstract

23 pages, 7588 KiB  
Article
Discrimination between Ground Vegetation and Small Pioneer Trees in the Boreal-Alpine Ecotone Using Intensity Metrics Derived from Airborne Laser Scanner Data
by Erik Næsset
Department of Ecology and Natural Resource Management, P.O. Box 5003, N-1432 Ås, Norway
Remote Sens. 2016, 8(7), 548; https://doi.org/10.3390/rs8070548 - 28 Jun 2016
Cited by 4 | Viewed by 4809
Abstract
It has been shown that height measurements obtained by airborne laser scanning (ALS) with high point density (>7–8 m−2) can be used to detect small trees in the alpine tree line—an ecotone sensitive to climate change. Because the height measurements do [...] Read more.
It has been shown that height measurements obtained by airborne laser scanning (ALS) with high point density (>7–8 m−2) can be used to detect small trees in the alpine tree line—an ecotone sensitive to climate change. Because the height measurements do not discriminate between trees and other convex structures with positive height values, this study aimed at assessing the contribution of ALS backscatter intensity to classification of trees and non-trees. The study took place in a boreal-alpine ecotone in southeastern Norway and was based on 500 precisely georeferenced small trees and non-tree objects for which ALS height and intensity were derived from four different ALS acquisitions, representing different sensors, pulse repetition frequencies (PRF), and flying altitudes. The sensors operated at 1064 nm. Based on logistic regression modeling, it was found that classification into three different tree species ((1) spruce; (2) pine; and (3) birch)) and two different non-tree object types (objects with: (1) vegetated surface; and (2) rock) was significantly better (p < 0.001–0.05) than a classification based on models with trees and non-trees as binary response. The cause of the improved classification is mainly diverse reflectivity properties of non-tree objects. No effect of sensor, PRF, and flying altitude was found (p > 0.05). Finally, it was revealed that in a direct comparison of the contribution of intensity backscatter to improve classification models of trees and non-trees beyond what could be obtained by using the ALS height information only, the contribution of intensity turned out to be far from significant (p > 0.05). In conclusion, ALS backscatter intensity seems to be of little help in classification of small trees and non-trees in the boreal-alpine ecotone even when a more detailed discrimination on different species and different non-tree structures is applied. Full article
Show Figures

Figure 1

19 pages, 11852 KiB  
Article
Multi-Feature Object-Based Change Detection Using Self-Adaptive Weight Change Vector Analysis
by Qiang Chen 1,2 and Yunhao Chen 1,2,*
1 State Key Laboratory of Earth Surface Processes and Resource Ecology, Beijing Normal University, Beijing 100875, China
2 College of Resources Science and Technology, Beijing Normal University, Beijing 100875, China
Remote Sens. 2016, 8(7), 549; https://doi.org/10.3390/rs8070549 - 28 Jun 2016
Cited by 53 | Viewed by 7277
Abstract
Change detection in multi-temporal remote sensing images has usually been treated as a problem of explicitly detecting land cover transitions. To date, multi-dimensional change vector analysis has been an effective solution to such problems. However, using change vector analysis makes it hard to [...] Read more.
Change detection in multi-temporal remote sensing images has usually been treated as a problem of explicitly detecting land cover transitions. To date, multi-dimensional change vector analysis has been an effective solution to such problems. However, using change vector analysis makes it hard to calculate multiple directions or kinds of change. Through combining multi-feature object-based image analysis and change vector analysis, this paper presents a novel method for object-based change detection of multiple changes. Our technique, named self-adaptive weight-change vector analysis, carries out: (1) change vector analysis to determine magnitude and direction of changes; and (2) self-adaptive weight-based analysis of the standard deviation of image objects. Furthermore, a polar representation has been adopted to acquire visual change information for image objects. This paper proposes an automatic technique that can be applied to the field of multi-feature object-based change detection for very high resolution remotely sensed images. The two-step automatic detection strategy includes extraction of changed objects using an expectation-maximization algorithm to estimate the threshold under a Gaussian assumption, and identification of different kinds of changes using a K-means clustering algorithm. The effectiveness of our approach has been tested on both multispectral and panchromatic fusion images. Results of these two experimental cases confirm that this approach can detect multiple kinds of change. We found that self-adaptive weight-change vector analysis had superior capabilities of object-based change detection compared with standard change vector analysis, yielding Kappa statistics of 0.7976 and 0.7508 for Cases 1 and 2, respectively. Full article
Show Figures

Graphical abstract

25 pages, 7801 KiB  
Technical Note
A Multi-Data Source and Multi-Sensor Approach for the 3D Reconstruction and Web Visualization of a Complex Archaelogical Site: The Case Study of “Tolmo De Minateda”
by Jose Alberto Torres-Martínez 1,*, Marcello Seddaiu 2, Pablo Rodríguez-Gonzálvez 1, David Hernández-López 3 and Diego González-Aguilera 1
1 Department of Cartographic and Land Engineering, High School of Ávila, University of Salamanca, 37008 Salamanca, Spain
2 Dipartimento di Storia, Scienze dell’ Uomo e della Formazione, Università degli Studi di Sassari, 07100 Sassari, Italy
3 Regional Development Institute-IDR, University of Castilla-La Mancha, Albacete 02071, Spain
Remote Sens. 2016, 8(7), 550; https://doi.org/10.3390/rs8070550 - 29 Jun 2016
Cited by 28 | Viewed by 7903
Abstract
The complexity of archaeological sites hinders creation of an integral model using the current Geomatic techniques (i.e., aerial, close-range photogrammetry and terrestrial laser scanner) individually. A multi-sensor approach is therefore proposed as the optimal solution to provide a 3D reconstruction and visualization of [...] Read more.
The complexity of archaeological sites hinders creation of an integral model using the current Geomatic techniques (i.e., aerial, close-range photogrammetry and terrestrial laser scanner) individually. A multi-sensor approach is therefore proposed as the optimal solution to provide a 3D reconstruction and visualization of these complex sites. Sensor registration represents a riveting milestone when automation is required and when aerial and terrestrial datasets must be integrated. To this end, several problems must be solved: coordinate system definition, geo-referencing, co-registration of point clouds, geometric and radiometric homogeneity, etc. The proposed multi-data source and multi-sensor approach is applied to the study case of the “Tolmo de Minateda” archaeological site. A total extension of 9 ha is reconstructed, with an adapted level of detail, by an ultralight aerial platform (paratrike), an unmanned aerial vehicle, a terrestrial laser scanner and terrestrial photogrammetry. Finally, a mobile device (e.g., tablet or smartphone) has been used to integrate, optimize and visualize all this information, providing added value to archaeologists and heritage managers who want to use an efficient tool for their works at the site, and even for non-expert users who just want to know more about the archaeological settlement. Full article
Show Figures

Graphical abstract

16 pages, 4337 KiB  
Article
Calibration and Validation of Landsat Tree Cover in the Taiga−Tundra Ecotone
by Paul Mannix Montesano 1,2,*, Christopher S. R. Neigh 2, Joseph Sexton 3, Min Feng 3, Saurabh Channan 3, Kenneth J. Ranson 2 and John R. Townshend 3
1 Science Systems and Applications, Inc., Lanham, MD 20706, USA
2 Biospheric Sciences Laboratory, Code 618, NASA Goddard Space Flight Center, Greenbelt, MD 20771, USA
3 Global Land Cover Facility, Department of Geographical Sciences, University of Maryland, College Park, MD 20742, USA
Remote Sens. 2016, 8(7), 551; https://doi.org/10.3390/rs8070551 - 29 Jun 2016
Cited by 32 | Viewed by 9008
Abstract
Monitoring current forest characteristics in the taiga−tundra ecotone (TTE) at multiple scales is critical for understanding its vulnerability to structural changes. A 30 m spatial resolution Landsat-based tree canopy cover map has been calibrated and validated in the TTE with reference tree cover [...] Read more.
Monitoring current forest characteristics in the taiga−tundra ecotone (TTE) at multiple scales is critical for understanding its vulnerability to structural changes. A 30 m spatial resolution Landsat-based tree canopy cover map has been calibrated and validated in the TTE with reference tree cover data from airborne LiDAR and high resolution spaceborne images across the full range of boreal forest tree cover. This domain-specific calibration model used estimates of forest height to determine reference forest cover that best matched Landsat estimates. The model removed the systematic under-estimation of tree canopy cover >80% and indicated that Landsat estimates of tree canopy cover more closely matched canopies at least 2 m in height rather than 5 m. The validation improved estimates of uncertainty in tree canopy cover in discontinuous TTE forests for three temporal epochs (2000, 2005, and 2010) by reducing systematic errors, leading to increases in tree canopy cover uncertainty. Average pixel-level uncertainties in tree canopy cover were 29.0%, 27.1% and 31.1% for the 2000, 2005 and 2010 epochs, respectively. Maps from these calibrated data improve the uncertainty associated with Landsat tree canopy cover estimates in the discontinuous forests of the circumpolar TTE. Full article
(This article belongs to the Special Issue Validation and Inter-Comparison of Land Cover and Land Use Data)
Show Figures

Graphical abstract

24 pages, 13508 KiB  
Article
Classification and Monitoring of Reed Belts Using Dual-Polarimetric TerraSAR-X Time Series
by Iris Heine 1,*, Thomas Jagdhuber 2 and Sibylle Itzerott 1
1 GFZ German Research Centre for Geosciences, Telegrafenberg, 14473 Potsdam, Germany
2 Microwaves and Radar Institute, German Aerospace Center (DLR), Münchener Str. 20, 82234 Wessling, Germany
Remote Sens. 2016, 8(7), 552; https://doi.org/10.3390/rs8070552 - 29 Jun 2016
Cited by 28 | Viewed by 6783
Abstract
Synthetic aperture radar polarimetry (PolSAR) and polarimetric decomposition techniques have proven to be useful tools for wetland mapping. In this study we classify reed belts and monitor their phenological changes at a natural lake in northeastern Germany using dual-co-polarized (HH, VV) TerraSAR-X time [...] Read more.
Synthetic aperture radar polarimetry (PolSAR) and polarimetric decomposition techniques have proven to be useful tools for wetland mapping. In this study we classify reed belts and monitor their phenological changes at a natural lake in northeastern Germany using dual-co-polarized (HH, VV) TerraSAR-X time series. The time series comprises 19 images, acquired between August 2014 and May 2015, in ascending and descending orbit. We calculated different polarimetric indices using the HH and VV intensities, the dual-polarimetric coherency matrix including dominant and mean alpha scattering angles, and entropy and anisotropy (normalized eigenvalue difference) as well as combinations of entropy and anisotropy for the analysis of the scattering scenarios. The image classifications were performed with the random forest classifier and validated with high-resolution digital orthophotos. The time series analysis of the reed belts revealed significant seasonal changes for the double-bounce–sensitive parameters (intensity ratio HH/VV and intensity difference HH-VV, the co-polarimetric coherence phase and the dominant and mean alpha scattering angles) and in the dual-polarimetric coherence (amplitude), anisotropy, entropy, and anisotropy-entropy combinations; whereas in summer dense leaves cause volume scattering, in winter, after leaves have fallen, the reed stems cause predominately double-bounce scattering. Our study showed that the five most important parameters for the classification of reed are the intensity difference HH-VV, the mean alpha scattering angle, intensity ratio HH/VV, and the coherence (phase). Due to the better separation of reed and other vegetation (deciduous forest, coniferous forest, meadow), winter acquisitions are preferred for the mapping of reed. Multi-temporal stacks of winter images performed better than summer ones. The combination of ascending and descending images also improved the result as it reduces the influence of the sensor look direction. However, in this study, only an accuracy of ~50% correct classified reed areas was reached. Whereas the shorelines with reed areas (>10 m broad) could be detected correctly, the actual reed areas were significantly overestimated. The main source of error is probably the challenging data geocoding causing geolocation inaccuracies, which need to be solved in future studies. Full article
(This article belongs to the Special Issue Calibration and Validation of Synthetic Aperture Radar)
Show Figures

Graphical abstract

19 pages, 3850 KiB  
Article
Application of Helmert Variance Component Based Adaptive Kalman Filter in Multi-GNSS PPP/INS Tightly Coupled Integration
by Zhouzheng Gao 1,2,3, Wenbin Shen 1, Hongping Zhang 2,*, Maorong Ge 3 and Xiaoji Niu 2
1 School of Geodesy and Geomatics, Wuhan University, 129 Luoyu Road, Wuhan 430079, China
2 GNSS Research Center, Wuhan University, 129 Luoyu Road, Wuhan 430079, China
3 German Research Centre for Geosciences (GFZ), Telegrafenberg, Potsdam 14473, Germany
Remote Sens. 2016, 8(7), 553; https://doi.org/10.3390/rs8070553 - 29 Jun 2016
Cited by 43 | Viewed by 8133
Abstract
The integration of the Global Positioning System (GPS) and the Inertial Navigation System (INS) based on Real-time Kinematic (RTK) and Single Point Positioning (SPP) technology have been applied as a powerful approach in kinematic positioning and attitude determination. However, the accuracy of RTK [...] Read more.
The integration of the Global Positioning System (GPS) and the Inertial Navigation System (INS) based on Real-time Kinematic (RTK) and Single Point Positioning (SPP) technology have been applied as a powerful approach in kinematic positioning and attitude determination. However, the accuracy of RTK and SPP based GPS/INS integration mode will degrade visibly along with the increasing user-base distance and the quality of pseudo-range. In order to overcome such weaknesses, the tightly coupled integration between GPS Precise Point Positioning (PPP) and INS was proposed recently. Because of the rapid development of the multi-constellation Global Navigation Satellite System (multi-GNSS), we introduce the multi-GNSS into the tightly coupled integration of PPP and INS in this paper. Meanwhile, in order to weaken the impacts of the GNSS observations with low quality and the inaccurate state model on the performance of the multi-GNSS PPP/INS tightly coupled integration, the Helmert variance component estimation based adaptive Kalman filter is employed in the algorithm implementation. Finally, a set of vehicle-borne GPS + BeiDou + GLONASS and Micro-Electro-Mechanical-Systems (MEMS) INS data is analyzed to evaluate the performance of such algorithm. The statistics indicate that the performance of the multi-GNSS PPP/INS tightly coupled integration can be enhanced significantly in terms of both position accuracy and convergence time. Full article
(This article belongs to the Special Issue Multi-Sensor and Multi-Data Integration in Remote Sensing)
Show Figures

Graphical abstract

18 pages, 2171 KiB  
Article
Creating a Regional MODIS Satellite-Driven Net Primary Production Dataset for European Forests
by Mathias Neumann 1,*, Adam Moreno 1, Christopher Thurnher 1, Volker Mues 2, Sanna Härkönen 3,4, Matteo Mura 5,6, Olivier Bouriaud 7, Mait Lang 8, Giuseppe Cardellini 9, Alain Thivolle-Cazat 10, Karol Bronisz 11, Jan Merganic 12, Iciar Alberdi 13, Rasmus Astrup 14, Frits Mohren 15, Maosheng Zhao 16 and Hubert Hasenauer 1
1 Institute of Silviculture, Department of Forest and Soil Sciences, University of Natural Resources and Life Sciences, Vienna 1190, Austria
2 Centre for Wood Science, World Forestry, University of Hamburg, Hamburg 21031, Germany
3 Department of Forest Sciences, University of Helsinki, Helsinki 00014, Finland
4 Finnish Forest Research Institute, Joensuu 80101, Finland
5 Department of Bioscience and Territory, University of Molise, 86090 Pesche (IS), Italy
6 geoLAB—Laboratory of Forest Geomatics, Department of Agricultural, Food and Forestry Systems, Università degli Studi di Firenze, Firenze 50145, Italy
7 Facuty of Forestry, Universitatea Stefan del Mare, Suceava 720229, Romania
8 Tartu Observatory, Tõravere 61602, Estonia
9 Division Forest, Nature and Landscape, Department of Earth and Environmental Sciences, KU Leuven—University of Leuven, Leuven 3001, Belgium
10 Technological Institute, Furniture, Environment, Economy, Primary Processing and Supply, Champs sur Marne 77420, France
11 Laboratory of Dendrometry and Forest Productivity, Faculty of Forestry, Warsaw University of Life Sciences, Warsaw 02-776, Poland
12 Faculty of Forestry and Wood Sciences, Czech University of Life Sciences, Prague 16521, Czech Republic
13 Departamento de Selvicultura y Gestión de los Sistemas Forestales, INIA-CIFOR, Madrid 28040, Spain
14 Norwegian Institute for Bioeconomy Research, Ås 1431, Norway
15 Forest Ecology and Forest Management Group, Wageningen University, Wageningen 6700, The Netherlands
16 Department of Geographical Sciences, University of Maryland, Collage Park, MD 20742, USA
add Show full affiliation list remove Hide full affiliation list
Remote Sens. 2016, 8(7), 554; https://doi.org/10.3390/rs8070554 - 29 Jun 2016
Cited by 49 | Viewed by 11938
Abstract
Net primary production (NPP) is an important ecological metric for studying forest ecosystems and their carbon sequestration, for assessing the potential supply of food or timber and quantifying the impacts of climate change on ecosystems. The global MODIS NPP dataset using the MOD17 [...] Read more.
Net primary production (NPP) is an important ecological metric for studying forest ecosystems and their carbon sequestration, for assessing the potential supply of food or timber and quantifying the impacts of climate change on ecosystems. The global MODIS NPP dataset using the MOD17 algorithm provides valuable information for monitoring NPP at 1-km resolution. Since coarse-resolution global climate data are used, the global dataset may contain uncertainties for Europe. We used a 1-km daily gridded European climate data set with the MOD17 algorithm to create the regional NPP dataset MODIS EURO. For evaluation of this new dataset, we compare MODIS EURO with terrestrial driven NPP from analyzing and harmonizing forest inventory data (NFI) from 196,434 plots in 12 European countries as well as the global MODIS NPP dataset for the years 2000 to 2012. Comparing these three NPP datasets, we found that the global MODIS NPP dataset differs from NFI NPP by 26%, while MODIS EURO only differs by 7%. MODIS EURO also agrees with NFI NPP across scales (from continental, regional to country) and gradients (elevation, location, tree age, dominant species, etc.). The agreement is particularly good for elevation, dominant species or tree height. This suggests that using improved climate data allows the MOD17 algorithm to provide realistic NPP estimates for Europe. Local discrepancies between MODIS EURO and NFI NPP can be related to differences in stand density due to forest management and the national carbon estimation methods. With this study, we provide a consistent, temporally continuous and spatially explicit productivity dataset for the years 2000 to 2012 on a 1-km resolution, which can be used to assess climate change impacts on ecosystems or the potential biomass supply of the European forests for an increasing bio-based economy. MODIS EURO data are made freely available at ftp://palantir.boku.ac.at/Public/MODIS_EURO. Full article
Show Figures

Graphical abstract

24 pages, 3512 KiB  
Article
Fast Binary Coding for the Scene Classification of High-Resolution Remote Sensing Imagery
by Fan Hu 1,2, Gui-Song Xia 1,*, Jingwen Hu 1,2, Yanfei Zhong 1 and Kan Xu 3
1 State Key Laboratory of Information Engineering in Surveying, Mapping and Remote Sensing (LIESMARS), Wuhan 430079, China
2 Electronic Information School, Wuhan University, Wuhan 430072, China
3 Global Navigation Satellite System (GNSS) Research Center, Wuhan University, Wuhan 430079, China
Remote Sens. 2016, 8(7), 555; https://doi.org/10.3390/rs8070555 - 30 Jun 2016
Cited by 21 | Viewed by 7706
Abstract
Scene classification of high-resolution remote sensing (HRRS) imagery is an important task in the intelligent processing of remote sensing images and has attracted much attention in recent years. Although the existing scene classification methods, e.g., the bag-of-words (BOW) model and its variants, can [...] Read more.
Scene classification of high-resolution remote sensing (HRRS) imagery is an important task in the intelligent processing of remote sensing images and has attracted much attention in recent years. Although the existing scene classification methods, e.g., the bag-of-words (BOW) model and its variants, can achieve acceptable performance, these approaches strongly rely on the extraction of local features and the complicated coding strategy, which are usually time consuming and demand much expert effort. In this paper, we propose a fast binary coding (FBC) method, to effectively generate efficient discriminative scene representations of HRRS images. The main idea is inspired by the unsupervised feature learning technique and the binary feature descriptions. More precisely, equipped with the unsupervised feature learning technique, we first learn a set of optimal “filters” from large quantities of randomly-sampled image patches and then obtain feature maps by convolving the image scene with the learned filters. After binarizing the feature maps, we perform a simple hashing step to convert the binary-valued feature map to the integer-valued feature map. Finally, statistical histograms computed on the integer-valued feature map are used as global feature representations of the scenes of HRRS images, similar to the conventional BOW model. The analysis of the algorithm complexity and experiments on HRRS image datasets demonstrate that, in contrast with existing scene classification approaches, the proposed FBC has much faster computational speed and achieves comparable classification performance. In addition, we also propose two extensions to FBC, i.e., the spatial co-occurrence matrix and different visual saliency maps, for further improving its final classification accuracy. Full article
Show Figures

Graphical abstract

23 pages, 3694 KiB  
Article
A Semi-Analytic Model for Estimating Total Suspended Sediment Concentration in Turbid Coastal Waters of Northern Western Australia Using MODIS-Aqua 250 m Data
by Passang Dorji *, Peter Fearns and Mark Broomhall
Remote Sensing and Satellite Research Group, Curtin University, GPO Box U1987, Perth, WA 6845, Australia
Remote Sens. 2016, 8(7), 556; https://doi.org/10.3390/rs8070556 - 30 Jun 2016
Cited by 45 | Viewed by 9730
Abstract
Knowledge of the concentration of total suspended sediment (TSS) in coastal waters is of significance to marine environmental monitoring agencies to determine the turbidity of water that serve as a proxy to estimate the availability of light at depth for benthic habitats. TSS [...] Read more.
Knowledge of the concentration of total suspended sediment (TSS) in coastal waters is of significance to marine environmental monitoring agencies to determine the turbidity of water that serve as a proxy to estimate the availability of light at depth for benthic habitats. TSS models applicable to data collected by satellite sensors can be used to determine TSS with reasonable accuracy and of adequate spatial and temporal resolution to be of use for coastal water quality monitoring. Thus, a study is presented here where we develop a semi-analytic sediment model (SASM) applicable to any sensor with red and near infrared (NIR) bands. The calibration and validation of the SASM using bootstrap and cross-validation methods showed that the SASM applied to Moderate Resolution Imaging Spectroradiometer (MODIS)-Aqua band 1 data retrieved TSS with a root mean square error (RMSE) and mean averaged relative error (MARE) of 5.75 mg/L and 33.33% respectively. The application of the SASM over our study region using MODIS-Aqua band 1 data showed that the SASM can be used to monitor the on-going, post and pre-dredging activities and identify daily TSS anomalies that are caused by natural and anthropogenic processes in coastal waters of northern Western Australia. Full article
Show Figures

Graphical abstract

24 pages, 3583 KiB  
Article
Remote Sensing of Grass Response to Drought Stress Using Spectroscopic Techniques and Canopy Reflectance Model Inversion
by Bagher Bayat *, Christiaan Van der Tol and Wouter Verhoef
Faculty of Geo-Information Science and Earth Observation (ITC), University of Twente, P.O. Box 217, 7500 AE Enschede, The Netherlands
Remote Sens. 2016, 8(7), 557; https://doi.org/10.3390/rs8070557 - 1 Jul 2016
Cited by 68 | Viewed by 11454
Abstract
The aim of this study was to follow the response to drought stress in a Poa pratensis canopy exposed to various levels of soil moisture deficit. We tracked the changes in the canopy reflectance (450–2450 nm) and retrieved vegetation properties (Leaf Area Index [...] Read more.
The aim of this study was to follow the response to drought stress in a Poa pratensis canopy exposed to various levels of soil moisture deficit. We tracked the changes in the canopy reflectance (450–2450 nm) and retrieved vegetation properties (Leaf Area Index (LAI), leaf chlorophyll content (Cab), leaf water content (Cw), leaf dry matter content (Cdm) and senescent material (Cs)) during a drought episode. Spectroscopic techniques and radiative transfer model (RTM) inversion were employed to monitor the gradual manifestation of drought effects in a laboratory setting. Plots of 21 cm × 14.5 cm surface area with Poa pratensis plants that formed a closed canopy were divided into a well-watered control group and a group subjected to water stress for 36 days. In a regular weekly schedule, canopy reflectance and destructive measurements of LAI and Cab were taken. Spectral analysis indicated the first sign of stress after 4–5 days from the start of the experiment near the water absorption bands (at 1930 nm, 1440 nm) and in the red (at 675 nm). Spectroscopic techniques revealed plant stress up to 6 days earlier than visual inspection. Of the water stress-related vegetation indices, the response of Normalized Difference Water Index (NDWI_1241) and Normalized Photochemical Reflectance Index (PRI_norm) were significantly stronger in the stressed group than the control. To observe the effects of stress on grass properties during the drought episode, we used the RTMo (RTM of solar and sky radiation) model inversion by means of an iterative optimization approach. The performance of the model inversion was assessed by calculating R2 and the Normalized Root Mean Square Error (RMSE) between retrieved and measured LAI (R2 = 0.87, NRMSE = 0.18) and Cab (R2 = 0.74, NRMSE = 0.15). All parameters retrieved by model inversion co-varied with soil moisture deficit. However, the first strong sign of water stress on the retrieved grass properties was detected as a change of Cw followed by Cab and Cdm in the earlier stages. The results from this study indicate that the spectroscopic techniques and RTMo model inversion have a promising potential of detecting stress on the spectral reflectance and grass properties before they become visibly apparent. Full article
Show Figures

Graphical abstract

25 pages, 5969 KiB  
Article
Remote Sensing of Sea Surface pCO2 in the Bering Sea in Summer Based on a Mechanistic Semi-Analytical Algorithm (MeSAA)
by Xuelian Song 1, Yan Bai 1,*, Wei-Jun Cai 2, Chen-Tung Arthur Chen 1,3, Delu Pan 1, Xianqiang He 1 and Qiankun Zhu 1
1 State Key Laboratory of Satellite Ocean Environment Dynamics, Second Institute of Oceanography, State Oceanic Administration, Hangzhou 310012, China
2 School of Marine Science and Policy, University of Delaware, Newark, DE 19716, USA
3 Department of Oceanography, National Sun Yat-sen University, Kaohsiung 80424, Taiwan
Remote Sens. 2016, 8(7), 558; https://doi.org/10.3390/rs8070558 - 30 Jun 2016
Cited by 26 | Viewed by 6969
Abstract
The Bering Sea, one of the largest and most productive marginal seas, is a crucial carbon sink for the marine carbonate system. However, restricted by the tough observation conditions, few underway datasets of sea surface partial pressure of carbon dioxide (pCO [...] Read more.
The Bering Sea, one of the largest and most productive marginal seas, is a crucial carbon sink for the marine carbonate system. However, restricted by the tough observation conditions, few underway datasets of sea surface partial pressure of carbon dioxide (pCO2) have been obtained, with most of them in the eastern areas. Satellite remote sensing data can provide valuable information covered by a large area synchronously with high temporal resolution for assessments of pCO2 that subsequently allow quantification of air-sea carbon dioxide 2 flux. However, pCO2 in the Bering Sea is controlled by multiple factors and thus it is hard to develop a remote sensing algorithm with empirical regression methods. In this paper pCO2 in the Bering Sea from July to September was derived based on a mechanistic semi-analytical algorithm (MeSAA). It was assumed that the observed pCO2 can be analytically expressed as the sum of individual components controlled by major factors. First, a reference water mass that was minimally influenced by biology and mixing was identified in the central basin, and then thermodynamic and biological effects were parameterized for the entire area. Finally, we estimated pCO2 with satellite temperature and chlorophyll data. Satellite results agreed well with the underway observations. Our study suggested that throughout the Bering Sea the biological effect on pCO2 was more than twice as important as temperature, and contributions of other effects were relatively small. Furthermore, satellite observations demonstrate that the spring phytoplankton bloom had a delayed effect on summer pCO2 but that the influence of this biological event varied regionally; it was more significant on the continental slope, with a later bloom, than that on the shelf with an early bloom. Overall, the MeSAA algorithm was not only able to estimate pCO2 in the Bering Sea for the first time, but also provided a quantitative analysis of the contribution of various processes that influence pCO2. Full article
Show Figures

Graphical abstract

14 pages, 10868 KiB  
Article
Three-Dimensional Surface Displacement Field Associated with the 25 April 2015 Gorkha, Nepal, Earthquake: Solution from Integrated InSAR and GPS Measurements with an Extended SISTEM Approach
by Haipeng Luo 1 and Ting Chen 1,2,*
1 School of Geodesy and Geomatics, Wuhan University, 129 Luoyu Road, Wuhan 430079, China
2 Key Laboratory of Geospace Environment and Geodesy, Ministry of Education, 129 Luoyu Road, Wuhan 430079, China
Remote Sens. 2016, 8(7), 559; https://doi.org/10.3390/rs8070559 - 30 Jun 2016
Cited by 23 | Viewed by 7756
Abstract
Three-dimensional surface displacement field associated with the 25 April 2015 Gorkha, Nepal earthquake is derived from an integration of Interferometric Synthetic Aperture Radar (InSAR) and Global Positioning System (GPS) measurements, with an extended SISTEM (Simultaneous and Integrated Strain Tensor Estimation From Geodetic and [...] Read more.
Three-dimensional surface displacement field associated with the 25 April 2015 Gorkha, Nepal earthquake is derived from an integration of Interferometric Synthetic Aperture Radar (InSAR) and Global Positioning System (GPS) measurements, with an extended SISTEM (Simultaneous and Integrated Strain Tensor Estimation From Geodetic and Satellite Deformation Measurements) approach (ESISTEM) proposed in this study. In ESISTEM approach, both surrounding InSAR and GPS measurements can be used as constraints in deriving surface displacements; while only surrounding GPS measurements are used in SISTEM approach. Besides the constraints from surrounding GPS measurements, the ESISTEM approach makes surrounding InSAR measurements available for constraining the derived deformations based on surface elastic theory for the first time. From the north to the south, derived surface displacement field shows prevailing southward horizontal deformations, and gradually varied vertical deformations ranging from −0.95 to 1.40 m within 120 km to the north of Kathmandu. This reveals that ruptures of Main Himalayan thrust (MHT) system were confined in subsurface and did not propagate to the Main Frontal Thrust (MFT) fault, in accordance with field investigation as well as geodetic and seismic studies. Relation between vertical deformations and earthquake-induced landslides is briefly discussed. Full article
(This article belongs to the Special Issue Remote Sensing in Tibet and Siberia)
Show Figures

Graphical abstract

15 pages, 4555 KiB  
Article
Mapping Dynamics of Inundation Patterns of Two Largest River-Connected Lakes in China: A Comparative Study
by Guiping Wu 1,2 and Yuanbo Liu 1,2,*
1 Key Laboratory of Watershed Geographic Sciences, Nanjing Institute of Geography and Limnology, Chinese Academy of Sciences, Nanjing 21008, China
2 State Key Laboratory of Lake Science and Environment, Nanjing Institute of Geography and Limnology, Chinese Academy of Sciences, Nanjing 21008, China
Remote Sens. 2016, 8(7), 560; https://doi.org/10.3390/rs8070560 - 30 Jun 2016
Cited by 27 | Viewed by 6447
Abstract
Poyang Lake and Dongting Lake are the two largest freshwater lakes in China. The lakes are located approximately 300 km apart on the middle reaches of the Yangtze River and are differently connected through their respective tributary systems, which will lead to different [...] Read more.
Poyang Lake and Dongting Lake are the two largest freshwater lakes in China. The lakes are located approximately 300 km apart on the middle reaches of the Yangtze River and are differently connected through their respective tributary systems, which will lead to different river–lake water exchanges and discharges. Thus, differences in their morphological and hydrological conditions should induce individual lake spatio-temporal inundation patterns. Quantitative comparative analyses of the dynamic inundation patterns of Poyang Lake and Dongting Lake are of great importance to basic biogeochemical and ecological studies. In this study, using Moderate Resolution Imaging Spectoradiometer (MODIS) satellite imagery and a geographic information system (GIS) analysis method, we systematically compared the spatio-temporal inundation patterns of the two river-connected lakes by analyses of the lake area, the inundation frequencies (IFs) and the water variation rates (WVRs). The results indicate that there was a significant declining trend in the lakes’ inundation area from 2000 to 2011. The inundation areas of Poyang Lake and Dongting Lake, decreased by 54.74% and 40.46%, with an average annual decrease rate of 109.74 km2/y and 52.37 km2/y, respectively. The alluvial regions near Dongting Lake expressed much lower inundation frequencies, averaged over multiple years, than the alluvial regions near Poyang Lake. There was an obvious spatial gradient in the distribution of water inundation for Poyang Lake; the monthly mean IF slowly increased from north to south during the low-water, rising, and high-water periods. However, Dongting Lake expressed a clear zonal distribution of water inundation, especially in the low-water and rising periods. In addition, the WVRs of the two lakes differently changed in space throughout the year, but were in good agreement with the changing processes of water expansion or shrinkage. The different inundation frequencies and water variation rates in the two lakes may possibly depend on many intrinsic factors, including surface discharges from their respective tributaries, river–lake water exchanges and the lakes’ topographical characteristics. These findings are valuable for policymakers because they may lead to different decisions and policies for these two complex river–lake systems. Full article
(This article belongs to the Special Issue What can Remote Sensing Do for the Conservation of Wetlands?)
Show Figures

Graphical abstract

13 pages, 2260 KiB  
Article
Estimation of Forest Topsoil Properties Using Airborne LiDAR-Derived Intensity and Topographic Factors
by Chao Li 1, Yanli Xu 2, Zhaogang Liu 2,*, Shengli Tao 1, Fengri Li 2 and Jingyun Fang 1
1 Department of Ecology, College of Urban and Environmental Sciences, Peking University, Beijing 100871, China
2 Department of Forest Management, School of Forestry, Northeast Forestry University, Harbin 150040, China
Remote Sens. 2016, 8(7), 561; https://doi.org/10.3390/rs8070561 - 1 Jul 2016
Cited by 8 | Viewed by 6553
Abstract
Forest topsoil supports vegetation growth and contains the majority of soil nutrients that are important indices of soil fertility and quality. Therefore, estimating forest topsoil properties, such as soil organic matter (SOM), total nitrogen (Total N), pH, litter-organic (O-A) horizon depth (Depth) and [...] Read more.
Forest topsoil supports vegetation growth and contains the majority of soil nutrients that are important indices of soil fertility and quality. Therefore, estimating forest topsoil properties, such as soil organic matter (SOM), total nitrogen (Total N), pH, litter-organic (O-A) horizon depth (Depth) and available phosphorous (AvaP), is of particular importance for forest development and management. As an emerging technology, light detection and ranging (LiDAR) can capture the three-dimensional structure and intensity information of scanned objects, and can generate high resolution digital elevation models (DEM) using ground echoes. Moreover, great power for estimating forest topsoil properties is enclosed in the intensity information of ground echoes. However, the intensity has not been well explored for this purpose. In this study, we collected soil samples from 62 plots and the coincident airborne LiDAR data in a Korean pine forest in Northeast China, and assessed the effectiveness of both multi-scale intensity data and LiDAR-derived topographic factors for estimating forest topsoil properties. The results showed that LiDAR-derived variables could be robust predictors of four topsoil properties (SOM, Total N, pH, and Depth), with coefficients of determination (R2) ranging from 0.46 to 0.66. Ground-returned intensity was identified as the most effective predictor for three topsoil properties (SOM, Total N, and Depth) with R2 values of 0.17–0.64. Meanwhile, LiDAR-derived topographic factors, except elevation and sediment transport index, had weak explanatory power, with R2 no more than 0.10. These findings suggest that the LiDAR intensity of ground echoes is effective for estimating several topsoil properties in forests with complicated topography and dense canopy cover. Furthermore, combining intensity and multi-scale LiDAR-derived topographic factors, the prediction accuracies (R2) were enhanced by negligible amounts up to 0.40, relative to using intensity only for topsoil properties. Moreover, the prediction accuracy for Depth increased by 0.20, while for other topsoil properties, the prediction accuracies increased negligibly, when the scale dependency of soil–topography relationship was taken into consideration. Full article
(This article belongs to the Special Issue Remote Sensing Applied to Soils: From Ground to Space)
Show Figures

Graphical abstract

10 pages, 11747 KiB  
Article
Ground-Penetrating Radar Mapping Using Multiple Processing and Interpretation Methods
by Lawrence B. Conyers
Department of Anthropology, University of Denver, 2000 E. Asbury St., Denver, CO 80210, USA
Remote Sens. 2016, 8(7), 562; https://doi.org/10.3390/rs8070562 - 2 Jul 2016
Cited by 28 | Viewed by 10307
Abstract
Ground-penetrating radar processing and interpretation methods have been developed over time that usually follow a certain standard pathway, which leads from obtaining the raw reflection data to the production of amplitude slice-maps for three-dimensional visualization. In this standard series of analysis steps a [...] Read more.
Ground-penetrating radar processing and interpretation methods have been developed over time that usually follow a certain standard pathway, which leads from obtaining the raw reflection data to the production of amplitude slice-maps for three-dimensional visualization. In this standard series of analysis steps a great deal of important information contained in the raw data can potentially be lost or ignored, and without careful consideration, data filtering and re-analysis, information about important buried features can sometimes be unobserved. A typical ground-penetrating radar (GPR) dataset should, instead, be processed, re-evaluated, re-processed and then new images made from new sets of data as a way to enhance the visualization of radar reflections of interest. This should only be done in an intuitive way, once a preliminary series of images are produced using standard processing steps. An example from data collected in an agricultural field in France illustrate how obvious buried features are readily discovered and interpreted using standard processing steps, but additional frequency filtering, migration and then re-processing of certain portions of the data produced images of a subtle Roman villa foundation that might have otherwise gone undiscovered. In sand dunes in coastal Brazil, geological complexity obscured the reflections from otherwise hidden anthropogenic strata, and only an analysis of multiple profiles using different scales and processing allowed this small buried feature to be visible. Foundations of buildings in a Roman city in England could be easily discovered using standard processing methods, but a more detailed analysis of reflection profiles after re-processing and a comparison of GPR images with magnetic gradiometry maps provided information that allowed for the functions of come buried buildings and also an analysis of the city’s destruction by fire. Full article
(This article belongs to the Special Issue Archaeological Prospecting and Remote Sensing)
Show Figures

Figure 1

17 pages, 6373 KiB  
Article
Analyses of Impact of Needle Surface Properties on Estimation of Needle Absorption Spectrum: Case Study with Coniferous Needle and Shoot Samples
by Bin Yang 1,2,†, Yuri Knyazikhin 2,†, Yi Lin 1, Kai Yan 2,3, Chi Chen 2, Taejin Park 2, Sungho Choi 2, Matti Mõttus 4, Miina Rautiainen 5, Ranga B. Myneni 2 and Lei Yan 1,*
1 Beijing Key Laboratory of Spatial Information Integration and 3S Application, Institute of RS and GIS, School of Earth and Space Sciences, Peking University, Beijing 100871, China
2 Department of Earth and Environment, Boston University, Boston, MA 02215, USA
3 School of Geography, State Key Laboratory of Remote Sensing Science, Beijing Normal University, Beijing 100875, China
4 Department of Geosciences and Geography, University of Helsinki, P.O. Box 68, Helsinki, FI 00014, Finland
5 Schools of Engineering and Electrical Engineering, Aalto University, P.O. Box 15800, Aalto 00076, Finland
These authors contributed equally to this work.
Remote Sens. 2016, 8(7), 563; https://doi.org/10.3390/rs8070563 - 2 Jul 2016
Cited by 37 | Viewed by 7627
Abstract
Leaf scattering spectrum is the key optical variable that conveys information about leaf absorbing constituents from remote sensing. It cannot be directly measured from space because the radiation scattered from leaves is affected by the 3D canopy structure. In addition, some radiation is [...] Read more.
Leaf scattering spectrum is the key optical variable that conveys information about leaf absorbing constituents from remote sensing. It cannot be directly measured from space because the radiation scattered from leaves is affected by the 3D canopy structure. In addition, some radiation is specularly reflected at the surface of leaves. This portion of reflected radiation is partly polarized, does not interact with pigments inside the leaf and therefore contains no information about its interior. Very little empirical data are available on the spectral and angular scattering properties of leaf surfaces. Whereas canopy-structure effects are well understood, the impact of the leaf surface reflectance on estimation of leaf absorption spectra remains uncertain. This paper presents empirical and theoretical analyses of angular, spectral, and polarimetric measurements of light reflected by needles and shoots of Pinus koraiensis and Picea koraiensis species. Our results suggest that ignoring the leaf surface reflected radiation can result in an inaccurate estimation of the leaf absorption spectrum. Polarization measurements may be useful to account for leaf surface effects because radiation reflected from the leaf surface is partly polarized, whereas that from the leaf interior is not. Full article
(This article belongs to the Special Issue Remote Sensing of Vegetation Structure and Dynamics)
Show Figures

Graphical abstract

15 pages, 3213 KiB  
Technical Note
PROBA-V Mission Exploitation Platform
by Erwin Goor 1,*, Jeroen Dries 1, Dirk Daems 1, Martine Paepen 1, Fabrizio Niro 2, Philippe Goryl 2, Philippe Mougnaud 2 and Andrea Della Vecchia 2
1 VITO, Vlaamse Instelling voor Technologisch Onderzoek-Flemish Institute for Technological Research, Boeretang 200, 2400 Mol, Belgium
2 ESA-ESRIN, European Space Agency–European Space Research Institute, Via Galileo Galilei, 00044 Frascati, Italy
Remote Sens. 2016, 8(7), 564; https://doi.org/10.3390/rs8070564 - 2 Jul 2016
Cited by 13 | Viewed by 7147
Abstract
As an extension of the PROBA-Vegetation (PROBA-V) user segment, the European Space Agency (ESA), de Vlaamse Instelling voor Technologisch Onderzoek (VITO), and partners TRASYS and Spacebel developed an operational Mission Exploitation Platform (MEP) to drastically improve the exploitation of the PROBA-V Earth Observation [...] Read more.
As an extension of the PROBA-Vegetation (PROBA-V) user segment, the European Space Agency (ESA), de Vlaamse Instelling voor Technologisch Onderzoek (VITO), and partners TRASYS and Spacebel developed an operational Mission Exploitation Platform (MEP) to drastically improve the exploitation of the PROBA-V Earth Observation (EO) data archive, the archive from the historical SPOT-VEGETATION mission, and derived products by researchers, service providers, and thematic users. The analysis of the time series of data (petabyte range) is addressed, as well as the large scale on-demand processing of the complete archive, including near real-time data. The platform consists of a private cloud environment, a Hadoop-based processing environment and a data manager. Several applications are released to the users, e.g., a full resolution viewing service, a time series viewer, pre-defined on-demand processing chains, and virtual machines with powerful tools and access to the data. After an initial release in January 2016 a research platform was deployed gradually, allowing users to design, debug, and test applications on the platform. From the PROBA-V MEP, access to, e.g., Sentinel-2 and Sentinel-3 data will be addressed as well. Full article
Show Figures

Graphical abstract

27 pages, 8623 KiB  
Article
Mapping Global Forest Aboveground Biomass with Spaceborne LiDAR, Optical Imagery, and Forest Inventory Data
by Tianyu Hu 1,†, Yanjun Su 1,2,†, Baolin Xue 1, Jin Liu 1, Xiaoqian Zhao 1, Jingyun Fang 1,3 and Qinghua Guo 1,2,*
1 State Key Laboratory of Vegetation and Environmental Change, Institute of Botany, Chinese Academy of Sciences, Beijing 100093, China
2 Sierra Nevada Research Institute, School of Engineering, University of California at Merced, Merced, CA 95343, USA
3 Department of Ecology, College of Urban and Environmental Sciences, and Key Laboratory for Earth Surface Processes of the Ministry of Education, Peking University, Beijing 100871, China
These authors contributed equally to this work.
Remote Sens. 2016, 8(7), 565; https://doi.org/10.3390/rs8070565 - 4 Jul 2016
Cited by 145 | Viewed by 17707
Abstract
As a large carbon pool, global forest ecosystems are a critical component of the global carbon cycle. Accurate estimations of global forest aboveground biomass (AGB) can improve the understanding of global carbon dynamics and help to quantify anthropogenic carbon emissions. Light detection and [...] Read more.
As a large carbon pool, global forest ecosystems are a critical component of the global carbon cycle. Accurate estimations of global forest aboveground biomass (AGB) can improve the understanding of global carbon dynamics and help to quantify anthropogenic carbon emissions. Light detection and ranging (LiDAR) techniques have been proven that can accurately capture both horizontal and vertical forest structures and increase the accuracy of forest AGB estimation. In this study, we mapped the global forest AGB density at a 1-km resolution through the integration of ground inventory data, optical imagery, Geoscience Laser Altimeter System/Ice, Cloud, and Land Elevation Satellite data, climate surfaces, and topographic data. Over 4000 ground inventory records were collected from published literatures to train the forest AGB estimation model and validate the resulting global forest AGB product. Our wall-to-wall global forest AGB map showed that the global forest AGB density was 210.09 Mg/ha on average, with a standard deviation of 109.31 Mg/ha. At the continental level, Africa (333.34 ± 63.80 Mg/ha) and South America (301.68 ± 67.43 Mg/ha) had higher AGB density. The AGB density in Asia, North America and Europe were 172.28 ± 94.75, 166.48 ± 84.97, and 132.97 ± 50.70 Mg/ha, respectively. The wall-to-wall forest AGB map was evaluated at plot level using independent plot measurements. The adjusted coefficient of determination (R2) and root-mean-square error (RMSE) between our predicted results and the validation plots were 0.56 and 87.53 Mg/ha, respectively. At the ecological zone level, the R2 and RMSE between our map and Intergovernmental Panel on Climate Change suggested values were 0.56 and 101.21 Mg/ha, respectively. Moreover, a comprehensive comparison was also conducted between our forest AGB map and other published regional AGB products. Overall, our forest AGB map showed good agreements with these regional AGB products, but some of the regional AGB products tended to underestimate forest AGB density. Full article
Show Figures

Graphical abstract

15 pages, 5015 KiB  
Letter
Exploring the Relationship between Burn Severity Field Data and Very High Resolution GeoEye Images: The Case of the 2011 Evros Wildfire in Greece
by Eleni Dragozi 1,*, Ioannis Z. Gitas 1,†, Sofia Bajocco 2,† and Dimitris G. Stavrakoudis 1,†
1 School of Forestry and Natural Environment, Faculty of Agriculture, Forestry and Natural Environment, Aristotle University of Thessaloniki, Thessaloniki 54124, Greece
2 Consiglio per la Ricerca in Agricoltura e l’Analisi dell’Economia Agraria, Research Unit for Climatology and Meteorology Applied to Agriculture (CREA-CMA), Rome 00186, Italy
These authors contributed equally to this work.
Remote Sens. 2016, 8(7), 566; https://doi.org/10.3390/rs8070566 - 5 Jul 2016
Cited by 20 | Viewed by 6339
Abstract
Monitoring post-fire vegetation response using remotely-sensed images is a top priority for post-fire management. This study investigated the potential of very-high-resolution (VHR) GeoEye images on detecting the field-measured burn severity of a forest fire that occurred in Evros (Greece) during summer 2011. To [...] Read more.
Monitoring post-fire vegetation response using remotely-sensed images is a top priority for post-fire management. This study investigated the potential of very-high-resolution (VHR) GeoEye images on detecting the field-measured burn severity of a forest fire that occurred in Evros (Greece) during summer 2011. To do so, we analysed the role of topographic conditions and burn severity, as measured in the field immediately after the fire (2011) and one year after (2012) using the Composite Burn Index (CBI) for explaining the post-fire vegetation response, which is measured using VHR satellite imagery. To determine this relationship, we applied redundancy analysis (RDA), which allowed us to identify which satellite variables among VHR spectral bands and Normalized Difference Vegetation Index (NDVI) can better express the post-fire vegetation response. Results demonstrated that in the first year after the fire event, variations in the post-fire vegetation dynamics can be properly detected using the GeoEye VHR data. Furthermore, results showed that remotely-sensed NDVI-based variables are able to encapsulate burn severity variability over time. Our analysis showed that, in this specific case, burn severity variations are mildly affected by the topography, while the NDVI index, as inferred from VHR data, can be successfully used to monitor the short-term post-fire dynamics of the vegetation recovery. Full article
Show Figures

Graphical abstract

16 pages, 3575 KiB  
Article
Simulation of Forest Carbon Fluxes Using Model Incorporation and Data Assimilation
by Min Yan 1, Xin Tian 1,*, Zengyuan Li 1, Erxue Chen 1, Xufeng Wang 2, Zongtao Han 1,3 and Hong Sun 1
1 Institute of Forest Resource Information Techniques, Chinese Academy of Forestry, Beijing 100091, China
2 Cold and Arid Regions Environmental and Engineering Research Institute, Chinese Academy of Sciences, Lanzhou 730000, China
3 Key Laboratory of Spatial Data Mining & Information Sharing of Ministry Education, Fuzhou University, Fuzhou 350002, China
Remote Sens. 2016, 8(7), 567; https://doi.org/10.3390/rs8070567 - 5 Jul 2016
Cited by 42 | Viewed by 6955
Abstract
This study improved simulation of forest carbon fluxes in the Changbai Mountains with a process-based model (Biome-BGC) using incorporation and data assimilation. Firstly, the original remote sensing-based MODIS MOD_17 GPP (MOD_17) model was optimized using refined input data and biome-specific parameters. The key [...] Read more.
This study improved simulation of forest carbon fluxes in the Changbai Mountains with a process-based model (Biome-BGC) using incorporation and data assimilation. Firstly, the original remote sensing-based MODIS MOD_17 GPP (MOD_17) model was optimized using refined input data and biome-specific parameters. The key ecophysiological parameters of the Biome-BGC model were determined through the Extended Fourier Amplitude Sensitivity Test (EFAST) sensitivity analysis. Then the optimized MOD_17 model was used to calibrate the Biome-BGC model by adjusting the sensitive ecophysiological parameters. Once the best match was found for the 10 selected forest plots for the 8-day GPP estimates from the optimized MOD_17 and from the Biome-BGC, the values of sensitive ecophysiological parameters were determined. The calibrated Biome-BGC model agreed better with the eddy covariance (EC) measurements (R2 = 0.87, RMSE = 1.583 gC·m−2·d−1) than the original model did (R2 = 0.72, RMSE = 2.419 gC·m−2·d−1). To provide a best estimate of the true state of the model, the Ensemble Kalman Filter (EnKF) was used to assimilate five years (of eight-day periods between 2003 and 2007) of Global LAnd Surface Satellite (GLASS) LAI products into the calibrated Biome-BGC model. The results indicated that LAI simulated through the assimilated Biome-BGC agreed well with GLASS LAI. GPP performances obtained from the assimilated Biome-BGC were further improved and verified by EC measurements at the Changbai Mountains forest flux site (R2 = 0.92, RMSE = 1.261 gC·m−2·d−1). Full article
Show Figures

Graphical abstract

14 pages, 3421 KiB  
Article
Estimation of Continuous Urban Sky View Factor from Landsat Data Using Shadow Detection
by Matus Hodul 1,*, Anders Knudby 1 and Hung Chak Ho 2
1 Department of Geography, Environment and Geomatics, University of Ottawa, Ottawa, ON K1N 6N5, Canada
2 Department of Geography, Simon Fraser University, Burnaby, BC V5A 1S6, Canada
Remote Sens. 2016, 8(7), 568; https://doi.org/10.3390/rs8070568 - 6 Jul 2016
Cited by 23 | Viewed by 8544
Abstract
Sky View Factor (SVF, a dimensionless value between 0 and 1 representing obstructed and unobstructed sky, respectively) has an important influence on urban energy balance, and is a key contributor to the Urban Heat Island (UHI) effect experienced by heavily built up regions. [...] Read more.
Sky View Factor (SVF, a dimensionless value between 0 and 1 representing obstructed and unobstructed sky, respectively) has an important influence on urban energy balance, and is a key contributor to the Urban Heat Island (UHI) effect experienced by heavily built up regions. Continuous urban SVF maps used in modeling the spatial distribution of UHI can be derived analytically using Lidar data; however, Lidar data are costly to obtain and often lack complete coverage of large cities or metropolitan areas. This study develops and validates a method for estimating continuous urban SVF from globally available Landsat TM data, based on the presence of shadows cast by SVF-reducing urban features. SVF and per-pixel shadow proportion (SP) were first calculated for synthetic grid cities to confirm a logarithmic relationship between the two properties; then Lidar data from four US cities were used to determine an empirical regression relating SP to SVF. Spectral Mixture Analysis was then used to estimate per-pixel SP in a Landsat 5 TM image covering the Greater Vancouver Area, Canada, and the empirical regression was used to calculate SVF from per-pixel SP. The accuracy of the resulting SVF map was validated using independent Lidar-derived SVF data (R2 = 0.78; RMSE = 0.056). Full article
Show Figures

Graphical abstract

17 pages, 2964 KiB  
Article
Similarity and Error Intercomparison of the GPM and Its Predecessor-TRMM Multisatellite Precipitation Analysis Using the Best Available Hourly Gauge Network over the Tibetan Plateau
by Yingzhao Ma 1, Guoqiang Tang 1, Di Long 1,*, Bin Yong 2, Lingzhi Zhong 3, Wei Wan 1 and Yang Hong 1,4,*
1 State Key Laboratory of Hydroscience and Engineering, Department of Hydraulic Engineering, Tsinghua University, Beijing 100084, China
2 State Key Laboratory of Hydrology-Water Resources and Hydraulic Engineering, Hohai University, Nanjing 210098, China
3 Chinese Academy of Meteorological Sciences, Beijing 100081, China
4 Department of Civil Engineering and Environmental Science, University of Oklahoma, Norman, OK 73019, USA
Remote Sens. 2016, 8(7), 569; https://doi.org/10.3390/rs8070569 - 7 Jul 2016
Cited by 157 | Viewed by 9253
Abstract
The performance of Day-1 Integrated Multi-satellitE Retrievals for the Global Precipitation Measurement (GPM) mission (IMERG) and its predecessor, the Tropical Rainfall Measuring Mission (TRMM) Multisatellite Precipitation Analysis 3B42 Version 7 (3B42V7), was cross-evaluated using data from the best-available hourly gauge network over the [...] Read more.
The performance of Day-1 Integrated Multi-satellitE Retrievals for the Global Precipitation Measurement (GPM) mission (IMERG) and its predecessor, the Tropical Rainfall Measuring Mission (TRMM) Multisatellite Precipitation Analysis 3B42 Version 7 (3B42V7), was cross-evaluated using data from the best-available hourly gauge network over the Tibetan Plateau (TP). Analyses of three-hourly rainfall estimates in the warm season of 2014 reveal that IMERG shows appreciably better correlations and lower errors than 3B42V7, though with very similar spatial patterns for all assessment indicators. IMERG also appears to detect light rainfall better than 3B42V7. However, IMERG shows slightly lower POD than 3B42V7 for elevations above 4200 m. Both IMERG and 3B42V7 successfully capture the northward dynamic life cycle of the Indian monsoon reasonably well over the TP. In particular, the relatively light rain from early and end Indian monsoon moisture surge events often fails to be captured by the sparsely-distributed gauges. In spite of limited snowfall field observations, IMERG shows the potential of detecting solid precipitation, which cannot be retrieved from the 3B42V7 products. Full article
(This article belongs to the Special Issue Uncertainties in Remote Sensing)
Show Figures

Graphical abstract

17 pages, 5678 KiB  
Article
Mapping and Characterization of Hydrological Dynamics in a Coastal Marsh Using High Temporal Resolution Sentinel-1A Images
by Cécile Cazals 1,2,*, Sébastien Rapinel 3, Pierre-Louis Frison 1, Anne Bonis 3, Grégoire Mercier 4, Clément Mallet 5, Samuel Corgne 6 and Jean-Paul Rudant 1
1 Université Paris-Est, IGN, LaSTIG//MATIS, 6-8 av. B. Pascal, Cité Descartes, Champs sur Marne, 77455 Marne la Vallée Cedex 2, France
2 GISWAY, 55 Rue La Boétie, Paris 75008, France
3 CNRS UMR 6553 ECOBIO, Université de Rennes 1, Campus de Beaulieu, Rennes Cedex 35042, France
4 CNRS UMR 6285 Lab-STICC, TELECOM Bretagne, Technopole Brest-Iroise, Brest Cedex 29238, France
5 IGN, Université Paris-Est Marne-la-Vallée, LaSTIG/MATIS, 73 avenue de Paris, 94160 Saint-Mandé, France
6 CNRS UMR 6554 LETG Rennes, Université Haute Bretagne, Place Henri Le Moal, Rennes Cedex 35043, France;
Remote Sens. 2016, 8(7), 570; https://doi.org/10.3390/rs8070570 - 5 Jul 2016
Cited by 83 | Viewed by 10697
Abstract
In Europe, water levels in wetlands are widely controlled by environmental managers and farmers. However, the influence of these management practices on hydrodynamics and biodiversity remains poorly understood. This study assesses advantages of using radar data from the recently launched Sentinel-1A satellite to [...] Read more.
In Europe, water levels in wetlands are widely controlled by environmental managers and farmers. However, the influence of these management practices on hydrodynamics and biodiversity remains poorly understood. This study assesses advantages of using radar data from the recently launched Sentinel-1A satellite to monitor hydrological dynamics of the Poitevin marshland in western France. We analyze a time series of 14 radar images acquired in VV and HV polarizations from December 2014 to May 2015 with a 12-day time step. Both polarizations are used with a hysteresis thresholding algorithm which uses both spatial and temporal information to distinguish open water, flooded vegetation and non-flooded grassland. Classification results are compared to in situ piezometric measurements combined with a Digital Terrain Model derived from LiDAR data. Results reveal that open water is successfully detected, whereas flooded grasslands with emergent vegetation and fine-grained patterns are detected with moderate accuracy. Five hydrological regimes are derived from the flood duration and mapped. Analysis of time steps in the time series shows that decreased temporal repetitivity induces significant differences in estimates of flood duration. These results illustrate the great potential to monitor variations in seasonal floods with the high temporal frequency of Sentinel-1A acquisitions. Full article
(This article belongs to the Special Issue What can Remote Sensing Do for the Conservation of Wetlands?)
Show Figures

Graphical abstract

22 pages, 8492 KiB  
Article
Multi-Resolution Mapping and Accuracy Assessment of Forest Carbon Density by Combining Image and Plot Data from a Nested and Clustering Sampling Design
by Enping Yan 1, Hui Lin 1,*, Guangxing Wang 1,2,* and Hua Sun 1
1 Research Center of Forest Remote Sensing & Information Engineering, Central South University of Forestry & Technology, Changsha 410004, China
2 Department of Geography, Southern Illinois University, Carbondale, IL 62901, USA
Remote Sens. 2016, 8(7), 571; https://doi.org/10.3390/rs8070571 - 6 Jul 2016
Cited by 11 | Viewed by 6016
Abstract
Combining sample plot and image data has been widely used to map forest carbon density at local, regional, national and global scales. When mapping is conducted using multiple spatial resolution images at different scales, field observations have to be collected at the corresponding [...] Read more.
Combining sample plot and image data has been widely used to map forest carbon density at local, regional, national and global scales. When mapping is conducted using multiple spatial resolution images at different scales, field observations have to be collected at the corresponding resolutions to match image values in pixel sizes. Given a study area, however, to save time and cost, field observations are often collected from sample plots having a fixed size. This will lead to inconsistency of spatial resolutions between sample plots and image pixels and impede the mapping and product quality assessment. In this study, a methodological framework was proposed to conduct mapping and accuracy assessment of forest carbon density at four spatial resolutions by combining remotely sensed data and reference values of sample plots from a systematical, nested and clustering sampling design. This design led to one field observation dataset at a 30 m spatial resolution sample plot level and three other reference datasets by averaging the observations from three, five and seven sample plots within each of 250 m and 500 m sub-blocks and 1000 m blocks, respectively. The datasets matched the pixel values of a Landsat 8 image and three MODIS products. A sequential Gaussian co-simulation (SGCS) and a sequential Gaussian block co-simulation (SGBCS), an upscaling algorithm, were employed to map forest carbon density at the spatial resolutions. This methodology was tested for mapping forest carbon density in Huang-Feng-Qiao forest farm of You County in Eastern Hunan of China. The results showed that: First, all of the means of predicted forest carbon density values at four spatial resolutions fell in the confidence intervals of the reference data at a significance level of 0.05. Second, the systematical, nested and clustering sampling design provided the potential to obtain spatial information of forest carbon density at multiple spatial resolutions. Third, the relative root mean square error (RMSE) of predicted values at the plot level was much greater than those at the sub-block and block levels. Moreover, the accuracies of the up-scaled estimates were much higher than those from previous studies. In addition, at the same spatial resolution, SGCSWA (scaling up the SGCS and Landsat derived 30 m resolution map using a window average (WA)) resulted in smallest relative RMSEs of up-scaled predictions, followed by combinations of Landsat images and SGBCS. The accuracies from both methods were significantly greater than those from the combinations of MODIS images and SGCS. Overall, this study implied that the combinations of Landsat 8 images and SGCSWA or SGBCS with the systematical, nested and clustering sampling design provided the potential to formulate a methodological framework to map forest carbon density and conduct accuracy assessment at multiple spatial resolutions. However, this methodology needs to be further refined and examined in other forest landscapes. Full article
(This article belongs to the Special Issue Digital Forest Resource Monitoring and Uncertainty Analysis)
Show Figures

Graphical abstract

13 pages, 6215 KiB  
Article
Spectral Indices Accurately Quantify Changes in Seedling Physiology Following Fire: Towards Mechanistic Assessments of Post-Fire Carbon Cycling
by Aaron M. Sparks 1,2,*, Crystal A. Kolden 1,2, Alan F. Talhelm 3, Alistair M.S. Smith 1,2, Kent G. Apostol 4, Daniel M. Johnson 1 and Luigi Boschetti 1
1 College of Natural Resources, University of Idaho, Moscow, ID 83844, USA
2 Idaho Fire Initiative for Research and Education (IFIRE), University of Idaho, Moscow, ID 83844, USA
3 Oak Ridge Institute for Science Education, National Center for Environmental Assessment, US Environmental Protection Agency, Research Triangle Park, NC 277094, USA
4 College of Agriculture and Life Sciences, University of Arizona, Payson, AZ 85541, USA
Remote Sens. 2016, 8(7), 572; https://doi.org/10.3390/rs8070572 - 7 Jul 2016
Cited by 36 | Viewed by 8644
Abstract
Fire activity, in terms of intensity, frequency, and total area burned, is expected to increase with a changing climate. A challenge for landscape-level assessment of fire effects, often termed burn severity, is that current remote sensing assessments provide very little information regarding tree/vegetation [...] Read more.
Fire activity, in terms of intensity, frequency, and total area burned, is expected to increase with a changing climate. A challenge for landscape-level assessment of fire effects, often termed burn severity, is that current remote sensing assessments provide very little information regarding tree/vegetation physiological performance and recovery, limiting our understanding of fire effects on ecosystem services such as carbon storage/cycling. In this paper, we evaluated whether spectral indices common in vegetation stress and burn severity assessments could accurately quantify post-fire physiological performance (indicated by net photosynthesis and crown scorch) of two seedling species, Larix occidentalis and Pinus contorta. Seedlings were subjected to increasing fire radiative energy density (FRED) doses through a series of controlled laboratory surface fires. Mortality, physiology, and spectral reflectance were assessed for a month following the fires, and then again at one year post-fire. The differenced Normalized Difference Vegetation Index (dNDVI) spectral index outperformed other spectral indices used for vegetation stress and burn severity characterization in regard to leaf net photosynthesis quantification, indicating that landscape-level quantification of tree physiology may be possible. Additionally, the survival of the majority of seedlings in the low and moderate FRED doses indicates that fire-induced mortality is more complex than the currently accepted binary scenario, where trees survive with no impacts below a certain temperature and duration threshold, and mortality occurs above the threshold. Full article
Show Figures

Graphical abstract

22 pages, 5106 KiB  
Article
A Spatially Explicit, Multi-Criteria Decision Support Model for Loggerhead Sea Turtle Nesting Habitat Suitability: A Remote Sensing-Based Approach
by Lauren Dunkin 1,*, Molly Reif 2, Safra Altman 1 and Todd Swannack 1
1 Army Engineer Research and Development Center, 3903 Halls Ferry Road, Vicksburg, MS 39180, USA
2 Army Research and Development Center, Joint Airborne Lidar Bathymetry Technical Center of Expertise, 7225 Stennis Airport Road, Suite 100, Kiln, MS 39556, USA
Remote Sens. 2016, 8(7), 573; https://doi.org/10.3390/rs8070573 - 6 Jul 2016
Cited by 19 | Viewed by 8405
Abstract
Nesting habitat for the federally endangered loggerhead sea turtle (Caretta caretta) were designated as critical in 2014 for beaches along the Atlantic Coast and Gulf of Mexico. Nesting suitability is routinely determined based on site specific information. Given the expansive geographic [...] Read more.
Nesting habitat for the federally endangered loggerhead sea turtle (Caretta caretta) were designated as critical in 2014 for beaches along the Atlantic Coast and Gulf of Mexico. Nesting suitability is routinely determined based on site specific information. Given the expansive geographic location of the designated critical C. caretta nesting habitat and the highly dynamic coastal environment, understanding nesting suitability on a regional scale is essential for monitoring the changing status of the coast as a result of hydrodynamic forces and maintenance efforts. The increasing spatial resolution and temporal frequency of remote sensing data offers the opportunity to study this dynamic environment on a regional scale. Remote sensing data were used as input into the spatially-explicit, multi-criteria decision support model to determine nesting habitat suitability. Results from the study indicate that the morphological parameters used as input into the model are well suited to provide a regional level approach with the results from the optimized model having sensitivity and detection prevalence values greater than 80% and the detection rate being greater than 70%. The approach can be implemented in various geographic locations to better communicate priorities and evaluate management strategies as a result of changes to the dynamic coastal environment. Full article
(This article belongs to the Special Issue Remote Sensing in Coastal Environments)
Show Figures

Graphical abstract

18 pages, 5141 KiB  
Article
Combining Sun-Induced Chlorophyll Fluorescence and Photochemical Reflectance Index Improves Diurnal Modeling of Gross Primary Productivity
by Anke Schickling 1,†, Maria Matveeva 1,†, Alexander Damm 2,†, Jan H. Schween 3, Andreas Wahner 4, Alexander Graf 5, Susanne Crewell 3 and Uwe Rascher 1,*
1 Institute of Bio- and Geosciences, IBG-2: Plant Sciences, Forschungszentrum Jülich GmbH, Wilhelm-Johnen Straße, Jülich 52428, Germany
2 Remote Sensing Laboratories, University of Zurich, Winterthurerstrasse 190, Zurich 8057, Switzerland
3 Institute of Geophysics and Meteorology, University of Cologne, Zülpicher Str. 49, Köln 50674, Germany
4 Institute of Energy and Climate Research, IEK-8: Troposphere, Forschungszentrum Jülich GmbH, Wilhelm-Johnen Straße, Jülich 52428, Germany
5 Institute of Bio- and Geosciences, IBG-3: Agrosphere, Forschungszentrum Jülich GmbH, Wilhelm-Johnen Straße, Jülich 52428, Germany
These authors contributed equally to this work.
Remote Sens. 2016, 8(7), 574; https://doi.org/10.3390/rs8070574 - 8 Jul 2016
Cited by 44 | Viewed by 7451
Abstract
Sun-induced chlorophyll fluorescence (F) is a novel remote sensing parameter providing an estimate of actual photosynthetic rates. A combination of this new observable and Monteith’s light use efficiency (LUE) concept was suggested for an advanced modeling of gross primary productivity (GPP). In this [...] Read more.
Sun-induced chlorophyll fluorescence (F) is a novel remote sensing parameter providing an estimate of actual photosynthetic rates. A combination of this new observable and Monteith’s light use efficiency (LUE) concept was suggested for an advanced modeling of gross primary productivity (GPP). In this demonstration study, we evaluate the potential of both F and the more commonly used photochemical reflectance index (PRI) to approximate the LUE term in Monteith’s equation and eventually improve the forward modeling of GPP diurnals. Both F and the PRI were derived from ground and airborne based spectrometer measurements over two different crops. We demonstrate that approximating dynamic changes of LUE using F and PRI significantly improves the forward modeling of GPP diurnals. Especially in sugar beet, a changing photosynthetic efficiency during the day was traceable with F and incorporating F in the forward modeling significantly improved the estimation of GPP. Airborne data were projected to produce F and PRI maps for winter wheat and sugar beet fields over the course of one day. We detected a significant variability of both, F and the PRI within one field and particularly between fields. The variability of F and PRI was higher in sugar beet, which also showed a physiological down-regulation of leaf photosynthesis. Our results underline the potential of F to serve as a superior indicator for the actual efficiency of the photosynthetic machinery, which is linked to physiological responses of vegetation. Full article
Show Figures

Graphical abstract

15 pages, 8191 KiB  
Article
Glacier Remote Sensing Using Sentinel-2. Part II: Mapping Glacier Extents and Surface Facies, and Comparison to Landsat 8
by Frank Paul 1,*, Solveig H. Winsvold 2, Andreas Kääb 2, Thomas Nagler 3 and Gabriele Schwaizer 3
1 Department of Geography, University of Zurich, Winterthurerstr. 190, 8057 Zurich, Switzerland
2 Department of Geosciences, University of Oslo, P.O. Box 1047, 0316 Oslo, Norway
3 ENVEO IT GmbH, ICT—Technologiepark, Technikerstr. 21a, 6020 Innsbruck, Austria
Remote Sens. 2016, 8(7), 575; https://doi.org/10.3390/rs8070575 - 7 Jul 2016
Cited by 183 | Viewed by 24584
Abstract
Mapping of glacier extents from automated classification of optical satellite images has become a major application of the freely available images from Landsat. A widely applied method is based on segmented ratio images from a red and shortwave infrared band. With the now [...] Read more.
Mapping of glacier extents from automated classification of optical satellite images has become a major application of the freely available images from Landsat. A widely applied method is based on segmented ratio images from a red and shortwave infrared band. With the now available data from Sentinel-2 (S2) and Landsat 8 (L8) there is high potential to further extend the existing time series (starting with Landsat 4/5 in 1982) and to considerably improve over previous capabilities, thanks to increased spatial resolution and dynamic range, a wider swath width and more frequent coverage. Here, we test and compare a variety of previously used methods to map glacier extents from S2 and L8, and investigate the mapping of snow facies with S2 using top of atmosphere reflectance. Our results confirm that the band ratio method works well with S2 and L8. The 15 m panchromatic band of L8 can be used instead of the red band, resulting in glacier extents similar to S2 (0.7% larger for 155 glaciers). On the other hand, extents derived from the 30 m bands are 4%–5% larger, indicating a more generous interpretation of mixed pixels. Mapping of snow cover with S2 provided accurate results, but the required topographic correction would benefit from a better orthorectification with a more precise DEM than currently used. Full article
Show Figures

Graphical abstract

13 pages, 2262 KiB  
Technical Note
A Conceptually Simple Modeling Approach for Jason-1 Sea State Bias Correction Based on 3 Parameters Exclusively Derived from Altimetric Information
by Nelson Pires 1,*, M. Joana Fernandes 1, Christine Gommenginger 2 and Remko Scharroo 3
1 Department of Geosciences, Environment and Spatial Planning, Faculty of Sciences, University of Porto, Porto 4169-007, Portugal
2 National Oceanography Centre, Natural Environment Research Council, Southampton SO14 3ZH, UK
3 European Organisation for the Exploitation of Meteorological Satellites, Darmstadt D-64295, Germany
Remote Sens. 2016, 8(7), 576; https://doi.org/10.3390/rs8070576 - 8 Jul 2016
Cited by 27 | Viewed by 5545
Abstract
A conceptually simple formulation is proposed for a new empirical sea state bias (SSB) model using information retrieved entirely from altimetric data. Nonparametric regression techniques are used, based on penalized smoothing splines adjusted to each predictor and then combined by a Generalized Additive [...] Read more.
A conceptually simple formulation is proposed for a new empirical sea state bias (SSB) model using information retrieved entirely from altimetric data. Nonparametric regression techniques are used, based on penalized smoothing splines adjusted to each predictor and then combined by a Generalized Additive Model. In addition to the significant wave height (SWH) and wind speed (U10), a mediator parameter designed by the mean wave period derived from radar altimetry, has proven to improve the model performance in explaining some of the SSB variability, especially in swell ocean regions with medium-high SWH and low U10. A collinear analysis of scaled sea level anomalies (SLA) variance differences shows conformity between the proposed model and the established SSB models. The new formulation aims to be a fast, reliable and flexible SSB model, in line with the well-settled SSB corrections, depending exclusively on altimetric information. The suggested method is computationally efficient and capable of generating a stable model with a small training dataset, a useful feature for forthcoming missions. Full article
Show Figures

Graphical abstract

21 pages, 3873 KiB  
Article
Mapping Forest Cover and Forest Cover Change with Airborne S-Band Radar
by Ramesh K. Ningthoujam 1,*, Kevin Tansey 1,†, Heiko Balzter 1,2,†, Keith Morrison 3, Sarah C. M. Johnson 1, France Gerard 4, Charles George 4, Geoff Burbidge 5, Sam Doody 5, Nick Veck 6, Gary M. Llewellyn 7 and Thomas Blythe 8
1 Department of Geography, Centre for Landscape and Climate Research, University of Leicester, Leicester LE1 7RH, UK
2 National Centre for Earth Observation, University of Leicester, Leicester LE1 7RH, UK
3 Radar Group, School of Cranfield Defence And Security, Cranfield University, Shrivenham, Swindon SN6 8LA, UK
4 Centre for Ecology & Hydrology, Wallingford OX10 8BB, UK
5 Airbus Defence and Space–Space Systems, Anchorage Road, Portsmouth, Hampshire PO3 5PU, UK
6 Satellite Applications Catapult, Electron Building Fermi Avenue Harwell, Oxford Didcot, Oxfordshire OX11 0QR, UK
7 Natural Environment Research Council Airborne Research & Survey Facility, Firfax Building, Meteor Business Park, Cheltenham Road East, Gloucester GL2 9QL, UK
8 Forestry Commission, Bristol and Savernake, Leigh Woods Office, Abbots Leigh Road, Bristol BS8 3QB, UK
These authors contributed equally to this work.
Remote Sens. 2016, 8(7), 577; https://doi.org/10.3390/rs8070577 - 8 Jul 2016
Cited by 34 | Viewed by 10968
Abstract
Assessments of forest cover, forest carbon stocks and carbon emissions from deforestation and degradation are increasingly important components of sustainable resource management, for combating biodiversity loss and in climate mitigation policies. Satellite remote sensing provides the only means for mapping global forest cover [...] Read more.
Assessments of forest cover, forest carbon stocks and carbon emissions from deforestation and degradation are increasingly important components of sustainable resource management, for combating biodiversity loss and in climate mitigation policies. Satellite remote sensing provides the only means for mapping global forest cover regularly. However, forest classification with optical data is limited by its insensitivity to three-dimensional canopy structure and cloud cover obscuring many forest regions. Synthetic Aperture Radar (SAR) sensors are increasingly being used to mitigate these problems, mainly in the L-, C- and X-band domains of the electromagnetic spectrum. S-band has not been systematically studied for this purpose. In anticipation of the British built NovaSAR-S satellite mission, this study evaluates the benefits of polarimetric S-band SAR for forest characterisation. The Michigan Microwave Canopy Scattering (MIMICS-I) radiative transfer model is utilised to understand the scattering mechanisms in forest canopies at S-band. The MIMICS-I model reveals strong S-band backscatter sensitivity to the forest canopy in comparison to soil characteristics across all polarisations and incidence angles. Airborne S-band SAR imagery over the temperate mixed forest of Savernake Forest in southern England is analysed for its information content. Based on the modelling results, S-band HH- and VV-polarisation radar backscatter and the Radar Forest Degradation Index (RFDI) are used in a forest/non-forest Maximum Likelihood classification at a spatial resolution of 6 m (70% overall accuracy, κ = 0.41) and 20 m (63% overall accuracy, κ = 0.27). The conclusion is that S-band SAR such as from NovaSAR-S is likely to be suitable for monitoring forest cover and its changes. Full article
(This article belongs to the Special Issue Remote Sensing of Vegetation Structure and Dynamics)
Show Figures

Graphical abstract

14 pages, 6502 KiB  
Article
Monitoring Urban Dynamics in the Southeast U.S.A. Using Time-Series DMSP/OLS Nightlight Imagery
by Qingting Li 1, Linlin Lu 1,*, Qihao Weng 2, Yanhua Xie 2 and Huadong Guo 1
1 Key Laboratory of Digital Earth Science, Institute of Remote Sensing and Digital Earth, Chinese Academy of Sciences, Beijing 100094, China
2 Center for Urban and Environmental Change, Department of Earth and Environmental Systems, Indiana State University, Terre Haute, IN 47809, USA
Remote Sens. 2016, 8(7), 578; https://doi.org/10.3390/rs8070578 - 8 Jul 2016
Cited by 80 | Viewed by 9140
Abstract
The Defense Meteorological Satellite Program (DMSP)’s Operational Line-scan System (OLS) stable nighttime light (NTL) imagery offers a good opportunity for characterizing the extent and dynamics of urban development at the global and regional scales. However, their ability to characterize intra-urban variation is limited [...] Read more.
The Defense Meteorological Satellite Program (DMSP)’s Operational Line-scan System (OLS) stable nighttime light (NTL) imagery offers a good opportunity for characterizing the extent and dynamics of urban development at the global and regional scales. However, their ability to characterize intra-urban variation is limited due to saturation and blooming of the data values. In this study, we adopted the methods of Mann-Kendall and linear regression to analyze urban dynamics from time series Vegetation Adjusted NTL Urban Index (VANUI) data from 1992 to 2013 in the Southeast United States of America (U.S.A.), which is one of the fastest growing regions in the nation. The newly built urban areas were effectively detected based on the trend analysis. In addition, the VANUI-derived urban areas with an optimal threshold method were found highly consistent with the Landsat-derived National Land Cover Database. The total urbanized areas in large metropolitan areas in southeastern U.S.A. increased from 8524 km2 in 1992 to 14,684 km2 in 2010, accounting for 5% and 9% of the total area, respectively. The results further showed that urban expansion in the region cannot be purely explained by population growth. Our results suggested that the VANUI time series provided an effective method for characterizing the spatiotemporal dynamics of urban extent at the regional scale. Full article
Show Figures

Graphical abstract

22 pages, 19403 KiB  
Article
Distribution of Artisanal and Small-Scale Gold Mining in the Tapajós River Basin (Brazilian Amazon) over the Past 40 Years and Relationship with Water Siltation
by Felipe De Lucia Lobo 1,2,*, Maycira Costa 1, Evlyn Márcia Leão de Moraes Novo 2 and Kevin Telmer 1,3
1 Spectral Lab, Department of Geography, University of Victoria, 3800 Finnerty Road, Victoria, BC V8P 5C2, Canada
2 Remote Sensing Division, National Institute for Space Research (INPE), Av. dos Astronautas 1758, São José dos Campos, SP 12227-010, Brazil
3 Artisanal Gold Council, 101-732 Cormorant St., Victoria, BC V8W 4A5, Canada
Remote Sens. 2016, 8(7), 579; https://doi.org/10.3390/rs8070579 - 9 Jul 2016
Cited by 75 | Viewed by 13727
Abstract
An innovative remote sensing approach that combines land-use change and water quality information is proposed in order to investigate if Artisanal and Small-scale Gold Mining (ASGM) area extension is associated with water siltation in the Tapajós River Basin (Brazil), containing the largest small-scale [...] Read more.
An innovative remote sensing approach that combines land-use change and water quality information is proposed in order to investigate if Artisanal and Small-scale Gold Mining (ASGM) area extension is associated with water siltation in the Tapajós River Basin (Brazil), containing the largest small-scale gold mining district in the world. Taking advantage of a 40-year period of the multi-satellite imagery archive, the objective of this paper is to build a normalized time-series in order to evaluate the influence of temporal mining expansion on the water siltation data (TSS, Total Suspended Solids concentration) derived from previous research. The methodological approach was set to deliver a full characterization of the ASGM expansion from its initial stages in the early 1970s to the present. First, based on IRS/LISSIII images acquired in 2012, the historical Landsat image database (1973–2001) was corrected for radiometric and atmospheric effects using dark vegetation as reference to create a normalized time-series. Next, a complete update of the mining areas distribution in 2012 derived from the TerraClass Project (an official land-use classification for the Brazilian Amazon) was conducted having IRS/LISSIII as the base map with the support of auxiliary data and vector editing. Once the ASGM in 2012 was quantified (261.7 km2) and validated with photos, a reverse classification of ASGM in 2001 (171.7 km2), 1993 (166.3 km2), 1984 (47.5 km2), and 1973 (15.4 km2) with the use of Landsat archives was applied. This procedure relies on the assumption that ASGM changes in the land cover are severe and remain detectable from satellite sensors for decades. The mining expansion area over time was then combined with the (TSS) data retrieved from the same atmospherically corrected satellite imagery based on the literature. In terms of gold mining expansion and water siltation effects, four main periods of ASGM activities were identified in the study area: (i) 1958–1977, first occurrence of mining activities and low water impacts; (ii) 1978–1993, introduction of low-budget mechanization associated with very high gold prices resulting in large mining area expansion and high water siltation levels; (iii) 1994–2003, general recession of ASGM activities and exhaustion of easy-access gold deposits, resulting in decreased TSS; (iv) 2004 to present, intensification of ASGM encouraged by high gold prices, resulting in an increase of TSS. Full article
(This article belongs to the Special Issue Monitoring of Land Changes)
Show Figures

Graphical abstract

31 pages, 5513 KiB  
Article
Evaluating Biosphere Model Estimates of the Start of the Vegetation Active Season in Boreal Forests by Satellite Observations
by Kristin Böttcher 1,*, Tiina Markkanen 2, Tea Thum 2, Tuula Aalto 2, Mika Aurela 2, Christian H. Reick 3, Pasi Kolari 4, Ali N. Arslan 2 and Jouni Pulliainen 2
1 Data and Information Centre, Finnish Environment Institute, 00251 Helsinki, Finland
2 Finnish Meteorological Institute, 00560 Helsinki, Finland
3 Max Planck Institute for Meteorology, 20146 Hamburg, Germany
4 Department of Physics, University of Helsinki, 00014 Helsinki, Finland
Remote Sens. 2016, 8(7), 580; https://doi.org/10.3390/rs8070580 - 9 Jul 2016
Cited by 21 | Viewed by 10824
Abstract
The objective of this study was to assess the performance of the simulated start of the photosynthetically active season by a large-scale biosphere model in boreal forests in Finland with remote sensing observations. The start of season for two forest types, evergreen needle- [...] Read more.
The objective of this study was to assess the performance of the simulated start of the photosynthetically active season by a large-scale biosphere model in boreal forests in Finland with remote sensing observations. The start of season for two forest types, evergreen needle- and deciduous broad-leaf, was obtained for the period 2003–2011 from regional JSBACH (Jena Scheme for Biosphere–Atmosphere Hamburg) runs, driven with climate variables from a regional climate model. The satellite-derived start of season was determined from daily Moderate Resolution Imaging Spectrometer (MODIS) time series of Fractional Snow Cover and the Normalized Difference Water Index by applying methods that were targeted to the two forest types. The accuracy of the satellite-derived start of season in deciduous forest was assessed with bud break observations of birch and a root mean square error of seven days was obtained. The evaluation of JSBACH modelled start of season dates with satellite observations revealed high spatial correspondence. The bias was less than five days for both forest types but showed regional differences that need further consideration. The agreement with satellite observations was slightly better for the evergreen than for the deciduous forest. Nonetheless, comparison with gross primary production (GPP) determined from CO2 flux measurements at two eddy covariance sites in evergreen forest revealed that the JSBACH-simulated GPP was higher in early spring and led to too-early simulated start of season dates. Photosynthetic activity recovers differently in evergreen and deciduous forests. While for the deciduous forest calibration of phenology alone could improve the performance of JSBACH, for the evergreen forest, changes such as seasonality of temperature response, would need to be introduced to the photosynthetic capacity to improve the temporal development of gross primary production. Full article
Show Figures

Graphical abstract

14 pages, 606 KiB  
Article
Diagnosing Horizontal and Inter-Channel Observation Error Correlations for SEVIRI Observations Using Observation-Minus-Background and Observation-Minus-Analysis Statistics
by Joanne A. Waller 1,*, Susan P. Ballard 2, Sarah L. Dance 1,3, Graeme Kelly 2, Nancy K. Nichols 1,3 and David Simonin 2
1 Department of Meteorology, University of Reading, Reading, Berkshire RG6 6BB, UK
2 MetOffice@Reading, Meteorology Building, University of Reading, Reading, Berkshire RG6 6BB, UK
3 Department of Mathematics and Statistics, University of Reading, Reading, Berkshire RG6 6AX, UK
Remote Sens. 2016, 8(7), 581; https://doi.org/10.3390/rs8070581 - 8 Jul 2016
Cited by 54 | Viewed by 7665
Abstract
It has been common practice in data assimilation to treat observation errors as uncorrelated; however, meteorological centres are beginning to use correlated inter-channel observation errors in their operational assimilation systems. In this work, we are the first to characterise inter-channel and spatial error [...] Read more.
It has been common practice in data assimilation to treat observation errors as uncorrelated; however, meteorological centres are beginning to use correlated inter-channel observation errors in their operational assimilation systems. In this work, we are the first to characterise inter-channel and spatial error correlations for Spinning Enhanced Visible and Infrared Imager (SEVIRI) observations that are assimilated into the Met Office high-resolution model. The errors are calculated using a diagnostic that calculates statistical averages of observation-minus-background and observation-minus-analysis residuals. This diagnostic is sensitive to the background and observation error statistics used in the assimilation, although, with careful interpretation of the results, it can still provide useful information. We find that the diagnosed SEVIRI error variances are as low as one-tenth of those currently used in the operational system. The water vapour channels have significantly correlated inter-channel errors, as do the surface channels. The surface channels have larger observation error variances and inter-channel correlations in coastal areas of the domain; this is the result of assimilating mixed pixel (land-sea) observations. The horizontal observation error correlations range between 30 km and 80 km, which is larger than the operational thinning distance of 24 km. We also find that estimates from the diagnostics are unaffected by biased observations, provided that the observation-minus-background and observation-minus-analysis residual means are subtracted. Full article
(This article belongs to the Special Issue Uncertainties in Remote Sensing)
Show Figures

Graphical abstract

21 pages, 1154 KiB  
Article
Extracting Canopy Surface Texture from Airborne Laser Scanning Data for the Supervised and Unsupervised Prediction of Area-Based Forest Characteristics
by Mikko T. Niemi 1 and Jari Vauhkonen 1,2,*
1 Department of Forest Sciences, University of Helsinki, P.O. Box 27, FI-00014 Helsinki, Finland
2 School of Forest Sciences, University of Eastern Finland, P.O. Box 111, FI-80101 Joensuu, Finland
Remote Sens. 2016, 8(7), 582; https://doi.org/10.3390/rs8070582 - 9 Jul 2016
Cited by 19 | Viewed by 6488
Abstract
Area-based analyses of airborne laser scanning (ALS) data are an established approach to obtain wall-to-wall predictions of forest characteristics for vast areas. The analyses of sparse data in particular are based on the height value distributions, which do not produce optimal information on [...] Read more.
Area-based analyses of airborne laser scanning (ALS) data are an established approach to obtain wall-to-wall predictions of forest characteristics for vast areas. The analyses of sparse data in particular are based on the height value distributions, which do not produce optimal information on the horizontal forest structure. We evaluated the complementary potential of features quantifying the textural variation of ALS-based canopy height models (CHMs) for both supervised (linear regression) and unsupervised (k-Means clustering) analyses. Based on a comprehensive literature review, we identified a total of four texture analysis methods that produced rotation-invariant features of different order and scale. The CHMs and the textural features were derived from practical sparse-density, leaf-off ALS data originally acquired for ground elevation modeling. The features were extracted from a circular window of 254 m2 and related with boreal forest characteristics observed from altogether 155 field sample plots. Features based on gray-level histograms, distribution of forest patches, and gray-level co-occurrence matrices were related with plot volume, basal area, and mean diameter with coefficients of determination (R2) of up to 0.63–0.70, whereas features that measured the uniformity of local binary patterns of the CHMs performed poorer. Overall, the textural features compared favorably with benchmark features based on the point data, indicating that the textural features contain additional information useful for the prediction of forest characteristics. Due to the developed processing routines for raster data, the CHM features may potentially be extracted with a lower computational burden, which promotes their use for applications such as pre-stratification or guiding the field plot sampling based solely on ALS data. Full article
(This article belongs to the Special Issue Airborne Laser Scanning)
Show Figures

Graphical abstract

17 pages, 1798 KiB  
Article
Surface Energy Balance of Fresh and Saline Waters: AquaSEBS
by Ahmed Abdelrady 1,2, Joris Timmermans 1,3, Zoltán Vekerdy 1,4 and Mhd. Suhyb Salama 1,*
1 Faculty of Geo-Information Science and Earth Observation (ITC), University of Twente, Enschede 7500 AE, The Netherlands
2 Aswan Water and Wastewater Company, Aswan 8734, Egypt
3 Department of Geography, University College London, Gower Street, London WC1E 6BT, UK
4 Department of Water Management, Szent István University, Gödöllő 2100, Hungary
Remote Sens. 2016, 8(7), 583; https://doi.org/10.3390/rs8070583 - 9 Jul 2016
Cited by 24 | Viewed by 9492
Abstract
Current earth observation models do not take into account the influence of water salinity on the evaporation rate, even though the salinity influences the evaporation rate by affecting the density and latent heat of vaporization. In this paper, we adapt the SEBS (Surface [...] Read more.
Current earth observation models do not take into account the influence of water salinity on the evaporation rate, even though the salinity influences the evaporation rate by affecting the density and latent heat of vaporization. In this paper, we adapt the SEBS (Surface Energy Balance System) model for large water bodies and add the effect of water salinity to the evaporation rate. Firstly, SEBS is modified for fresh-water whereby new parameterizations of the water heat flux and sensible heat flux are suggested. This is achieved by adapting the roughness heights for momentum and heat transfer. Secondly, a salinity correction factor is integrated into the adapted model. Eddy covariance measurements over Lake IJsselmeer (The Netherlands) are carried out and used to estimate the roughness heights for momentum (~0.0002 m) and heat transfer (~0.0001 m). Application of these values over the Victoria and Tana lakes (freshwater) in Africa showed that the calculated latent heat fluxes agree well with the measurements. The root mean-square of relative-errors (rRMSE) is about 4.1% for Lake Victoria and 4.7%, for Lake Tana. Verification with ECMWF data showed that the salinity reduced the evaporation at varying levels by up to 27% in the Great Salt Lake and by 1% for open ocean. Our results show the importance of salinity to the evaporation rate and the suitability of the adapted-SEBS model (AquaSEBS) for fresh and saline waters. Full article
Show Figures

Graphical abstract

16 pages, 5491 KiB  
Article
Automated Subpixel Surface Water Mapping from Heterogeneous Urban Environments Using Landsat 8 OLI Imagery
by Huan Xie *, Xin Luo, Xiong Xu, Haiyan Pan and Xiaohua Tong *
College of Surveying and Geo-informatics, Tongji University, Shanghai 200092, China
Remote Sens. 2016, 8(7), 584; https://doi.org/10.3390/rs8070584 - 12 Jul 2016
Cited by 91 | Viewed by 8753
Abstract
Water bodies are a fundamental element of urban ecosystems, and water mapping is critical for urban and landscape planning and management. Remote sensing has increasingly been used for water mapping in rural areas; however, when applied to urban areas, this spatially- explicit approach [...] Read more.
Water bodies are a fundamental element of urban ecosystems, and water mapping is critical for urban and landscape planning and management. Remote sensing has increasingly been used for water mapping in rural areas; however, when applied to urban areas, this spatially- explicit approach is a challenging task due to the fact that the water bodies are often of a small size and spectral confusion is common between water and the complex features in the urban environment. Water indexes are the most common method of water extraction at the pixel level. More recently, spectral mixture analysis (SMA) has been widely employed in analyzing the urban environment at the subpixel level. The objective of this study is to develop an automatic subpixel water mapping method (ASWM) which can achieve a high accuracy in urban areas. Specifically, we first apply a water index for the automatic extraction of mixed land-water pixels, and the pure water pixels that are generated in this process are exported as the final result. Secondly, the SMA technique is applied to the mixed land-water pixels for water abundance estimation. As for obtaining the most representative endmembers, we propose an adaptive iterative endmember selection method based on the spatial similarity of adjacent ground surfaces. One classical water index method (the modified normalized difference water index (MNDWI)), a pixel-level target detection method (constrained energy minimization (CEM)), and two widely used SMA methods (fully constrained least squares (FCLS) and multiple endmember spectral mixture analysis (MESMA)) were chosen for the water mapping comparison in the experiments. The results indicate that the proposed ASWM was able to detect water pixels more efficiency than other unsupervised water extraction methods, and the water fractions estimated by the proposed ASWM method correspond closely to the reference fractions with the slopes of 0.97, 1.02, 1.04, and 0.98 and the R-squared values of 0.9454, 0.9486, 0.9665, and 0.9607 in regression analysis corresponding to different test regions. In the quantitative accuracy assessment, the ASWM method shows the best performance in water mapping with the mean kappa coefficient of 0.862, mean producer’s accuracy of 82.8%, and mean user’s accuracy of 91.8% for test regions. Full article
Show Figures

Graphical abstract

23 pages, 3194 KiB  
Article
Crop Area Mapping Using 100-m Proba-V Time Series
by Yetkin Özüm Durgun 1,2,*, Anne Gobin 1, Ruben Van De Kerchove 1 and Bernard Tychon 2
1 Vlaamse Instelling voor Technologisch Onderzoek (VITO), Boeretang 200, B-2400 Mol, Belgium
2 Département Sciences et Gestion de l’Environnement, Université de Liège, Avenue de Longwy 185, 6700 Arlon, Belgium
Remote Sens. 2016, 8(7), 585; https://doi.org/10.3390/rs8070585 - 11 Jul 2016
Cited by 27 | Viewed by 7653
Abstract
A method was developed for crop area mapping inspired by spectral matching techniques (SMTs) and based on phenological characteristics of different crop types applied using 100-m Proba-V NDVI data for the season 2014–2015. Ten-daily maximum value NDVI composites were created and smoothed in [...] Read more.
A method was developed for crop area mapping inspired by spectral matching techniques (SMTs) and based on phenological characteristics of different crop types applied using 100-m Proba-V NDVI data for the season 2014–2015. Ten-daily maximum value NDVI composites were created and smoothed in SPIRITS (spirits.jrc.ec.europa.eu). The study sites were globally spread agricultural areas located in Flanders (Belgium), Sria (Russia), Kyiv (Ukraine) and Sao Paulo (Brazil). For each pure pixel within the field, the NDVI profile of the crop type for its growing season was matched with the reference NDVI profile based on the training set extracted from the study site where the crop type originated. Three temporal windows were tested within the growing season: green-up to senescence, green-up to dormancy and minimum NDVI at the beginning of the growing season to minimum NDVI at the end of the growing season. Post classification rules were applied to the results to aggregate the crop type at the plot level. The overall accuracy (%) ranged between 65 and 86, and the kappa coefficient changed from 0.43–0.84 according to the site and the temporal window. In order of importance, the crop phenological development period, parcel size, shorter time window, number of ground-truth parcels and crop calendar similarity were the main reasons behind the differences between the results. The methodology described in this study demonstrated that 100-m Proba-V has the potential to be used in crop area mapping across different regions in the world. Full article
Show Figures

Graphical abstract

18 pages, 3361 KiB  
Article
Downscaling Meteosat Land Surface Temperature over a Heterogeneous Landscape Using a Data Assimilation Approach
by Rihab Mechri 1,*,†, Catherine Ottlé 1, Olivier Pannekoucke 2, Abdelaziz Kallel 3, Fabienne Maignan 1, Dominique Courault 4 and Isabel F. Trigo 5
1 Laboratoire des Sciences du Climat et de l'Environnement (LSCE), UMR 8212, CNRS-CEA-UVSQ, Orme des Merisiers, 91191 Gif-sur-Yvette, France
2 Centre National de Recherches Météorologiques (CNRM-GAME), UMR 3589, Météo-France-CNRS, 42 Avenue G. Coriolis, 31057 Toulouse, France
3 Digital Research Center of Sfax, Advanced Technologies for Medecine and Signals, P.O. Box 275, Sakiet Ezzit, 3021 Sfax, Tunisia
4 Environnement Méditerranéen et Modélisation des Agro-Hydrosystèmes (EMMAH), UMR1114, INRA-UAPV, Domaine St Paul, 84914 Avignon Cedex 9, France
5 Instituto Português do Mar e da Atmosfera (IPMA), Rua C ao Aeroporto, 1749-077 Lisboa, Portugal
Current address: Laboratoire de Météorologie Dynamique (LMD), UMR8539, Ecole Polytechnique, Route de Saclay, 91128 Palaiseau, France
Remote Sens. 2016, 8(7), 586; https://doi.org/10.3390/rs8070586 - 11 Jul 2016
Cited by 8 | Viewed by 6153
Abstract
A wide range of environmental applications require the monitoring of land surface temperature (LST) at frequent intervals and fine spatial resolutions, but these conditions are not offered nowadays by the available space sensors. To overcome these shortcomings, LST downscaling methods have been developed [...] Read more.
A wide range of environmental applications require the monitoring of land surface temperature (LST) at frequent intervals and fine spatial resolutions, but these conditions are not offered nowadays by the available space sensors. To overcome these shortcomings, LST downscaling methods have been developed to derive higher resolution LST from the available satellite data. This research concerns the application of a data assimilation (DA) downscaling approach, the genetic particle smoother (GPS), to disaggregate Meteosat 8 LST time series (3 km × 5 km) at finer spatial resolutions. The methodology was applied over the Crau-Camargue region in Southeastern France for seven months in 2009. The evaluation of the downscaled LSTs has been performed at a moderate resolution using a set of coincident clear-sky MODIS LST images from Aqua and Terra platforms (1 km × 1 km) and at a higher resolution using Landsat 7 data (60 m × 60 m). The performance of the downscaling has been assessed in terms of reduction of the biases and the root mean square errors (RMSE) compared to prior model-simulated LSTs. The results showed that GPS allows downscaling the Meteosat LST product from 3 × 5 km2 to 1 × 1 km2 scales with a RMSE less than 2.7 K. Finer scale downscaling at Landsat 7 resolution showed larger errors (RMSE around 5 K) explained by land cover errors and inter-calibration issues between sensors. Further methodology improvements are finally suggested. Full article
Show Figures

Graphical abstract

20 pages, 4775 KiB  
Article
Multi-Temporal Evaluation of Soil Moisture and Land Surface Temperature Dynamics Using in Situ and Satellite Observations
by Miriam Pablos 1,2,*, José Martínez-Fernández 3, María Piles 2,4, Nilda Sánchez 3, Mercè Vall-llossera 1,2 and Adriano Camps 1,2
1 Universitat Politècnica de Catalunya (UPC) and Institut d’Estudis Espacials de Catalunya (IEEC), Campus Nord, buildings D3 and D4, 08034 Barcelona, Spain
2 Barcelona Expert Centre (BEC), Passeig Marítim de la Barceloneta 37-49, 08003 Barcelona, Spain
3 Instituto Hispano-Luso de Investigaciones Agrarias (CIALE), University of Salamanca (USAL), Duero 12, 37185 Villamayor, Salamanca, Spain
4 Institute of Marine Sciences (ICM/CSIC), Passeig Marítim de la Barceloneta 37-49, 08003 Barcelona, Spain
Remote Sens. 2016, 8(7), 587; https://doi.org/10.3390/rs8070587 - 11 Jul 2016
Cited by 64 | Viewed by 9663
Abstract
Soil moisture (SM) is an important component of the Earth’s surface water balance and by extension the energy balance, regulating the land surface temperature (LST) and evapotranspiration (ET). Nowadays, there are two missions dedicated to monitoring the Earth’s surface SM using L-band radiometers: [...] Read more.
Soil moisture (SM) is an important component of the Earth’s surface water balance and by extension the energy balance, regulating the land surface temperature (LST) and evapotranspiration (ET). Nowadays, there are two missions dedicated to monitoring the Earth’s surface SM using L-band radiometers: ESA’s Soil Moisture and Ocean Salinity (SMOS) and NASA’s Soil Moisture Active Passive (SMAP). LST is remotely sensed using thermal infrared (TIR) sensors on-board satellites, such as NASA’s Terra/Aqua MODIS or ESA & EUMETSAT’s MSG SEVIRI. This study provides an assessment of SM and LST dynamics at daily and seasonal scales, using 4 years (2011–2014) of in situ and satellite observations over the central part of the river Duero basin in Spain. Specifically, the agreement of instantaneous SM with a variety of LST-derived parameters is analyzed to better understand the fundamental link of the SM–LST relationship through ET and thermal inertia. Ground-based SM and LST measurements from the REMEDHUS network are compared to SMOS SM and MODIS LST spaceborne observations. ET is obtained from the HidroMORE regional hydrological model. At the daily scale, a strong anticorrelation is observed between in situ SM and maximum LST (R 0.6 to −0.8), and between SMOS SM and MODIS LST Terra/Aqua day (R 0.7). At the seasonal scale, results show a stronger anticorrelation in autumn, spring and summer (in situ R 0.5 to −0.7; satellite R 0.4 to −0.7) indicating SM–LST coupling, than in winter (in situ R ≈ +0.3; satellite R 0.3) indicating SM–LST decoupling. These different behaviors evidence changes from water-limited to energy-limited moisture flux across seasons, which are confirmed by the observed ET evolution. In water-limited periods, SM is extracted from the soil through ET until critical SM is reached. A method to estimate the soil critical SM is proposed. For REMEDHUS, the critical SM is estimated to be ∼0.12 m 3 /m 3 , stable over the study period and consistent between in situ and satellite observations. A better understanding of the SM–LST link could not only help improving the representation of LST in current hydrological and climate prediction models, but also refining SM retrieval or microwave-optical disaggregation algorithms, related to ET and vegetation status. Full article
(This article belongs to the Special Issue Remote Sensing Applied to Soils: From Ground to Space)
Show Figures

Graphical abstract

13 pages, 952 KiB  
Article
Hyperspectral Unmixing with Robust Collaborative Sparse Regression
by Chang Li 1, Yong Ma 2,*, Xiaoguang Mei 2, Chengyin Liu 1 and Jiayi Ma 2
1 School of Electronic Information and Communications, Huazhong University of Science and Technology, Wuhan 430074, China
2 Electronic Information School, Wuhan University, Wuhan 430072, China
Remote Sens. 2016, 8(7), 588; https://doi.org/10.3390/rs8070588 - 11 Jul 2016
Cited by 41 | Viewed by 5964
Abstract
Recently, sparse unmixing (SU) of hyperspectral data has received particular attention for analyzing remote sensing images. However, most SU methods are based on the commonly admitted linear mixing model (LMM), which ignores the possible nonlinear effects (i.e., nonlinearity). In this paper, we propose [...] Read more.
Recently, sparse unmixing (SU) of hyperspectral data has received particular attention for analyzing remote sensing images. However, most SU methods are based on the commonly admitted linear mixing model (LMM), which ignores the possible nonlinear effects (i.e., nonlinearity). In this paper, we propose a new method named robust collaborative sparse regression (RCSR) based on the robust LMM (rLMM) for hyperspectral unmixing. The rLMM takes the nonlinearity into consideration, and the nonlinearity is merely treated as outlier, which has the underlying sparse property. The RCSR simultaneously takes the collaborative sparse property of the abundance and sparsely distributed additive property of the outlier into consideration, which can be formed as a robust joint sparse regression problem. The inexact augmented Lagrangian method (IALM) is used to optimize the proposed RCSR. The qualitative and quantitative experiments on synthetic datasets and real hyperspectral images demonstrate that the proposed RCSR is efficient for solving the hyperspectral SU problem compared with the other four state-of-the-art algorithms. Full article
Show Figures

Graphical abstract

30 pages, 10015 KiB  
Article
Impact of Initial Soil Temperature Derived from Remote Sensing and Numerical Weather Prediction Datasets on the Simulation of Extreme Heat Events
by Igor Gómez 1,2,*, Vicente Caselles 1, María José Estrela 3 and Raquel Niclòs 1
1 Earth Physics and Thermodynamics Department, Faculty of Physics, University of Valencia, Doctor Moliner, 50, Burjassot, Valencia 46100, Spain
2 Environment and Earth Sciences Department, Faculty of Sciences, University of Alicante, Section 99, Alicante 03080, Spain
3 Geography Department, Faculty of Geography and History, University of Valencia, Avda. Blasco Ibáñez, 28, Valencia 46010, Spain
Remote Sens. 2016, 8(7), 589; https://doi.org/10.3390/rs8070589 - 13 Jul 2016
Cited by 14 | Viewed by 6365
Abstract
Extreme heat weather events have received increasing attention and has become of special importance as they can remarkably affect sectors as diverse as public health, energy consumption, water resources, natural biodiversity and agricultural production. In this regard, summer temperatures have become a parameter [...] Read more.
Extreme heat weather events have received increasing attention and has become of special importance as they can remarkably affect sectors as diverse as public health, energy consumption, water resources, natural biodiversity and agricultural production. In this regard, summer temperatures have become a parameter of essential interest under a framework of a hypothetical increase in the number of intense-heat conditions. Thus, their forecast is a crucial aspect bearing in mind a mitigation of the effects and impacts that these intense-heat situations could produce. The current work tries to reach a better understanding of these sorts of situations that are really common over the Western Mediterranean coast. An extreme heat episode that took place in the Valencia Region in July 2009 is analysed, based on the simulations performed with the Regional Atmospheric Modeling System (RAMS). This event recorded maximum temperatures exceeding 40 °C amply extended over the region besides reaching minimum temperatures up to 25.92 °C. We examine the role of improved skin and soil temperature (ST) initial conditions in the forecast results by means of different modelling and satellite-derived products. The influence of incorporating the Land Surface Temperature (LST) into RAMS is not found to produce a meaningful impact on the simulation results, independently of the resolution of the dataset used in the initial conditions of the model. In contrast, the introduction of the ST in lower levels, not only the skin temperature, has a more marked decisive effect in the simulation. Additionally, we have evaluated the influence of increasing the number of soil levels to spread deeper underground. This sensitivity experiment has revealed that more soil levels do not produce any meaningful impact on the simulation compared to the original one. In any case, RAMS is able to properly capture the observed patterns in those cases where a Western advection is widely extended over the area of study. This region’s variability in orography and in distances to the sea promotes the development of sea-breeze circulations, thus producing a convergence of two opposite wind flows, a Western synoptic advection and a sea-breeze circulation. As a result, the RAMS skill in those cases where a sea breeze is well developed depends on the proper location of the boundary and convergence lines of these two flows. Full article
Show Figures

Graphical abstract

18 pages, 11262 KiB  
Article
Analysis and Mapping of the Spectral Characteristics of Fractional Green Cover in Saline Wetlands (NE Spain) Using Field and Remote Sensing Data
by Manuela Domínguez-Beisiegel 1, Carmen Castañeda 2,*, Bernard Mougenot 3 and Juan Herrero 2
1 Agrifood Research & Technology Center of Aragon (CITA), EEAD-CSIC Associated Unit, Ave. Montañana 930, 50059 Zaragoza, Spain
2 Estación Experimental de Aula Dei, EEAD-CSIC, Ave. Montañana 1005, 50059 Zaragoza, Spain
3 Centre d’Etudes Spatiales de la Biosphère, (CESBIO), Université de Toulouse, CNES/CNRS/IRD/UPS, 18 Av. Eduard Belin, 31401 CEDEX 9 Toulouse, France
Remote Sens. 2016, 8(7), 590; https://doi.org/10.3390/rs8070590 - 13 Jul 2016
Cited by 20 | Viewed by 8329
Abstract
Inland saline wetlands are complex systems undergoing continuous changes in moisture and salinity and are especially vulnerable to human pressures. Remote sensing is helpful to identify vegetation change in semi-arid wetlands and to assess wetland degradation. Remote sensing-based monitoring requires identification of the [...] Read more.
Inland saline wetlands are complex systems undergoing continuous changes in moisture and salinity and are especially vulnerable to human pressures. Remote sensing is helpful to identify vegetation change in semi-arid wetlands and to assess wetland degradation. Remote sensing-based monitoring requires identification of the spectral characteristics of soils and vegetation and their correspondence with the vegetation cover and soil conditions. We studied the spectral characteristics of soils and vegetation of saline wetlands in Monegros, NE Spain, through field and satellite images. Radiometric and complementary field measurements in two field surveys in 2007 and 2008 were collected in selected sites deemed as representative of different soil moisture, soil color, type of vegetation, and density. Despite the high local variability, we identified good relationships between field spectral data and Quickbird images. A methodology was established for mapping the fraction of vegetation cover in Monegros and other semi-arid areas. Estimating vegetation cover in arid wetlands is conditioned by the soil background and by the occurrence of dry and senescent vegetation accompanying the green component of perennial salt-tolerant plants. Normalized Difference Vegetation Index (NDVI) was appropriate to map the distribution of the vegetation cover if the green and yellow-green parts of the plants are considered. Full article
(This article belongs to the Special Issue What can Remote Sensing Do for the Conservation of Wetlands?)
Show Figures

Graphical abstract

16 pages, 7265 KiB  
Article
Early Detection of Summer Crops Using High Spatial Resolution Optical Image Time Series
by Claire Marais Sicre *, Jordi Inglada, Rémy Fieuzal, Frédéric Baup, Silvia Valero, Jérôme Cros, Mireille Huc and Valérie Demarez
CESBIO—Centre d’Études Spatiales de la BIOsphère, Université de Toulouse, CNES/CNRS/IRD/UPS, 18 Avenue Edouard Belin, Toulouse 31401, France
Remote Sens. 2016, 8(7), 591; https://doi.org/10.3390/rs8070591 - 14 Jul 2016
Cited by 34 | Viewed by 8586
Abstract
In the context of climate change, agricultural managers have the imperative to combine sufficient productivity with durability of the resources. Many studies have shown the interest of recent satellite missions as suitable tools for agricultural surveys. Nevertheless, they are not predictive methods. A [...] Read more.
In the context of climate change, agricultural managers have the imperative to combine sufficient productivity with durability of the resources. Many studies have shown the interest of recent satellite missions as suitable tools for agricultural surveys. Nevertheless, they are not predictive methods. A system able to detect summer crops as early as possible is important in order to obtain valuable information for a better water management strategy. The detection of summer crops before the beginning of the irrigation period is therefore our objective. The study area is located near Toulouse (southwestern France), and is a region of mixed farming with a wide variety of irrigated and non-irrigated crops. Using the reference data for the years concerned, a set of fixed thresholds are applied to a vegetation index (the Normalized Difference Vegetation Index, NDVI) for each agricultural season of multi-spectral satellite optical imagery acquired at decametric spatial resolutions from 2006 to 2013. The performance (i.e., accuracy) is contrasted according to the agricultural practices, the development states of the different crops and the number of acquisition dates (one to three in the results presented here). The detection of summer crops reaches 64% to 88% with a single date, 80% to 88% with two dates and 90% to 99% with three dates. The robustness of this method is tested for several years (showing an impact of meteorological conditions on the actual choice of images), several sensors and several resolutions. Full article
Show Figures

Graphical abstract

19 pages, 2514 KiB  
Article
Tower-Based Validation and Improvement of MODIS Gross Primary Production in an Alpine Swamp Meadow on the Tibetan Plateau
by Ben Niu 1,2, Yongtao He 1, Xianzhou Zhang 1,*, Gang Fu 1, Peili Shi 1, Mingyuan Du 3, Yangjian Zhang 1 and Ning Zong 1
1 Lhasa Plateau Ecosystem Research Station, Key Laboratory of Ecosystem Network Observation and Modeling, Institute of Geographic Sciences and Natural Resources Research, Chinese Academy of Sciences, Beijing 100101, China
2 University of Chinese Academy of Sciences, Beijing 100049, China
3 Institute for Agro-Environmental Sciences, National Agriculture and Food Research Organization, 3-1-3 Kannondai, Tsukuba, Ibaraki 305-8604, Japan
Remote Sens. 2016, 8(7), 592; https://doi.org/10.3390/rs8070592 - 13 Jul 2016
Cited by 29 | Viewed by 6643
Abstract
Alpine swamp meadow on the Tibetan Plateau is among the most sensitive areas to climate change. Accurate quantification of the GPP in alpine swamp meadow can benefit our understanding of the global carbon cycle. The 8-day MODerate resolution Imaging Spectroradiometer (MODIS) gross primary [...] Read more.
Alpine swamp meadow on the Tibetan Plateau is among the most sensitive areas to climate change. Accurate quantification of the GPP in alpine swamp meadow can benefit our understanding of the global carbon cycle. The 8-day MODerate resolution Imaging Spectroradiometer (MODIS) gross primary production (GPP) products (GPP_MOD) provide a pathway to estimate GPP in this remote ecosystem. However, the accuracy of the GPP_MOD estimation in this representative alpine swamp meadow is still unknown. Here five years GPP_MOD was validated using GPP derived from the eddy covariance flux measurements (GPP_EC) from 2009 to 2013. Our results indicated that the GPP_EC was strongly underestimated by GPP_MOD with a daily mean less than 40% of EC measurements. To reduce this error, the ground meteorological and vegetation leaf area index (LAIG) measurements were used to revise the key inputs, the maximum light use efficiency (εmax) and the fractional photosynthetically active radiation (FPARM) in the MOD17 algorithm. Using two approaches to determine the site-specific εmax value, we suggested that the suitable εmax was about 1.61 g C MJ−1 for this alpine swamp meadow which was considerably larger than the default 0.68 g C MJ−1 for grassland. The FPARM underestimated 22.2% of the actual FPAR (FPARG) simulated from the LAIG during the whole study period. Model comparisons showed that the large inaccuracies of GPP_MOD were mainly caused by the underestimation of the εmax and followed by that of the undervalued FPAR. However, the DAO meteorology data in the MOD17 algorithm did not exert a significant affection in the MODIS GPP underestimations. Therefore, site-specific optimized parameters inputs, especially the εmax and FPARG, are necessary to improve the performance of the MOD17 algorithm in GPP estimation, in which the calibrated MOD17A2 algorithm (GPP_MODR3) could explain 91.6% of GPP_EC variance for the alpine swamp meadow. Full article
Show Figures

Graphical abstract

17 pages, 3102 KiB  
Article
An Operational Framework for Land Cover Classification in the Context of REDD+ Mechanisms. A Case Study from Costa Rica
by Alfredo Fernández-Landa 1,*, Nur Algeet-Abarquero 1, Jesús Fernández-Moya 2, María Luz Guillén-Climent 1, Lucio Pedroni 3, Felipe García 4, Andrés Espejo 5, Juan Felipe Villegas 3, Miguel Marchamalo 6, Javier Bonatti 7, Iñigo Escamochero 1, Pablo Rodríguez-Noriega 1, Stavros Papageorgiou 8 and Erick Fernandes 8
1 Agresta S. Coop., Duque Fernán Nuñez 2, Madrid 28012, Spain
2 Freelance, Plaza Constitución 8, Chapinería, Madrid 28694, Spain
3 Carbon Decisions International (CDI), Residencial La Castilla, Paraíso de Cartago 30201, Costa Rica
4 DIMAP, CEI Montegancedo, Madrid 28223, Spain
5 AFOLU Global Services, C/Jimenez Diaz, Pozuelo Alarcón 28224, Spain
6 UPM, Avda Profesor Aranguren, Madrid 28040, Spain
7 UCR, Ciudad de la Investigación, San José 11501, Costa Rica
8 World Bank, 1818 H Street, NW, Washington, DC 20433, USA
Remote Sens. 2016, 8(7), 593; https://doi.org/10.3390/rs8070593 - 13 Jul 2016
Cited by 9 | Viewed by 9144
Abstract
REDD+ implementation requires robust, consistent, accurate and transparent national land cover historical data and monitoring systems. Satellite imagery is the only data source with enough periodicity to provide consistent land cover information in a cost-effective way. The main aim of this paper is [...] Read more.
REDD+ implementation requires robust, consistent, accurate and transparent national land cover historical data and monitoring systems. Satellite imagery is the only data source with enough periodicity to provide consistent land cover information in a cost-effective way. The main aim of this paper is the creation of an operational framework for monitoring land cover dynamics based on Landsat imagery and open-source software. The methodology integrates the entire land cover and land cover change mapping processes to produce a consistent series of Land Cover maps. The consistency of the time series is achieved through the application of a single trained machine learning algorithm to radiometrically normalized imagery using iteratively re-weighted multivariate alteration detection (IR-MAD) across all dates of the historical period. As a result, seven individual Land Cover maps of Costa Rica were produced from 1985/1986 to 2013/2014. Post-classification land cover change detection was performed to evaluate the land cover dynamics in Costa Rica. The validation of the land cover maps showed an overall accuracy of 87% for the 2013/2014 map, 93% for the 2000/2001 map and 89% for the 1985/1986 map. Land cover changes between forest and non-forest classes were validated for the period between 2001 and 2011, obtaining an overall accuracy of 86%. Forest age-classes were generated through a multi-temporal analysis of the maps. By linking deforestation dynamics with forest age, a more accurate discussion of the carbon emissions along the time series can be presented. Full article
Show Figures

Graphical abstract

22 pages, 28604 KiB  
Article
Pansharpening by Convolutional Neural Networks
by Giuseppe Masi, Davide Cozzolino, Luisa Verdoliva and Giuseppe Scarpa *
Università di Napoli Federico II, Via Claudio 21, Napoli 80125, Italy
Remote Sens. 2016, 8(7), 594; https://doi.org/10.3390/rs8070594 - 14 Jul 2016
Cited by 1017 | Viewed by 27342
Abstract
A new pansharpening method is proposed, based on convolutional neural networks. We adapt a simple and effective three-layer architecture recently proposed for super-resolution to the pansharpening problem. Moreover, to improve performance without increasing complexity, we augment the input by including several maps of [...] Read more.
A new pansharpening method is proposed, based on convolutional neural networks. We adapt a simple and effective three-layer architecture recently proposed for super-resolution to the pansharpening problem. Moreover, to improve performance without increasing complexity, we augment the input by including several maps of nonlinear radiometric indices typical of remote sensing. Experiments on three representative datasets show the proposed method to provide very promising results, largely competitive with the current state of the art in terms of both full-reference and no-reference metrics, and also at a visual inspection. Full article
Show Figures

Graphical abstract

24 pages, 8984 KiB  
Article
Quantifying Live Aboveground Biomass and Forest Disturbance of Mountainous Natural and Plantation Forests in Northern Guangdong, China, Based on Multi-Temporal Landsat, PALSAR and Field Plot Data
by Wenjuan Shen 1,2,†, Mingshi Li 1,2,*, Chengquan Huang 3,† and Anshi Wei 4,†
1 College of Forestry, Nanjing Forestry University, Nanjing 210037, China
2 Co-Innovation Center for Sustainable Forestry in Southern China, Nanjing Forestry University, Nanjing 210037, China
3 Department of Geographical Sciences, University of Maryland, College Park, MD 20742, USA
4 Guangdong Provincial Center for Forest Resources Monitoring, Guangzhou 510173, China
These authors contributed equally to this work.
Remote Sens. 2016, 8(7), 595; https://doi.org/10.3390/rs8070595 - 13 Jul 2016
Cited by 45 | Viewed by 8648
Abstract
Spatially explicit knowledge of aboveground biomass (AGB) in large areas is important for accurate carbon accounting and quantifying the effect of forest disturbance on the terrestrial carbon cycle. We estimated AGB from 1990 to 2011 in northern Guangdong, China, based on a spatially [...] Read more.
Spatially explicit knowledge of aboveground biomass (AGB) in large areas is important for accurate carbon accounting and quantifying the effect of forest disturbance on the terrestrial carbon cycle. We estimated AGB from 1990 to 2011 in northern Guangdong, China, based on a spatially explicit dataset derived from six years of national forest inventory (NFI) plots, Landsat time series imagery (1986–2011) and Advanced Land Observing Satellite (ALOS) Phased Array L-band Synthetic Aperture Radars (PALSAR) 25 m mosaic data (2007–2010). Four types of variables were derived for modeling and assessment. The random forest approach was used to seek the optimal variables for mapping and validation. The root mean square error (RMSE) of plot-level validation was between 6.44 and 39.49 (t/ha), the normalized root-mean-square error (NRMSE) was between 7.49% and 19.01% and mean absolute error (MAE) was between 5.06 and 23.84 t/ha. The highest coefficient of determination R2 of 0.8 and the lowest NRMSE of 7.49% were reported in 2006. A clear increasing trend of mean AGB from the lowest value of 13.58 t/ha to the highest value of 66.25 t/ha was witnessed between 1988 and 2000, while after 2000 there was a fluctuating ascending change, with a peak mean AGB of 67.13 t/ha in 2004. By integrating AGB change with forest disturbance, the trend in disturbance area closely corresponded with the trend in AGB decrease. To determine the driving forces of these changes, the correlation analysis was adopted and exploratory factor analysis (EFA) method was used to find a factor rotation that maximizes this variance and represents the dominant factors of nine climate elements and nine human activities elements affecting the AGB dynamics. Overall, human activities contributed more to short-term AGB dynamics than climate data. Harvesting and human-induced fire in combination with rock desertification and global warming made a strong contribution to AGB changes. This study provides valuable information for the relationships between forest AGB and climate as well as forest disturbance in subtropical zones. Full article
(This article belongs to the Special Issue Remote Sensing of Vegetation Structure and Dynamics)
Show Figures

Graphical abstract

21 pages, 5557 KiB  
Article
Potential of ENVISAT Radar Altimetry for Water Level Monitoring in the Pantanal Wetland
by Denise Dettmering *, Christian Schwatke, Eva Boergens and Florian Seitz
Deutsches Geodätisches Forschungsinstitut der Technischen Universität München (DGFI-TUM), Arcisstrasse 21, 80333 München, Germany
Remote Sens. 2016, 8(7), 596; https://doi.org/10.3390/rs8070596 - 14 Jul 2016
Cited by 26 | Viewed by 9254
Abstract
Wetlands are important ecosystems playing an essential role for continental water regulation and the hydrologic cycle. Moreover, they are sensitive to climate changes as well as anthropogenic influences, such as land-use or dams. However, the monitoring of these regions is challenging as they [...] Read more.
Wetlands are important ecosystems playing an essential role for continental water regulation and the hydrologic cycle. Moreover, they are sensitive to climate changes as well as anthropogenic influences, such as land-use or dams. However, the monitoring of these regions is challenging as they are normally located in remote areas without in situ measurement stations. Radar altimetry provides important measurements for monitoring and analyzing water level variations in wetlands and flooded areas. Using the example of the Pantanal region in South America, this study demonstrates the capability and limitations of ENVISAT radar altimeter for monitoring water levels in inundation areas. By applying an innovative processing method consisting of a rigorous data screening by means of radar echo classification as well as an optimized waveform retracking, water level time series with respect to a global reference and with a temporal resolution of about one month are derived. A comparison between altimetry-derived height variations and six in situ time series reveals accuracies of 30 to 50 cm RMS. The derived water level time series document seasonal height variations of up to 1.5 m amplitude with maximum water levels between January and June. Large scale geographical pattern of water heights are visible within the wetland. However, some regions of the Pantanal show water level variations less than a few decimeter, which is below the accuracies of the method. These areas cannot be reliably monitored by ENVISAT. Full article
(This article belongs to the Special Issue What can Remote Sensing Do for the Conservation of Wetlands?)
Show Figures

Graphical abstract

29 pages, 3852 KiB  
Article
How Universal Is the Relationship between Remotely Sensed Vegetation Indices and Crop Leaf Area Index? A Global Assessment
by Yanghui Kang 1,2, Mutlu Özdoğan 1,*, Samuel C. Zipper 3, Miguel O. Román 4, Jeff Walker 5, Suk Young Hong 6, Michael Marshall 7, Vincenzo Magliulo 8,9, José Moreno 10, Luis Alonso 10, Akira Miyata 11, Bruce Kimball 12 and Steven P. Loheide 3
1 Nelson Institute Center for Sustainability and the Global Environment, University of Wisconsin-Madison, 1710 University Avenue, Madison, WI 53726, USA
2 Department of Geography, University of Wisconsin-Madison, Madison, WI 53706, USA
3 Department of Civil and Environmental Engineering, University of Wisconsin-Madison, Madison, WI 53706, USA
4 Terrestrial Information Systems Laboratory, NASA Goddard Space Flight Center, Code 619 Bld-32 S-036F, Greenbelt, MD 20771, USA
5 Department of Civil Engineering, Monash University, Clayton, Victoria 3800, Australia
6 Department of Agricultural Environment, National Institute of Agricultural Sciences (NAS), RDA, Wanju 55365, Korea
7 Climate Research Unit, World Agroforestry Centre, United Nations Ave, Gigiri, P.O. Box 30677, Nairobi 00100, Kenya
8 CNR–ISAFOM, Institute for Mediterranean Agricultural and Forest Systems, National Research Council, via Patacca 85, 80040 Ercolano (Napoli), Italy
9 Institute of Biometeorology of the National Research Council (IBIMET-CNR), Firenze 8-50145, Italy
10 Laboratory for Earth Observation, Department of Earth Physics and Thermodynamics, University of Valencia, Burjassot, Valencia 46100, Spain
11 Institute for Agro-Environmental Sciences, NARO, Tsukuba 305-8604, Japan
12 US Arid-Land Agricultural Research Center, USDA, Agricultural Research Service, Maricopa, AZ 85138, USA
add Show full affiliation list remove Hide full affiliation list
Remote Sens. 2016, 8(7), 597; https://doi.org/10.3390/rs8070597 - 15 Jul 2016
Cited by 110 | Viewed by 14673
Abstract
Leaf Area Index (LAI) is a key variable that bridges remote sensing observations to the quantification of agroecosystem processes. In this study, we assessed the universality of the relationships between crop LAI and remotely sensed Vegetation Indices (VIs). We first compiled a global [...] Read more.
Leaf Area Index (LAI) is a key variable that bridges remote sensing observations to the quantification of agroecosystem processes. In this study, we assessed the universality of the relationships between crop LAI and remotely sensed Vegetation Indices (VIs). We first compiled a global dataset of 1459 in situ quality-controlled crop LAI measurements and collected Landsat satellite images to derive five different VIs including Simple Ratio (SR), Normalized Difference Vegetation Index (NDVI), two versions of the Enhanced Vegetation Index (EVI and EVI2), and Green Chlorophyll Index (CIGreen). Based on this dataset, we developed global LAI-VI relationships for each crop type and VI using symbolic regression and Theil-Sen (TS) robust estimator. Results suggest that the global LAI-VI relationships are statistically significant, crop-specific, and mostly non-linear. These relationships explain more than half of the total variance in ground LAI observations (R2 > 0.5), and provide LAI estimates with RMSE below 1.2 m2/m2. Among the five VIs, EVI/EVI2 are the most effective, and the crop-specific LAI-EVI and LAI-EVI2 relationships constructed by TS, are robust when tested by three independent validation datasets of varied spatial scales. While the heterogeneity of agricultural landscapes leads to a diverse set of local LAI-VI relationships, the relationships provided here represent global universality on an average basis, allowing the generation of large-scale spatial-explicit LAI maps. This study contributes to the operationalization of large-area crop modeling and, by extension, has relevance to both fundamental and applied agroecosystem research. Full article
Show Figures

Graphical abstract

24 pages, 21980 KiB  
Article
Glacier Remote Sensing Using Sentinel-2. Part I: Radiometric and Geometric Performance, and Application to Ice Velocity
by Andreas Kääb 1,*, Solveig H. Winsvold 1, Bas Altena 1, Christopher Nuth 1, Thomas Nagler 2 and Jan Wuite 2
1 Department of Geosciences, University of Oslo, P.O. Box 1047, 0316 Oslo, Norway
2 ENVEO, ICT-Technologiepark, Technikerstr. 21a, 6020 Innsbruck, Austria
Remote Sens. 2016, 8(7), 598; https://doi.org/10.3390/rs8070598 - 15 Jul 2016
Cited by 144 | Viewed by 20961
Abstract
With its temporal resolution of 10 days (five days with two satellites, and significantly more at high latitudes), its swath width of 290 km, and its 10 m and 20 m spatial resolution bands from the visible to the shortwave infrared, the European [...] Read more.
With its temporal resolution of 10 days (five days with two satellites, and significantly more at high latitudes), its swath width of 290 km, and its 10 m and 20 m spatial resolution bands from the visible to the shortwave infrared, the European Sentinel-2 satellites have significant potential for glacier remote sensing, in particular mapping of glacier outlines and facies, and velocity measurements. Testing Level 1C commissioning and ramp-up phase data for initial sensor quality experiences, we find a high radiometric performance, but with slight striping effects under certain conditions. Through co-registration of repeat Sentinal-2 data we also find lateral offset patterns and noise on the order of a few metres. Neither of these issues will complicate most typical glaciological applications. Absolute geo-location of the data investigated was on the order of one pixel at the time of writing. The most severe geometric problem stems from vertical errors of the DEM used for ortho-rectifying Sentinel-2 data. These errors propagate into locally varying lateral offsets in the images, up to several pixels with respect to other georeferenced data, or between Sentinel-2 data from different orbits. Finally, we characterize the potential and limitations of tracking glacier flow from repeat Sentinel-2 data using a set of typical glaciers in different environments: Aletsch Glacier, Swiss Alps; Fox Glacier, New Zealand; Jakobshavn Isbree, Greenland; Antarctic Peninsula at the Larsen C ice shelf. Full article
Show Figures

Graphical abstract

18 pages, 3780 KiB  
Article
A Merging Framework for Rainfall Estimation at High Spatiotemporal Resolution for Distributed Hydrological Modeling in a Data-Scarce Area
by Yinping Long 1,2, Yaonan Zhang 1,3,* and Qimin Ma 1,2
1 Cold and Arid Regions Environmental and Engineering Research Institute of Chinese Academy of Sciences, Lanzhou 730000, China
2 College of Resources and Environment, University of Chinese Academy of Sciences, Beijing 100049, China
3 Gansu Resources and Environmental Science Data Engineering Technology Research Center, Lanzhou 730000, China
Remote Sens. 2016, 8(7), 599; https://doi.org/10.3390/rs8070599 - 15 Jul 2016
Cited by 37 | Viewed by 7542
Abstract
Merging satellite and rain gauge data by combining accurate quantitative rainfall from stations with spatial continuous information from remote sensing observations provides a practical method of estimating rainfall. However, generating high spatiotemporal rainfall fields for catchment-distributed hydrological modeling is a problem when only [...] Read more.
Merging satellite and rain gauge data by combining accurate quantitative rainfall from stations with spatial continuous information from remote sensing observations provides a practical method of estimating rainfall. However, generating high spatiotemporal rainfall fields for catchment-distributed hydrological modeling is a problem when only a sparse rain gauge network and coarse spatial resolution of satellite data are available. The objective of the study is to present a satellite and rain gauge data-merging framework adapting for coarse resolution and data-sparse designs. In the framework, a statistical spatial downscaling method based on the relationships among precipitation, topographical features, and weather conditions was used to downscale the 0.25° daily rainfall field derived from the Tropical Rainfall Measuring Mission (TRMM) Multisatellite Precipitation Analysis (TMPA) precipitation product version 7. The nonparametric merging technique of double kernel smoothing, adapting for data-sparse design, was combined with the global optimization method of shuffled complex evolution, to merge the downscaled TRMM and gauged rainfall with minimum cross-validation error. An indicator field representing the presence and absence of rainfall was generated using the indicator kriging technique and applied to the previously merged result to consider the spatial intermittency of daily rainfall. The framework was applied to estimate daily precipitation at a 1 km resolution in the Qinghai Lake Basin, a data-scarce area in the northeast of the Qinghai-Tibet Plateau. The final estimates not only captured the spatial pattern of daily and annual precipitation with a relatively small estimation error, but also performed very well in stream flow simulation when applied to force the geomorphology-based hydrological model (GBHM). The proposed framework thus appears feasible for rainfall estimation at high spatiotemporal resolution in data-scarce areas. Full article
Show Figures

Graphical abstract

16 pages, 3297 KiB  
Article
Quantifying the Impacts of Environmental Factors on Vegetation Dynamics over Climatic and Management Gradients of Central Asia
by Olena Dubovyk 1,*, Tobias Landmann 2, Andreas Dietz 3 and Gunter Menz 1,4
1 Center for Remote Sensing of Land Surfaces (ZFL), University of Bonn, Bonn 53113, Germany
2 Earth Observation Unit, International Center of Insect Physiology and Ecology (ICIPE), Duduville, Kasarani Road, P.O. Box 30772, Nairobi 00100, Kenya
3 German Remote Sensing Data Center (DFD), German Aerospace Center (DLR), Wessling 82234, Germany
4 Remote Sensing Research Group, Department of Geography, University of Bonn, Meckenheimer Allee 166, Bonn 53115, Germany
Remote Sens. 2016, 8(7), 600; https://doi.org/10.3390/rs8070600 - 15 Jul 2016
Cited by 42 | Viewed by 8384
Abstract
Currently there is a lack of quantitative information regarding the driving factors of vegetation dynamics in post-Soviet Central Asia. Insufficient knowledge also exists concerning vegetation variability across sub-humid to arid climatic gradients as well as vegetation response to different land uses, from natural [...] Read more.
Currently there is a lack of quantitative information regarding the driving factors of vegetation dynamics in post-Soviet Central Asia. Insufficient knowledge also exists concerning vegetation variability across sub-humid to arid climatic gradients as well as vegetation response to different land uses, from natural rangelands to intensively irrigated croplands. In this study, we analyzed the environmental drivers of vegetation dynamics in five Central Asian countries by coupling key vegetation parameter “overall greenness” derived from Moderate Resolution Imaging Spectroradiometer (MODIS) Normalized Difference Vegetation Index (NDVI time series data, with its possible factors across various management and climatic gradients. We developed nine generalized least-squares random effect (GLS-RE) models to analyze the relative impact of environmental factors on vegetation dynamics. The obtained results quantitatively indicated the extensive control of climatic factors on managed and unmanaged vegetation cover across Central Asia. The most diverse vegetation dynamics response to climatic variables was observed for “intensively managed irrigated croplands”. Almost no differences in response to these variables were detected for managed non-irrigated vegetation and unmanaged (natural) vegetation across all countries. Natural vegetation and rainfed non-irrigated crop dynamics were principally associated with temperature and precipitation parameters. Variables related to temperature had the greatest relative effect on irrigated croplands and on vegetation cover within the mountainous zone. Further research should focus on incorporating the socio-economic factors discussed here in a similar analysis. Full article
(This article belongs to the Special Issue Monitoring of Land Changes)
Show Figures

Graphical abstract

20 pages, 2826 KiB  
Article
Kernel Supervised Ensemble Classifier for the Classification of Hyperspectral Data Using Few Labeled Samples
by Jike Chen 1, Junshi Xia 2,3, Peijun Du 1,*, Jocelyn Chanussot 4,5, Zhaohui Xue 6 and Xiangjian Xie 1
1 Key Laboratory for Satellite Mapping Technology and Applications of State Administration of Surveying, Mapping and Geoinformation of China, Nanjing University, 210093 Nanjing, China
2 Intégration, du Matériau au Système (IMS), Univsité de Bordeaux, UMR 5218, F-33405 Talence, France
3 Intégration, du Matériau au Système (IMS), Centre National de la Recherche Scientifique (CNRS), UMR 5218, F-33405 Talence, France
4 Grenoble-Image-sPeech-Signal-Automatics Lab (GIPSA)-lab, Grenoble Institute of Technology, 38400 Grenoble, France
5 Faculty of Electrical and Computer Engineering, University of Iceland, 101 Reykjavik, Iceland
6 Department of Geomatics, Hohai University, 8 West of Focheng Road, 211100 Nanjing, China
Remote Sens. 2016, 8(7), 601; https://doi.org/10.3390/rs8070601 - 15 Jul 2016
Cited by 17 | Viewed by 6567
Abstract
Kernel-based methods and ensemble learning are two important paradigms for the classification of hyperspectral remote sensing images. However, they were developed in parallel with different principles. In this paper, we aim to combine the advantages of kernel and ensemble methods by proposing a [...] Read more.
Kernel-based methods and ensemble learning are two important paradigms for the classification of hyperspectral remote sensing images. However, they were developed in parallel with different principles. In this paper, we aim to combine the advantages of kernel and ensemble methods by proposing a kernel supervised ensemble classification method. In particular, the proposed method, namely RoF-KOPLS, combines the merits of ensemble feature learning (i.e., Rotation Forest (RoF)) and kernel supervised learning (i.e., Kernel Orthonormalized Partial Least Square (KOPLS)). In particular, the feature space is randomly split into K disjoint subspace and KOPLS is applied to each subspace to produce the new features set for the training of decision tree classifier. The final classification result is assigned to the corresponding class by the majority voting rule. Experimental results on two hyperspectral airborne images demonstrated that RoF-KOPLS with radial basis function (RBF) kernel yields the best classification accuracies due to the ability of improving the accuracies of base classifiers and the diversity within the ensemble, especially for the very limited training set. Furthermore, our proposed method is insensitive to the number of subsets. Full article
Show Figures

Graphical abstract

17 pages, 3600 KiB  
Article
The Use of Aerial RGB Imagery and LIDAR in Comparing Ecological Habitats and Geomorphic Features on a Natural versus Man-Made Barrier Island
by Carlton P. Anderson 1,2,*, Gregory A. Carter 1,2 and William R. Funderburk 1,2
1 Department of Geography and Geology, University of Southern Mississippi, Long Beach, MS 39561, USA
2 Gulf Coast Geospatial Center, University of Southern Mississippi, Long Beach, MS 39560, USA
Remote Sens. 2016, 8(7), 602; https://doi.org/10.3390/rs8070602 - 16 Jul 2016
Cited by 22 | Viewed by 8486
Abstract
The Mississippi (MS) barrier island chain along the northern Gulf of Mexico coastline is subject to rapid changes in habitat, geomorphology and elevation by natural and anthropogenic disturbances. The purpose of this study was to compare habitat type coverage with respective elevation, geomorphic [...] Read more.
The Mississippi (MS) barrier island chain along the northern Gulf of Mexico coastline is subject to rapid changes in habitat, geomorphology and elevation by natural and anthropogenic disturbances. The purpose of this study was to compare habitat type coverage with respective elevation, geomorphic features and short-term change between the naturally-formed East Ship Island and the man-made Sand Island. Ground surveys, multi-year remotely-sensed data, habitat classifications and digital elevation models were used to quantify short-term habitat and geomorphic change, as well as to examine the relationships between habitat types and micro-elevation. Habitat types and species composition were the same on both islands with the exception of the algal flat existing on the lower elevated spits of East Ship. Both islands displayed common patterns of vegetation succession and ranges of existence in elevation. Additionally, both islands showed similar geomorphic features, such as fore and back dunes and ponds. Storm impacts had the most profound effects on vegetation and geomorphic features throughout the study period. Although vastly different in age, these two islands show remarkable commonalities among the traits investigated. In comparison to East Ship, Sand Island exhibits key characteristics of a natural barrier island in terms of its vegetated habitats, geomorphic features and response to storm impacts, although it was established anthropogenically only decades ago. Full article
(This article belongs to the Special Issue Remote Sensing in Coastal Environments)
Show Figures

Graphical abstract

25 pages, 7946 KiB  
Article
Land Degradation States and Trends in the Northwestern Maghreb Drylands, 1998–2008
by Gabriel Del Barrio 1,*, Maria E. Sanjuan 1, Azziz Hirche 2,3, Mohamed Yassin 4, Alberto Ruiz 1, Mohamed Ouessar 5, Jaime Martinez Valderrama 1, Bouajila Essifi 5 and Juan Puigdefabregas 1
1 Estacion Experimental de Zonas Aridas (CSIC), Ctra. Sacramento sn, La Cañada, 04120 Almeria, Spain
2 Laboratory of Vegetal Ecology, University of Science and Technology Houari Boumediene (USTHB), BP 32 El Alia, 16111 Bab Ezzouar, Algiers, Algeria
3 Centre de Recherche Scientifique et Technique sur les Régions Arides (CRSTRA), Mohamed Khider University, Biskra, Algeria
4 Centre de Recherche Forestiere (CRF), Avenue Omar Ibn Al Khattab BP 763, 10050 Rabat-Agdal, Morocco
5 Institut des Regions Arides (IRA), Route du Djorf km 22.5, 4119 Medenine, Tunisia
Remote Sens. 2016, 8(7), 603; https://doi.org/10.3390/rs8070603 - 19 Jul 2016
Cited by 32 | Viewed by 8317
Abstract
States of ecological maturity and temporal trends of drylands in Morocco, Algeria and Tunisia north of 28°N are reported for 1998–2008. The input data were Normalized Difference Vegetation Index databases and corresponding climate fields, at a spatial resolution of 1 km and a [...] Read more.
States of ecological maturity and temporal trends of drylands in Morocco, Algeria and Tunisia north of 28°N are reported for 1998–2008. The input data were Normalized Difference Vegetation Index databases and corresponding climate fields, at a spatial resolution of 1 km and a temporal resolution of one month. States convey opposing dynamics of human exploitation and ecological succession. They were identified synchronically for the full period by comparing each location to all other locations in the study area under equivalent aridity. Rain Use Efficiency (RUE) at two temporal scales was used to estimate proxies for biomass and turnover rate. Biomass trends were determined for every location by stepwise regression using time and aridity as predictors. This enabled human-induced degradation to be separated from simple responses to interannual climate variation. Some relevant findings include large areas of degraded land, albeit improving over time or fluctuating with climate, but rarely degrading further; smaller, but significant areas of mature and reference vegetation in most climate zones; very low overall active degradation rates throughout the area during the decade observed; biomass accumulation over time exceeding depletion in most zones; and negative feedback between land states and trends suggesting overall landscape persistence. Semiarid zones were found to be the most vulnerable. Those results can be disaggregated by country or province. The combination with existing land cover maps and national forest inventories leads to the information required by the two progress indicators associated with the United Nations Convention to Combat Desertification strategic objective to improve the conditions of ecosystems and with the Sustainable Development Goal Target 15.3 to achieve land degradation neutrality. Beyond that, the results are also useful as a basis for land management and restoration. Full article
Show Figures

Graphical abstract

17 pages, 13833 KiB  
Article
Flood Damage Analysis: First Floor Elevation Uncertainty Resulting from LiDAR-Derived Digital Surface Models
by José María Bodoque 1,*, Carolina Guardiola-Albert 2, Estefanía Aroca-Jiménez 1, Miguel Ángel Eguibar 3 and María Lorena Martínez-Chenoll 4
1 Department of Geological and Mining Engineering, University of Castilla-La Mancha (UCLM), Avda. Carlos III s/n, 45071 Toledo, Spain
2 Geoscience Research Department, Geological Survey of Spain (IGME), Ríos Rosas 23, 28003 Madrid, Spain
3 Institute for Water and Environmental Engineering (IIAMA), Department of Hydraulic Engineering and Environment, Technical University of Valencia (UPV), Camino de Vera s/n, 46022 Valencia, Spain
4 Department of Hydraulic Engineering and Environment, Technical University of Valencia (UPV), 46022 Valencia, Spain
Remote Sens. 2016, 8(7), 604; https://doi.org/10.3390/rs8070604 - 19 Jul 2016
Cited by 31 | Viewed by 9169
Abstract
The use of high resolution ground-based light detection and ranging (LiDAR) datasets provides spatial density and vertical precision for obtaining highly accurate Digital Surface Models (DSMs). As a result, the reliability of flood damage analysis has improved significantly, owing to the increased accuracy [...] Read more.
The use of high resolution ground-based light detection and ranging (LiDAR) datasets provides spatial density and vertical precision for obtaining highly accurate Digital Surface Models (DSMs). As a result, the reliability of flood damage analysis has improved significantly, owing to the increased accuracy of hydrodynamic models. In addition, considerable error reduction has been achieved in the estimation of first floor elevation, which is a critical parameter for determining structural and content damages in buildings. However, as with any discrete measurement technique, LiDAR data contain object space ambiguities, especially in urban areas where the presence of buildings and the floodplain gives rise to a highly complex landscape that is largely corrected by using ancillary information based on the addition of breaklines to a triangulated irregular network (TIN). The present study provides a methodological approach for assessing uncertainty regarding first floor elevation. This is based on: (i) generation an urban TIN from LiDAR data with a density of 0.5 points·m−2, complemented with the river bathymetry obtained from a field survey with a density of 0.3 points·m−2. The TIN was subsequently improved by adding breaklines and was finally transformed to a raster with a spatial resolution of 2 m; (ii) implementation of a two-dimensional (2D) hydrodynamic model based on the 500-year flood return period. The high resolution DSM obtained in the previous step, facilitated addressing the modelling, since it represented suitable urban features influencing hydraulics (e.g., streets and buildings); and (iii) determination of first floor elevation uncertainty within the 500-year flood zone by performing Monte Carlo simulations based on geostatistics and 1997 control elevation points in order to assess error. Deviations in first floor elevation (average: 0.56 m and standard deviation: 0.33 m) show that this parameter has to be neatly characterized in order to obtain reliable assessments of flood damage assessments and implement realistic risk management. Full article
(This article belongs to the Special Issue Uncertainties in Remote Sensing)
Show Figures

Graphical abstract

22 pages, 4219 KiB  
Article
Active Optical Sensing of Spring Maize for In-Season Diagnosis of Nitrogen Status Based on Nitrogen Nutrition Index
by Tingting Xia 1, Yuxin Miao 1,*, Dali Wu 1, Hui Shao 1, Rajiv Khosla 2 and Guohua Mi 1,*
1 Key Laboratory of Plant-Soil Interactions, Ministry of Education, International Center for Agro-Informatics and Sustainable Development, College of Resources and Environmental Sciences, China Agricultural University, Beijing 100193, China
2 Department of Soil and Crop Sciences, Colorado State University, Fort Collins, CO 80523, USA
Remote Sens. 2016, 8(7), 605; https://doi.org/10.3390/rs8070605 - 19 Jul 2016
Cited by 106 | Viewed by 10034
Abstract
The nitrogen (N) nutrition index (NNI) is a reliable indicator of crop N status and there is an urgent need to develop efficient technologies for non-destructive estimation of NNI to support the practical applications of precision N management strategies. The objectives of this [...] Read more.
The nitrogen (N) nutrition index (NNI) is a reliable indicator of crop N status and there is an urgent need to develop efficient technologies for non-destructive estimation of NNI to support the practical applications of precision N management strategies. The objectives of this study were to: (i) validate a newly established critical N dilution curve for spring maize in Northeast China; (ii) determine the potential of using the GreenSeeker active optical sensor to non-destructively estimate NNI; and (iii) evaluate the performance of different N status diagnostic approaches based on estimated NNI via the GreenSeeker sensor measurements. Four field experiments involving six N rates (0, 60, 120,180, 240, and 300 kg·ha−1) were conducted in 2014 and 2015 in Lishu County, Jilin Province in Northeast China. The results indicated that the newly established critical N dilution curve was suitable for spring maize N status diagnosis in the study region. Across site-years and growth stages (V5–V10), GreenSeeker sensor-based vegetation indices (VIs) explained 87%–90%, 87%–89% and 83%–84% variability of leaf area index (LAI), aboveground biomass (AGB) and plant N uptake (PNU), respectively. However, normalized difference vegetation index (NDVI) became saturated when LAI > 2 m2·m−2, AGB > 3 t·ha−1 or PNU > 80 kg·ha−1. The GreenSeeker-based VIs performed better for estimating LAI, AGB and PNU at V5–V6 and V7–V8 than the V9–V10 growth stages, but were very weakly related to plant N concentration. The response index calculated with GreenSeeker NDVI (RI–NDVI) and ratio vegetation index (R2 = 0.56–0.68) performed consistently better than the original VIs (R2 = 0.33–0.55) for estimating NNI. The N status diagnosis accuracy rate using RI–NDVI was 81% and 71% at V7–V8 and V9–V10 growth stages, respectively. We conclude that the response indices calculated with the GreenSeeker-based vegetation indices can be used to estimate spring maize NNI non-destructively and for in-season N status diagnosis between V7 and V10 growth stages under experimental conditions with variable N supplies. More studies are needed to further evaluate different approaches under diverse on-farm conditions and develop side-dressing N recommendation algorithms. Full article
(This article belongs to the Special Issue Remote Sensing in Precision Agriculture)
Show Figures

Graphical abstract

21 pages, 46461 KiB  
Article
Monitoring Urban Areas with Sentinel-2A Data: Application to the Update of the Copernicus High Resolution Layer Imperviousness Degree
by Antoine Lefebvre 1,*, Christophe Sannier 2,† and Thomas Corpetti 3,†
1 CNES, UMR 6074 IRISA, OBELIX Team, Vannes 56000, France
2 SIRS, Villeneuve d’Ascq 59650, France
3 CNRS, UMR 6554 LETG COSTEL, Rennes 35000, France
These authors contributed equally to this work.
Remote Sens. 2016, 8(7), 606; https://doi.org/10.3390/rs8070606 - 19 Jul 2016
Cited by 138 | Viewed by 22150
Abstract
Monitoring with high resolution land cover and especially of urban areas is a key task that is more and more required in a number of applications (urban planning, health monitoring, ecology, etc.). At the moment, some operational products, such as the “Copernicus High [...] Read more.
Monitoring with high resolution land cover and especially of urban areas is a key task that is more and more required in a number of applications (urban planning, health monitoring, ecology, etc.). At the moment, some operational products, such as the “Copernicus High Resolution Imperviousness Layer”, are available to assess this information, but the frequency of updates is still limited despite the fact that more and more very high resolution data are acquired. In particular, the recent launch of the Sentinel-2A satellite in June 2015 makes available data with a minimum spatial resolution of 10 m, 13 spectral bands, wide acquisition coverage and short time revisits, which opens a large scale of new applications. In this work, we propose to exploit the benefit of Sentinel-2 images to monitor urban areas and to update Copernicus Land services, in particular the High Resolution Layer imperviousness. The approach relies on independent image classification (using already available Landsat images and new Sentinel-2 images) that are fused using the Dempster–Shafer theory. Experiments are performed on two urban areas: a large European city, Prague, in the Czech Republic, and a mid-sized one, Rennes, in France. Results, validated with a Kappa index over 0.9, illustrate the great interest of Sentinel-2 in operational projects, such as Copernicus products, and since such an approach can be conducted on very large areas, such as the European or global scale. Though classification and data fusion are not new, our process is original in the way it optimally combines uncertainties issued from classifications to generate more confident and precise imperviousness maps. The choice of imperviousness comes from the fact that it is a typical application where research meets the needs of an operational production. Moreover, the methodology presented in this paper can be used in any other land cover classification task using regular acquisitions issued, for example, from Sentinel-2. Full article
Show Figures

Graphical abstract

19 pages, 11219 KiB  
Article
A Novel Successive Cancellation Method to Retrieve Sea Wave Components from Spatio-Temporal Remote Sensing Image Sequences
by Yanbo Wei 1, Jian-Kang Zhang 2,* and Zhizhong Lu 1
1 College of Automation, Harbin Engineering University, No. 145 Nantong Street, Harbin 150001, China
2 Department of Electrical and Computer Engineering, McMaster University, 1280 Main Street West, Hamilton, ON L8S 4K1, Canada
Remote Sens. 2016, 8(7), 607; https://doi.org/10.3390/rs8070607 - 20 Jul 2016
Cited by 18 | Viewed by 5246
Abstract
In this paper, we consider retrieving individual wave components in a multi-directional sea wave model. To solve this problem, a currently and commonly used method is three-dimensional discrete Fourier transform (3D DFT) on the radar image sequence. However, the uniform frequency and the [...] Read more.
In this paper, we consider retrieving individual wave components in a multi-directional sea wave model. To solve this problem, a currently and commonly used method is three-dimensional discrete Fourier transform (3D DFT) on the radar image sequence. However, the uniform frequency and the uniform wavenumber in a wavenumber frequency domain can not always strictly satisfy the dispersion relation, and the spectral leakage in both temporal and spatial domains exists due to the limited analysis area selected from an image sequence. As a result, the DFT method incurs undesirable error performance in retrieving directional wave components. By deeply investigating the data structure of the multi-directional sea wave model, we obtain a new and decomposable matrix representation for processing the wave components. Then, a novel successive cancellation method is proposed to efficiently and effectively extract individual wave components, whose frequency and wavenumber rigorously satisfy the liner dispersion relation. Thus, it avoids spectral leakage in the spatial domain. The algorithm is evaluated by using linear synthetic wave image sequences. The validity of the proposed novel algorithm is verified by comparing the retrieved parameters of amplitude, phase, and direction of the individual wave components with the simulated parameters as well as those obtained by using the 3D DFT method. In addition, the reconstructed sea field using the retrieved wave components is also compared with the simulated remote sensing images as well as those attained using the inverse 3D DFT method. All the simulation results demonstrate that our proposed algorithm is more effective and has better performance for retrieving individual wave components from the spatio-temporal remote sensing image sequences than the 3D DFT method. Full article
Show Figures

Graphical abstract

19 pages, 4016 KiB  
Article
Hydrological Utility and Uncertainty of Multi-Satellite Precipitation Products in the Mountainous Region of South Korea
by Jong Pil Kim 1, Il Won Jung 2,*, Kyung Won Park 2, Sun Kwon Yoon 2 and Donghee Lee 3
1 Disaster Information Research Division, National Disaster Management Research Institute, 365 Jongga-ro, Jung-gu, Ulsan 44538, Korea
2 Climate Research Department, APEC Climate Center (APCC), 12 Centum 7-ro, Haeundae-gu, Busan 48058, Korea
3 Chungcheong Regional Division, K-Water, 1571 2sunhwan-ro, Seowon-gu, Cheongju-si, Chungcheongbuk-do 28632, Korea
Remote Sens. 2016, 8(7), 608; https://doi.org/10.3390/rs8070608 - 21 Jul 2016
Cited by 42 | Viewed by 7505
Abstract
Satellite-derived precipitation can be a potential source of forcing data for assessing water availability and managing water supply in mountainous regions of East Asia. This study investigates the hydrological utility of satellite-derived precipitation and uncertainties attributed to error propagation of satellite products in [...] Read more.
Satellite-derived precipitation can be a potential source of forcing data for assessing water availability and managing water supply in mountainous regions of East Asia. This study investigates the hydrological utility of satellite-derived precipitation and uncertainties attributed to error propagation of satellite products in hydrological modeling. To this end, four satellite precipitation products (tropical rainfall measuring mission (TRMM) multi-satellite precipitation analysis (TMPA) version 6 (TMPAv6) and version 7 (TMPAv7), the global satellite mapping of precipitation (GSMaP), and the climate prediction center (CPC) morphing technique (CMORPH)) were integrated into a physically-based hydrologic model for the mountainous region of South Korea. The satellite precipitation products displayed different levels of accuracy when compared to the intra- and inter-annual variations of ground-gauged precipitation. As compared to the GSMaP and CMORPH products, superior performances were seen when the TMPA products were used within streamflow simulations. Significant dry (negative) biases in the GSMaP and CMORPH products led to large underestimates of streamflow during wet-summer seasons. Although the TMPA products displayed a good level of performance for hydrologic modeling, there were some over/underestimates of precipitation by satellites during the winter season that were induced by snow accumulation and snowmelt processes. These differences resulted in streamflow simulation uncertainties during the winter and spring seasons. This study highlights the crucial need to understand hydrological uncertainties from satellite-derived precipitation for improved water resource management and planning in mountainous basins. Furthermore, it is suggested that a reliable snowfall detection algorithm is necessary for the new global precipitation measurement (GPM) mission. Full article
Show Figures

Graphical abstract

22 pages, 3595 KiB  
Article
Airborne S-Band SAR for Forest Biophysical Retrieval in Temperate Mixed Forests of the UK
by Ramesh K. Ningthoujam 1,*, Heiko Balzter 1,2,†, Kevin Tansey 1,†, Keith Morrison 3, Sarah C.M. Johnson 1, France Gerard 4, Charles George 4, Yadvinder Malhi 5, Geoff Burbidge 6, Sam Doody 6, Nick Veck 7, Gary M. Llewellyn 8, Thomas Blythe 9, Pedro Rodriguez-Veiga 1,2, Sybrand Van Beijma 10, Bernard Spies 1, Chloe Barnes 1, Marc Padilla-Parellada 1, James E.M. Wheeler 1, Valentin Louis 1, Tom Potter 1, Alexander Edwards-Smith 3 and Jaime Polo Bermejo 11add Show full author list remove Hide full author list
1 Department of Geography, Centre for Landscape and Climate Research, University of Leicester, Leicester LE1 7RH, UK
2 National Centre for Earth Observation (NCEO), University of Leicester, Leicester LE1 7RH, UK
3 Radar Group, School of Cranfield Defence and Security, Cranfield University, Shrivenham, Swindon SN6 8LA, UK
4 Centre for Ecology & Hydrology, Wallingford OX10 8BB, UK
5 School of Geography and Environment, South Parks Road Oxford, University of Oxford, Oxford OX1 3QY, UK
6 Airbus Defence and Space—Space Systems, Anchorage Road, Portsmouth, Hampshire PO3 5PU, UK
7 Satellite Applications Catapult, Electron Building Fermi Avenue Harwell, Oxford Didcot, Oxfordshire OX11 0QR, UK
8 Natural Environment Research Council, Airborne Research & Survey Facility, Firfax Building, Meteor Business Park, Cheltenham Road East, Gloucester GL2 9QL, UK
9 Forestry Commission, Bristol and Savernake, Leigh Woods Office, Abbots Leigh Road, Bristol BS8 3QB, UK
10 Geo-Intelligence, Airbus Defence and Space, Compass House, 60 Priesley Road, Surrey Research Park, Guildford GU2 7AG, UK
11 Faculty of Civil Engineering and Geosciences Building, Delft University of Technology, 23 Stevinweg, Delft PO-box 5048, The Netherlands
These authors contributed equally to this work.
add Show full affiliation list remove Hide full affiliation list
Remote Sens. 2016, 8(7), 609; https://doi.org/10.3390/rs8070609 - 20 Jul 2016
Cited by 32 | Viewed by 12110
Abstract
Radar backscatter from forest canopies is related to forest cover, canopy structure and aboveground biomass (AGB). The S-band frequency (3.1–3.3 GHz) lies between the longer L-band (1–2 GHz) and the shorter C-band (5–6 GHz) and has been insufficiently studied for forest applications due [...] Read more.
Radar backscatter from forest canopies is related to forest cover, canopy structure and aboveground biomass (AGB). The S-band frequency (3.1–3.3 GHz) lies between the longer L-band (1–2 GHz) and the shorter C-band (5–6 GHz) and has been insufficiently studied for forest applications due to limited data availability. In anticipation of the British built NovaSAR-S satellite mission, this study evaluates the benefits of polarimetric S-band SAR for forest biophysical properties. To understand the scattering mechanisms in forest canopies at S-band the Michigan Microwave Canopy Scattering (MIMICS-I) radiative transfer model was used. S-band backscatter was found to have high sensitivity to the forest canopy characteristics across all polarisations and incidence angles. This sensitivity originates from ground/trunk interaction as the dominant scattering mechanism related to broadleaved species for co-polarised mode and specific incidence angles. The study was carried out in the temperate mixed forest at Savernake Forest and Wytham Woods in southern England, where airborne S-band SAR imagery and field data are available from the recent AirSAR campaign. Field data from the test sites revealed wide ranges of forest parameters, including average canopy height (6–23 m), diameter at breast-height (7–42 cm), basal area (0.2–56 m2/ha), stem density (20–350 trees/ha) and woody biomass density (31–520 t/ha). S-band backscatter-biomass relationships suggest increasing backscatter sensitivity to forest AGB with least error between 90.63 and 99.39 t/ha and coefficient of determination (r2) between 0.42 and 0.47 for the co-polarised channel at 0.25 ha resolution. The conclusion is that S-band SAR data such as from NovaSAR-S is suitable for monitoring forest aboveground biomass less than 100 t/ha at 25 m resolution in low to medium incidence angle range. Full article
(This article belongs to the Special Issue Remote Sensing of Vegetation Structure and Dynamics)
Show Figures

Graphical abstract

19 pages, 4944 KiB  
Article
Particle Filter Approach for Real-Time Estimation of Crop Phenological States Using Time Series of NDVI Images
by Caleb De Bernardis *, Fernando Vicente-Guijalba, Tomas Martinez-Marin and Juan M. Lopez-Sanchez *
Signal Systems and Telecommunication Group, Institute for Computing Research (IUII), University of Alicante, P.O. Box 99, E-03080 Alicante, Spain
Remote Sens. 2016, 8(7), 610; https://doi.org/10.3390/rs8070610 - 20 Jul 2016
Cited by 25 | Viewed by 7752
Abstract
Knowing the current phenological state of an agricultural crop is a powerful tool for precision farming applications. In the past, it has been estimated with remote sensing data by exploiting time series of Normalised Difference Vegetation Index (NDVI), but always at the end [...] Read more.
Knowing the current phenological state of an agricultural crop is a powerful tool for precision farming applications. In the past, it has been estimated with remote sensing data by exploiting time series of Normalised Difference Vegetation Index (NDVI), but always at the end of the campaign and only providing results for some key states. In this work, a new dynamical framework is proposed to provide real-time estimates in a continuous range of states, for which NDVI images are combined with a prediction model in an optimal way using a particle filter. The methodology is tested over a set of 8 to 13 rice parcels during 2008–2013, achieving a high determination factor R 2 = 0.93 ( n = 379 ) for the complete phenological range. This method is also used to predict the end of season date, obtaining a high accuracy with an anticipation of around 40–60 days. Among the key advantages of this approach, phenology is estimated each time a new observation is available, hence enabling the potential detection of anomalies in real-time during the cultivation. In addition, the estimation procedure is robust in the case of noisy observations, and it is not limited to a few phenological stages. Full article
(This article belongs to the Special Issue Remote Sensing of Vegetation Structure and Dynamics)
Show Figures

Graphical abstract

15 pages, 6942 KiB  
Article
Deriving Ice Motion Patterns in Mountainous Regions by Integrating the Intensity-Based Pixel-Tracking and Phase-Based D-InSAR and MAI Approaches: A Case Study of the Chongce Glacier
by Shiyong Yan 1, Zhixing Ruan 2, Guang Liu 2,*, Kazhong Deng 1, Mingyang Lv 2 and Zbigniew Perski 3
1 Jiangsu Key Laboratory of Resources and Environmental Engineering, School of Environment Science and Spatial Informatics, China University of Mining and Technology, Xuzhou 221116, China
2 Key Laboratory of Digital Earth Science, Institute of Remote Sensing and Digital Earth, Chinese Academy of Sciences, Beijing 100094, China
3 Polish Geological Institute—National Research Institute, Carpathian Branch, Cracow 31560, Poland
Remote Sens. 2016, 8(7), 611; https://doi.org/10.3390/rs8070611 - 22 Jul 2016
Cited by 21 | Viewed by 6167
Abstract
As a sensitive indicator of climate change, mountain glacier dynamics are of great concern, but the ice motion pattern of an entire glacier surface cannot be accurately and efficiently generated by the use of only phase-based or intensity-based methods with synthetic aperture radar [...] Read more.
As a sensitive indicator of climate change, mountain glacier dynamics are of great concern, but the ice motion pattern of an entire glacier surface cannot be accurately and efficiently generated by the use of only phase-based or intensity-based methods with synthetic aperture radar (SAR) imagery. To derive the ice movement of the whole glacier surface with a high accuracy, an integrated approach combining differential interferometric SAR (D-InSAR), multi-aperture interferometry (MAI), and a pixel-tracking (PT) method is proposed, which could fully exploit the phase and intensity information recorded by the SAR sensor. The Chongce Glacier surface flow field is estimated with the proposed integrated approach. Compared with the traditional SAR-based methods, the proposed approach can determine the ice motion over a widely varying range of ice velocities with a relatively high accuracy. Its capability is proved by the detailed ice displacement pattern with the average accuracy of 0.2 m covering the entire Chongce Glacier surface, which shows a maximum ice movement of 4.9 m over 46 days. Furthermore, it is shown that the ice is in a quiescent state in the downstream part of the glacier. Therefore, the integrated approach presented in this paper could present us with a novel way to comprehensively and accurately understand glacier dynamics by overcoming the incoherence phenomenon, and has great potential for glaciology study. Full article
(This article belongs to the Special Issue Remote Sensing in Tibet and Siberia)
Show Figures

Graphical abstract

24 pages, 10432 KiB  
Article
Radiometric Cross-Calibration of the Chilean Satellite FASat-C Using RapidEye and EO-1 Hyperion Data and a Simultaneous Nadir Overpass Approach
by Carolina Barrientos 1,2,*, Cristian Mattar 3, Theodoros Nakos 2,4 and Waldo Perez 2
1 Aerial Photogrammetric Service (SAF), Chile Air Force (FACH), Santiago, Chile. Av. Diego Barros Ortiz 2300, AMB, Pudahuel, Santiago 9020000, Chile
2 School of Forestry Engineering, Faculty of Sciences, Mayor University, Camino La Pirámide 5750, Huechuraba, Santiago 8580745, Chile
3 Laboratory for Analysis of the Biosphere (LAB), University of Chile, Avenida Santa Rosa 11315, La Pintana, Santiago 8820808, Chile
4 Crux Technologies, Ricardo Lyon 1317, of. 92, Providencia, Santiago 7510575, Chile
Remote Sens. 2016, 8(7), 612; https://doi.org/10.3390/rs8070612 - 21 Jul 2016
Cited by 10 | Viewed by 9490
Abstract
The absolute radiometric calibration of a satellite sensor is the critical factor that ensures the usefulness of the acquired data for quantitative applications on remote sensing. This work presents the results of the first cross-calibration of the sensor on board the Sistema Satelital [...] Read more.
The absolute radiometric calibration of a satellite sensor is the critical factor that ensures the usefulness of the acquired data for quantitative applications on remote sensing. This work presents the results of the first cross-calibration of the sensor on board the Sistema Satelital de Observación de la Tierra (SSOT) Chilean satellite or Air Force Satellite FASat-C. RapidEye-MSI was chosen as the reference sensor, and a simultaneous Nadir Overpass Approach (SNO) was applied. The biases caused by differences in the spectral responses of both instruments were compensated through an adjustment factor derived from EO-1 Hyperion data. Through this method, the variations affecting the radiometric response of New AstroSat Optical Modular Instrument (NAOMI-1), have been corrected based on collections over the Frenchman Flat calibration site. The results of a preliminary evaluation of the pre-flight and updated coefficients have shown a significant improvement in the accuracy of at-sensor radiances and TOA reflectances: an average agreement of 2.63% (RMSE) was achieved for the multispectral bands of both instruments. This research will provide a basis for the continuity of calibration and validation tasks of future Chilean space missions. Full article
Show Figures

Graphical abstract

Previous Issue
Next Issue
Back to TopTop