Skip to Content

Metrology

Metrology is an international, peer-reviewed, open access journal on the science and technology of measurement and metrology, published quarterly online by MDPI.

Get Alerted

Add your email address to receive forthcoming issues of this journal.

All Articles (255)

  • Article
  • Open Access

Metrological Characterisation of Movella DOT Wearable Sensors for Measuring Induced and Transmitted Vibrations

  • Chiara Martina,
  • Abdelrahman Mohamed Ragab M. Ahmed and
  • Diego Scaccabarozzi

The research focuses on the dynamic calibration of off-the-shelf inertial measurement unit (IMU) triaxial accelerometers, sensors generally used for kinematic analyses in sport and biomedical engineering. The assessment of Xsens Movella DOT sensors’ performance, reliability, and limitations is presented, providing a metrological basis for their application in wearable monitoring systems. The metrological characterisation was performed to quantify the sensors’ dynamic response, their bandwidth, and measurement repeatability and reproducibility within the range of interest. Three units from the same batch were tested along three orthogonal axes under controlled excitation conditions, using a laser Doppler vibrometer as reference. The experimental protocol included harmonic excitations in the 10–45 Hz range, harmonic excitation up to 130 Hz to quantify limitations and potential errors of the sensors when measuring signals out of the nominal bandwidth, and random excitation, limited in the frequency range up to about 40 Hz, to validate their applicability in a generic dynamic environment. Thus, the acquired signals were analysed in both the time and frequency domains: in particular, the Frequency Response Function (FRF) between the IMU accelerometers and the reference system was measured, along all three measurement directions, and the corresponding Power Spectral Densities (PSDs) were computed. A numerical optimisation procedure was then applied to model the acquired FRF, providing an estimation of the FRF complex function, allowing for correction in general dynamic applications. One major result was that dynamic compensation is mandatory within the nominal bandwidth, given the attenuation of the measured amplitude of about 25% at the maximum frequency of the bandwidth; moreover, aliasing error occurs if the excitation frequency is above the Nyquist frequency, introducing frequency-dependent errors and misleading results. Thus, the proposed methodology and correction model, together with the highlighted instrumental effects, allow for accurate acceleration measurements by using the tested Xsens Movella DOT sensors (Xsens, Enschede, The Netherlands) in an induced and transmitted vibration scenario, although the defined methodology can be more generally extended to similar devices and instruments, aiming for proper dynamic characterisation.

Metrology

22 September 2026

The mechanical interface and sensing devices are mounted on the electrodynamic shaker, controlled via a piezoelectric accelerometer. The laser beam is aligned vertically with the Movella DOT sensor. The local reference frame (orange colour) and vertical excitation axis (yellow colour) are shown for: (a) Movella DOT x-direction testing, and (b) Movella DOT z-direction testing.
  • Article
  • Open Access

We report the development of the first optical frequency comb (OFC) based on an in-house Ti:Sa femtosecond laser in Argentina, implemented at the National Metrology Institute (INTI). The system operates at a 1 GHz repetition rate with a broadband spectrum spanning from 500 to 1100 nm. The carrier-envelope offset frequency and the repetition rate are both phase-locked to a cesium atomic clock, establishing a direct link between the national frequency standard and the optical domain. This development represents a major step forward for national metrology and enables frequency-instability measurements of stable lasers within the country. To demonstrate its capabilities, the performance of a Nd:YAG Mephisto laser at 1064 nm was evaluated by measuring the beat note between its second harmonic and the OFC, allowing a direct assessment of its frequency noise and stability.

Metrology

22 September 2026

(a) General schematic of the optical setup of the optical frequency comb. The core of the system is a Kerr-lens mode-locked Ti:Sa oscillator pumped at 532 nm, with a 1 GHz repetition rate and pulses of 30 fs. To extend the spectrum to an octave span, the output is pre-compensated with a pair of chirped mirrors and focused into a photonic crystal fiber (PCF) through a 20X microscope objective. (b) shows the optical spectra before and after supercontinuum generation, spanning from 500 nm to 1100 nm and covering a full octave, recorded with an optical spectrum analyzer (OSA) at a resolution of 0.05 nm. Together with the supercontinuum, several clock transitions in the optical domain and the Nd:YAG laser emission line are indicated for reference.
  • Article
  • Open Access

The reconstruction of structural deformation fields from sparse or indirect measurements represents a key challenge in structural health monitoring, particularly for real-time applications involving lightweight mechanical components. In linear elastic systems, any deformation state can be represented as a linear combination of structural mode shapes through modal superposition. Exploiting this property, the present work proposes a machine learning-based framework for the real-time reconstruction of the deflection field of an aluminium plate subjected to the impingement of a non-stationary water flow. The methodology combines modal superposition with a supervised Random Forest classifier trained on a database of known deformation states generated from a finite element model. For each deformation state, the retained modes are selected through a novel linear-regression-based criterion, in which the optimal modal subset is identified by simultaneously promoting a unit regression slope, a vanishing intercept, and a Pearson correlation coefficient close to unity between the reconstructed and reference deflection fields. The proposed strategy is compared with the previously developed Internal Strain Potential Energy Criterion (ISPEC), providing a direct comparison between an energy-based and a reconstruction-oriented mode selection approach. Experimental deflections are acquired through a vision-based displacement tracking system. Seven measurement points, located close to the clamped boundary and therefore far from the fluid excitation, are used as input to the reconstruction algorithm, whereas additional markers positioned closer to the fluid-loaded region are retained exclusively for validation, providing a more demanding assessment of the methodology. The classifier identifies the active modes from the measured deflection pattern, while the full-field structural response is recovered through modal superposition. Experimental validation demonstrates that the proposed regression-based approach consistently improves the reconstruction accuracy with respect to ISPEC. At the most demanding validation point, located closest to the fluid excitation, the mean reconstruction error is approximately 1.65mm for deflection amplitudes reaching 25mm, corresponding to an NRMSE of 10.60%, compared with 14.74% obtained using ISPEC, representing a reduction of 28.1%. Despite this improvement, the average computation time remains below 0.3ms, confirming the suitability of the proposed framework for real-time applications. These results demonstrate that the proposed methodology provides an accurate, computationally efficient, and robust solution for real-time full-field deformation estimation from sparse non-contact optical measurements.

Metrology

19 September 2026

General overview of the water tunnel facility, showing the test section, the aluminium plate, and the optical acquisition system.
  • Article
  • Open Access

Detecting tool wear in CNC milling is a central challenge for data analytics and sensor integration in Industry 4.0, as gradual degradation increases the risk of tool breakage and downtime and often leads manufacturers to replace tools early and inefficiently. This contribution reviews existing tool wear detection approaches, including machine control data and additional sensors, and addresses the resulting need for effective data reduction and interpretation. An experimental setup on a CNC milling machine collected OPC-UA data and vibration signals, processed via a KNIME-based pipeline. Results show that, in the investigated proof-of-concept experiments, simple aggregated indicators (e.g., power consumption) allow a clear distinction between new-tool and end-of-life (EoL) states under stable process conditions. However, when cutting parameters vary, the evaluated conventional machine-learning classifiers do not achieve satisfactory discrimination. This limitation is associated with parameter-induced signal overlap, the limited training dataset, and the deliberately simple time-domain features used in this study. The study is therefore intended as an exploratory proof-of-concept rather than a comprehensive validation of continuous tool wear progression. Finally, the contribution highlights the potential of generative AI for data preprocessing, showing that large language models can efficiently clean, structure, and interpret raw manufacturing data, reducing engineering effort and improving accessibility of data analytics. The findings provide a feasibility baseline for future studies addressing intermediate wear states, richer feature extraction, and broader industrial validation.

Metrology

15 September 2026

Raw data coming from the CNC (lines prefixed with '#' represent InfluxDB CSV metadata headers).

Featured Articles of Last Quarter

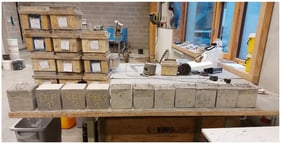
All of the concrete blocks that were prepared using the molds shown on the left.
Detailed architecture of the experimental setup. (a) Functional schematic illustrating the interconnection between the thermostatic bath, the Pt-100 reference standards, and the sensor batch. (b) Electronic interface diagram of the Arduino-DS18B20 configuration: the setup of dedicated digital pins (D2–D9) and independent pull-up resistors (4.7 kΩ) is detailed. This design ensures signal integrity and fault isolation, preventing systematic anomalies (such as that observed in Sensor 8) from affecting the remainder of the batch. Cabling lengths of less than 1 m ensure electrical stability and signal clarity against capacitive effects. Furthermore, the integration with the control computer is shown; it simultaneously manages data acquisition and the circuit’s power supply, thereby ensuring full process traceability.

Highly Accessed Articles

News & Conferences

Latest Issues

Open for Submission

Journal Sections

Advancements in Optical Measurement Devices and Technologies
Reprint

Advancements in Optical Measurement Devices and Technologies

Editors: Michele Norgia, Rahul Kumar
Measurement Uncertainty
Reprint

Measurement Uncertainty

Editors: Simona Salicone
XFacebookLinkedIn
Metrology - ISSN 2673-8244