Abstract
The growing demand for automated production systems is driving continuous innovation in smart and data-driven manufacturing technologies. In the field of production metrology, the trend is shifting from using measurement laboratories to integrating measurement systems directly into production processes. This has led the Institute of Manufacturing Technology at TU Vienna together with its partners to develop a roughness measurement device that can be directly integrated into machine tools. Building on this foundation, this study tries to find applications beyond mere surface roughness assessment and demonstrates how the device could be applied in broader contexts of manufacturing process monitoring. By linking surface measurements with tool wear monitoring, the study establishes a correlation between surface roughness and wear progression of indexable inserts in milling. It demonstrates how in situ data can support predictive maintenance and the real-time adjustment of cutting parameters. This represents a first step toward integrating in situ metrology into closed-loop control in machining. The experimental setup followed ISO 8688-1 guidelines for tool life testing. Indexable inserts were operated throughout their entire service life while surface roughness was continuously recorded. In parallel, cutting edge conditions were documented at defined intervals using focus variation microscopy. The results show a consistent three-phase pattern: initially stable roughness, followed by a steady increase due to flank wear, and an abrupt decrease in roughness linked to edge chipping. These findings confirm the potential of integrated roughness measurement for condition-based monitoring and the development of adaptive machining strategies.
1. Introduction
The ongoing advancement of automation in the manufacturing industry is a crucial factor in the competitiveness and productivity of companies. Over the past decades, numerous industrial production processes have evolved from manual operations to highly automated workflows. Modern technologies enable more efficient and flexible manufacturing, meeting both increasing quality demands and global competitive pressures. In particular, in Europe, the shortage of skilled labor intensifies the need to optimize production processes through automation, reducing dependence on manual labor. Continuous communication between systems allows for real-time monitoring and automatic adaptation to changing conditions. This not only leads to more efficient production, but also improves quality assurance and reduces costs [1,2].
Despite advances in automation technology, a considerable proportion of manufacturing processes still rely on manual operations. A particularly relevant example is surface roughness measurement, which is critical for various industries such as aerospace, medical technology, and automotive manufacturing [3]. Traditionally, roughness measurement is performed using tactile or optical devices, either directly in the production environment with handheld devices or in separate measurement rooms or laboratories. Both approaches require manual interventions and interrupt the production process, leading to time losses and potential quality issues [4]. To address these challenges, an automated roughness measurement system has been developed in cooperation between the Technical University of Vienna and Mahr Group, which can be directly integrated into a CNC machine tool like any other tool. This solution enables fully automated roughness measurement during the manufacturing process, seamlessly incorporating quality assurance into production. Thus, roughness measurement can be integrated into the NC code, allowing continuous automated monitoring [4].
Initial tests have shown that the integrated roughness measurement system achieves an accuracy comparable to laboratory measurements [4]. The system can already be used for in-process quality assurance, but its full potential, particularly to use the now available continuous data, has not yet been fully realized. The ability to continuously measure roughness values across an entire batch opens up new possibilities. Trends can be analyzed, and with the use of appropriate model-based experience data, insights into the production status can be gained. A particularly promising approach is the development of models that correlate surface roughness with tool wear. By analyzing the temporal evolution of the roughness parameters, conclusions about the wear of the tool could be drawn. This would enable manufacturers to maximize tool life and further optimize production processes by dynamically adjusting machining parameters, like feed rate, responding to real-time quality data.
This study focuses on evaluating the feasibility of using roughness data for tool wear monitoring, finding a possible correlation, and exploring applications of the integrated measurement system in industrial settings. This research aims to contribute to this development by collecting and analyzing datasets to support model building and validation. To achieve this, experimental setups have been designed, tested, and conducted. The plausibility of the results will be examined and analyzed to ensure the validity and reliability of the findings.
2. Materials and Methods
To achieve the objective of the study, an experiment was developed in which indexable inserts were used in face milling operations throughout their usable lifespan, while continuously monitoring the surface roughness of the machined workpiece. In addition, the cutting edges of the milling cutter will be analyzed at regular intervals using a focus variation microscope to obtain additional information about the wear condition and the type of tool wear. This approach allows for tracking the development of surface quality over time and puts it in relation to the wear of the milling tool.
The milling experiments conducted in this study are based on the guidelines outlined in ISO 8688-1 “Tool life testing in milling” [5]. ISO 8688-1 also provides a detailed description of the procedure for determining the tool life of a milling cutter. In this study, modifications are made only to the cutting parameters to align the experimental conditions with typical industrial practices, as presented in Table 1. Before the final test setup was ready, several potential sources of error were eliminated through preliminary trials, as described in Section 2.6. According to ISO 8688-1 an indexable insert is considered fully worn when the maximum flank wear (VBmax) reaches at least 350 µm [5]. At this stage, tool performance degrades significantly, compromising both machining quality and process stability. The tool-life criteria will generally be reached before a total malfunction of the cutting tool occurs.

Table 1.
Parameters for milling.
2.1. Process Flow of the Experiments
Wear tests are conducted using a 63mm milling head and indexable inserts, as specified in Section 2.5. Each wear cycle consists of a milling process followed by three surface roughness measurements on the machined workpiece (left, middle, right). The workpiece consists of a steel block with dimensions of 300 × 35 mm, as specified in Section 2.4. The entire test was repeated three times to assess reproducibility. Each test was aborted when the criterion of 350 µm of flank wear was detected using the Focus Variation Microscope, as described in Section 2.3. This corresponded to a cycle count of 120 for all three tests, with each cycle taking a total of 7 min and 43 s. The milling experiments were conducted using a DMU 75 mono-Block machine equipped with a FANUC NC control system [6]. The net testing time is 46.3 h, not including all pre-tests, setup, teardown, and other preparations. For experiments involving such time scales, it was essential to automate the testing procedure through the implementation of NC code. This allows for an efficient and consistent execution of the tests, minimizes manual interventions, and reduces potential sources of error arising from human operation. Automation significantly contributed to enhancing process stability and improving data accuracy. The flowchart in Figure 1 schematically illustrates the process flow for a complete run-through for the lifecycle test of an indexable insert.
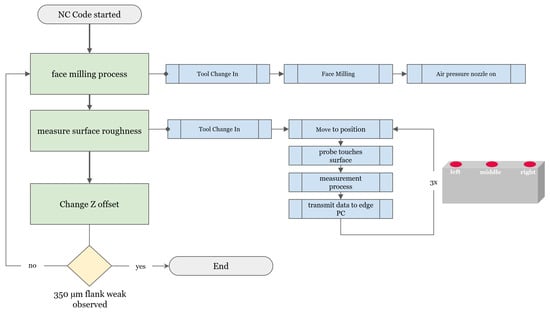
Figure 1.
Schematic representation of the experimental procedure.
2.2. In Situ Roughness Measuring Device
The integrated roughness measuring system is a prototype developed by the Technical University of Vienna and Mahr [4]. It is mounted on a tool holder that can be swapped depending on the machine’s requirements. Figure 2 shows the CAD model of the machine tool-integrated roughness measurement system with a HSK tool holder.
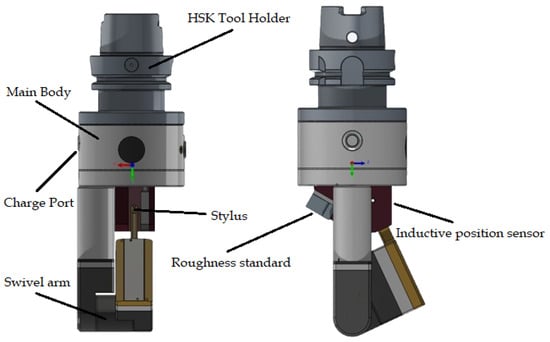
Figure 2.
CAD rendering of the integrated roughness measurement device mounted on an HSK tool holder.
The developed in situ roughness measuring system is a tactile, skidless probe device, complying with ISO 3274 [7], ISO 21920-1 [8], and ISO 5436-1 [9], as confirmed in the previous study [4]. It is mounted in a standard tool holder and can be automatically exchanged via the machine’s tool changer. The device operates wirelessly, with an internal battery and Bluetooth data transmission. The system achieves standard-compliant roughness measurements (Ra, Rz, etc.) with an uncertainty of 0.5% and a measuring range up to 2 mm. The maximum measuring length is 15 mm, with traverse speeds between 0.1 and 2 mm/s and a stylus radius of 2 µm. Tests confirmed a resolution sufficient to measure surface roughness down to Rz = 0.04 µm under stable conditions [4].
The device consists of a main body, in which the circuit board, including the electronics, the Bluetooth module, and the battery are integrated. It features a swivel arm that can be electrically controlled, allowing it to adjust the arm’s position flexibly based on the application. This enables measurements not only for exterior surfaces, but also for difficult-to-reach places such as boreholes. For referencing the arm’s position, the measuring device is equipped with an inductive position sensor. A roughness standard is mounted on the backside of the system. By measuring against this standard, the device can autonomously calibrate itself. The measuring device itself is a skidless system, which distinguishes it from conventional skidded probe systems. This approach allows for the accurate measurement of form deviations and waviness, features that are not measurable with skidded probe systems, as these systems rely on a reference skid that filters out low-frequency deviations and waviness, limiting their ability to capture the full surface profile [10].
The entire control and data transmission of the measuring device can be operated via NC code on the machine tool. An OPC UA server connects the machine tool to the edge PC, while Bluetooth connectivity is utilized between the roughness measuring device and the edge PC. The OPC UA standard is providing a standardized interface for data exchange in industrial automation [11]. Through this setup, larger amounts of measurement data can be transmitted, allowing the entire roughness profiles to be transmitted to the edge PC instead of just the roughness parameters.
2.3. Tool Wear Analysis
To gain clear insights into the tool wear conditions of the indexable inserts throughout the experiments, focus variation microscopy was used, also known as Infinite Focus Microscopes (IFM). Specifically, an Alicona InfiniteFocus G5 microscope was utilized. For the purposes of this study, a 5× objective was applied, providing a lateral resolution of 1 µm and a vertical resolution of 4 µm. Compared to conventional 3D scanners, the Alicona system was chosen because it allows for significantly higher accuracy in capturing fine surface details of cutting tools. This microscope relies on the use of a very fine depth of field in its optical system. It scans the surface along the Z-axis, continuously taking pictures. The sharpness at each point is analyzed, and the point with the highest sharpness corresponds to the exact height of that surface point. By combining the sharpness data from all images, a detailed 3D model of the indexable insert can be created [12]. The measurements can be visualized and analyzed, using software like Alicona MeasureSuite 5.3.9 as seen in Figure 3.
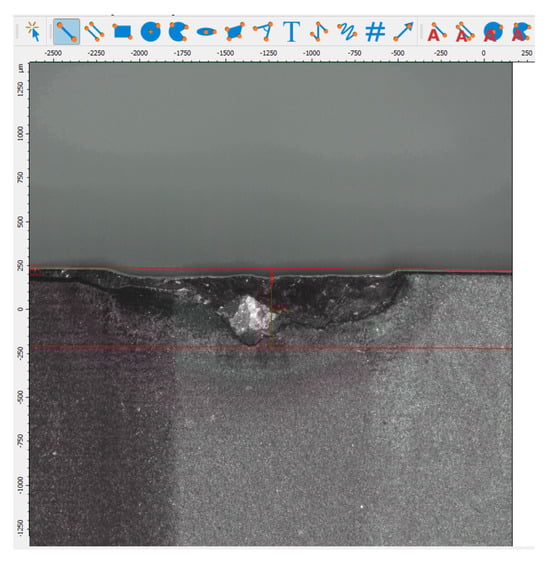
Figure 3.
Measurement of the indexable insert from an Alicona G5 scan in the MeasureSuite software.
2.4. Workpiece
For the experiments, a steel alloy called Buderus Plastic Mould Steel 2312 (40 CrMnMoS 8-6) was used as the workpiece material [13]. This alloy exhibits a moderate to high hardness, with a Brinell hardness value of 280-325 HB. The choice of a slightly harder material leads to accelerated tool wear, which reduces material consumption during the wear testing process. At the same time, this steel has a relatively high sulfur content of 0.07%, which significantly improves machinability and makes the machining properties comparable to industrial standards [14]. The dimensions of the workpiece were 300 × 35 mm (length × width) and were prepared specifically for the experiments. Figure 4 shows the workpiece used in the study, during the milling process (left), and during the measurement phase (right).
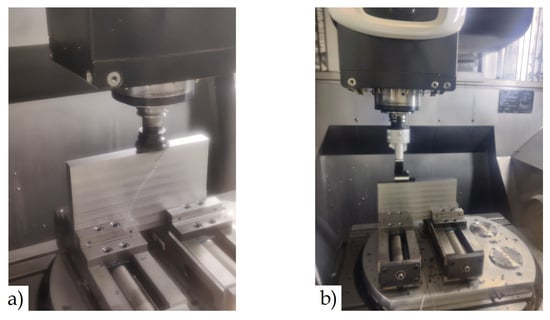
Figure 4.
Workpiece during running experiments: (a) left image shows the face milling process; (b) right image shows the measurement process.
2.5. Machining Tools
The milling head used for face milling is designated as Walter M3024-063-B22-06-04 (Walter Austria GmbH, Vienna, Austria), with a diameter of 63 mm and equippable with six cutting edges [15]. The indexable inserts used are called Walter XNGU0705ANN-F57 WSM35G (Walter Austria GmbH, Vienna, Austria). The technical details of the insert are available in the product specifications [16]. Although the milling head is designed to hold six indexable inserts at a time, only one insert was used at a time during the experiments. Simultaneously, the cutting parameters were reduced so that the load per cutting edge corresponds to that of a fully populated milling head. This approach ensures that the load on the indexable insert remains the same, while the material consumption can be reduced to one-sixth.
Milling Parameters
The decision on the machining parameters is critical to ensuring an efficient experiment by intentionally inducing high wear on the indexable insert while simultaneously maintaining stable, industry-like conditions. When it comes to tool wear, there are different mechanisms that can contribute to the degradation of cutting tools, each with its own characteristics. The typical types of tool wear are as follows [5]:
- Flank wear: This occurs on the relief face of the cutting tool and is one of the most prevalent types of wear.
- Crater wear: This type of wear forms on the rake face of the cutting tool, creating a concave depression.
- Cutting edge breakage: This involves the chipping or fracturing of the cutting edge, which can significantly impact tool performance.
- Notch wear: This occurs at the depth-of-cut line, where the tool enters or exits the workpiece.
- Thermal cracks: These are caused by rapid heating and cooling cycles during intermittent cutting operations.
- Plastic deformation: This happens when the cutting edge deforms under high temperatures and pressures.
The wear type can vary mainly depending on three factors [17]:
- The material that is being machined.
- Cooling and lubrication conditions.
- Cutting parameters (cutting speed, feed rate, depth of cut).
Cutting fluids help dissipate heat generated by mechanical stress and provide lubrication, thereby significantly influencing tool wear [18]. In our experiments, we deliberately exclude the use of cutting fluids, as suggested in the Norm ISO 8688-1 “Tool life testing in milling”. The rationale behind this is that the use of cutting fluids introduces another variable, complicating the comparison of different wear tests. Additionally, the use of cutting fluids would likely slow down tool wear. Without cutting fluids, the effects on the surface roughness of the workpiece should become observable more quickly and distinctly. We focused on setting our parameters to achieve flank wear as the primary wear type, as it is the dominant one in the industry [19]. Since the material has already been determined, the tool wear type can be controlled by defining the machining parameters. For this purpose, initial pre-tests were conducted to find the optimal cutting parameters for these experiments, which are presented in the shown table.
2.6. Experimental Challenges and Solutions
In the process of defining a precise experimental procedure, several challenges had to be addressed during the test runs. Ultimately, a final experimental protocol was successfully defined, as detailed in Section 2.1.
2.6.1. Residues from the Cutting Process
In addition to thermal effects and its impact on tool wear, cutting fluids facilitate the removal of metal dust and chips produced during machining [18]. A disadvantage of excluding cutting fluids is that chips are not effectively removed. If residues from the cutting process remain on the surface, they interfere with roughness measurements. The measurement profile, depicted in Figure 5, showing a tactile probe encountering a dust particle, illustrates how this can affect the accuracy and reliability of the data and complicate the analysis of roughness values.
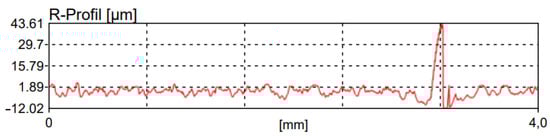
Figure 5.
Measured profile of the roughness measurement device with disturbance caused by chip residues on the surface.
To monitor the influence of chip residues, often in the form of metal dust, the ratio between the roughness parameters Rt and Ra was analyzed. The roughness parameter Rt represents the total height of the roughness profile, measured from the highest peak to the deepest valley over a specific evaluation length [18]. With reaching a certain level the influence of a residuum particle is likely, as shown in Figure 5. The issue of metal dust and chips on the workpiece surface could be addressed by activating the spindle’s air pressure nozzle, which moves slowly over the surface in repeated passes, effectively blowing the chip residues off after every milling process.
2.6.2. Back Cutting Effect
After each milling operation, three roughness measurements were conducted at three different points on the workpiece (left, middle, and right). This was done to control the reliability of the measurements by analyzing the deviations of the values on the same surface. The measurements points left and middle followed a largely parallel pattern. As highlighted in the yellow-marked area of Figure 6, deviations were observed at the last measurement point (right), while the other two points (left and middle) continued to deliver very similar values. The reason for the deviations at the right measurement point was in the tool run-out zone. When the counterforce exerted by the workpiece on the cutter ceases, the “back cutting” effect can occur. The “back cutting” effect is a phenomenon that occurs during milling when the cutting tool engages the workpiece in the opposite direction of the feed movement. When the back cutting effect occurs, it can be directly observed by the presence of double milling marks on the workpiece. The occurrence of the back cutting effect can be visually identified by the presence of additional milling marks on the workpiece [20].
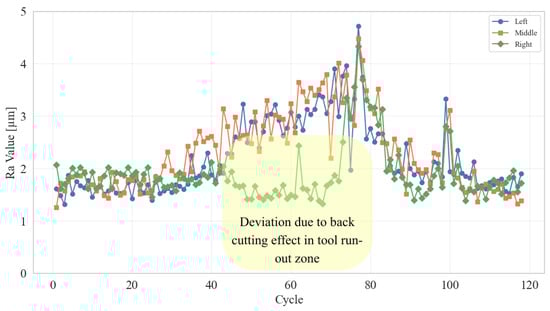
Figure 6.
Evolution of Ra values: Comparison of the three measurement points (left, middle, right). Notable back cutting effect observed at the right measurement point.
Since the values from measurement points left and center followed a parallel pattern and were not affected by the back cutting effect, the decision was made to use only these two for evaluation. In future experiments, it would be advisable to position the measurement points slightly more towards the center of the workpiece to avoid the tool run-out zone.
3. Results
Since the roughness measurements are stored as full-profile raw data, the first step involved calculating various roughness parameters from the profiles, such as Ra, Rz, and others, following the ISO 21920 [21]. This is necessary to facilitate the comparability of the measurements. The following analysis is presented using the Ra value, as it is the most commonly used and, in our case, best captured the trend, although other roughness parameters, like Rz, exhibited similar patterns. As already mentioned, the experiment was repeated three times. In the subsequent analysis, reference will be made to Indexable Insert 1 (II1), II2, and II3.
3.1. Evolution of the Surface Roughness
Figure 6 illustrates the progression of surface roughness (Ra) throughout the entire service life of II1 on all measurement points. In the following sections, the progression of the indexable inserts II1, II2, and II3 is compared and analyzed. The progression can be divided into three regimes.
At the initial stage of their use, II1, II2 and II3 can deliver consistent roughness values. During the initial ≈30 milling cycles, the Ra values show no change in surface quality for all tests, as shown in Figure 7. The produced surface quality remains constant at approximately .
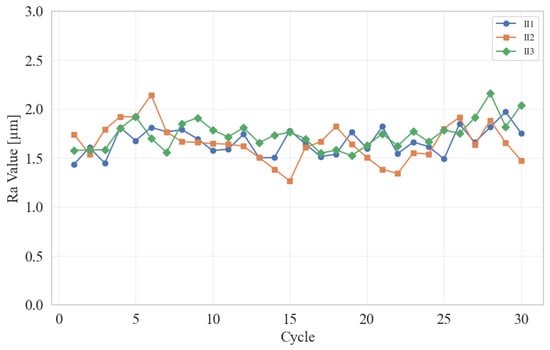
Figure 7.
Measured surface roughness from cycle 0 to 30. Comparison of all three indexable inserts.
After about ≈30 cycles, wear on the indexable inserts begins to manifest its effects, and the roughness values increase continuously and linearly, as shown in Figure 8. As the wear on the inserts progresses, the surfaces become increasingly rough. In this case, the Ra value increases by approximately 0.25 µm every 10 cycles.
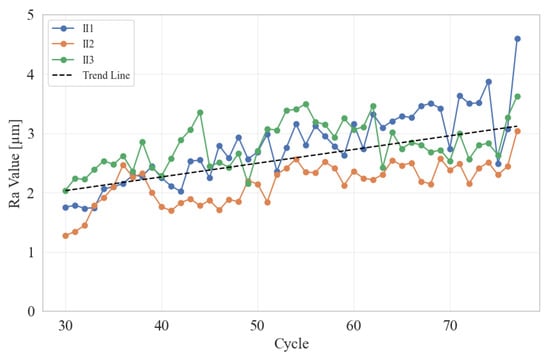
Figure 8.
Measured surface roughness from cycle 30 to 80. Comparison of all three indexable inserts. Trend Line indicates an increase in roughness.
At a specific turning point, a rapid decline in surface roughness values occurs, which persists until the end of the experiment. This phenomenon was reproducibly observed across all indexable inserts, although at varying cycle counts. While II1 reached its peak at 78 cycles, II2 and II3 started decreasing at 90 and 96 cycles, as presented in Figure 9.
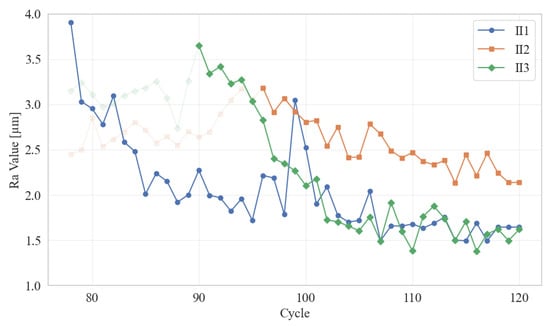
Figure 9.
Measured surface roughness at the end of the life cycle of the indexable inserts.
To gain an understanding of the underlying factors influencing surface roughness trends, it is crucial to examine the wear states of the indexable inserts at different points in time.
3.2. Tool Wear
To analyze the indexable inserts, they were examined after different cycle counts using the focus variation microscope [12]. The different states of wear for the indexable insert, exemplarily shown with the example of II2, can be observed in Figure 10.
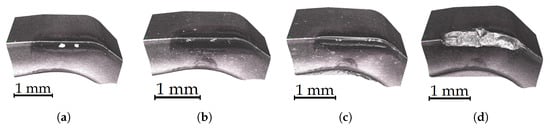
Figure 10.
Images of an indexable insert using focus variation microscopy (Alicona G5) throughout the experiment: (a) after 20 cycles; (b) after 40 cycles; (c) after 90 cycles; (d) after 120 cycles.
After the 20 and 40 cycles (Figure 10a,b), only a darkening of the cutting edge is visible. Although the coating on the indexable insert is gradually being removed, no significant flank wear (VB) is measurable at this stage. The white spots on the cutting edge are measurement artifacts caused by light reflection and do not represent wear. After 90 cycles (Figure 10c), forms of wear on the cutting edge become apparent. A crater depth of 17.48 µm and a flank wear VB of 82.81 µm were measured. After cycle 120, the cutting edge was re-examined for wear (Figure 10d). At this point, the cutting edge had fractured, and a flank wear of 455 µm was recorded. The termination criterion of VBmax = 350 µm was exceeded, and the test series was consequently declared complete.
3.3. Correlation Tool Wear and Roughness Values
In Figure 11, the measurements of the indexable insert are plotted alongside the progression of roughness values to analyze potential correlations. After 20 cycles, no measurable wear is detected on the indexable insert. This is reflected in the consistent roughness values. A possible explanation for this stability could be the high durability of the coatings on the indexable inserts. Starting from around 30 cycles, a slow increase in roughness values becomes apparent, potentially indicating that the coating on the cutting edges has been worn away. Between cycle 40 and 90, significant wear in the form of abrasion is observed, corresponding to a noticeable increase in surface roughness values by approximately 65%. At 96 cycles, it appears that a fracture of the cutting edge occurs, leading to a rounding of the cutting edge radius. This rounding improves surface quality and is assumed to result from the larger cutting edge radius touching more material per engagement, effectively ’smoothing’ the surface. This also results in increased cutting forces and uncontrolled rises in local temperatures, which can jeopardize safe machining operations. Additionally, the precision achievable by the milling tool is adversely affected. The risk of catastrophic failure is elevated at this stage of tool wear. The likelihood of sudden total tool fracture, potentially resulting in damage to both the workpiece and the machine.
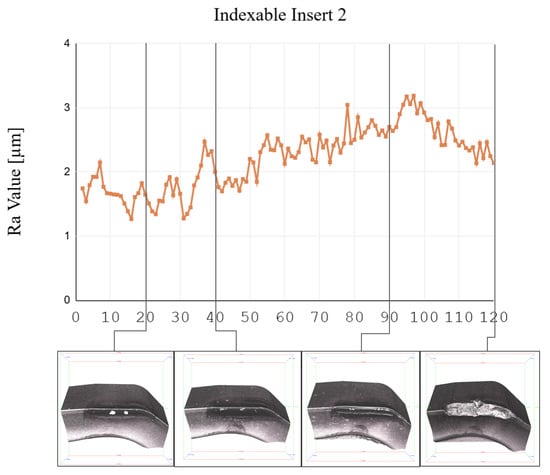
Figure 11.
Full evolution of surface roughness measurements, with corresponding images of the worn indexable insert (II2) assigned to the respective cycle numbers.
When examining II1 (see Figure 12), a qualitatively similar trend and comparable observations regarding tool wear can be identified, even though the peak was reached at cycle 78, compared to II2’s 90. II1 is also capable of maintaining a consistent surface quality for the first 30 cycles. The coating of the indexable insert appears to remain intact, with minimal observable changes to the insert itself. In the range of 30 to approximately 76 cycles, wear on the insert becomes evident, primarily measurable through flank wear. After cycle 76, fractures appear to recur, once again resulting in a smoothed surface.
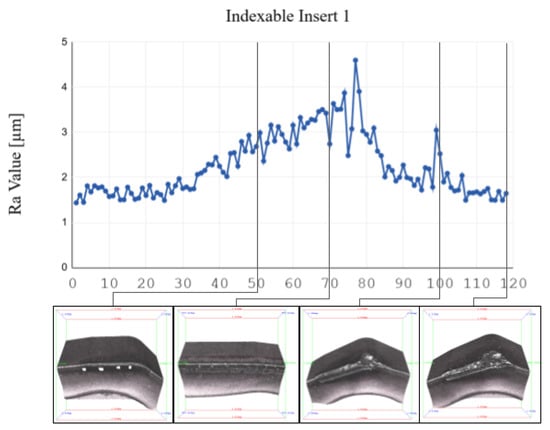
Figure 12.
Full evolution of surface roughness measurements, with corresponding images of the worn indexable insert (II1) assigned to the respective cycle numbers.
II3 showed a trend similar to that of II1 and II2, with consistent roughness followed by gradual wear and an increase in roughness after a certain point, reflecting the general pattern observed in the other inserts.
3.4. Key Findings
The tool life tests conducted in this study provide insights into the correlation between tool wear and surface roughness during milling. By centering the trends of the three experiments around their points of fracturing and applying a moving average filter, the resulting curve, as shown in Figure 13, can be obtained.
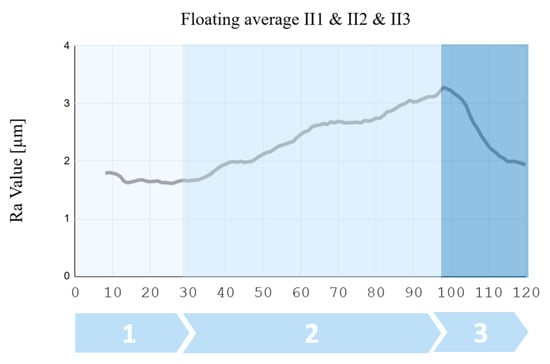
Figure 13.
Floating average of all three tests (II1, II2, and II3), segmented into three distinct areas.
This curve reflects the observed evolution of surface roughness during milling with these types of indexable inserts throughout their service life. While the results are specific to the present setup, it is reasonable to assume that they reflect general tendencies for comparable tools operating under similar conditions. As shown in Section 3.1, the curve can be divided into three regimes:
- Constant roughness values.
- A continuous increase of surface roughness.
- Subsequent rapid improvement in roughness values.
Upon examination and measurement of the indexable insert after different cycle counts, these phases can be attributed to specific causes. In the first phase, constant surface roughness quality is maintained due to the integrity of the coating. In the second phase, the gradual wear of the insert, mostly flank wear, leads to a deterioration of surface quality. In the final phase, the fracturing of the cutting edge results in a steep reduction of surface roughness, by allowing the larger cutting edge radius to cut through a bigger part of the surface per engagement.
3.5. Applications
It can be assumed that all indexable inserts with similar coatings undergo these three phases in a similar manner. To ensure this, further experiments should be conducted. With the knowledge that the surface roughness evolution follows this pattern, a new maintenance strategy for milling tools can be implemented using the integrated roughness measurement device. Instead of relying on a pre-determined estimation of the insert’s service life, an automated condition monitoring system can be employed. If the roughness measurement device is already used for quality control, this monitoring can be performed in parallel without requiring additional measurement steps. This system would detect the inflection point on the curve and notify the machine operator that the indexable insert is highly likely to have a chipped edge or is in the process of chipping further. Such an approach could reduce maintenance efforts and save costs by avoiding premature replacement of indexable inserts, while maintaining stable machining processes.
Another application of the findings from this study is the dynamic adjustment of cutting parameters. By understanding the relationship between tool wear and surface quality, proactive measures could be implemented, such as the early reduction of cutting parameters, thereby ensuring that surface roughness remains within specified tolerance limits. The functional end-of-life criterion for indexable inserts is typically not defined by the wear itself, but rather by the consequential degradation of part quality, specifically manifested as unacceptable dimensional deviations or a substandard surface finish. In these cases, monitoring surface roughness as a direct quality parameter is particularly advantageous, as it directly reflects the functional outcome of machining. This stands in contrast to indirect sensing methods (e.g., forces, vibrations, or acoustic emissions), which only provide secondary indicators and require additional interpretation. In practice, a mere reduction of cutting parameters would often be sufficient to continue using the same insert instead of replacing it prematurely. To enable such adaptive strategies in the long term, however, it is essential to directly measure surface quality, thereby capturing the complex dependencies between tool wear, machining conditions, and surface integrity.
4. Discussion
After measuring the behavior of milling cutters with indexable inserts regarding surface roughness throughout their life cycle three times, it can be clearly observed that, despite minor deviations, a distinct pattern emerges. The roughness value trends were largely reproducible. Due to a net test duration of approximately 17 h per insert, only a small number of three tests could be conducted. Although this was sufficient to provide a clear understanding of the processes, it is possible that other less frequent side effects were not documented.
It should also be noted that only a specific combination of conditions was tested in this study. Different cutting parameters, materials, or coatings of the inserts could potentially induce effects that result in a somewhat different progression of roughness values. Therefore, repeating the experiments under varied conditions would be beneficial for gaining a more comprehensive understanding of the factors influencing tool wear and surface roughness. Additionally, in practice, an application-specific adjustment and a break-in process are likely to be required to account for the peculiarities of different machine tools and other conditions appropriately.
From an industrial perspective, the integration of the in situ roughness measurement device is straightforward when used solely for quality control. As described in Section 2.2, the measurement cycle can be seamlessly added to the NC code, ensuring fully automated documentation without requiring manual intervention. The extensive use of the system in this study, together with previous endurance tests reported in [4], confirms its robustness under long-term operation. Automatic calibration is performed against the integrated roughness standard, which further simplifies maintenance. While the current device enables reliable monitoring and documentation, its use for adaptive control strategies such as automatically adjusting machining parameters or detecting tool wear conditions remains limited. The necessary software modules for real-time decision making are not yet integrated with the device. The models developed in this study represent an important foundation but must be extended and validated before they can be implemented in industrial closed-loop control systems.
5. Patents
The patent for the integrated roughness measuring device has been granted under IPC classifications G01B21/04 and G01B5/28.
Author Contributions
Conceptualization, F.B.; methodology, F.B.; software, B.R.; validation, G.P.; data curation, B.R.; writing—original draft preparation, B.R.; writing—review and editing, G.P.; visualization, B.R.; supervision, G.P.; project administration, G.P.; funding acquisition, G.P. All authors have read and agreed to the published version of the manuscript.
Funding
This research was funded by the German company Mahr GmbH.
Data Availability Statement
No further data are publicly available on this project due to confidentiality agreements.
Conflicts of Interest
The authors declare no conflicts of interest.
Abbreviations
The following abbreviations are used in this manuscript:
| OPCUA | Open Platform Communications Unified Architecture |
| II | Indexable Inserts |
| CNC | Computerized Numerical Control |
| NC | Numerical Control |
| VB | Flank Wear |
| IPC | International Patent Classification |
References
- Horvat, D.; Kroll, H.; Jäger, A. Researching the Effects of Automation and Digitalization on Manufacturing Companies’ Productivity in the Early Stage of Industry 4.0. Procedia Manuf. 2019. Available online: https://publica.fraunhofer.de/entities/publication/b1edc08f-dada-409e-a4d9-66c7d780c05c (accessed on 29 September 2025). [CrossRef]
- Sauer, O.; Haller, M.L.; Wagner-Sardesai, S.; Henke, J.; Schmelting, J.; Meyer, T.; Kujath, M.; Seidel, H.; Kuhn, T.; Schnicke, F.; et al. Manufacturing-X: Die Branche der Fabrikausrüster. Fraunhofer-Gesellschaft 2023. Available online: https://publica.fraunhofer.de/entities/publication/f53ba3a4-88a9-43a5-a0f1-ae98a044d744 (accessed on 29 September 2025).
- QA Group. Was ist Oberflächenrauheit und wie wird sie gemessen? QA Group, 2023. Available online: https://www.qa-group.com/en/glossary/surface-roughness/ (accessed on 29 September 2025).
- Hohensulz, C.; Bleicher, F. Anwendungsszenarien eines taktilen Oberflächenrauheitsmesssystems für In-Situ-Messungen in Werkzeugmaschinen. Metrology 2023, 3, 280–291. [Google Scholar] [CrossRef]
- KS B ISO 8688-1; Tool Life Testing in Milling—Part 1: Face Milling. International Organization for Standardization: Geneva, Switzerland, 1996. Available online: https://www.kssn.net/search/stddetail.do?itemNo=K001010146146 (accessed on 29 September 2025).
- DMG MORI. CELOS mit MAPPS auf FANUC für monoBLOCK. DMG MORI News 15 February 2017. Available online: https://en.dmgmori.com/news-and-media/news/celos (accessed on 29 September 2025).
- ISO 3274:1996; Geometrical Product Specifications (GPS)—Surface Texture: Profile Method—Nominal Characteristics of Contact (Stylus) Instruments. International Organization for Standardization: Geneva, Switzerland, 1996. Available online: https://www.iso.org/standard/10132.html (accessed on 29 September 2025).
- ISO 21920-1:2021; Geometrical Product Specifications (GPS)—Surface Texture: Profile—Part 1: Indication of Surface Texture. International Organization for Standardization: Geneva, Switzerland, 2021. Available online: https://www.iso.org/standard/74154.html (accessed on 29 September 2025).
- ISO 5436-1:2000; Surface Texture: Profile Method—Measurement Standards—Part 1: Material Measures. International Organization for Standardization: Geneva, Switzerland, 2000. Available online: https://www.iso.org/standard/29025.html (accessed on 29 September 2025).
- Grochalski, K.; Mendak, M.; Jakubowicz, M.; Gapiński, B.; Swojak, N.; Wieczorowski, M.; Krawczyk, A. Differences in Roughness Parameter Values from Skid and Skidless Contact Stylus Profilometers. Adv. Sci. Technol.—Res. J. 2021, 15, 58–70. [Google Scholar] [CrossRef]
- OPC Foundation. Unified Architecture–OPC Technologies. OPC Foundation. Available online: https://opcfoundation.org/about/opc-technologies/opc-ua/ (accessed on 29 September 2025).
- Alicona. InfiniteFocus G5: Optical Micro Coordinate Measurement and Surface Finish Measurements in One System. Université Polytechnique Hauts-de-France. Available online: https://www.uphf.fr/sites/default/files/media/2024-04/alicona_if_g5.pdf (accessed on 29 September 2025).
- Buderus Edelstahl GmbH. Buderus Plastic Mould Steel 2312. Buderus Edelstahl GmbH. Available online: https://www.buderus-steel.com/app/uploads/sites/186/2023/11/2312_e-1.pdf (accessed on 29 September 2025).
- Pearson, J. Machining of Stainless Steels. Atlas Tech Note No.4. 2021. Available online: https://atlassteels.com.au/wp-content/uploads/2021/07/Atlas-Tech-Note-No-4-Machining-of-Stainless-Steels-17-06-21.pdf (accessed on 29 September 2025).
- Walter Tools. M3024-063-B22-06-04 Product Overview. Walter Tools. Available online: https://www.walter-tools.com/de-de/search/product/m3024-063-b22-06-04 (accessed on 29 September 2025).
- Walter Tools. XNGU0705ANN-F57 WSM35G Product Overview. Walter Tools. Available online: https://www.walter-tools.com/en-gb/search/product/xngu0705ann-f57%20wsm35g (accessed on 29 September 2025).
- Osmond, L.; Cook, I.; Curtis, D.; Slatter, T. Tool life and wear mechanisms of CVD coated and uncoated SiAlON ceramic milling inserts when machining aged Inconel 718. J. Eng. Manuf. 2023. Available online: https://journals.sagepub.com/doi/pdf/10.1177/09544054231180653 (accessed on 29 September 2025). [CrossRef]
- Klocke, F. Fertigungsverfahren 1: Zerspanung mit Geometrisch Bestimmter Schneide S.256-259, 9th ed.; Springer: Berlin/Heidelberg, Germany, 2017. [Google Scholar]
- de Vos, P. Tool Wear Patterns & How to Optimize Them. Seco Tools. Available online: https://www.secotools.com/article/122073?language=en (accessed on 29 September 2025).
- Rangarajan, A.; Dornfeld, D.A. Back Cutting and Tool Wear Influence on Burrs in Face Milling—Analysis and Solutions. UC Berkeley: Laboratory for Manufacturing and Sustainability, 2004. Available online: https://escholarship.org/uc/item/5bq7d5qg#article_main (accessed on 29 September 2025).
- DIN EN ISO 21920-1:2022-12; Geometrical Product Specifications (GPS)—Surface Texture: Profile—Part 1: Indication of Surface Texture. International Organization for Standardization: Geneva, Switzerland, 2022.
Disclaimer/Publisher’s Note: The statements, opinions and data contained in all publications are solely those of the individual author(s) and contributor(s) and not of MDPI and/or the editor(s). MDPI and/or the editor(s) disclaim responsibility for any injury to people or property resulting from any ideas, methods, instructions or products referred to in the content. |
© 2025 by the authors. Licensee MDPI, Basel, Switzerland. This article is an open access article distributed under the terms and conditions of the Creative Commons Attribution (CC BY) license (https://creativecommons.org/licenses/by/4.0/).