


ISPRS Int. J. Geo-Inf. 2026, 15(6), 233; https://doi.org/10.3390/ijgi15060233 - 24 May 2026
Abstract
►
Show Figures
This work presents a trajectory indexing pipeline for accelerating Social Spatio-Temporal Keyword Pattern (S2KP) queries over Multiple-Aspect Trajectory (MAT) data. An S2KP query forms a sequence of spatial, temporal, textual, and social-rating constraints over trajectory episodes. The constraints are
[...] Read more.
This work presents a trajectory indexing pipeline for accelerating Social Spatio-Temporal Keyword Pattern (S2KP) queries over Multiple-Aspect Trajectory (MAT) data. An S2KP query forms a sequence of spatial, temporal, textual, and social-rating constraints over trajectory episodes. The constraints are formulated in the form of regular expressions, thus offering high expressiveness and flexibility in query formulation. In this paper, we enhance spatial pruning by enhancing a well-established MAT index, the Episode-Based Multiple-Aspect Trajectory (EMT) Dual Index. The EMT Dual Index is augmented with curve-based keys (Hilbert, Z-order, and Gray-coded Z-order mappings), so that spatially related entities are projected into one-dimensional key ranges, enabling additional subtree pruning through interval overlap while preserving exact final matching semantics. The intervals are induced by the numbering of cells generated by a curve. Our experimental study on two representative MAT datasets (one synthetic and one real) demonstrates the effectiveness of our proposal.
Full article
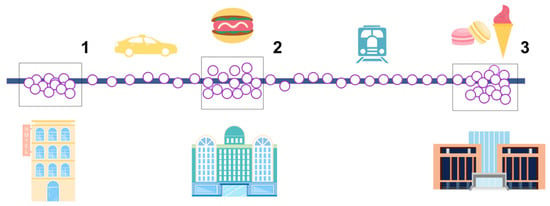
Figure 1


