Abstract
The chorematic method represents an innovative and contemporary approach for organizing tourist space, supporting the sustainable regional development of the future UNESCO Geopark, and guiding research, evaluation, and tourism monitoring activities in the area. This study applies Geographic Information System (GIS) techniques to develop a chorematic model illustrating the influence of county capitals, using Oltenia de sub Munte—an aspiring UNESCO Geopark in Romania—as a case study. The area’s complex geographical characteristics make it an ideal context for demonstrating the capabilities of GIS-based spatial analysis, including the use of the Reilly–Converse gravity model, which posits that a city’s influence increases with its population size and decreases with distance. The theoretical and methodological framework integrates spatial analysis and statistical visualization through the use of thematic maps and diagrams to explore the chorematic model and to assess tourism supply and demand. Accordingly, spatial representations based on chorematic modeling are presented, and the dynamics of tourism demand and supply from 2015 to 2024 are analyzed, focusing on the number of tourist arrivals, overnight stays, and the overall tourism offer within the Oltenia de sub Munte Geopark.
Keywords:
chorematic model; GIS; cartography; tourist resource; tourist demand; tourist supply; ecotourism 1. Introduction
Tourism is one of the fastest-growing economic sectors and among the most strategically significant in Romania [1,2,3,4]. In the first half of 2025, the number of international tourists increased by 5% compared to the same period in 2024 and by 4% relative to 2019, prior to the COVID-19 pandemic [5]. Approximately 690 million tourists traveled internationally between January and June 2025, about 33 million more than in the corresponding period of 2024 [5]. According to Bayramoğlu (2025), international tourist arrivals are expected to continue increasing, reaching around 1.8 billion by 2030 [6]. However, this growth is occasionally disrupted by social, geopolitical, or trade-related events [7].
The concept of “choremes” was first introduced by Brunet (1980) as a key method for the graphical modeling of geographical spaces [8]. Chorematic modeling allows the synthesis of spatial structures and relationships, independently of a territory’s shape, size, or configuration, using symbols, colors, arrows, textures, and other graphic devices instead of conventional topographic maps [9]. This approach enables the representation of both structural relationships and the underlying spatial patterns of phenomena across a given area.
Initially, choremes were employed by geographers for the manual depiction of fundamental elements of territories, including cities, population distributions, and trends in specific phenomena [10,11]. Since then, the method has gained popularity in various research fields, offering a means to visually summarize complex statistical data and extract insights from graphical representations [12,13,14]. According to Bassel & Weibel (1988) and Spiess (1995), chorematic models can be regarded as a specialized type of thematic map characterized by a high degree of abstraction and generalization [15,16]. In the context of the Oltenia de sub Munte aspiring UNESCO Geopark, this generalization facilitates the representation of tourism attractions and spatial relationships [17].
Chorematic models enable the visualization of spatial elements at both local and regional scales, providing researchers with a unique perspective on tourism development and territorial dynamics [18,19,20]. By combining chorematic diagrams with GIS techniques, it is possible to map, process, and analyze data in a manner that highlights functional relationships, accessibility, and spatial hierarchies [21].
These spatial representations also serve as a practical tool for stakeholders in the tourism and hospitality sector, supporting decision-making, strategy development, and policy discussions [22,23]. In this study, the chorematic modeling approach is structured around seven spatial configurations (Figure 1)—texture, square, attraction, contact, position, dynamics, and spatial arrangement—supplemented by four foundational elements for implementing Brunet’s geographical phenomena [21,24,25,26,27]. Each configuration is associated with specific graphic or indexical symbols to represent structures or processes. Within the Oltenia de sub Munte Geopark, chorematic diagrams were developed following these principles to support sustainable spatial and territorial development [26]. Chorematic maps can therefore be interpreted either as highly generalized thematic maps [9,28] or as spatial representations abstracted from topography, capturing essential territorial patterns and tourism dynamics.
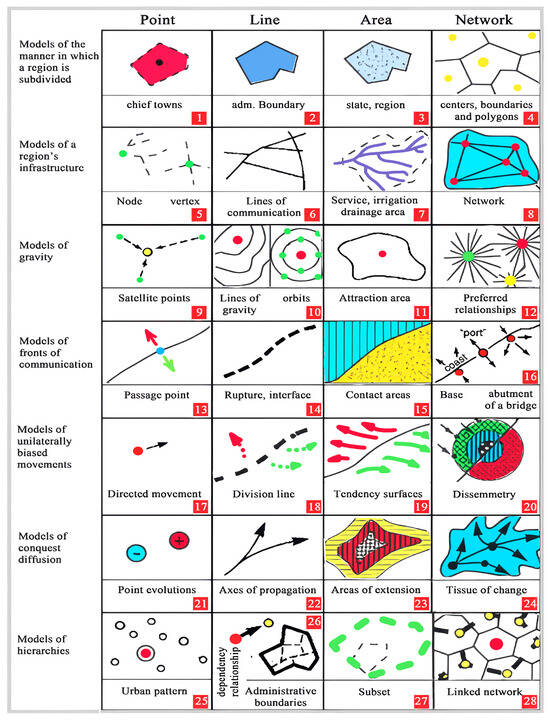
Figure 1.
Choreme models. Source: authors’ processing after Drăguleasa, 2025 [28].
Choremes have been widely applied in social geography, with one notable example being the “Blue Banana,” which represents the principal axis of economic and social development in the European Union and highlights the potential risk of Paris being excluded from this corridor [26]. The banana-shaped structure effectively illustrates Europe’s main economic growth corridor, demonstrating how chorematic models can visually support regional sustainable development. Similarly, Laurini (2014) highlighted choremes as practical tools for the visual representation of theoretical geographical knowledge [29].
Another significant development is ChEVIS, a system resulting from a collaborative project among three international research institutions: the Institut National des Sciences Appliquées in Lyon (France), the University of Salerno (Italy), and Tecnológico de Monterrey, Campus Puebla (Mexico). The project aimed to design an innovative cartographic solution capable of synthesizing and generalizing geographic database content, ultimately producing maps that are both readable and intuitive [30,31].
Chorematic maps are designed to emphasize aesthetic and visual aspects, guiding the reader’s attention to areas of interest and simplifying interpretation by limiting the volume of information presented. In this study, cartographic elements within the Oltenia de sub Munte aspiring UNESCO Geopark are synthesized and presented with precision, providing researchers with clear spatial insights [32].
The integration of Geographic Information Systems (GIS) in tourism offers numerous opportunities to enhance the management and exploitation of tourist activities [33], particularly within the Oltenia de sub Munte Geopark. GIS provides comprehensive techniques for analyzing, processing, and visualizing spatio-temporal data, enabling an overview of natural and cultural attractions, transport infrastructure, tourist accommodations, and significant protected areas such as national and natural parks [34,35,36]. According to Singh (2015) and Gavrilanes Montoya et al. (2021), GIS processes—including spatio-temporal modeling, mapping, and statistical analysis—are essential for evaluating tourism potential and addressing environmental challenges [37,38].
The novelty of this study lies in its development of a highly generalized and abstracted model for organizing and analyzing the dynamics of the tourist space. The chorematic model for the Oltenia de sub Munte Geopark anticipates territorial and spatial structures that support tourism development, human settlements, rural and urban population trends, and socio-economic planning, while also identifying critical areas requiring strategic attention.
The Buila-Vânturarița National Park (BVNP) was selected as the central reference area within the Oltenia de sub Munte aspiring UNESCO Geopark because it represents both the core zone of geodiversity and biodiversity and the most visited natural attraction in the region. It provides a well-defined natural laboratory for applying the chorematic and GIS-based spatial analysis methods. The Park’s territory overlaps with several administrative-territorial units included in the study area (Figure 2) and lies within the geographical boundaries of the aspiring geopark (Figure 3). Consequently, BVNP serves as a benchmark for evaluating spatial organization, tourism flows, and conservation–tourism interactions that are representative of the entire geopark territory.
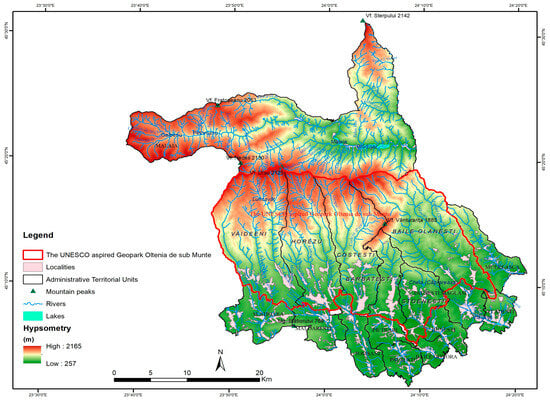
Figure 2.
The administrative territorial units that form the study area. Source: authors’ processing in ArcGIS 10.7.2. software.
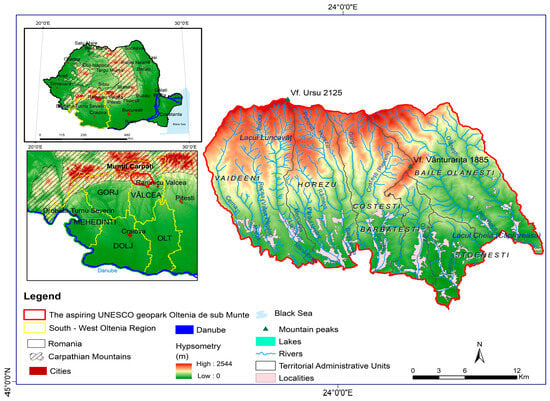
Figure 3.
The location of the aspiring UNESCO geopark, Oltenia de sub Munte. Source: authors’ processing in ArcGIS 10.7.2. software.
This study contributes both theoretically and methodologically to national [39,40,41] and international [42,43,44,45,46,47,48] research on the use of chorematic models in tourism development. It is among the first academic studies in Romania to apply chorematic modeling for the valorization of tourism resources, providing a tool for planning and organizing geographical space to support regional sustainable development within a UNESCO Geopark candidate, Oltenia de sub Munte [49].
The primary aim of this study is to employ a Geographic Information System (GIS) to develop choremes specific to the area of influence of county capitals, calculated using the Reilly–Converse gravity model and represented through quantitative cartographic methods. The geopark, located in the South-West Oltenia region, was selected for its exceptional diversity of natural and cultural tourist attractions, many of which remain underutilized in current rural and urban tourism planning. Its complex territorial structure also makes it an ideal case study for demonstrating the practical application of GIS techniques, including the Reilly–Converse gravity model, which posits that a city’s influence increases with population size and decreases with distance.
The research objectives of this applied study are threefold: (1) to implement a GIS-based framework for developing a chorematic model of the geopark; (2) to calculate the areas of influence of county capitals using the Reilly–Converse gravity model; (3) to analyze tourism demand and supply within the administrative territorial units of the geopark.
Recognizing that effective tourism planning requires understanding both demand and supply, this study integrates these dimensions to provide a comprehensive spatial assessment of the geopark’s tourism potential.
2. Materials and Methods
2.1. Research Area
The aspiring UNESCO Geopark Oltenia de sub Munte is located in Vâlcea County (Figure 2) and encompasses the localities of Vaideeni, Horezu, Costești, Bărbătești, Stoenești, and Băile Olănești. Its territory extends from the border with Gorj County nearly to Olt County and from the ridge of the Căpățânii Mountains to DN 67. The area is traversed east–west by DN 67 (Râmnicu Vâlcea–Horezu–Târgu Jiu–Motru–Drobeta Turnu Severin), a major access road that intersects three European routes with high tourist traffic: E81 to Râmnicu Vâlcea, E79 to Târgu Jiu, and E70 to Drobeta Turnu Severin.
In the northern part of the geopark, along the mountainous border, DJ 665 branches from DN 67 in Horezu and runs east–west through submontane settlements such as Polovragi, Baia de Fier, and Novaci, eventually connecting to E79 near Curtișoara. This scenic route highlights the region’s cultural heritage, providing access to traditional Oltenian villages and enhancing the area’s tourism potential.
Figure 3 illustrates the administrative territorial units that comprise the Oltenia de sub Munte geopark, including six primary localities and eleven neighboring settlements. The geopark is bordered to the north by the administrative unit of Mălaia, to the east by Muereasca, and to the south by Slătioara, Măldărești, Tomșani, Pietrari, Păușești, Băile Govora, Bunești, Păușești Măglași, and Vlădești.
The administrative territorial units analyzed in this study are primarily small-scale areas, including rural settlements [50,51] and urban agglomerations [52,53,54]. Despite their limited size, the urban centers of Băile Olănești and Horezu serve as cores for sustainable tourism development and the valorization of tourism resources [55], possessing unique physical–geographical characteristics and conditions that justify investigation at regional and national scales.
The valorization of tourism resources in the Oltenia de sub Munte area encompasses multiple tourism forms, including rural tourism [56,57,58,59], cultural tourism [60,61], spa tourism [62,63,64], and ecotourism [65,66]. For this destination, the Buila-Vânturarița National Park (Figure 4) is proposed as a key ecotourism area, promoting the sustainable use and appreciation of both natural and cultural (anthropic) resources. Tourist areas typically consist of clusters of tourist poles and attractions that together form a coherent tourism product (Figure 4). At the local scale, examples include national parks, urban centers, spa resorts, and religious sites, such as churches, monasteries, and nunneries.
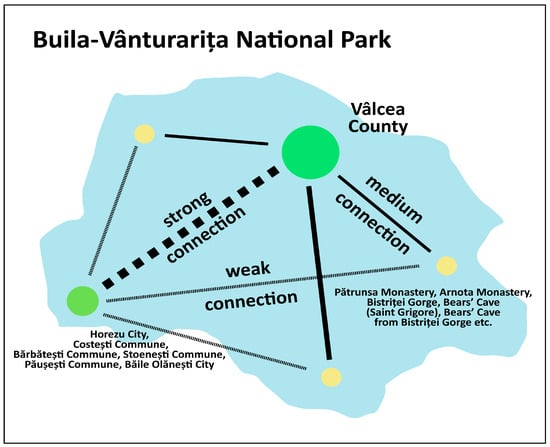
Figure 4.
The structure of the Buila-Vânturarița National Park tourist area at a local scale for the tourist destination Oltenia de sub Munte. Source: authors’ processing using Microsoft Paint.
The two main towns within the Oltenia de sub Munte Geopark are significant tourist destinations, offering a diverse range of tourism products due to their unique natural and cultural–historical resources. Băile Olănești is renowned for its spa tourism, while Horezu is recognized for religious tourism, traditional crafts, and recreational activities. Together, these towns are emerging as highly sought-after destinations for traditional holidays, attracting visitors interested in both wellness and cultural experiences.
2.2. Data Sources
The areas of influence of the county seats were calculated using the Reilly–Converse gravity model and represented through a quantitative cartographic approach. This gravity model assumes that a city’s influence decreases with distance and increases with its size (population). The model for each county seat is expressed using the following formula:
where D is equal to the distance between cities A and B, and (respectively ) represents the population of city A (respectively B), allowing for the calculation of “border” points (d) relative to the more important cities for each county seat, thus marking the limits of their areas of influence [67].
For the chorematic mapping of the Oltenia de sub Munte Geopark (Figure 5; Table 1), data were obtained from the TEMPO-ONLINE statistical database of the National Institute of Statistics (NIS) [68] and the Vâlcea County Territorial Development Plan (CTDP) [69,70]. These were supplemented with GIS data, including tourist points of interest sourced from the open-access OpenStreetMap (OSM) database [71], and boundaries of protected natural areas downloaded from the Ministry of Environment, Waters and Forests [72]. Data on natural and cultural–historical (anthropic) tourist attractions were collected via point digitization using Google Earth.
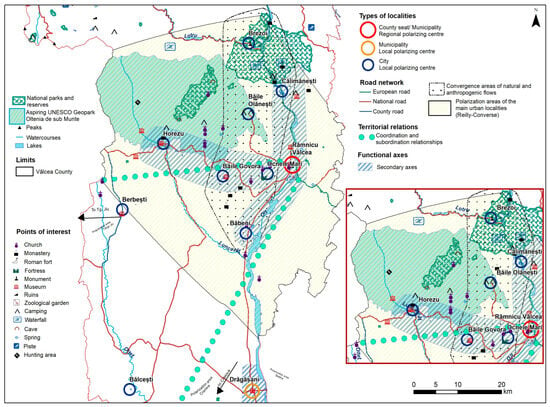
Figure 5.
A spatial chorematic model of the aspiring UNESCO geopark Oltenia de sub Munte. Source: authors’ processing in ArcGIS 10.7.2. software.

Table 1.
The data sources that were used in the study.
The first step involved organizing and extracting relevant data at the national and local levels, followed by completing the attribute tables of the SHP files where applicable. Next, appropriate colors and symbols were assigned to each feature, arranged in the layout, and standard map elements (e.g., scale, legend, and geographic north) were added. Microsoft Paint was also used to represent the structure of the Buila-Vânturarița National Park tourist area and the local-scale chorematic model (Figure 1, Figure 4 and Figure 6). The maps presented in Figure 2, Figure 3 and Figure 5 were produced in ArcMap using open-source data, including area boundaries, rivers, and elevation contours [72,73,74].
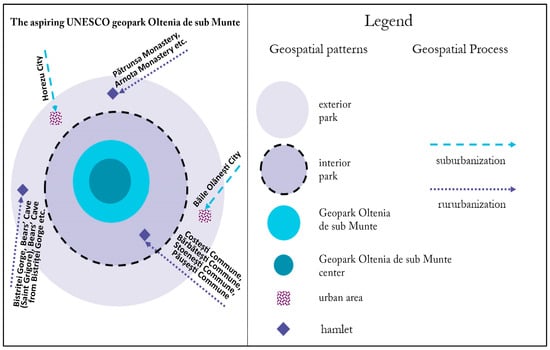
Figure 6.
The structure of the chorematic model of the aspiring UNESCO geopark Oltenia de sub Munte. Source: authors’ processing in Microsoft Paint.
Tourism demand and supply were analyzed using statistical data from the NIS [68] for five of the six administrative units (Băile Olănești, Horezu, Bărbătești, Costești, and Vaideeni). For Stoenești, no statistical data were available for the 2015–2024 period. The analysis followed established methodologies for processing tourism time series data, as described in [75,76,77,78,79,80,81,82,83,84], allowing for a comprehensive assessment of tourism demand and supply across the study area (Figure 7, Figure 8, Figure 9, Figure 10 and Figure 11).
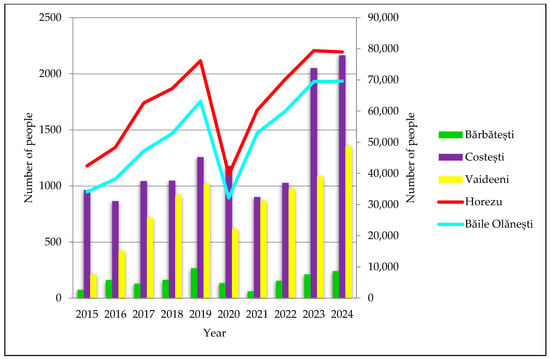
Figure 7.
Tourist arrivals within the administrative territorial units of the study area. Source: authors’ processing of NIS data [68].
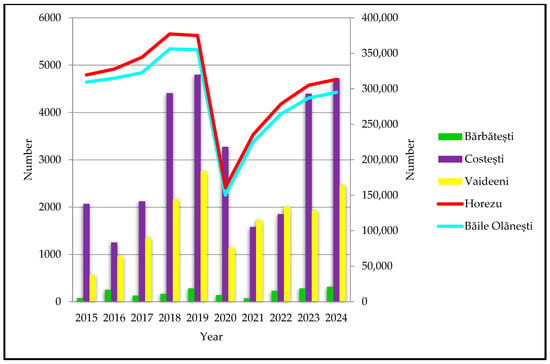
Figure 8.
Tourist overnight stays within the administrative territorial units of the study area. Source: authors’ processing of NIS data [68].
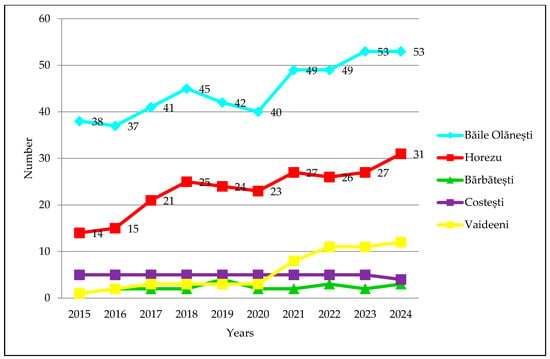
Figure 9.
The total number of tourist reception structures with accommodation functions. Source: authors’ processing of NIS data [68].
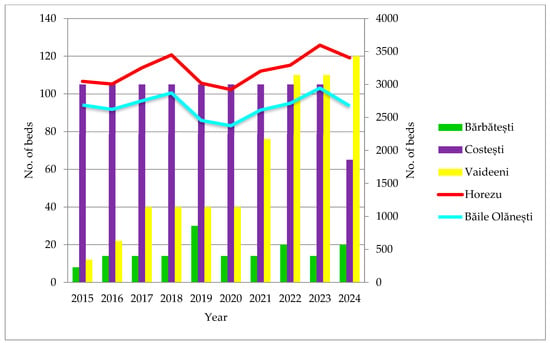
Figure 10.
Existing tourist accommodation capacity. Source: authors’ processing of NIS data [68].
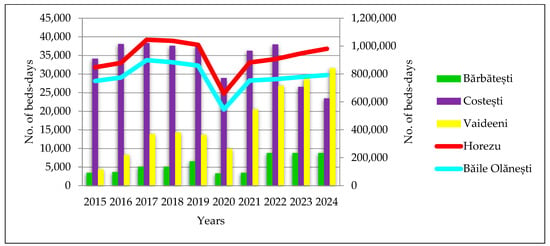
Figure 11.
Tourist accommodation capacity in operation. Source: author’s processing of NIS data [68].
For the theoretical components of the study, which do not have a direct spatial dimension, we employed simplified symbolic representations (qualitative) to illustrate spatial connections and flows within the analyzed territory (Figure 5). These relationships and connections were inferred from the relevant literature cited below. The visualization of city-related information and material flows along functional axes was conducted using the following qualitative cartographic methods [28]:
- (1)
- Pseudo-area method: The boundaries of flows are not precisely defined; instead, a hatched area is used to symbolically represent the spatial extent of the phenomenon.
- (2)
- Movement lines method: Phenomena that move along specific routes are represented using strips containing geometric shapes, indicating both direction and dynamics.
- (3)
- Sign method: The type, size, and importance (rank) of a city are represented symbolically, with larger circles indicating higher importance.
These methods collectively enable the representation of territorial relationships and functional hierarchies in a visually intuitive manner, supporting the conceptual framework of the chorematic model.
3. Results
This section provides a concise and precise description of the experimental results and their interpretation, according to the formulated research purpose and objectives.
3.1. The Chorematic Model of Influence of County Residences
The municipality of Râmnicu Vâlcea is characterized by the emergence of secondary functional axes (Figure 5) and the development of a densely peri-urbanized area. In contrast, the mountainous region generates centrifugal flows and lacks significant territorial development centers. Rural settlements in this area remain fragile in terms of territorial and tourism development due to their subsistence-based economies and the absence of attractive tourist sites, which limits the capacity to effectively manage and control development processes [70].
Table 2 presents the distances between cities along with their population sizes. The greatest distance, 88 km, occurs between Brezoi and Drăgășani, while the shortest distance, 10 km, is between Râmnicu Vâlcea and Ocnele Mari. In 2022, Râmnicu Vâlcea had the largest population, with 115,684 inhabitants, reflecting its status as the capital of Vâlcea County. At the other end of the spectrum, Băile Govora had the smallest population, with 2586 residents.

Table 2.
The distances between the cities and the populations of the cities.
Figure 6 presents a graphical abstraction of the study area, the aspiring UNESCO Geopark Oltenia de sub Munte, Romania, which conveys the territory’s structure and spatial processes more effectively than traditional cartographic representations. The chorematic model provides an overview of key geospatial phenomena, including suburbanization in the cities of Horezu and Băile Olănești, as well as rururbanization affecting natural and cultural elements in the surrounding areas, such as Pătrunsa and Arnota Monasteries, Bistriței Gorge, Peștera Urșilor, and the communes of Costești, Bărbătești, and Vaideeni.
3.2. Tourist Demand and Supply Within the Aspiring UNESCO Geopark, Oltenia de sub Munte
Tourism demand has traditionally been analyzed from an economic perspective [85], focusing on the evolution of overnight stays and tourist arrivals within the study area. According to Santos et al. (2015), extending the average length of tourist stays is a key objective for developing effective medium- and long-term marketing strategies [86]. Analyzing tourism demand in this manner has a significant economic impact not only on the study area but also on other national and international tourist and ecotourism destinations, including the design of post-COVID-19 marketing strategies [87].
In tourism demand studies, tourist arrivals are among the most commonly used variables [88], as they are closely linked to the economic growth of local communities and serve as a key indicator of destination development [89]. Tourist overnight stays are equally important for assessing demand [90], as the duration of visits provides essential information for sustainable tourism management [91]. Indeed, recent studies have highlighted that overnight stays are frequently used to evaluate the impact of seasonality on tourism demand [92,93].
During the period 2015–2024, tourist arrivals increased steadily between 2015 and 2019, followed by a decline in 2020 due to the COVID-19 pandemic. In the rural areas of Costești and Vaideeni, a notable rise in arrivals was observed in 2023–2024 compared with both the pre-pandemic and pandemic periods. Specifically, Costești recorded 2050 arrivals in 2023 and 2164 in 2024, while Vaideeni recorded 1084 arrivals in 2023 and 1354 in 2024 (Figure 7). The preference for these rural areas over urban destinations is attributed to tourists seeking quiet, relaxing environments, free from the noise and disturbances commonly associated with cities.
Tourist overnight stays exhibited an upward trend between 2016 and 2019 in the towns of Băile Olănești and Horezu, as well as in the rural areas of Costești and Vaideeni. Bărbătești recorded the lowest number of overnight stays during the study period, with 73 in 2015 and 314 in 2024, reflecting a trend similar to that observed for tourist arrivals. The decline in arrivals in 2020 due to the COVID-19 pandemic was mirrored in overnight stays across all areas. The highest number of overnight stays was recorded in Băile Olănești in 2018, totaling 356,222, whereas the lowest was in Bărbătești in 2021, with only 70 overnight stays (Figure 8).
The decline in overnight stays following the COVID-19 pandemic, as shown in Figure 8, reflects a broader regional trend rather than a phenomenon unique to the Oltenia de sub Munte area. Similar decreases were observed in neighboring tourist destinations, including the Căpățânii and Parâng Mountains, as well as other rural tourism centers in Vâlcea and Gorj counties, according to data from the National Institute of Statistics (NIS). This downward trend was primarily driven by pandemic-related restrictions in 2020–2021, reduced international mobility, and changes in tourist behavior, such as a preference for shorter, local vacations. Local factors also contributed, including limited accommodation capacity, reduced promotional activities, and the seasonal nature of tourism in the geopark. Since 2022, a gradual recovery has been noted; however, overnight stays have not yet returned to the pre-pandemic levels of 2019, highlighting the need for targeted measures to promote sustainable, year-round tourism.
From the perspective of tourism supply and resource valorization, natural, cultural, and environmental assets constitute the primary factors influencing tourism demand [94]. As noted by Palmer & Riera (2003), tourists are attracted not only by facilities but also by the quality of the natural environment; however, increased tourism activity can generate negative externalities, including ecosystem degradation and traffic congestion, which may compromise the quality of life of local residents [95].
In evaluating the tourism offer of the aspiring UNESCO Geopark Oltenia de sub Munte, we analyzed the total number of tourist reception structures with accommodation and catering functions, as well as the existing and operational accommodation capacity. Between 2015 and 2024, the towns of Băile Olănești and Horezu experienced growth in accommodation structures, with Băile Olănești increasing from 38 structures in 2015 to 53 in 2024. In contrast, the rural areas of Bărbătești and Costești exhibited a stable trend, while Vaideeni showed a modest increase from 3 structures in 2020 to 12 in 2024 (Figure 9).
According to data from the Ministry of Economy, Digitalization, Entrepreneurship, and Tourism, the highest number of tourist reception structures with public catering functions was recorded in the city of Băile Olănești (29 structures), followed by Horezu (14 structures). In the rural areas, Costești and Bărbătești had only one and two structures, respectively, offering public catering services (Table 3). Vaideeni and Stoenești, in contrast, had no registered structures providing public catering functions.

Table 3.
The number of tourist reception structures with public catering functions.
Regarding existing tourist accommodation capacity, Băile Olănești recorded the highest number of places in 2023, with 2945, followed by Horezu, which reached 728 places in 2024. The rural areas of Bărbătești and Vaideeni exhibited fluctuations throughout the 2015–2024 period. In Costești, the number of accommodation places remained stable at 105 from 2015 to 2023, before decreasing to 65 in 2024 (Figure 10).
The slight stagnation observed in 2024 for both tourist arrivals (Figure 7) and overnight stays (Figure 8) appears to be linked to the decrease in accommodation resources illustrated in Figure 10. This correlation indicates that the limited and unevenly distributed accommodation infrastructure within the Oltenia de sub Munte area has become a constraining factor for tourism growth. In several administrative units, small-scale guesthouses or rural accommodations ceased operations after the pandemic due to economic pressures, low occupancy rates, and rising maintenance costs. As a result, the reduction in accommodation capacity has constrained the recovery of tourist flows, reinforcing the stagnation observed in 2024. This pattern is particularly significant for the study, as it underscores how spatial disparities in tourism infrastructure directly influence regional tourism dynamics—an insight effectively captured through the chorematic–GIS analytical framework employed in this research.
Tourist accommodation in operation experienced the most pronounced decrease in bed-days in 2020 across all cities and communes due to the outbreak of SARS-CoV-2. A recovery was noted from 2021 to 2024. For instance, Horezu recorded 129,245 bed-days in 2021, increasing to 188,642 in 2024; Băile Olănești rose from 753,201 bed-days in 2021 to 791,932 in 2024; and Vaideeni increased from 20,497 bed-days in 2021 to 31,562 in 2024 (Figure 11).
4. Discussion
The use of choremes made it possible to conceptually and visually synthesize the spatial structure of tourism within the Oltenia de sub Munte area. Through the chorematic model, we identified the main axes of tourist mobility, the nodes of concentration (localities with diversified and accessible tourism resources), and the peripheral or poorly connected areas. By integrating GIS-based data (tourist arrivals, overnight stays, accommodation capacity) with chorematic symbols, we could translate statistical information into spatial relationships and functional hierarchies between localities.
This visual and analytical synthesis allowed us to recognize the most promising tourist localities—such as Horezu, Băile Olănești, and Costești—as key nodes in the regional tourism network, characterized by both strong accessibility and proximity to natural and cultural heritage sites (e.g., Buila-Vânturarița National Park and UNESCO-listed monasteries). In contrast, marginal localities were represented as secondary or diffuse choremes, indicating limited tourism functions. Therefore, the chorematic approach not only facilitated the spatial generalization of complex tourism data but also highlighted development priorities within the aspiring geopark’s territory.
In this study of choreme-based spatial analysis and tourism, three categories of choremes were identified following Lopez et al. (2009) [31]:
- (1)
- Geographic choremes: These were represented by points indicating major cities within the geopark, circles denoting regional and local polarizing centers, polygons outlining the administrative territorial units of the six municipalities and thematic areas, and lines representing geographical barriers within the study area.
- (2)
- Phenomenal choremes: Based on Bertin’s graphic semiology [97], these choremes depict phenomena in a continuous field using seven visual variables: (1) position, (2) shape, (3) orientation, (4) color, (5) texture, (6) brightness or darkness, and (7) size. Polygonization of the study area was applied to represent tourist or urban elements, such as convergence zones of natural and anthropic flows, polarization areas of main urban localities, secondary axes, and national parks. The contours of the territorial area of interest were generalized using a raster-based modeling algorithm [98]. Symbolization of the area was achieved by locating points of interest—including churches, monasteries, historical monuments, museums, caves, waterfalls, springs, campsites, ski slopes, and hunting areas—and representing them with symbols, thereby creating a “symbolized area” reflecting the natural and anthropic context. The careful selection of colors, using predominantly light shades, was a critical step in constructing spatial–tourist choremes.
- (3)
- Annotation choremes: These consist of the names of important cities and legends providing concise descriptions of each choreme. This category also includes external references, such as neighboring countries, counties, the Carpathian Mountains, the Danube River, and the Black Sea.
To enable interaction between chorematic discovery, spatial data mining, and the visualization of chorematic models, it is necessary to use a language capable of supporting spatial representation of geographic knowledge, storage of data mining results, and map element presentation [99]. According to Cherni et al. (2009, 2015), these requirements can be fulfilled using ChorML [100,101], a specialized language derived from eXtensible Markup Language (XML) designed for storing and managing information about chorematic models [102,103].
Within the aspiring UNESCO Geopark Oltenia de sub Munte, GIS technologies can support the development of various forms of sustainable tourism, including cultural tourism, event tourism, ecotourism, geotourism, museum tourism, and rural environmental tourism [104]. For ecotourism and geotourism, GIS methods can help identify natural sites with high potential to attract visitors [105]. In the study area, ecotourism opportunities exist within Buila-Vânturarița National Park, which lies inside the geopark, and Cozia National Park, located in its immediate vicinity. Geotourism can be promoted at sites such as the Trovanților Museum, a nationally protected area (Figure 12). According to the National Strategy for the Development of Ecotourism in Romania, Buila-Vânturarița National Park is expected to receive approximately 3800 visitors [106].
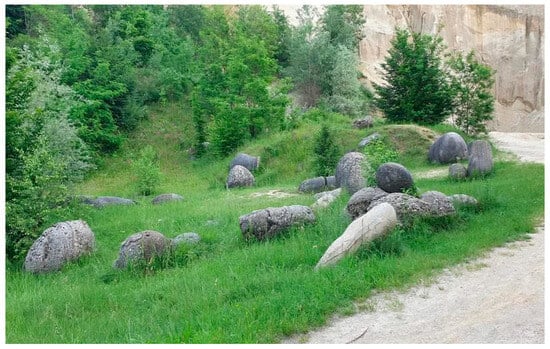
Figure 12.
Trovanților Museum protected area of national interest.
Museum tourism, designed to provide visitors with emotionally engaging and educational experiences [107], particularly for young tourists seeking to understand the communist period [108,109], can be developed at the Village Museum Collection in Vaideeni and the Contemporary Folk Art Galleries in Horezu. When planning these forms of tourism, it is essential to consider potential degradation or disturbance of wildlife in protected areas due to intense visitor traffic [110,111,112].
To promote the tourist offer internationally and enhance the visitor experience [113], the cartography of tourist resources serves as an essential tool for the valorization of a territory [114,115]. Maps not only provide an efficient means of communicating spatial information and shaping perceptions of space and place [116]—thereby guiding tourists with relevant information—but also facilitate the detailed description of the study area. The increasing availability and sophistication of digital mapping technologies in the tourism sector have further expanded the possibilities for representing theoretical information spatially, which can subsequently be applied in practical models [117].
According to the literature, natural tourism resources and economic development are crucial for enhancing environmental quality within protected areas, such as Buila-Vânturarița National Park, the only national park located within the UNESCO Oltenia de sub Munte candidate geopark [118,119,120]. These natural resources serve not only as the primary source of goods and services for local communities and tourism development [121] but also provide materials for construction and the development of tourist infrastructure within the geopark.
Cultural resources are equally significant, representing landmarks of various rural spaces that contribute both to local economic development [122] and to the growth of cultural tourism as a strategy for promoting local sustainability [123,124]. Consequently, the visitation of heritage sites in the geopark’s rural and urban areas by international tourists is a key component of regional and local development [125]. Each cultural–historical tourist site should therefore be carefully considered and valorized by local authorities [126,127,128].
The Oltenia de sub Munte area benefits from a rich natural and cultural heritage, including over 20 identified geosites, ranging from gorges and caves to trovants and paleontological sites containing 150-million-year-old fauna (Appendix A); numerous biodiversity hotspots, from pristine primary forests to landscapes hosting rare European-level species; and more than 20 cultural–historical sites (Appendix B). Among these, two sites are already recognized as part of UNESCO heritage: Horezu Monastery (Figure 13) and the traditional Horezu ceramics (Figure 14).
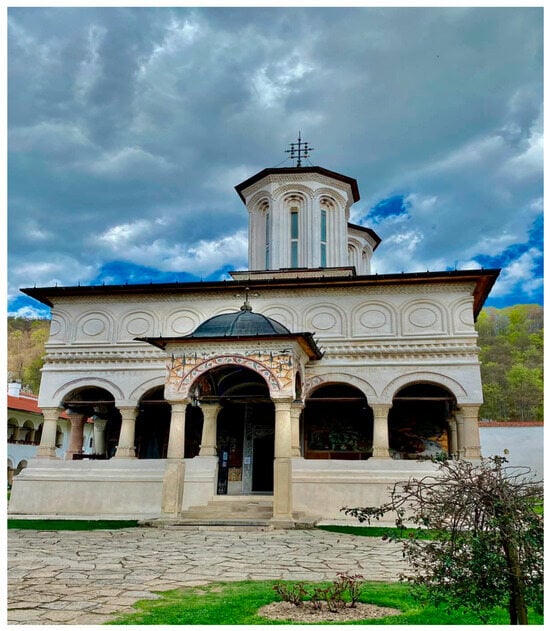
Figure 13.
Horezu Monastery.
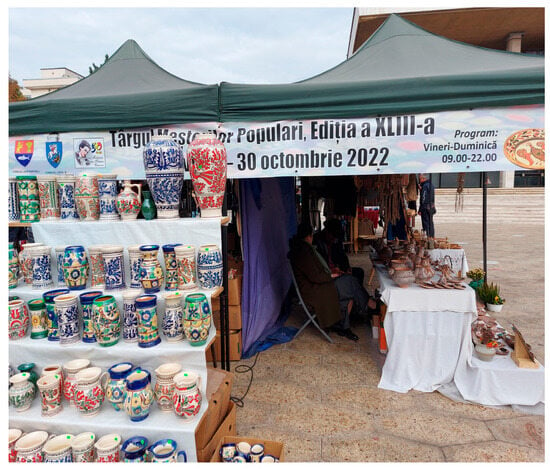
Figure 14.
Horezu ceramics.
5. Limitations of the Study
Although the present study provides new insights into the spatial organization and tourism dynamics of the Oltenia de sub Munte aspiring UNESCO Geopark, several limitations should be acknowledged.
First, the analysis relies primarily on secondary statistical data from the National Institute of Statistics (NIS) and local administrative sources. These data sets, while comprehensive, may include temporal or spatial inconsistencies that can influence the precision of the GIS-based results. Moreover, some indicators—such as informal accommodation or unregistered tourist activity—remain underreported, potentially leading to an underestimation of the actual tourism intensity in the area.
Second, the chorematic modeling approach, although effective in simplifying and visualizing spatial structures, is inherently conceptual and interpretative. The delineation of choremes may not capture all micro-level spatial variations.
Third, the temporal scope of the analysis (2015–2024) provides a solid basis for identifying medium-term trends but does not account for short-term fluctuations or longer historical patterns that could further contextualize tourism development in the region.
Finally, while the study identifies potential tourism development zones, it does not assess environmental carrying capacity or social impact in detail—issues that warrant further interdisciplinary investigation combining geography, ecology, and regional planning perspectives.
Future research should therefore integrate high-resolution spatial data, field surveys, and participatory stakeholder approaches to validate and refine the chorematic models, ensuring their applicability to sustainable tourism management in the future UNESCO Geopark.
6. Conclusions
This study developed chorematic models to represent the spatial organization of urban and rural elements within the aspiring UNESCO Geopark Oltenia de sub Munte. These models, which require specialized technical and scientific knowledge, provide an innovative and efficient method for visualizing tourism resources, functional axes, territorial relationships, and the distribution of natural and cultural points of interest across the geopark. By integrating GIS techniques, the study offers a replicable methodology for analyzing tourism demand and supply, as well as the spatial dynamics of tourist infrastructure in both urban cores and surrounding rural buffer zones.
The novelty of this research lies in its combined use of chorematic mapping and GIS-based spatial analysis within a Romanian geopark context, providing one of the first comprehensive frameworks linking spatial representation with tourism planning and sustainable development. General features such as cities, population, and tourism-specific phenomena were effectively summarized using choremas, demonstrating their utility as visual tools for statistical analysis and territorial decision-making.
From a practical perspective, the results can guide local authorities and tourism managers in optimizing accommodation distribution, prioritizing infrastructure investments, and designing sustainable tourism strategies that balance visitor flows with the protection of natural and cultural resources. Additionally, the study underscores the importance of addressing spatial disparities in tourism infrastructure, which have been shown to constrain post-pandemic recovery in the geopark.
While this study provides detailed insights, certain limitations should be acknowledged. These include the incomplete availability of statistical data for some rural areas and the lack of real-time monitoring of tourist flows, which may affect the precision of demand–supply analyses. Future research could address these gaps through additional fieldwork, the integration of dynamic temporal models, and the application of predictive algorithms to anticipate changes in visitor patterns. Expanding the chorematic methodology to other geographical regions will further test its adaptability and scalability, offering broader insights for sustainable territorial development.
Overall, this study highlights the potential of combining chorematic models with GIS technologies as a strategic tool for sustainable tourism planning, regional development, and the valorization of both natural and cultural resources within aspiring UNESCO geoparks.
Author Contributions
Conceptualization, Amalia Niță and Ionuț-Adrian Drăguleasa; methodology, Amalia Niță and Ionuț-Adrian Drăguleasa; software, Ionuț-Adrian Drăguleasa and Amalia Niță; validation, Amalia Niță and Ionuț-Adrian Drăguleasa; formal analysis, Amalia Niță and Ionuț-Adrian Drăguleasa; investigation, Ionuț-Adrian Drăguleasa and Amalia Niță; resources, Amalia Niță and Ionuț-Adrian Drăguleasa; data curation, Amalia Niță and Ionuț-Adrian Drăguleasa; writing—original draft preparation, Amalia Niță and Ionuț-Adrian Drăguleasa; writing—review and editing, Amalia Niță and Ionuț-Adrian Drăguleasa; visualization, Amalia Niță and Ionuț-Adrian Drăguleasa; supervision, Amalia Niță and Ionuț-Adrian Drăguleasa; project administration, Amalia Niță and Ionuț-Adrian Drăguleasa. All authors have read and agreed to the published version of the manuscript.
Funding
This study was supported by the University of Craiova research fund, Romania.
Data Availability Statement
The original contributions presented in this study are included in the article.
Acknowledgments
The authors would like to thank the guest editors and academic editors for their constant support during the various stages of writing this article, as well as the anonymous reviewers for their constructive comments and helpful suggestions, which greatly contributed to improving its quality over the several review rounds.
Conflicts of Interest
The authors declare no conflicts of interest. The funders had no role in the design of the study; in the collection, analysis, or interpretation of data; in the writing of the manuscript; or in the decision to publish.
Abbreviations
The following abbreviations are used in this manuscript:
| GIS | Geographic Information System (software). |
| NIS | National Institute of Statistics. |
| OSM | Open Street Map. |
| CTDP | County Territory Development Plan (Vâlcea). |
| ANCPI | National Agency for Cadastre and Real Estate Publicity. |
Appendix A. Natural Tourist Attractions
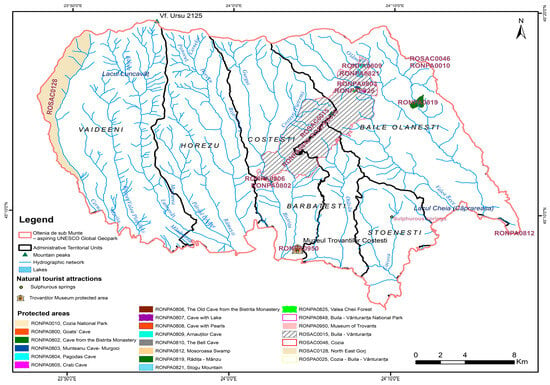
Figure A1.
Natural tourist attractions. Source: authors’ processing using ArcGIS 10.7.2. software.
Appendix B. Cultural–Historical (Anthropic) Tourist Attractions
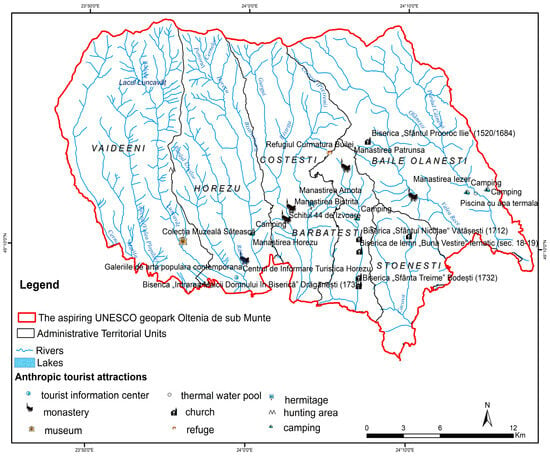
Figure A2.
Cultural-historical tourist attractions. Source: authors’ processing using ArcGIS 10.7.2. software.
References
- Arzoumanidis, I.; Walker, A.M.; Petti, L.; Raggi, A. Life Cycle-Based Sustainability and Circularity Indicators for the Tourism Industry: A Literature Review. Sustainability 2021, 13, 11853. [Google Scholar] [CrossRef]
- Giampiccoli, A.; Dłużewska, A.; Mnguni, E.M. Host Population Well-Being through Community-Based Tourism and Local Control: Issues and Ways Forward. Sustainability 2022, 14, 4372. [Google Scholar] [CrossRef]
- Mazilu, M.; Niță, A.; Drăguleasa, I.-A.; Mititelu-Ionuș, O. Fostering Urban Destination Prosperity through Post COVID-19 Sustainable Tourism in Craiova, Romania. Sustainability 2023, 15, 13106. [Google Scholar] [CrossRef]
- Jeong, J.Y.; Karimov, M.; Sobirov, Y.; Saidmamatov, O.; Marty, P. Evaluating Culturalization Strategies for Sustainable Tourism Development in Uzbekistan. Sustainability 2023, 15, 7727. [Google Scholar] [CrossRef]
- World Tourism Barometer. Available online: https://www.untourism.int/un-tourism-world-tourism-barometer-data?utm_source=chatgpt.com (accessed on 28 June 2025).
- Bayramoğlu, Z. Sustainability Trends in Turkish Tourism: A Longitudinal Analysis of Tourist Arrivals, Overnights and Occupancy Rates (2000–2024). Sustainability 2025, 17, 8333. [Google Scholar] [CrossRef]
- Mazilu, M.; Niță, A.; Băbăț, A.; Drăguleasa, I.-A.; Grigore, M. Risk and Sustainable tourism resilience in the Post Economic Crisis and COVID-19 pandemic period. Present Environ. Sustain. Dev. 2024, 18, 235–254. [Google Scholar] [CrossRef]
- Brunet, R. La composition des modèles dans l’analyse spatiale. L’Espace Géographique 1980, 4, 253–265. [Google Scholar] [CrossRef]
- Dhieb, M. Using chorems in graphical modeling: The case of the kingdom of Saudi Arabia. Curr. Urban Stud. 2020, 8, 265–283. [Google Scholar] [CrossRef]
- Laurini, R.; Donolo, R.M. Computer-Assisted Visual Reasoning for Territorial Intelligence. J. Vis. Lang. Comput. 2022, 2022, 1–11. [Google Scholar] [CrossRef]
- Balaican, D.; Teubner, K.; Tudor, I.-M.; Nichersu, I.; Burada, A.; Trifanov, C.; Tudor, M.; Iticescu, C.; Moraru, L.; Georgescu, P.-L. Water Energy Food Nexus in Urbanizing Wetlands: Challenges and Solutions Explored through Choremes and Focus Maps. Water 2024, 16, 922. [Google Scholar] [CrossRef]
- Dernat, S.; Johany, F.; Lardon, S. Identifying choremes in mental maps to better understand socio-spatial representations. Cybergeo 2016, 1, 1–25. [Google Scholar] [CrossRef]
- Mouratidis, K. Urban planning and quality of life: A review of pathways linking the built environment to subjective well-being. Cities 2021, 115, 103229. [Google Scholar] [CrossRef]
- Battistoni, P.; Romano, M.; Sebillo, M.; Vitiello, G. Monitoring Urban Happiness through Interactive Chorems. Sustainability 2023, 15, 8733. [Google Scholar] [CrossRef]
- Brassel, K.E.; Weibel, R. A review and conceptual framework of automated map generalization. Int. J. Geogr. Inf. Syst. 1988, 2, 229–244. [Google Scholar] [CrossRef]
- Spiess, E. The Need for Generalization in a GIS Environment. In GIS and Generalisation; CRC Press: Boca Raton, FL, USA, 1995; pp. 31–46. [Google Scholar]
- Bouattou, Z.; Laurini, R.; Belbachir, H. Animated chorem-based summaries of geographic data streams from sensors in real time. J. Vis. Lang. Comput. 2017, 41, 54–69. [Google Scholar] [CrossRef]
- Bonin, M.; Thinon, P.; Cheylan, J.-P.; Deffontaines, J.-P. Modélisation des Agroécosystèmes et Aide à la Décision. CIRAD; La Modélisation Graphique, de la Recherche au Développement. 2001, pp. 391–412. Available online: https://agritrop.cirad.fr/485270/ (accessed on 31 July 2025).
- Bazile, D.; Carrié, C.; Vidal, A.; Negrete Sepulveda, J. Modélisation des Dynamiques Spatiales Liées à la Culture du Quinoa Dans le Nord chilien. M@ppemonde 2011, 102, 1–14. Available online: https://agritrop.cirad.fr/560877/1/document_560877.pdf (accessed on 28 June 2025).
- Bonin, M.; Le Coq, J.-F.; Saenz-Segura, F.; Lamour, A. Intensification de l’élevage et Reforestation? Les Modèles Spatiaux des Exploitations D’élevage du Programme de Reconnaissance des Bénéfices Environnementaux au Costa Rica. Mappemonde. Rev. Trimest. Sur L’image Géographique Les Formes Du Territ. 2018, 124, 1–18. [Google Scholar] [CrossRef]
- Brunet, R. La carte-modèle et les chorèmes. Mappemonde 1986, 4, 2–6. Available online: https://www.mgm.fr/PUB/Mappemonde/M486/p2-6.pdf (accessed on 28 June 2025). [CrossRef]
- Bielecka, E.; Markowska, A.; Dukaczewski, D. Applying chorems in the cartographic presentation of barriers to socio-economic development in Poland. Quaest. Geogr. 2024, 43, 113–123. [Google Scholar] [CrossRef]
- Fagandini Ruiz, F.; Villanueva, A.; Bazile, D. Chorematic modeling to represent dynamics in the quinoa agroecosystems in Peru. PLoS ONE 2024, 19, e0300464. [Google Scholar] [CrossRef]
- Brandt, P.A. Chorematics. The Dynamics of Lived Space. In The Relevance of René Thom: The Morphological Dimension in Today’s Sciences; Springer Nature: Cham, Switzerland, 2024; pp. 39–54. [Google Scholar] [CrossRef]
- Brunet, R. La Carte, Mode D’emploi; Fayard-Reclus: Paris, France, 1987. [Google Scholar]
- Reimer, A.W. Understanding Chorematic Diagrams: Towards a Taxonomy. Cartogr. J. 2010, 47, 330–350. [Google Scholar] [CrossRef]
- Jégou, L.; Touati, N.; Hidalgo, J. Proposals for the use of graphical models in urban climatic maps. Cybergeo. Eur. J. Geogr. 2022, 1–23. [Google Scholar] [CrossRef]
- Drăguleasa, I.-A. Post Covid Pandemic Adaptive Tourism Models in the South-West Oltenia Region. Ph.D. Thesis, University of Craiova, Craiova, Romania, 2025. Available online: https://www.ucv.ro/pdf/invatamant/educatie/programe_doctorat/teze_doctorat/programate_2025/draguleasa/rezumat_en.pdf (accessed on 30 June 2025).
- Laurini, R. A conceptual framework for geographic knowledge engineering. J. Vis. Lang. Comput. 2014, 25, 2–19. [Google Scholar] [CrossRef]
- Del Fatto, V.; Laurini, R.; Lopez, K.; Sebillo, M.; Vitiello, G. A chorem–based method for visualizing evolutionary scenarios. Inf. Vis. 2008, 7. Available online: https://geoanalytics.net/GeoVis08/a11.pdf (accessed on 31 July 2025).
- Lopez, K.; Laurini, R.; Del Fatto, V.; Sol, D.; Loreto, R.; Sebillo, M.; Vitiello, G. Visualizing Geographical Analysis Results from Spatial Databases Based on the Chorems. In Proceedings of the International Conference on Modeling, Simulation and Visualization Methods (MSV), Las Vegas, NV, USA, 13–16 July 2009; pp. 29–35. [Google Scholar]
- Zipf, A.; Richter, K.-F. Using Focus Maps to Ease Map Reading—Developing Smart Applications for Mobile Devices. KI 4/02 Special Issue Spatial Cognition. 2002, pp. 35–37. Available online: https://citeseerx.ist.psu.edu/document?repid=rep1&type=pdf&doi=0b90c266394b91adb3db67bc8f96e2108da21c73 (accessed on 28 June 2025).
- Šoltésová, M.; Iannaccone, B.; Štrba, Ľ.; Sidor, C. Application of GIS Technologies in Tourism Planning and Sustainable Development: A Case Study of Gelnica. ISPRS Int. J. Geo-Inf. 2025, 14, 120. [Google Scholar] [CrossRef]
- Acharya, A.; Mondal, B.K.; Bhadra, T.; Abdelrahman, K.; Mishra, P.K.; Tiwari, A.; Das, R. Geospatial Analysis of Geo-Ecotourism Site Suitability Using AHP and GIS for Sustainable and Resilient Tourism Planning in West Bengal, India. Sustainability 2022, 14, 2422. [Google Scholar] [CrossRef]
- Vuković, M. The application of GIS in sustainable tourism management. Econ. Sustain. Dev. 2022, 6, 53–62. [Google Scholar] [CrossRef]
- Drăguleasa, I.-A.; Niță, A.; Mazilu, M.; Constantinescu, E. Religious Tourism and Pilgrimage in Vâlcea County, South-West Oltenia Region: Motivations, Belief and Tourists’ Perceptions. Religions 2024, 15, 294. [Google Scholar] [CrossRef]
- Singh, P. Role of geographical information systems in tourism decision making process: A review. Inf. Technol. Tour. 2015, 15, 131–179. [Google Scholar] [CrossRef]
- Gavilanes Montoya, A.V.; Esparza Parra, J.F.; Chávez Velásquez, C.R.; Tito Guanuche, P.E.; Parra Vintimilla, G.M.; Mestanza-Ramón, C.; Vizuete, D.D.C. A Nature Tourism Route through GIS to Improve the Visibility of the Natural Resources of the Altar Volcano, Sangay National Park, Ecuador. Land 2021, 10, 884. [Google Scholar] [CrossRef]
- Zotic, V.; Puiu, V. The role of the integrated network concept in elaborating the territorial development choremes. Case study: The peri-urban zone of the Municipium of Bistriţa. Rom. Rev. Reg. Stud. 2006, 2, 65–76. [Google Scholar]
- Mihalca, I.A. Chinteni Municipality, traditional rural space vs. the Beginning of Suburbanization? Ann. Univ. Oradea Geogr. Ser./Analele Univ. Din Oradea Ser. Geogr. 2011, 21, 55–61. Available online: https://istgeorelint.uoradea.ro/Reviste/Anale/Art/2011-1/07_518_AUOG_Mihalca.pdf (accessed on 31 July 2025).
- Hognogi, G.G.; Pop, A. Built heritage in the land of Hațeg-Result of the historic evolution and contemporary urban planning tool. Rom. Rev. Reg. Stud. 2016, 12, 99–110. [Google Scholar]
- Klippel, A.; Richter, K.F.; Hansen, S. Wayfinding Choreme Maps. In Proceedings of the International Conference on Advances in Visual Information Systems, Amsterdam, The Netherlands, 5 July 2005; Springer: Berlin/Heidelberg, Germany, 2005; pp. 94–108. [Google Scholar]
- Klippel, A.; MacEachren, A.; Mitra, P.; Turton, I.; Jaiswal, A.; Soon, K.; Zhang, X. Wayfinding Choremes 2.0—Conceptual Primitives as A Basis for Translating Natural into Formal Language. In Proceedings of the International Workshop on Moving Objects and Natural Formal Language, Park City, UT, USA, 23 September 2008. [Google Scholar]
- Glander, T.; Peters, D.; Trapp, M.; Döllner, J. 3d Wayfinding Choremes: A Cognitively Motivated Representation of Route Junctions In Virtual Environments. In Proceedings of the Advances in GIScience: Proceedings of the 12th AGILE Conference, Hannover, Germany, 24–28 August 2009; Springer: Berlin/Heidelberg, Germany, 2009; pp. 407–427. [Google Scholar]
- Cherni, I.; Ouertani, S.; Faiz, S.; Servigne, S.; Laurini, R. Chorems: A new tool for Territorial Intelligence. In Proceedings of the 29th Urban Data Management Symposium (UDMS), London, UK, 29–31 May 2013. [Google Scholar]
- Johany, F.; Bimonte, S. A Framework for Spatio-Multidimensional Analysis Improved by Chorems: Application to Agricultural Data. In Proceedings of the International Conference on Data Management Technologies and Applications, Alsace, France, 20–22 July 2015; Springer International Publishing: Cham, Switzerland, 2015; pp. 59–80. [Google Scholar] [CrossRef]
- Dukaczewski, D.; Bielecka, E.; Markowska, A. Chorematic Diagrams-A Visual Representation of the Reality. In Proceedings of the 9th International Conference on Cartography and GIS, Nessebar, Bulgaria, 16–21 June 2024. [Google Scholar]
- Meddah, F.; Guerroudji, W.H. A chorem-based approach to visualizing COVID-19-related data. Cartogr. Geogr. Inf. Sci. 2024, 51, 297–310. [Google Scholar] [CrossRef]
- Drăguleasa, I.-A.; Niță, A.; Mazilu, M. Capitalization of Tourist Resources in the Post-COVID-19 Period—Developing the Chorematic Method for Oltenia Tourist Destination, Romania. Sustainability 2023, 15, 2018. [Google Scholar] [CrossRef]
- Guedes, A.S.; Jimenez, M.I.M. Spatial patterns of cultural tourism in Portugal. Tour. Manag. Perspect. 2015, 16, 107–115. [Google Scholar] [CrossRef]
- Wang, T.; Wang, L.; Ning, Z.-Z. Spatial pattern of tourist attractions and its influencing factors in China. J. Spat. Sci. 2020, 65, 327–344. [Google Scholar] [CrossRef]
- Wu, C.; Li, L.; He, X.; Wang, J. Spatial analysis of scenic spots in the Yangtze River Economic Belt. Resour. Sci. 2018, 40, 1196–1208. [Google Scholar] [CrossRef]
- Zhang, K.; Su, X.; Su, K.; Wang, Y. Research on Distribution Characteristic of Tourism Resource in Beijing-Tianjin-Hebei Region Based on POI Big Data. Areal Res. Dev. 2021, 40, 103–108+114. [Google Scholar]
- Tang, J.X.; Ma, M.Y. Spatial Layout and Linkage Mode of Industrial Tourism in Changsha-Zhuzhou-Xiangtan Urban Agglomeration from a Multi-scale Perspective. Sci. Geogr. Sin. 2021, 41, 1428–1436. [Google Scholar]
- Xu, Y.; Zhang, X.; Zhang, K.; Yu, J.; Liu, J. Spatial Pattern and Influencing Factors of Tourist Attractions in Coastal Cities: A Case Study of Qingdao. ISPRS Int. J. Geo-Inf. 2024, 13, 444. [Google Scholar] [CrossRef]
- Xie, Y.; Meng, X.; Cenci, J.; Zhang, J. Spatial Pattern and Formation Mechanism of Rural Tourism Resources in China: Evidence from 1470 National Leisure Villages. ISPRS Int. J. Geo-Inf. 2022, 11, 455. [Google Scholar] [CrossRef]
- Popescu, L.; Badita, A.; Mazilu, M. Can rural tourism foster local development? perspectives on the future of rural tourism in Romania. J. Tour. Chall. Trends 2014, 7, 69–88. [Google Scholar]
- Coroș, M.M.; Privitera, D.; Păunescu, L.M.; Nedelcu, A.; Lupu, C.; Ganușceac, A. Mărginimea Sibiului Tells Its Story: Sustainability, Cultural Heritage and Rural Tourism—A Supply-Side Perspective. Sustainability 2021, 13, 5309. [Google Scholar] [CrossRef]
- Poruțiu, A.; Tirpe, O.P.; Oroian, C.; Mihai, V.C.; Chiciudean, G.O.; Chiciudean, D.I.; Poruțiu, C. Analysis on Tourists’ Preferences for Rural Tourism Destinations in Romania. Societies 2021, 11, 92. [Google Scholar] [CrossRef]
- Yangutova, A.; Dong, S.; Cheng, H.; Li, F.; Zhang, M.; Xu, S. Classification and Spatial Pattern of Mongolian Ethno-Cultural Tourism Resources in the Republic of Buryatia (Russia). Geogr. Nat. Resour. 2022, 43, S109–S115. [Google Scholar] [CrossRef]
- Xiong, S.; Wang, H.; Liao, Z.; Hashim, R. Exploring the factors and spatial patterns of national night cultural tourism consumption agglomeration zones in China. Heliyon 2024, 10, e24132. [Google Scholar] [CrossRef]
- Niță, A.; Drăguleasa, I.-A. Empirical Investigation of the Motivation and Perceptions of Tourists Visiting Spa Resorts in the Vâlcea Subcarpathians, Romania. Sustainability 2025, 17, 6590. [Google Scholar] [CrossRef]
- Wang, H.; Feng, Y.; Xu, S.; Xu, X.; Jiang, K.; Nie, X.; Zhou, N. Analysis of spatial-temporal pattern, dynamic evolution and influencing factors of health tourism development in China. Sci. Rep. 2023, 13, 15436. [Google Scholar] [CrossRef]
- Light, D.; Crețan, R.; Chapman, A.; Dragan, A.; Arba-Harambașa, F.Y. Trigger events, moments, and destination evolution in a post-socialist context. Tour. Geogr. 2025, 27, 313–332. [Google Scholar] [CrossRef]
- Nistoreanu, P.; Aluculesei, A.-C.; Avram, D. Is Green Marketing a Label for Ecotourism? The Romanian Experience. Information 2020, 11, 389. [Google Scholar] [CrossRef]
- Oltean, F.D.; Curta, P.A.; Nagy, B.; Huseyn, A.; Gabor, M.R. Changes in Tourists’ Perceptions of Community-Based Ecotourism (CBET) After COVID-19 Pandemic: A Study on the Country of Origin and Economic Development Level. ISPRS Int. J. Geo-Inf. 2025, 14, 146. [Google Scholar] [CrossRef]
- Rusu, R. Organizarea Spațiului Geografic Și Amenajarea Teritoriului: Caiet de Lucrări Practice; Universitatea “Babeș-Bolyai”: Cluj-Napoca, Romania, 2004. [Google Scholar]
- National Institute of Statistics. TEMPO Online. Available online: http://statistici.insse.ro:8077/tempo-online/#/pages/tables/insse-table (accessed on 28 July 2025).
- Plan de Amenajare a Teritoriului Județean Vâlcea. Available online: http://www.cjvalcea.ro/index.php/urbanism-si-amenajarea-teritoriului/plan-de-amenajare-a-teritoriului-judetean-valcea-partea-1 (accessed on 28 July 2025).
- Cocean, P.; Filip, S. Geografia Regională a României. Ediția a II-a; Editura Presa Universitară Clujeană: Cluj-Napoca, Romania, 2011. [Google Scholar]
- Open Street Map—Export. Available online: https://www.openstreetmap.org/export#map=8/45.487/23.450 (accessed on 18 April 2025).
- Date GIS Ministerul Mediului, Apelor și Pădurilor. Available online: https://mmediu.ro/portal-gis/date-spatiale/ (accessed on 18 April 2025).
- Geo-Spațial. Romania: General Vector Datasets. 2025. Available online: www.geo-spatial.org (accessed on 28 July 2025).
- National Agency for Cadastre and Real Estate Publicity. Available online: https://geoportal.ancpi.ro/portal/apps/webappviewer/index.html?id=faeba2d173374445b1f13512bd477bb2 (accessed on 28 July 2025).
- Ilieş, A.; Ilieş, D.C.; Tătar, C.; Ilieş, M. Geography of tourism in Romania. In The Geography of Tourism of Central and Eastern European Countries; Springer International Publishing: Cham, Switzerland, 2017; pp. 329–374. [Google Scholar] [CrossRef]
- Ibănescu, B.-C.; Stoleriu, O.M.; Munteanu, A.; Iațu, C. The Impact of Tourism on Sustainable Development of Rural Areas: Evidence from Romania. Sustainability 2018, 10, 3529. [Google Scholar] [CrossRef]
- Cehan, A.; Iațu, C.; Eva, M.; Ibănescu, B.-C.; Bulai, M. Territorial dynamics of tourism in Romania: A long-term perspective (1990–2016). Hum. Geogr. J. Stud. Res. Hum. Geogr. 2019, 13, 23–44. [Google Scholar] [CrossRef]
- Light, D.; Creţan, R.; Voiculescu, S.; Jucu, I.S. Introduction: Changing tourism in the cities of post-communist central and eastern Europe. J. Balk. Near East. Stud. 2020, 22, 465–477. [Google Scholar] [CrossRef]
- Mitrică, B.; Şerban, P.-R.; Mocanu, I.; Damian, N.; Grigorescu, I.; Dumitraşcu, M.; Dumitrică, C. Developing an Indicator-Based Framework to Measure Sustainable Tourism in Romania. A Territorial Approach. Sustainability 2021, 13, 2649. [Google Scholar] [CrossRef]
- Niță, A. Rethinking Lynch’s “The Image of the City” Model in the Context of Urban Fabric Dynamics. Case Study: Craiova, Romania. J. Settllements Spat. Plan. 2021, 7, 5–14. [Google Scholar] [CrossRef]
- Turtureanu, A.-G.; Pripoaie, R.; Cretu, C.-M.; Sirbu, C.-G.; Marinescu, E.Ş.; Talaghir, L.-G.; Chițu, F. A Projection Approach of Tourist Circulation under Conditions of Uncertainty. Sustainability 2022, 14, 1964. [Google Scholar] [CrossRef]
- Cehan, A.; Iaţu, C. A geographical perspective on the impact of covid-19 on tourism demand in Romania. Geoj. Tour. Geosites 2024, 52, 165–175. [Google Scholar] [CrossRef]
- Gordan, M.-I.; Popescu, C.A.; Călina, J.; Adamov, T.C.; Mănescu, C.M.; Iancu, T. Spatial Analysis of Seasonal and Trend Patterns in Romanian Agritourism Arrivals Using Seasonal-Trend Decomposition Using LOESS. Agriculture 2024, 14, 229. [Google Scholar] [CrossRef]
- Simeanu, C.; Andronachi, V.-C.; Usturoi, A.; Davidescu, M.A.; Mintaș, O.-S.; Hoha, G.-V.; Simeanu, D. Rural Tourism: A Factor of Sustainable Development for the Traditional Rural Area of Bucovina, Romania. Sustainability 2025, 17, 3604. [Google Scholar] [CrossRef]
- Zamparini, L.; Vergori, A.S.; Arima, S. Assessing the determinants of local tourism demand: A simultaneous equations model for the Italian provinces. Tour. Econ. 2017, 23, 981–992. [Google Scholar] [CrossRef]
- Santos, G.E.D.O.; Ramos, V.; Rey-Maquieira, J. Length of stay at multiple destinations of tourism trips in Brazil. J. Travel Res. 2015, 54, 788–800. [Google Scholar] [CrossRef]
- García-Sánchez, A.; Fernández-Rubio, E.; Collado, M.D. Daily expenses of foreign tourists, length of stay and activities: Evidence from Spain. Tour. Econ. 2013, 19, 613–630. [Google Scholar] [CrossRef]
- Song, H.; Li, G.; Witt, S.F.; Fei, B. Tourism demand modelling and forecasting: How should demand be measured? Tour. Econ. 2010, 16, 63–81. [Google Scholar] [CrossRef]
- Kumar, N.; Kumar, R.R.; Kumar, R.; Stauvermann, P.J. Is the tourism–growth relationship asymmetric in the Cook Islands? Evidence from NARDL cointegration and causality tests. Tour. Econ. 2020, 26, 658–681. [Google Scholar] [CrossRef]
- Popescu, A.; Plesoianu, D. Trends of tourist arrivals and overnight stays in the Maramures County, Romania, 2007–2016 and forecast for 2017–2021. Sci. Pap. Ser. Manag. Econ. Eng. Agric. Rural Dev. 2017, 17, 281–291. [Google Scholar]
- Montaño, J.; Rossellό, J.; Sansό, A. A new method for estimating tourists’ length of stay. Tour. Manag. 2019, 75, 112–120. [Google Scholar] [CrossRef]
- Vergori, A.S. Patterns of seasonality and tourism demand forecasting. Tour. Econ. 2017, 23, 1011–1027. [Google Scholar] [CrossRef]
- Borrego-Domínguez, S.; Isla-Castillo, F.; Rodríguez-Fernández, M. Determinants of Tourism Demand in Spain: A European Perspective from 2000–2020. Economies 2022, 10, 276. [Google Scholar] [CrossRef]
- Biagi, B.; Pulina, M. Bivariate VAR models to test Granger causality between tourist demand and supply: Implications for regional sustainable growth. Pap. Reg. Sci. 2009, 88, 231–245. [Google Scholar] [CrossRef]
- Palmer, T.; Riera, A. Tourism and environmental taxes. With special reference to the “Balearic ecotax”. Tour. Manag. 2003, 24, 665–674. [Google Scholar] [CrossRef]
- Ministerul Economiei, Digitalizării, Antreprenoriatului și Turismului. Available online: https://turism.gov.ro/web/autorizare-turism/ (accessed on 31 July 2025).
- Bertin, J. Semiology of Graphics; University of Wisconsin Press: Madison, WI, USA, 1983. [Google Scholar]
- Hijmans, R.J.; Van Etten, J. Raster: Geographic Analysis and Modeling with Raster Data; R Package Version 2.0-12. 2012. Available online: https://www.researchgate.net/publication/285308589_Geographic_analysis_and_modeling_with_raster_data (accessed on 30 June 2025).
- Cherni, I.; Faiz, S.; Laurni, R. ChoreMAP: Extraction and Visualization of Visual Summaries Based Chorems. In Proceedings of the 2015 6th International Conference on Information Systems and Economic Intelligence (SIIE), Hammamet, Tunisia, 12–14 February 2015; pp. 10–17. [Google Scholar]
- Cherni, I.; Lopez, K.; Laurini, R.; Faiz, S. ChorML: Résumés Visuels de Bases de Données Géographiques. In Proceedings of the Conférence Internationale de Géomatique et Analyse Spatiale (SAGEO), La Rochelle, France, 25 November 2009. [Google Scholar]
- Cherni, I.; Faiz, S.; Laurini, R.; Warghi, M. ChoreMAP: Extracting and Displaying Visual Database Summaries Tool. In Proceedings of the ThinkMind Eknow, Lisbon, Portugal, 22–27 February 2015. [Google Scholar]
- Laurini, R.; Sebillo, M.; Vitiello, G.; Sol-Martinez, D.; Raffort, F. Computer-generated visual summaries of spatial databases: Chorems or not chorems? SAPI EN. S. Surv. Perspect. Integr. Environ. Soc. 2009, 2, 1–8. [Google Scholar]
- De Chiara, D.; Del Fatto, V.; Laurini, R.; Sebillo, M.; Vitiello, G. A chorem-based approach for visually analyzing spatial data. J. Vis. Lang. Comput. 2011, 22, 173–193. [Google Scholar] [CrossRef]
- Santana-Jiménez, Y.; Suárez-Vega, R.; Hernández, J.M. Spatial and environmental characteristics of rural tourism lodging units. Anatolia Int. J. Tour. Hosp. Res. 2011, 22, 89–101. [Google Scholar] [CrossRef]
- Desculțu Grigore, M.-I.; Niță, A.; Drăguleasa, I.-A.; Mazilu, M. Geotourism, a New Perspective of Post-COVID-19-Pandemic Relaunch through Travel Agencies—Case Study: Bucegi Natural Park, Romania. Sustainability 2024, 16, 985. [Google Scholar] [CrossRef]
- Strategia naţională de Dezvoltare a Ecoturismului în România—Context, Viziune și Obiective—2018–2027. Available online: https://turism.gov.ro/web/wp-content/uploads/2018/11/Anexa-Strategie-ecoturism.pdf (accessed on 28 July 2025).
- Crețan, R.; Light, D.; Richards, S.; Dunca, A.M. Encountering the victims of Romanian communism: Young people and empathy in a memorial museum. Eurasian Geogr. Econ. 2018, 59, 632–656. [Google Scholar] [CrossRef]
- Light, D.; Creţan, R.; Dunca, A.M. Education and post-communist transitional justice: Negotiating the communist past in a memorial museum. Southeast Eur. Black Sea Stud. 2019, 19, 565–584. [Google Scholar] [CrossRef]
- Light, D.; Creţan, R.; Dunca, A.M. Museums and transitional justice: Assessing the impact of a memorial museum on young people in post-communist Romania. Societies 2021, 11, 43. [Google Scholar] [CrossRef]
- Bunruamkaew, K.; Murayam, Y. Site suitability evaluation for ecotourism using GIS & AHP: A case study of Surat Thani province, Thailand. Procedia-Soc. Behav. Sci. 2011, 21, 269–278. [Google Scholar] [CrossRef]
- Ranaweerage, E.; Ranjeewa, A.D.; Sugimoto, K. Tourism-induced disturbance of wildlife in protected areas: A case study of free ranging elephants in Sri Lanka. Glob. Ecol. Conserv. 2015, 4, 625–631. [Google Scholar] [CrossRef]
- Sugimoto, K.; Ota, K.; Suzuki, S. Visitor Mobility and Spatial Structure in a Local Urban Tourism Destination: GPS Tracking and Network analysis. Sustainability 2019, 11, 919. [Google Scholar] [CrossRef]
- Anjo, A.M.; Sousa, B.; Santos, V.; Lopes Dias, Á.; Valeri, M. Lisbon as a literary tourism site: Εssays of a digital map of Pessoa as a new trigger. JTHSM—J. Tour. Herit. Serv. Mark. 2021, 7, 58–67. [Google Scholar] [CrossRef]
- Carson, S.; Hawkes, L.; Gislason, K.; Martin, S. Practices of literary tourism: An Australian case study. Int. J. Cult. Tour. Hosp. Res. 2013, 7, 42–50. [Google Scholar] [CrossRef]
- Hoppen, A.; Brown, L.; Fyall, A. Literary tourism: Opportunities and challenges for the marketing and branding of destinations? J. Destin. Mark. Manag. 2014, 3, 37–47. [Google Scholar] [CrossRef]
- Eboy, O.V. Tourism mapping: An overview of cartography and the use of GIS. BIMP-EAGA J. Sustain. Tour. Dev. 2017, 6, 61–67. [Google Scholar] [CrossRef]
- Zatelli, P.; Gabellieri, N.; Besana, A. In the Footsteps of Grandtourists: Envisioning Itineraries in Inner Areas for Literary and Responsible Tourism. ISPRS Int. J. Geo-Inf. 2025, 14, 67. [Google Scholar] [CrossRef]
- Balsalobre-Lorente, D.; Shahbaz, M.; Roubaud, D.; Farhani, S. How economic growth, renewable electricity and natural resources contribute to CO2 emissions? Energy Policy 2018, 113, 356–367. [Google Scholar] [CrossRef]
- Hassan, S.T.; Xia, E.; Khan, N.H.; Shah, S.M.A. Economic growth, natural resources, and ecological footprints: Evidence from Pakistan. Environ. Sci. Pollut. Res. 2019, 26, 2929–2938. [Google Scholar] [CrossRef]
- Zafar, M.W.; Zaidi, S.A.H.; Khan, R.N.; Mirza, F.M.; Hou, F.; Kirmani, S.A.A. The impact of natural resources, human capital, and foreign direct investment on the ecological footprint: The case of the United States. Resour. Policy 2019, 63, 101428. [Google Scholar] [CrossRef]
- Robaina-Alves, M.; Moutinho, V.; Costa, R. Change in energy-related CO2 (carbon dioxide) emissions in Portuguese tourism: A decomposition annalysis from 2000 to 2008. J. Clean. Prod. 2016, 111, 520–528. [Google Scholar] [CrossRef]
- Lupu, C.; Padhi, S.S.; Pati, R.K.; Stoleriu, O.M. Tourist choice of heritage sites in Romania: A conjoint choice model of site attributes and variety seeking behavior. J. Herit. Tour. 2021, 16, 646–668. [Google Scholar] [CrossRef]
- Caciora, T.; Herman, G.V.; Ilieș, A.; Baias, Ș.; Ilieș, D.C.; Josan, I.; Hodor, N. The Use of Virtual Reality to Promote Sustainable Tourism: A Case Study of Wooden Churches Historical Monuments from Romania. Remote Sens. 2021, 13, 1758. [Google Scholar] [CrossRef]
- Mănescu, C.; Mateoc-Sîrb, N.; Adamov, T.C.; Marin, D.; Moisa, S.; Gordan, M.-I. Identification of Opportunities for Capitalizing on Tourist Potential in Hunedoara County through Rural Tourism Activities and Supporting the Development of the Local Community. Sustainability 2024, 16, 8296. [Google Scholar] [CrossRef]
- Oancea, O.-A.; Dragan, A.; Crețan, R. Derelict Rural Heritage: The Case of the Castles in the Lower Mureș Valley, Romania. Heritage 2025, 8, 364. [Google Scholar] [CrossRef]
- Ingram, H. Cultural tourism: The partnership between tourism and cultural heritage management. Int. J. Contemp. Hosp. Manag. 2003, 15, 413. [Google Scholar] [CrossRef]
- Mousavi, S.S.; Doratli, N.; Mousavi, S.N.; Moradiahari, F. Defining Cultural Tourism. In Proceedings of the International Conference on Civil, Architecture and Sustainable Development, London, UK, 1–2 December 2016; Conference Paper. pp. 70–75. [Google Scholar]
- Ancuța, C.; Jucu, I.S. Sustainable Rural Development through Local Cultural Heritage Capitalization—Analyzing the Cultural Tourism Potential in Rural Romanian Areas: A Case Study of Hărman Commune of Brașov Region in Romania. Land 2023, 12, 1297. [Google Scholar] [CrossRef]
Disclaimer/Publisher’s Note: The statements, opinions and data contained in all publications are solely those of the individual author(s) and contributor(s) and not of MDPI and/or the editor(s). MDPI and/or the editor(s) disclaim responsibility for any injury to people or property resulting from any ideas, methods, instructions or products referred to in the content. |
© 2025 by the authors. Published by MDPI on behalf of the International Society for Photogrammetry and Remote Sensing. Licensee MDPI, Basel, Switzerland. This article is an open access article distributed under the terms and conditions of the Creative Commons Attribution (CC BY) license (https://creativecommons.org/licenses/by/4.0/).