1. Introduction
Benford’s Law is a mathematical phenomenon that describes the counterintuitive distribution of leading digits in many naturally occurring datasets. According to this law, not all digits from 1 to 9 are equally likely to appear as the leading digit. The digit 1 appears as the leading digit in about 30% of cases, with the probability decreasing as the leading digit increases.
Although it might initially seem like a purely mathematical curiosity, Benford’s Law surprisingly often occurs in nature. Joannes-Boyau et al. [
1] showed that travelled distances of hurricanes since the 1840s satisfy Benford’s Law. Sambridge et al. [
2] demonstrated that leading-digit distributions of earthquake depths adhere closely to Benford’s Law. More recent studies confirmed compliance for earthquake magnitudes [
3] and recurrence times of seismic events [
4]. Benford’s Law is capable of identifying quantum phase transitions in a manner similar to its application in detecting earthquakes [
5]. Consequently, despite their fundamentally different physical origins, both seismic activity and quantum cooperative phenomena can be analysed using comparable techniques. This law is evident across a wide range of astronomical datasets as well. The intensity of gamma rays detected on Earth by the Fermi space telescope and the rotational frequencies of spinning stellar remnants known as pulsars both satisfy Benford’s Law [
6]. The distances of galaxies and stars satisfy Benford’s Law too [
7], as well as the masses of exoplanets [
2]. The law does not apply universally, yet it recurs in a remarkably wide range of datasets. Seismic signals produced by debris flows satisfy Benford’s Law, whereas those caused by ambient noise (e.g., seismic data from rockfalls) do not [
8]. It is already well established that Benford’s Law also applies to many datasets created by humans, such as financial, economic, bank transactions [
9], accounting records [
10], tax data [
11], gross domestic product figures [
12], etc. Also, socio-geographical distances between cities [
13] follow this statistical distribution. For an overview of applications and exercises, see, e.g., ref. [
14] and the references therein.
The fact that Benford’s distribution appears in data from many different natural areas relates to the fact that nature constantly produces processes that span several orders of magnitude and exhibit multiplicative or exponential tendencies.
Recent studies have shown that Benford’s Law can reveal spatial and regional patterns in geographic datasets [
15], but its application within the field of geographical information remains relatively underexplored [
16]. In the context of spatial analysis, the significance of complying with Benford’s Law can be seen in its role as an indicator of the naturalness, quality, and integrity of spatial data. Compliance with Benford’s Law may indicate that the data in question were generated naturally rather than through artificial partitioning. The law helps in detecting spatial anomalies or inconsistencies in data processing. Benford’s Law can also serve as a diagnostic tool during data preprocessing prior to spatial modeling, machine learning, or geostatistical analyses. In contrast to well-established geographic principles such as Tobler’s laws [
17,
18,
19], Benford’s Law has received limited attention regarding spatial data, particularly in the context of infrastructure and transport networks.
A notable exception demonstrating the applicability of Benford’s Law in a spatial context is the study by Kopczewska and Kopczewski [
13], which examines the geographical distribution of cities and their populations. In work [
13], the authors explore the detection of a hidden order that drives the observed spatial heterogeneity. They view the geographical system of cities as a complex, nonlinear, three-dimensional network that is neither random nor independent, but instead exhibits strong spatial heterogeneity. They explain this hidden order through the lens of Benford’s Law. Since Benford’s Law holds for natural datasets, they argue that spatial phenomena such as natural urbanization tend to conform to Benford’s distribution, whereas spatial processes governed by artificial organizational rules (e.g., political boundaries) deviate from it. By comparing the level of conformity to Benford’s distribution, the authors show that the mutual 3D socio-geographical distances between populations and cities in most countries follow Benford’s Law, indicating that city geolocations exhibit a natural spatial distribution. Based on an analysis of historical settlement patterns, they conclude that the geolocation of cities and inhabitants worldwide has followed an evolutionary process leading to a natural spatial arrangement consistent with Benford’s Law.
A comparison of the distribution of several numerical properties of geographic objects with Benford’s distribution is presented in the study by [
16]. The author investigates whether the numerical attributes of geographic entities conform to Benford’s Law. The results show that the examined numerical properties correspond to Benford’s Law to a certain extent, with only small differences observed between different types of geographic objects. The spatial patterns of deviations from Benford’s Law are similar for some aspects, but differ considerably for others. This finding suggests that there is no general rule determining which numerical properties, geographic objects, or spatial regions comply with Benford’s Law. In this sense, a more detailed examination of Benford’s Law in the context of geographic information and across various datasets represents a logical step toward its future application.
A new line of research on Benford’s Law in the spatial context is also outlined by Fernandes, Ciardhuáin, and Antunes [
20], who investigated whether network traffic data, such as packet sizes and connection counts, conform to Benford’s and Zipf’s laws. They found that integrating Benford’s test with several different metrics can effectively identify anomalies in data flow (e.g., cyberattacks). Although this does not concern road traffic infrastructure, the underlying principle is analogous to traffic flow.
In the broader context of spatial analysis, data applicability, and validation related to the use of Benford’s Law, several open questions (research gaps) remain that should be addressed in studies. Most existing works analyse the distribution of digits, but only rarely investigate whether deviations from Benford’s Law exhibit spatial autocorrelation. Such an approach could reveal spatial “hotspots” of unreliable data within a territory [
1,
16].
Kopczewska and Kopczewski [
13] and Szabó et al. [
21] have pointed out that the literature lacks reference values or “baseline” for Benfords’ distributions for different types of geographic data (e.g., road distances, parcel areas, traffic intensities). Without such benchmarks, it is difficult to interpret what constitutes a significant deviation.
Studies by Yang et al. [
22] and Fernandes et al. [
20] have shown that Benford’s distribution has been tested in time series data (e.g., sediment motion), but no research has yet examined the spatio-temporal behavior of Benford’s conformity.
Mansouri et al. [
23] and Joannes-Boyau et al. [
1] emphasised that Benfords’ tests are currently applied only to a single dataset at a time. In practice, however, traffic data originate from multiple sensors, GPS devices, and systems. There is also a lack of research applying Benford’s analysis to assess consistency between different sources of traffic data. Moreover, various studies employ different metrics, thresholds, and sample sizes.
In the context of spatial data, there is still no unified methodological framework defining when a dataset is sufficiently large and suitable for Benford’s analysis [
23,
24].
Despite the considerable number of research gaps that have emerged in recent years, we focused on addressing at least one of them–specifically, the gap highlighted by Kopczewska and Kopczewski [
13]: the lack of studies examining the spatial application of Benford’s Law in the context of infrastructure and transportation networks. This research gap motivated us to investigate whether anthropogenic activities also generate datasets that follow this law. Our work was partly inspired by Mocnik’s study [
16], in which the author argues for the relevance of research that analyses subsets of OpenStreetMap data to determine which parts conform to Benford’s Law and which do not.
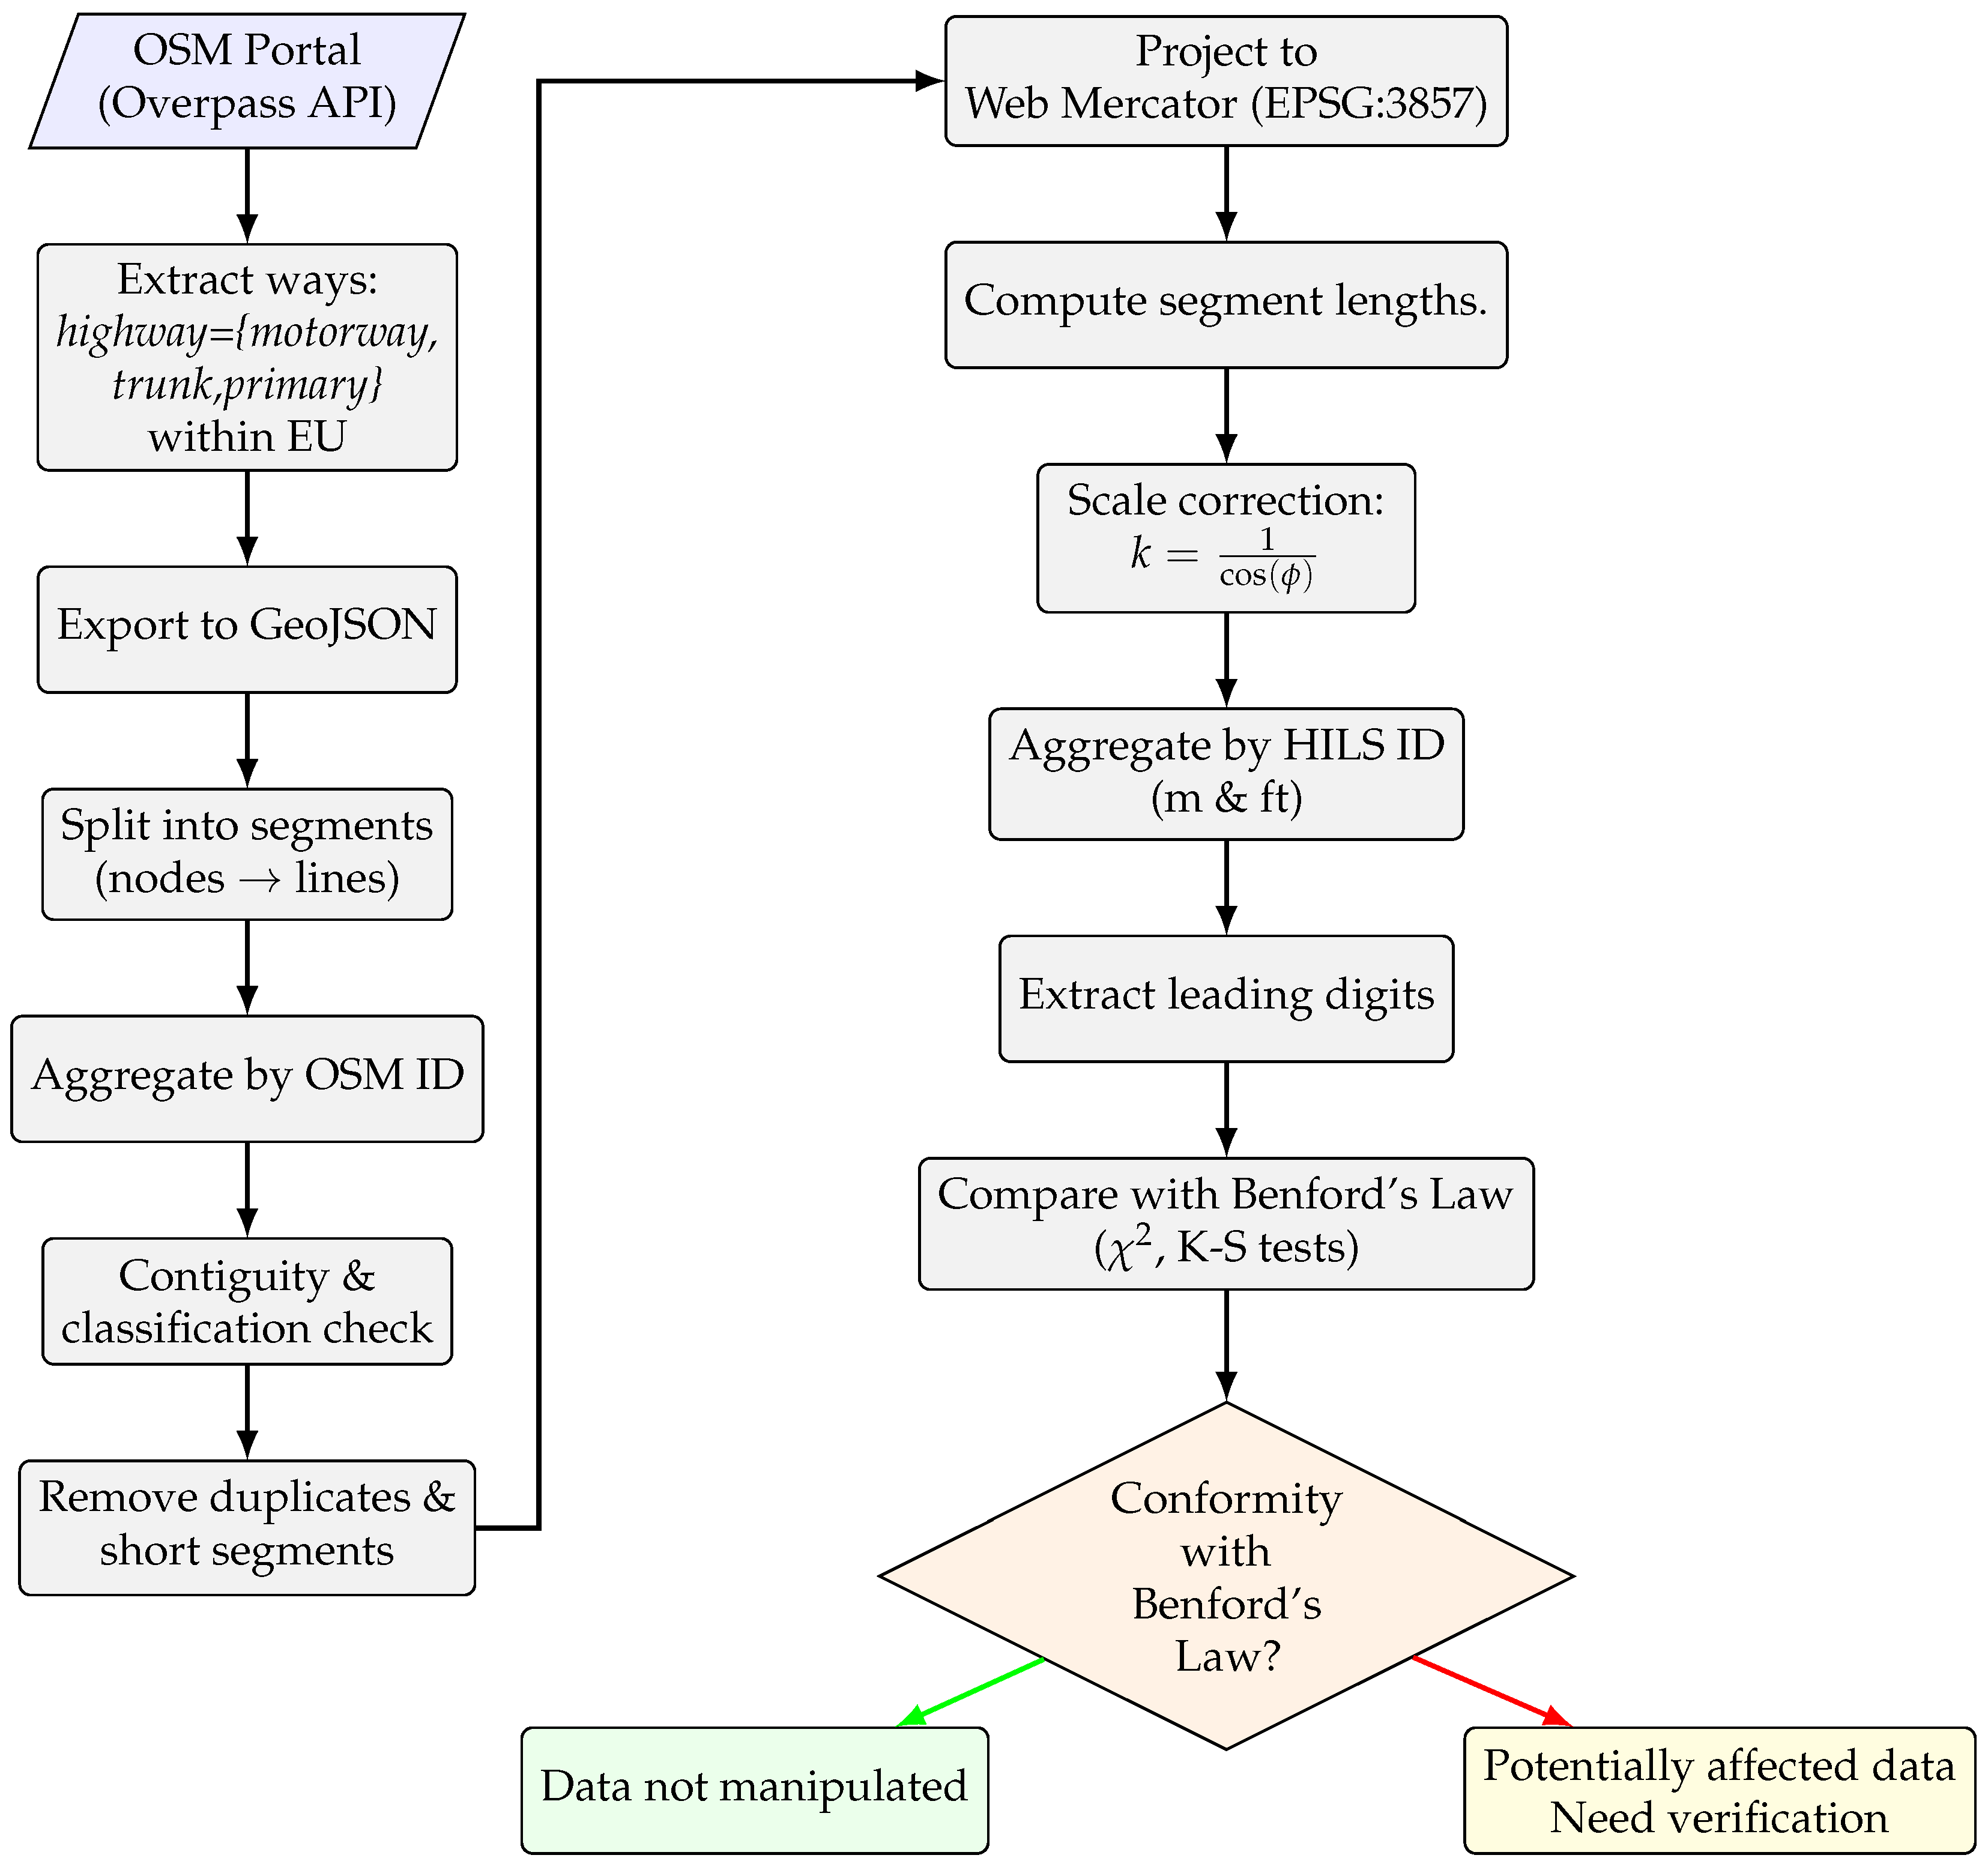
In this paper, we examine whether the outcomes of anthropogenic geographic activities, specifically transport infrastructure, conform to Benford’s Law. The lengths of higher-level segments of the main road network of 27 European Union member states were used in the analysis. To assess whether the higher-level segment length data from all European Union countries conform to Benford’s distribution, the Pearson’s test of association and p-value were employed. The findings reliably indicate low values and high p-values, suggesting a strong alignment between observed and expected distributions. The Kolmogorov–Smirnov test was used to verify the observation. Moreover, the relationship between the higher-level segment lengths and the leading digits of these lengths was analysed.
3. Experiments and Discussion on the Results
The statistic, supported by the p-value, and K-S test were evaluated in this study. Furthermore, to gain a more comprehensive understanding of the relationship between the distribution of the leading digits of HILS lengths of the main road network and the actual lengths of these HILSs, a graphical comparison and assessment were conducted.
3.1. Statistic, Kolmogorov-Smirnov Test, and p-Value
To perform hypothesis testing, the following null hypothesis was formulated:
“The leading digits of the HILSs of the main road network of EU member states follow Benford’s Law.”
In order to evaluate the hypothesis, a statistic, K-S test, and p-value were calculated at a significance level. Any deviations from the expected distribution were analysed and interpreted.
Calculating the p-value in relation to the statistic is essential for deciding whether to accept or reject the null hypothesis; if , the data are consistent with Benford’s Law, and the null hypothesis is not rejected, while if , the data are not consistent with Benford’s Law, and the null hypothesis is rejected.
One could argue that the
test performs well mainly with small to medium sample sizes, as it becomes very sensitive with extremely large datasets (as is the case here). In such cases, even minor deviations can lead to the rejection of the null hypothesis, even if they are practically insignificant. Therefore, for large datasets, alternative measures such as the Euclidean distance [
38], Mean Absolute Deviation [
39], or Kolmogorov-Smirnov test [
37] are often recommended. These metrics assess the magnitude of deviation between the empirical and theoretical distributions [
40]. However, they do not provide a formal statistical test (such as the one that produces a
p-value), and it is not always clear what constitutes an acceptable small deviation from Benford’s Law. This lack of clarity was a decisive factor in choosing the
test with the
p-value in this study. However, in an effort to obtain additional validation of the reliability of the proposed claims, to verify results, the one-sample Kolmogorov–Smirnov test was used as well.
In the initial stage of the experiment, the subset
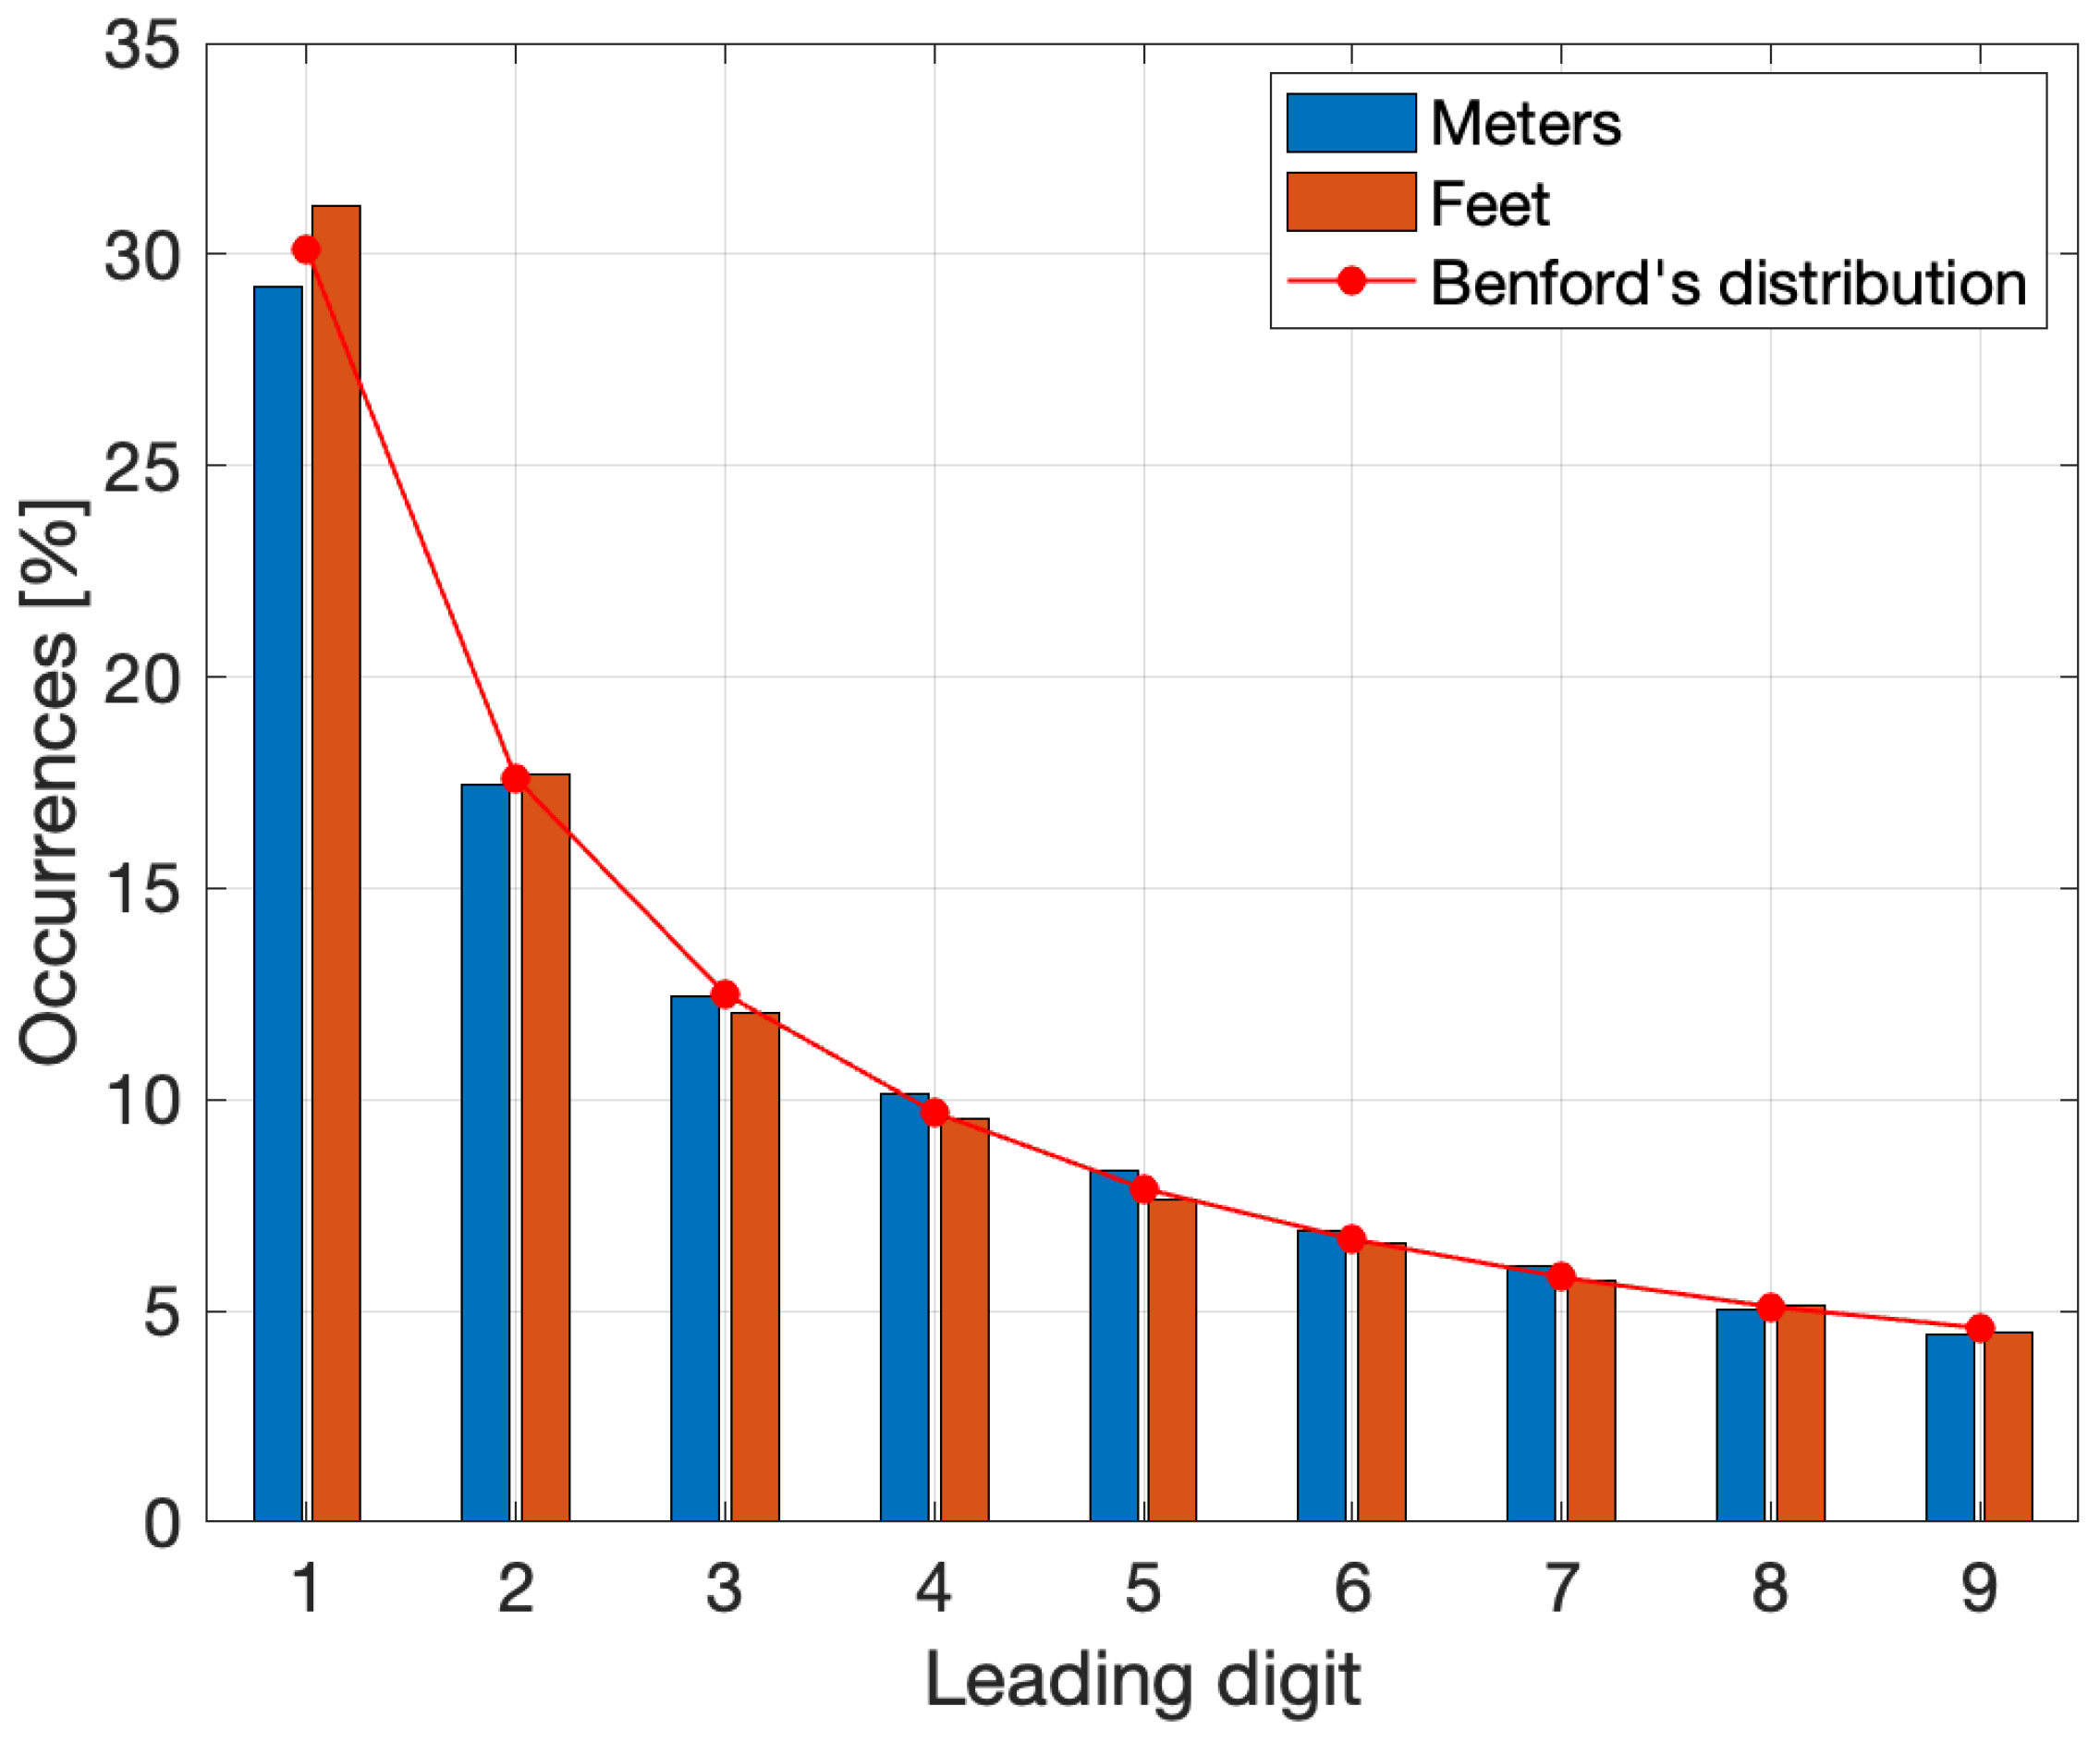
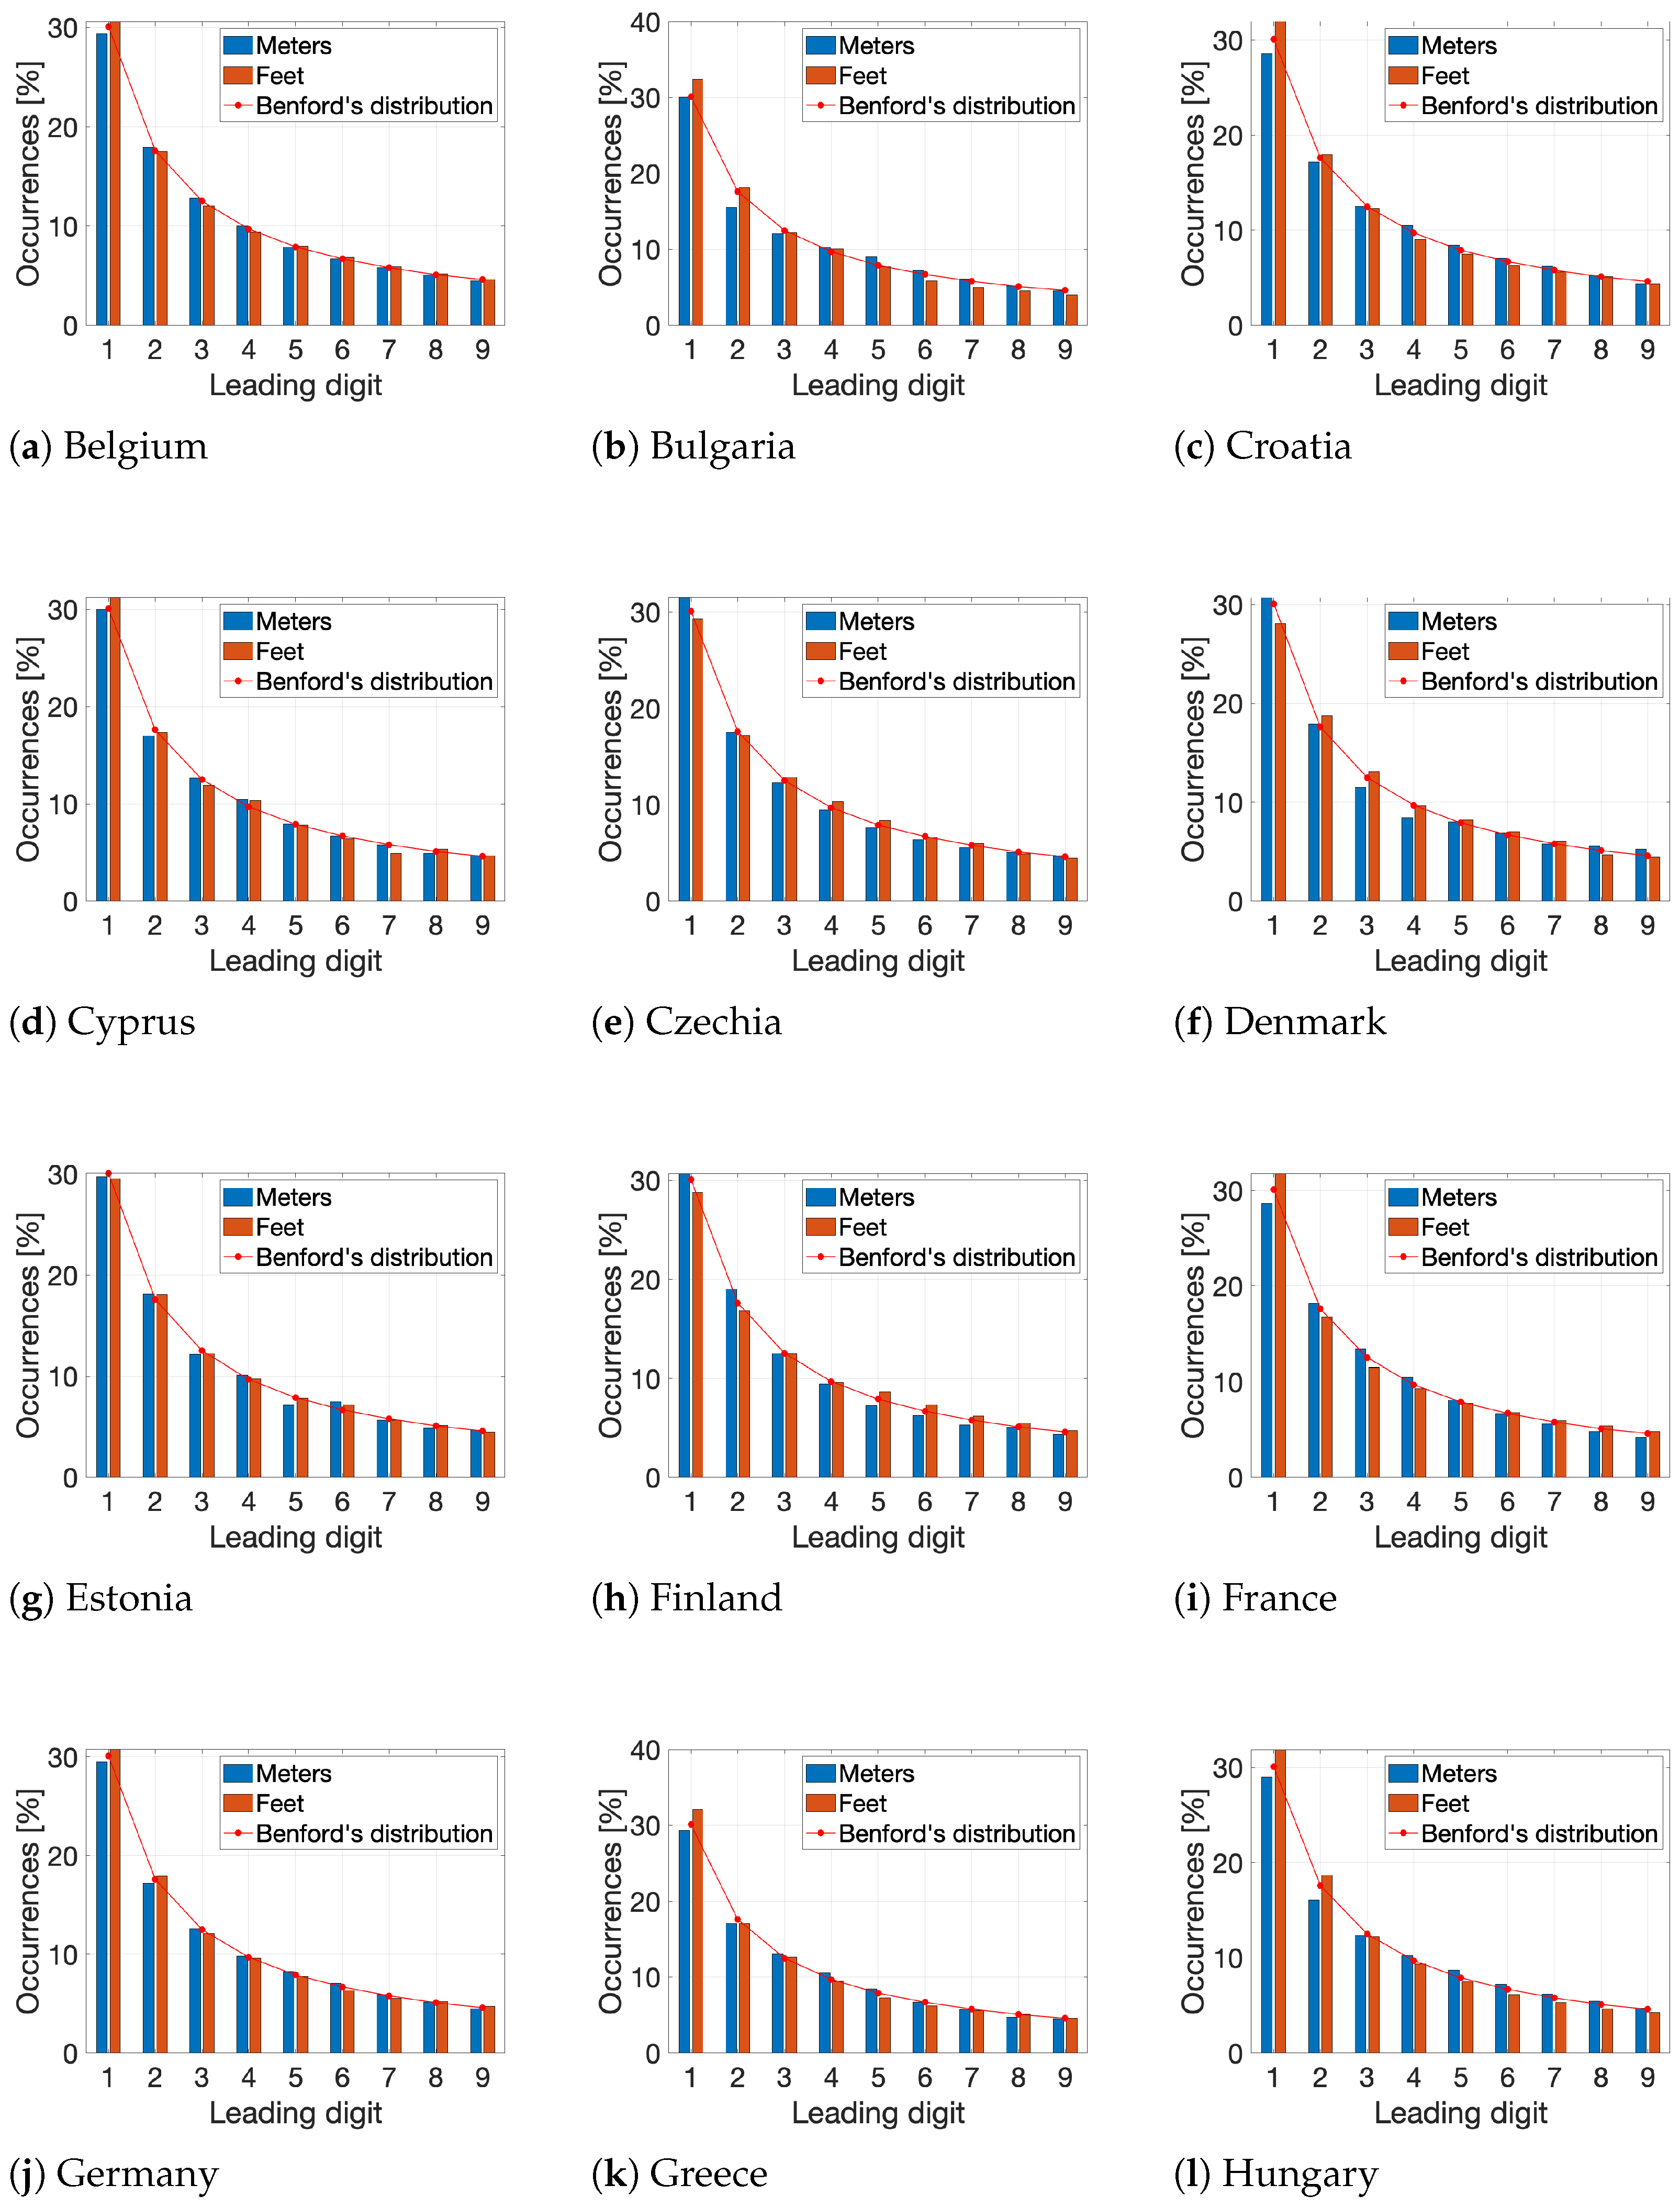
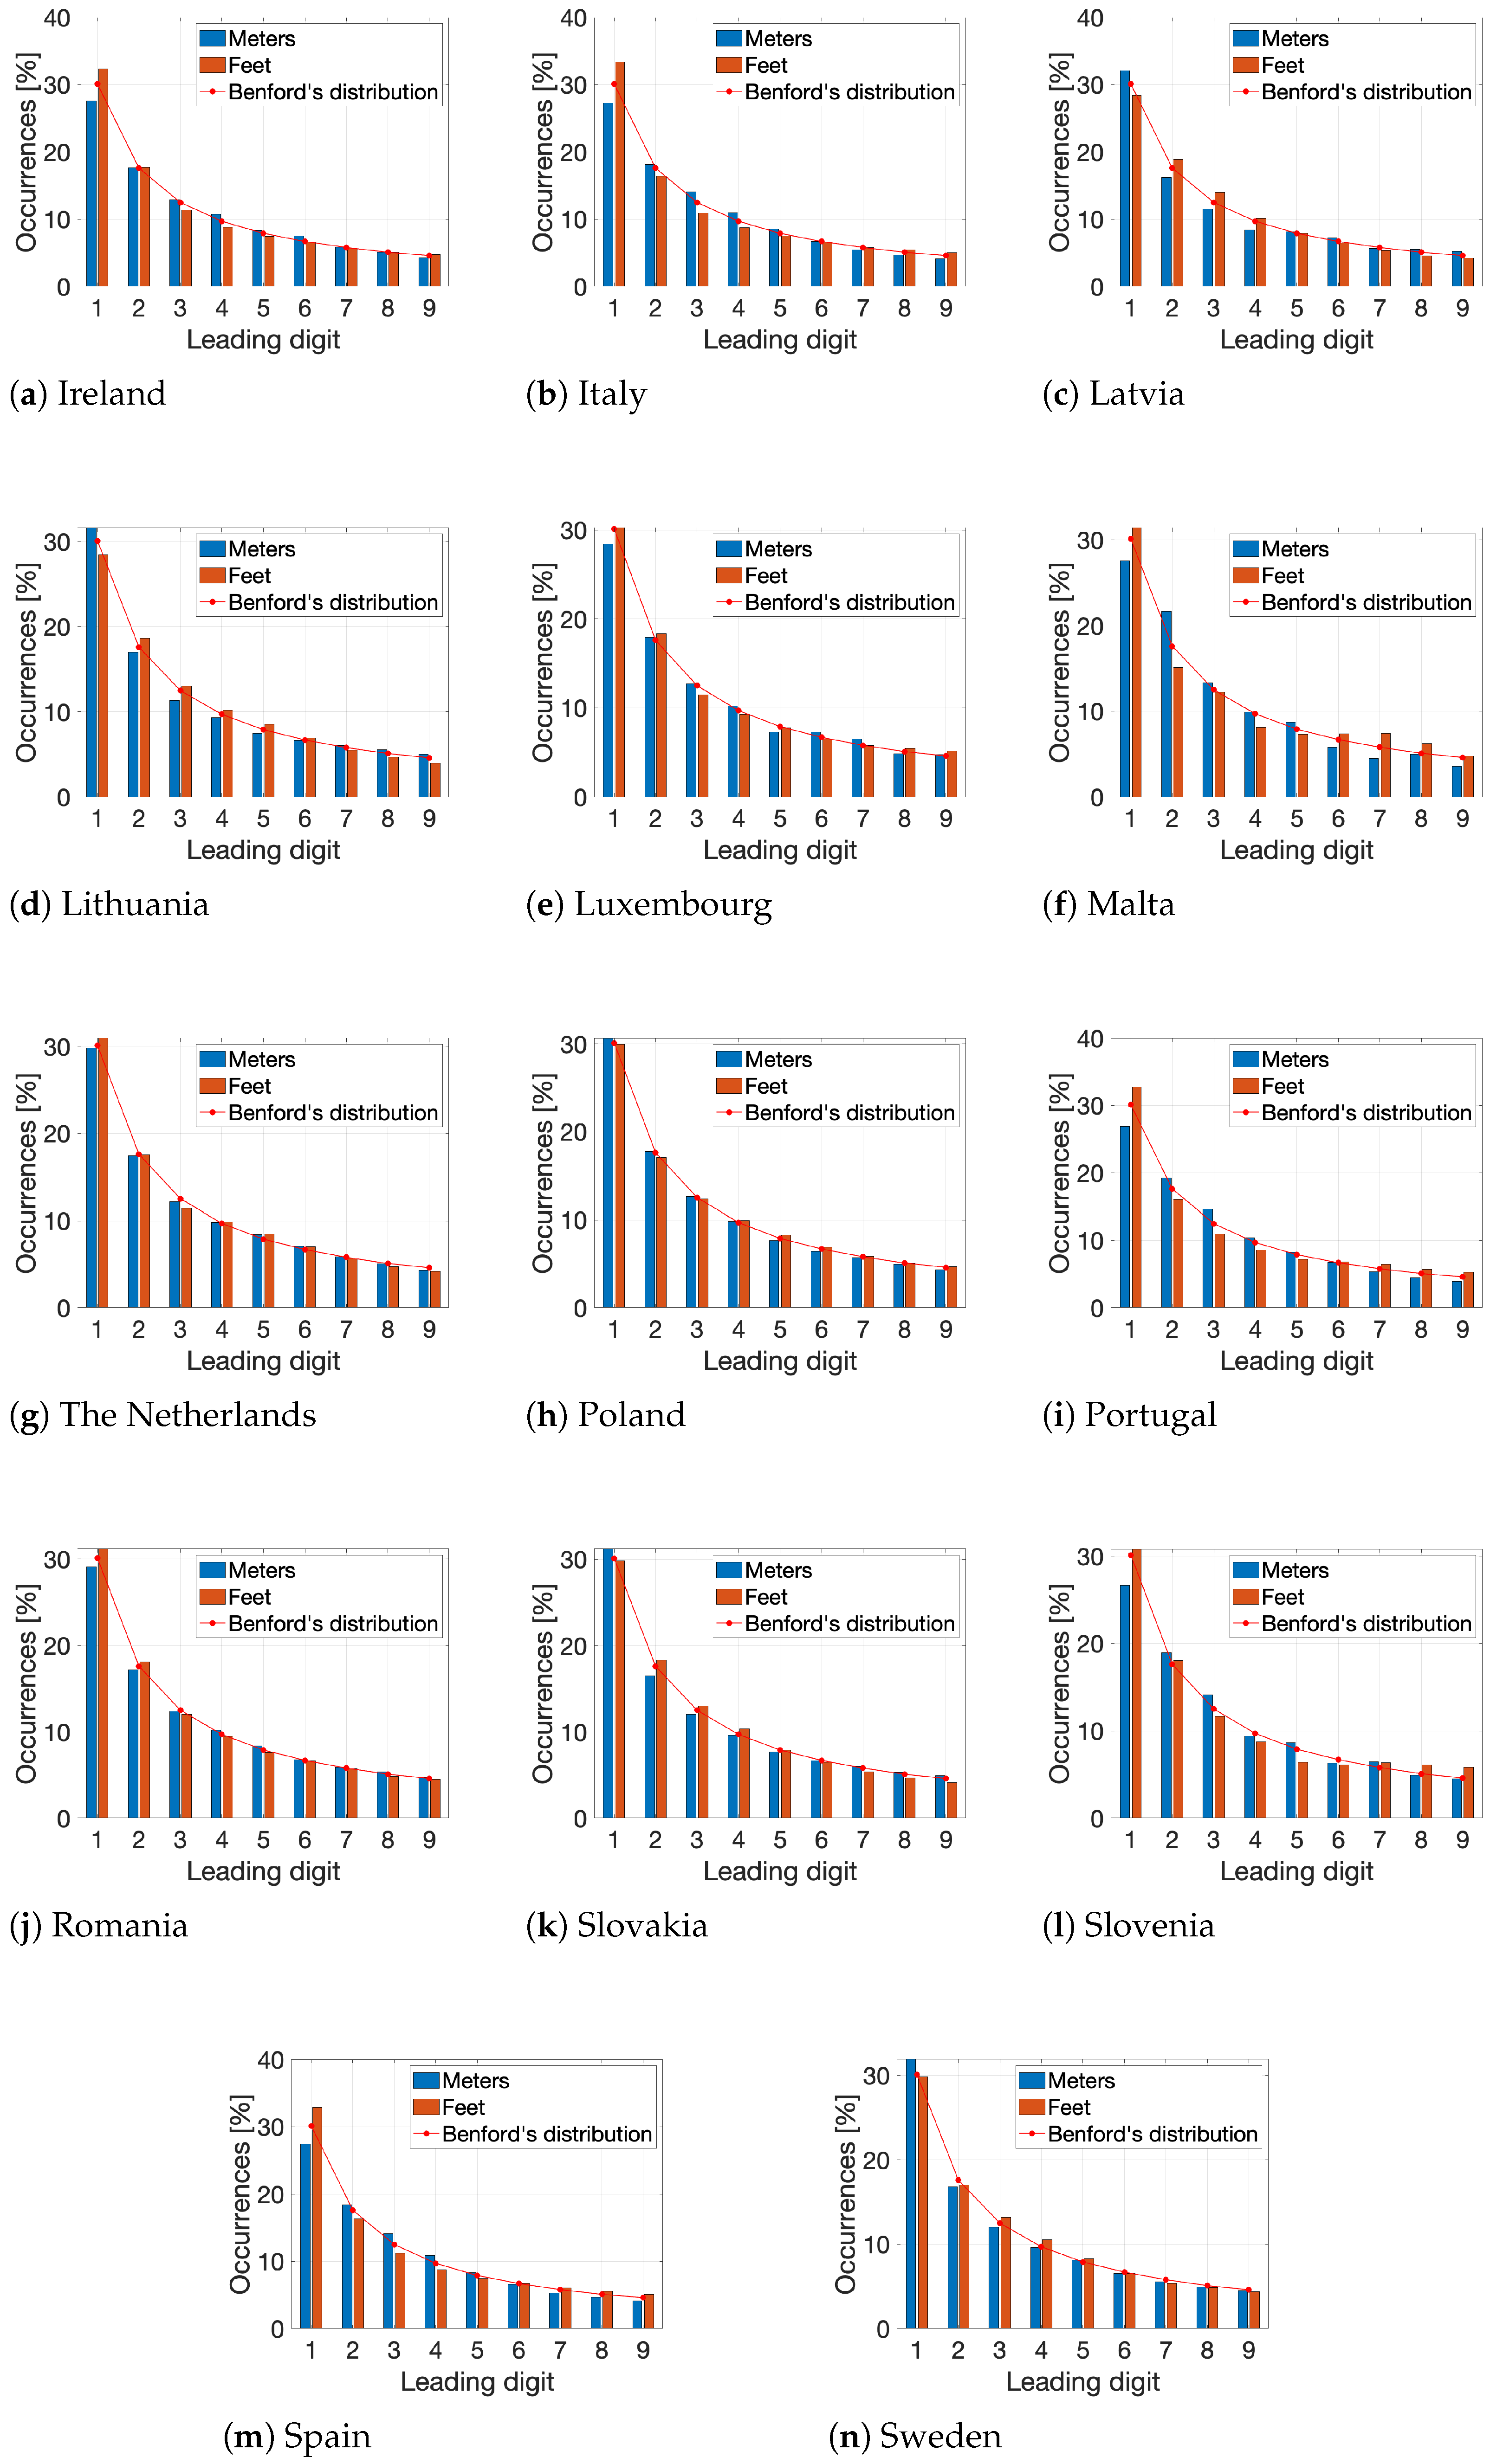
data_distrib, which contained information on the frequency distributions of the HILSs of the main road networks for all 27 EU member states, was visualised using bar charts (see
Figure 2,
Figure 3 and
Figure 4), offering a clear overview of the observed frequencies.
Subsequently, the
values were calculated using the
data_distrib subset. For 8 degrees of freedom (since there are 9 possible leading digits, 1–9, minus 1 degree of freedom) and a significance level of
, the critical
value is approximately 15.507 [
41], with lower
values indicating better conformity to the expected distribution, in this case Benford’s distribution.
The
statistic results listed in
Table 2 confirmed a high level of conformity with Benford’s distribution across all 27 EU countries, as indicated by the
values ranging from 0.0449 to 1.5100. The lowest values were recorded for Belgium (0.0449), Poland (0.0511), Germany (0.0685), Austria (0.0918), Cyprus (0.0927), and the Netherlands (0.0952), representing a shift of two orders of magnitude compared to Malta (1.5100) and Portugal (1.1101), and a shift of one order of magnitude compared to 19 countries. Malta and Portugal were the only two countries with a
value greater than 1.
The
p-value in the experiment ranged from 0.9829 to 1.0000, with 17 countries (Austria, Belgium, Croatia, Cyprus, Czechia, Estonia, Finland, France, Germany, Greece, Lithuania, Luxembourg, the Netherlands, Poland, Romania, Slovakia, Sweden) demonstrating such high conformity with Benford’s Law that the
p-value did not differ from 1 (see
Table 2).
The K-S test values ranged from 0.0071 to 0.0349. The lowest values were recorded for Cyprus (0.0071), Belgium (0.0074), the Netherlands (0.0082), and Poland (0.0097), while the values for the remaining states were considerably higher. The highest values were observed for Slovenia (0.0349), Malta (0.0333), and Portugal (0.0319). At the
significance level, the K-S test did not reveal a statistically significant difference between the empirical distribution of the leading digits in
data_distrib and the Benford distribution, as indicated by the K-S test values listed in
Table 2 and supported by the
statistics and corresponding
p-values. These results demonstrate conformity with Benford’s Law.
The scale invariance of Benford’s Law has been tested as well. Because Benford’s Law is scale-invariant, the ideal expectation is that the empirical leading digit distribution remains effectively unchanged after unit conversion. Therefore we computed the leading digit histogram for both representations and quantify agreement with Benford’s distribution, which in both cases pass successfully this condition–see
Figure 2,
Figure 3 and
Figure 4.
3.2. The Higher-Level Segments’ Length Distribution
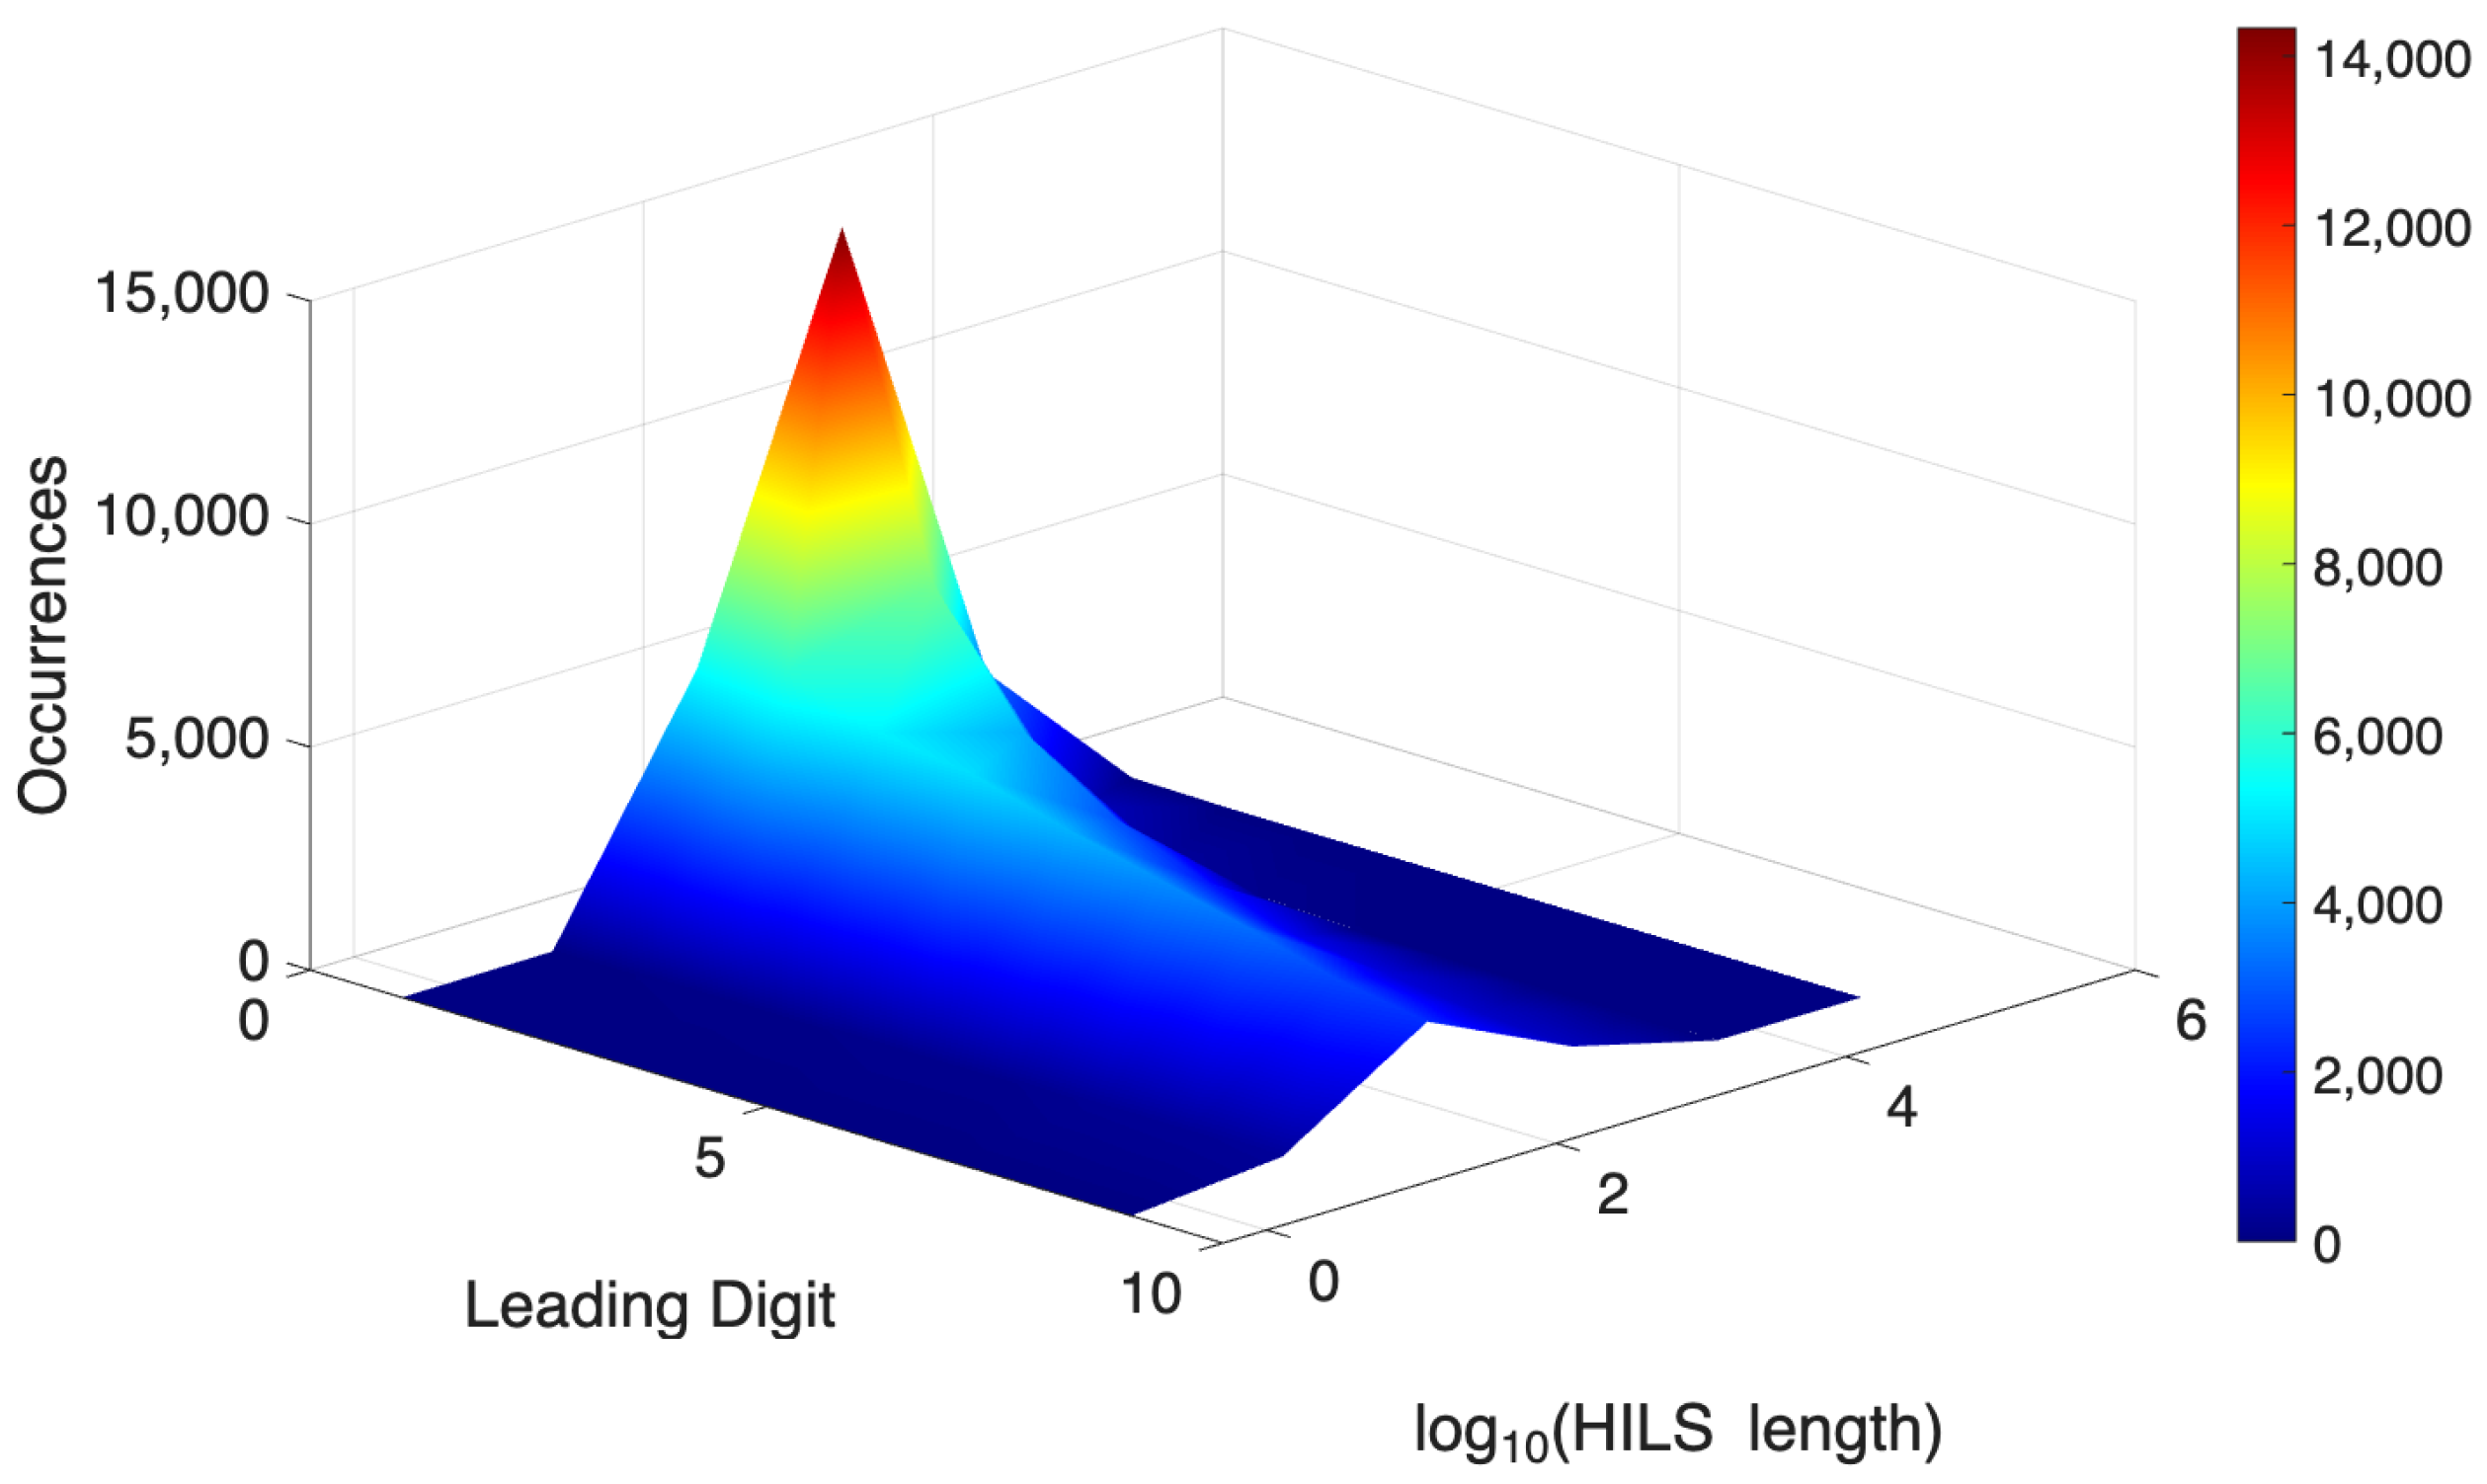
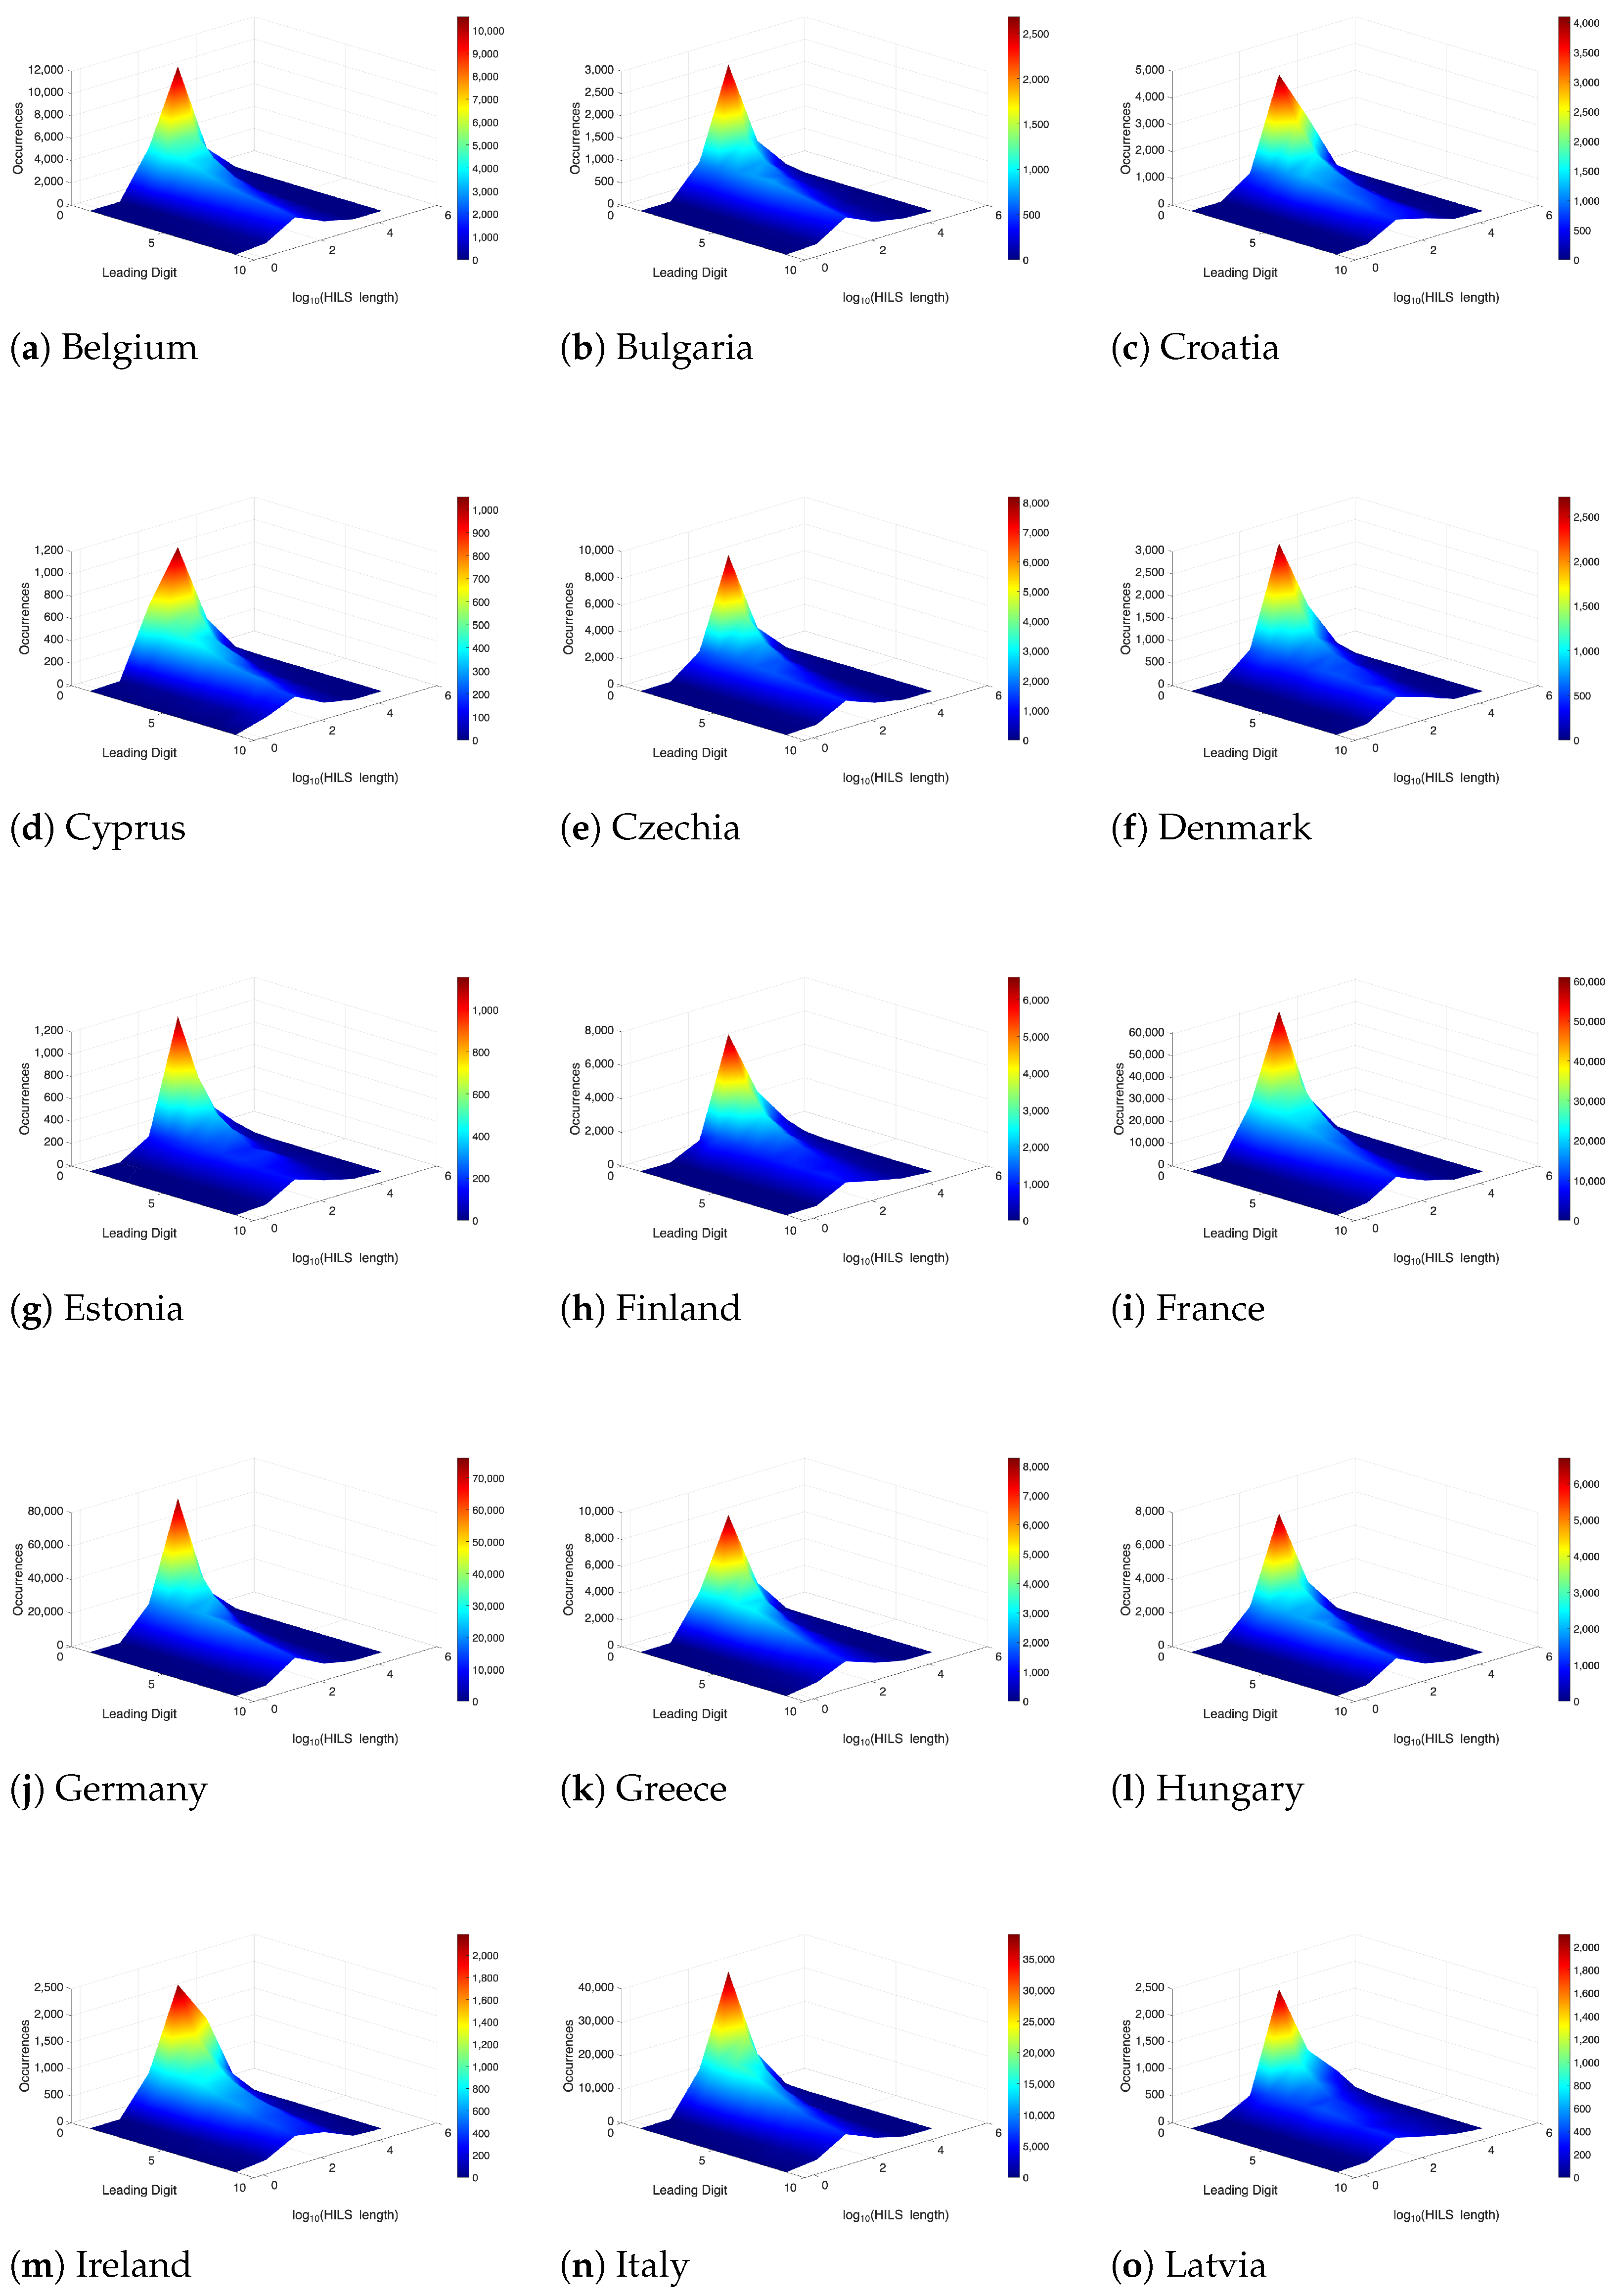
The relationship between the distribution of the lengths of HILSs and the leading digits of these lengths was examined country by country. The situation in each country is illustrated in
Figure 5,
Figure 6 and
Figure 7. The x-axis represents leading digits of the lengths of the main road networks’ HILSs, the y-axis shows the decimal logarithms of these lengths, and the z-axis indicates the frequencies of HILSs of a given length associated with a given leading digit.
From these figures, it is evident that in all observed countries, HILSs of the main road network with lengths of the order of tens of meters predominate in most, if not all, of the 9 categories defined by leading digits. The highest frequencies on the logarithmic scale occur between the values of 1 and 2, which corresponds to the order of tens of meters. This interpretation follows from the nature of the logarithmic axis, where a value of 1 represents
meters and a value of 2 represents
meters. The peaks of the curves, obtained as cross-sections of the 3D plots parallel to the
plane, therefore fall within the range of approximately 10 to 100 m, indicating that most of the observed HILS lengths in the respective category are of this magnitude. In Ireland (see
Figure 6), however, there is a relatively high number of HILSs with lengths in the range of hundreds of meters, considering the total number of HILSs analysed in that country. This phenomenon, although to a lesser extent, can also be observed in Croatia (see
Figure 6). Conversely, relatively few HILSs of the main road network with lengths in the hundreds of meters, relative to the total number of analysed HILSs, are particularly notable in Germany, Cyprus, and Luxembourg. This trend is also partially evident in Hungary, the Netherlands, Bulgaria, and Portugal. In countries where very short HILSs prevail and longer ones are rare, this may indicate a high density of the road network but also the risk of traffic being “transferred” across sections where longer direct routes are missing. Conversely, countries such as Ireland may have a higher proportion of long HILSs, which suggests faster interregional accessibility but weaker fine-grained connectivity at the local level.
Depending on the size of each country and the development of its transport infrastructure, the number of HILSs of the most frequent length typically ranges from several thousand to tens of thousands. The only exceptions are the island states Cyprus and Malta. The similarity between the shapes of charts corresponding to individual countries depicted in
Figure 5,
Figure 6 and
Figure 7 is remarkably high, although the shape of the chart associated with Malta, Ireland, and Latvia slightly differs from the other profiles. Cross-sections of the 3D plots taken parallel to the
plane mimic Benford’s distribution, while those parallel to the
plane resemble a normal distribution. The fact that the lengths of HILSs of the main road network in the analysed countries follow Benford’s distribution suggests that the formation of main road networks gives rise to patterns typically observed in naturally occurring datasets, indicating a certain universal character of these processes across different geographical and institutional contexts.
3.3. Practical Applications of the Findings
While this paper observes that the lengths of HILSs in EU countries follow Benford’s Law, the underlying causal mechanism merits deeper discussion. Previous works have shown that Benford-like distributions commonly arise in datasets governed by multiplicative processes, scale invariance, and combination of heterogeneous influences [
42,
43]. In the case of road infrastructure, although segment lengths are affected by diverse factors (terrain, funding availability, urbanisation patterns, political decisions), these factors do not act additively, but rather interact multiplicatively over time. This aligns with HILSs demonstration that the product of independent random variables, even with arbitrary distribution, tends to converge in Benford’s distribution. Moreover, the planning and growth of road networks often occur across multiple spatial and temporal scales, without a natural unit of measurement, creating a scale-invariant context where Benford’s Law is statistically favored [
44]. Thus, while no single deterministic model dictates road lengths, their emergence from a multi-factorial, multiplicative, and scale-free development process helps explain the convergence in Benford’s distribution.
According to above statements, HILSs demonstrate an inherent conformity with Benford’s Law, mainly because they meet the key requirement of multiplicative growth across various scales. This arises from the statistical regularity created by the interaction of multiple independent factors (policy-making, planning, investment, terrain) over time, which leads the HILSs’ length distribution towards a logarithmic, Benford-like pattern.
However, this natural conformity is often disrupted by external, human-influenced factors such as political decisions, intentional rounding practices, or legislative cutoffs. Therefore, the measurable deviation from Benford’s Law should not be seen as definitive proof of data fraud but rather as a helpful supplementary tool for identifying anomalies and maintaining quality. A high or consistent pattern of deviation in a specific nation often indicates the influence of systematic, human-imposed constraints that compromise the data’s inherent integrity. This deviation may point to a highly centralised, rigid planning regime, manifested through political decisions or legislative cutoffs, that introduces non-multiplicative limits on infrastructure development. Alternatively, these subtle national differences could signal nation-specific methodological issues in data collection or reporting, such as intentional rounding or specific cutoffs mandated by national agencies. In any case, the measurable deviation acts as a clear indicator of external human factors requiring further investigation into the specific causes, whether fraudulent manipulation, methodological issues, or specific national planning policies.
The discovery that the examined infrastructure elements of the transportation network conform to Benford’s Law is significant from several perspectives. If new or updated data on HILS lengths deviate from the expected distribution, this may indicate possible typographical errors during data entry, inconsistencies between different data sources (e.g., national vs. European registries), or potential data alterations (in project reports, official records, public procurement, planning documents, or for budgetary or project-related purposes). In this context, internal database consistency checks based on Benford’s Law offer a cost-effective way to flag potentially problematic data and help auditors focus their attention where it is most needed, without requiring manual inspection of all records.
Furthermore, Benford’s Law can serve as a quick quality control test. For instance, inaccurate length calculations may stem from the use of inappropriate algorithms, such as applying Euclidean distance instead of geodetic distance, or from incorrectly projected GPS coordinates without proper metric conversion. Road segment lengths can also be distorted due to sparse GPS point sampling, excessive filtering, or snapping processes. Since Benford’s Law allows data quality assessment, it thus reduces costs associated with later corrections.
Finally, in times when roads are extended, shortened, or reorganized, Benford’s Law can serve as a basis for detecting infrastructure change. A deviation from Benford’s Law conformity can signal structural changes in the network, allowing automatic identification of modifications or real-time monitoring of how construction activities impact the structure of the road network.
The analysis of length distribution can serve as a tool for identifying peripheral or insufficiently serviced regions. In regional strategies, it can then be determined whether it is more appropriate to supplement the network with shorter connecting segments, which improve accessibility for smaller settlements, or with longer routes, which provide more efficient long-distance connections.
4. Conclusions
Tobler’s laws of geography represent fundamental principles of spatial relationships. In contrast to these spatial principles, Benford’s Law focuses on the statistical distribution of numerical data and provides a novel perspective for analysing patterns within datasets, such as those related to transport infrastructure.
This research aims to bridge the gap between spatial theory and statistical data analysis by applying Benford’s Law to transport infrastructure data. It offers a new tool for validating data quality, identifying anomalies, and revealing underlying structural patterns in transport networks, which can ultimately support improved planning and decision-making processes.
The lengths of higher-level segments of the main road network in the 27 European Union member states were used in the analysis. To assess whether the higher-level segment length data of the main road network of all EU countries conform to Benford’s distribution, a test was performed, and the resulting p-value was used to evaluate the significance of the results. The additional validation of the reliability of our results came from the Kolmogorov-Smirnov test.
Overall, it can be concluded that EU member states have relatively well-developed main road networks, although we recognise that their quality may vary between countries. The higher-level segments of the main road network in each EU state adhere very well to Benford’s Law.
Although the test is known to be very sensitive, often leading to the rejection of the null hypothesis due to minor discrepancies, this was not the case in this study. In all examined instances, the test yielded low values and p-values above the standard significance level (0.05). These results were supported by the Kolmogorov-Smirnov test, which indicates minimal differences between observed and expected frequencies, showing strong conformity with Benford’s Law. Therefore, there is no reason to reject the null hypothesis: “The leading digits of the HILSs of the main road network of EU member states follow Benford’s Law.” On the contrary, the results support its acceptance, as the empirical data align closely with the theoretical distribution predicted by Benford’s Law. This strong conformity holds even in the context of a large dataset, further reinforcing the robustness of the results and the reliability of the applied statistical methods.
In summary, the analysis reveals that despite national differences in the distribution of higher-level segment lengths, the overall structure of the main road networks across the observed countries exhibits a striking degree of similarity.
The findings of this study offer several practically applicable insights in the fields of transport policy, spatial planning, and geospatial data management. For policymakers and regional planners, the identification of universal, self-organizing patterns in the development of road infrastructure provides a valuable foundation for more efficient and targeted investment in transport networks. The observed convergence in the length characteristics of main road segments across EU member states, including strong conformity with Benford’s Law, indicates the presence of naturally occurring organizational principles that transcend national planning decisions. This supports the case for enhanced regional cooperation and the development of common transport policies within the EU framework, such as through funding mechanisms like the Connecting Europe Facility (CEF).
The combination of spatial theory and statistical analysis enables the modelling of infrastructure development and the forecasting of the consequences of various investment strategies. In cases of divergence between countries, planners may investigate the underlying causes of such anomalies, whether rooted in historical, geographic, or institutional differences.
If road segments across different countries follow similar statistical distributions, it suggests that infrastructure development occurs in a relatively balanced manner. This insight may serve as an argument for or against further intervention by EU-level institutions. At the same time, it provides a reference framework for evaluating planned infrastructure projects, where significant deviations from the expected distribution may point to systemic imbalances, planning deficiencies, or specific contextual factors that require further investigation.
Beyond planning implications, this study also has important relevance for the field of data quality assessment and validation. In this context, Benford’s Law emerges as an effective tool for automated auditing of large geospatial datasets, particularly where manual validation is impractical. The ability to detect suspicious anomalies, inconsistencies, or artificial manipulations in data is critical, especially in environments that rely on open data and transparency in public administration, where data quality directly affects the reliability of analytical outputs and policy decisions.
Finally, the integration of spatial theories, such as Tobler’s laws, with data-driven statistical approaches like Benford’s Law opens new possibilities for interdisciplinary research into complex geographic systems. This approach not only deepens our understanding of the spatial structure and evolution of transport networks but also supports more transparent, adaptive, and evidence-based decision-making in spatial development and public investment.
Future studies could build on this approach by incorporating additional datasets or exploring similar applications across other fields.
