Abstract
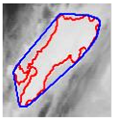
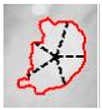
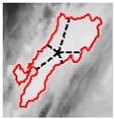
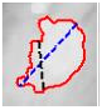
The Dvorak technique has represented a fundamental tool for understanding the power of tropical cyclones based on their shape and geometric evolution. However, it should be noted that the Dvorak technique is purely morphological in nature and was developed for wind, not precipitation. The role of shape methods in precipitation prediction remains uncertain, particularly in the context of modern multi-sensor capabilities. This uncertainty forms the motivation for the present study. In an attempt to enrich Dvorak’s technique, this study proposes a novel hypothesis. This study tests the hypothesis that higher precipitation intensity is associated with more organized cloud-system morphology, as captured by simple geometric descriptors and indicative of dynamically coherent convection. A total of 3419 cloud-system objects (after size filter) were utilized to establish geometric relationships in each of them. For the case study of Hurricane Patricia over the Mexican coast in 2015, 3858 geometric shapes were processed. The cloud-system morphology was derived from geostationary imagery (GOES-13) and collocated with satellite precipitation estimates in order to isolate intense-rainfall objects (>50 mm/h). For each object, simple geometric descriptors were computed, and shape variability was summarised via Principal Component Analysis (PCA). The present study sought to evaluate the associations with rain-rate metrics (mean, mode, maximum) using rank correlations and k-means clustering. Furthermore, sensitivity analyses were conducted on the rain threshold and minimum object size. A Shape Descriptor: ratio between perimeter and diameter was identified as a promising tool to enhance early prediction models of extreme rainfall, contributing to enhanced meteorological risk management. The study indicates that cloud shape can serve as a valuable indicator in the classification and forecasting of intense cloud systems.
1. Introduction
The characterization of tropical cyclones by satellite observations has evolved substantially since the 1970s, marking a turning point in operational meteorology. A significant contribution is the Dvorak technique, a visual method primarily developed by [1,2], which enables the maximum wind speed intensity of tropical cyclones to be estimated based on the identification of specific cloud patterns in satellite images. Although the technique was initially conceived as a practical tool to compensate for the absence of in situ data on offshore cyclones, it has over time demonstrated a remarkable degree of correlation with fundamental physical parameters, particularly minimum central pressure and maximum wind speed [3,4]. Notwithstanding the extensive and sustained utilization of the method, a gap remains in terms of a precise understanding of the geometric shapes underlying the Dvorak patterns and their relationship to precipitation intensity. This relationship, which involves mesoscale dynamics, convective symmetry, and atmospheric feedback mechanisms, represents a critical area of study for the improvement of hydrometeorological predictions in contexts of climate vulnerability. The Dvorak technique is predicated on the premise that there is a functional relationship between the organization of the deep cloudiness detected in the infrared or visible spectrum and the intensity of the cyclone. This relationship is represented by the “development patterns” scheme, among which the “curved band” patterns, the “central dense overcast” pattern, and the “embedded center” or “annular pattern” stand out. These sequences, in essence, obtain geometric representations that facilitate structural inferences about the system. For instance, the presence of a distinctly delineated and symmetrical eye is indicative of a severe cyclone, commonly associated with sustained intensification and an exceptionally organized convective core [4]. Subsequent studies have shown that these geometric patterns relate to storm intensity and to the spatial organization of cyclone precipitation [5]. Here we extend this line of work by quantifying the relationship between geometric descriptors and rainfall intensity (mm/h).
Over the last decade, operational approaches for estimating tropical cyclone intensity from satellite imagery have been updated, with a predominant emphasis on wind (e.g., variants of the Dvorak method). At the same time, evidence has shown that the shape of precipitation systems is associated with rainfall intensity; however, descriptors of the geometric shape of storms have been rarely used. For Mexico and the eastern Pacific, several studies have documented the contribution of tropical cyclones to seasonal rainfall and hydrometeorological extremes. These studies emphasise that the magnitude of precipitation does not necessarily scale with wind categories. Building on this body of knowledge, our work evaluates whether simple geometric descriptors of cloud/rain contours can offer an early, interpretable, and low-cost indicator of extreme rainfall potential, complementing wind-centered estimators.
Scientific interest in the geometric shape of cyclones is not only descriptive, but also responds to a need to link their morphology with their internal dynamics. The shape of a hurricane, particularly the symmetry of its spiral bands and the clarity of its eye, has direct implications for internal convective processes and the radial distribution of precipitation. The paper utilised spatial metrics and satellite segmentation to establish a correlation between the shapes of rain groups. As Houze [6] and Schiesser [7] have noted, mesoscale convective systems exhibit a spatial organization whose structure is crucial for effective precipitation. In the context of tropical cyclones, this organization adopts shapes that are susceptible to visual classification by techniques such as Dvorak. This allows the observed geometry to be used as a preliminary, though visual, estimate of the thermodynamic properties of the system.
Nevertheless, the technique has been the subject of extensive discussion and has required revisions. The reliance on visual perception and the subjectivity of the analyst has led to the development of objective and semi-automatic methods. These include the Advanced Dvorak Technique (ADT), which implements edge detection algorithms, band segmentation, and symmetry analysis to generate a more reproducible estimate of intensity [8,9]. This transition to automated geometric analysis has led to new research opportunities, focusing on quantifying the relationship between the spatial shape of the cyclone and its precipitable capacity.
From a climatological perspective, the geometric shape of tropical cyclones has shown significant variability depending on the oceanic environment and the latitude of formation. Kossin et al. [10] reported a migration towards the poles in cyclone intensity maxima. This phenomenon is accompanied by structural changes in the symmetry of the systems. Kawabata et al. [11] utilized a 30-year Dvorak-based reanalysis in the Western Pacific region to confirm an increase in the proportion of cyclones exhibiting annular geometric structures. This phenomenon may be linked to alterations in the thermodynamic conditions of the ocean and atmosphere. This morphological evolution could directly impact regional patterns of extreme precipitation, making the analysis of shape as a predictive variable even more relevant.
With regard to wind speed, it should be noted that the Dvorak technique can sometimes present systematic biases. Research by [12,13] demonstrated a correlation between errors in wind speed estimation and the shape of the cyclone. Specifically, cyclones that are more asymmetrical or those with poorly defined bands tend to be underestimated in intensity. It is important to note that the focus here is on the intensity of the system, not the intensity of the precipitation. This suggests that geometric ambiguity can affect the accuracy of the method and obscure critical signals about the cyclone’s danger. In parallel, Ref. [14] compared Dvorak parameter estimates across different meteorological agencies, revealing inconsistencies related to the interpretation of cloud shapes.
The most recent results [5] analyze the rainfall patterns of tropical cyclones that made landfall in the North Atlantic using spatial metrics and satellite data (1998–2014). Five key metrics (area, solidity, dispersion, closure, roundness) were selected to distinguish rainfall patterns according to storm intensity. The study revealed regional variations in cyclonic precipitation, influenced by wind shear, humidity, and interaction with land [5]. Among the most pioneering studies, Ref. [15] highlights that shape analysis studies objects in meteorology and climatology, such as tropical cyclones and atmospheric rivers, using metrics that quantify size and shape. The application of this technology is centered on two key areas: forecast verification, which involves the comparison of models with observations, and process studies, which analyze the structure of climatic phenomena. The present work contributes to the first area.
As outlined above, it is imperative to identify the morphological characteristics of cyclones that directly impact the intensity of precipitation resulting from rain produced by a cloud system. This is exemplified by the relationship between perimeter and diameter. The aim is to improve the classification of cloud systems, facilitate the analysis of satellite data, capture the relationship between cloud morphology and precipitation processes, and promote the use of machine learning techniques in meteorology.
Operationally, Dvorak-type analyses prioritise wind intensity; however, effective risk management requires early warning signs of extreme rainfall, which is the main trigger of impacts. We hereby propose a hypothesis that investigates the correlation between geometric descriptors of storm shape and rainfall metrics (mean, mode, and maximum). Therefore, related descriptors are analysed and evaluated based on thousands of segmented contours. The application of PCA allows us to identify dominant modes of geometric variability. Our contribution is an explainable morphological predictor that can be integrated into storm tracking and forecasting systems. This will allow configurations with the highest precipitation potential to be identified at an early stage.
2. Materials and Methods
2.1. Database
The work uses a database consisting of 134 .CSV files, each containing a rainfall intensity matrix (817 × 1280 pixels) in mm/h per pixel. These files come from a processing method presented in [16], which proposes a technique to associate rainfall intensity matrices with digital satellite images, using the Hydroestimator method.
In that work, the materials consist of digital satellite images acquired by the geostationary meteorological satellite GOES-13, which covers Mexico and captures imagery at 15 min intervals. The ISD frames have an 8-bit radiometric resolution. Each image spans 817 pixels in latitude by 1280 pixels in longitude, with a pixel size of 2.36 km per side. As part of the methodology in [16], datasets from environmental meteorological stations located within the study area are used to validate the per-pixel rainfall-intensity matrix.
The database contains image segmentation from 12:15 a.m. on 22 October 2015 to 8:15 p.m. on 24 October 2015. During this period, the hurricane transitioned from Category I to Category V and then back to Category I, with a total of 134 files, each containing information on rainfall intensity. In this analysis, we propose applying the Principal Component Analysis (PCA) method to identify correlations between the variables in the dataset and the target variable. Furthermore, the analysis aims to identify the variables that have a significant impact on explaining the phenomenon under study.
In order to reduce pixelation bias, only contours with an effective diameter of at least 5 pixels (approximately an area of 20 pixels) are analysed. This threshold is used because metrics based on the perimeter or diameter show numerical stability above it. This criterion (filter) preserves synoptic-scale precipitation structures, as well as maintaining consistency across all tests.
2.2. Hurricane Patricia
The selected this research focuses on analyzing to Hurriane Patricia, which took place from 20 to 24 October 2015, on the Pacific coast of Mexico. This hurricane evolved to category-5 on the Saffir-Simpson scale and is considered the most intense hurricane ever recorded in terms of atmospheric pressure and sustained winds, indicating that it was a hurricane of great intensity and extreme danger [17]. In the work presented in [16], a method is developed to associate a rainfall intensity matrix with a digital satellite image using the Hydroestimator Method. Using the intensity matrices as a reference, a projection of the meteorological phenomenon is created, taking rainfall intensity into account. Each of the matrices is saved in a .CSV file. Each file corresponds to a digital satellite image at a specific moment in time of the phenomenon, corresponding to images taken by the geostationary operational environmental satellite east (GOES 13). The image spans 817 pixels in the latitude direction and 1280 pixels in the longitude direction; each pixel measures 2.36 km per side. Using the intensity matrix as a reference, the cloud systems are modelled for extreme rainfall intensity values. Derived from the work carried out by (Table 5 in [18]), only values above 50 mm/h in rainfall intensity are selected, which produces cloud systems that are translated into binary images through processing. This process generates a binary image with the shape of the cloud system for each of the matrices. It is on these shapes that we wish to test the proposed hypothesis. The initial phase involves the segmentation of images to create a database of all the cloud systems observed in the phenomenon, along with the proposed characteristics. We processed 3419 cloud-system objects whose binary masks contain more than five pixels (minimum area threshold = 5 px) at the image resolution (2.36 km per pixel). To evaluate robustness, we performed cross-tests with different pixel-window sizes (5, 10, 20, 50 px) and rainfall thresholds (e.g., 30–70 mm/h) (see Appendix A).
2.3. Hydroestimator
The Hydroestimator (HE) is an operational approach that estimates rainfall rate (mm/h) from geostationary IR (channel-4) imagery. Its main purpose is to provide near–real-time precipitation fields over regions with limited radar coverage, enabling nowcasting and monitoring of convective systems such as tropical cyclones. Inputs/outputs. Input: pixel-wise cloud-top brightness/temperature (B) from IR-4. Output: pixel-wise rainfall rate R (mm/h) and, optionally, hourly averages per pixel [19].
The proposals were formulated based on three distinct target variables: rainfall intensity, mode, and maximum value. The mode corresponds to the most frequent value recorded among the set of pixels that constitute the shape under study, and the maximum value corresponds to the highest rainfall intensity within the cloud system shape.
3. Geometry of Variables
The measurements presented below were considered because they depend on basic elements of a two-dimensional shape: area, perimeter, diameter, and radius. Geometric descriptors exhibit collinearity (e.g., perimeter-diameter, roundness, compactness). In order to synthesise the information and preserve physical interpretability, we applied PCA to the correlation matrix. In selecting components, we prioritised those with a minimum of 80% cumulative variance. We employed correlation circles to ascertain which groups of descriptors are associated with rainfall metrics (mean, mode, maximum). This approach, which is standard in atmospheric sciences, produces stable orthogonal axes that summarise the dominant variability of shape and facilitate its relationship with precipitation intensity (see Table 1).

Table 1.
Shape and rainfall variables.
3.1. Scale and Computation of Descriptors
Scale and computation of descriptors. Shape descriptors (FF, RF, RR, CAC, RSG) were computed in pixel units over binary masks. The area A is the number of object pixels, and the perimeter P is the number of boundary pixels (8-connectivity). Diameters D, d, and dmax are expressed in pixels. With these consistent units, the descriptors are dimesionless and scale-invariant within the same grid.
3.2. Descriptors
3.2.1. Comparison Between Area and Perimeter
The most commonly used measure of circularity corresponds to the one proposed in [20]. Also called the Shape Factor (also known as the circularity index), it is calculated using the following relationship:
where is the area of the object, is the area of the circle with the same perimeter as the object, and is the perimeter of the object.
3.2.2. Comparison Between Area and Diameter
The following is a measure proposed in [21], given by:
where is the area of the object, is the area of the circle with the maximum diameter of the object, and is the maximum diameter, defined as the largest length between two points on the edge of the object.
3.2.3. Relationship Between Radii
A measure of circularity defined on a relationship between two radii is proposed in [22], defined as follows:
where is the minimum radius, defined as the minimum distance from the centroid of the edges to the edge and is the maximum radius, defined as the maximum distance from the centroid to the edge of the shape.
3.2.4. Measure of Roundness
Another measure associated with the relationship between radii is proposed in [22], defined as:
where is the average of the radii from the edge to the centroid and is the radius relative to the th pixel of the edge.
3.2.5. Convexity Measurement
One way to describe the shape of an object is by definition convexity. One way of measuring convexity is by the ratio between the area of the object and the area of its convex hull. Some variants for polygons can be found in [23]. The convexity of a shape is defined as:
where denotes the shape, represents the area of , and represents the area of the convex hull of .
3.3. Proposed Shape Descriptors
Below are a couple of proposals for characterizing cloud shapes. A body of constant width is one that has the same width in all directions. The width of an object in a given direction is the distance between a pair of parallel lines that are tangent to the object. For a fixed width, the body of constant width with the largest area is known to be a circle, so these relationships also help us measure an object’s circularity. In the geometric convex, bodies of constant width have unique properties that make them stand out in convex geometry. A result presented in [24] states that:
Lemma 1.
Let be a convex and closed curve in the plane. If for every point , the largest chord through p always has constant length, then is of constant width.
This proposition provides a characterization of bodies of constant width based on measuring the width from each point on the edge of the shape. In this characterization, a shape that satisfies this property is the circle. In the circle, for each point a diameter can be defined, which corresponds to the largest chord through the point. Since all diameters in a circle are equal, the circle is of constant width. However, there are figures that satisfy this property that are not circles. We define the descriptor based on this property as follows:
Lemma 2.
Let and two points on the edge of a shape with , where is the set of all points on the edge of the shape, let for , and let and .
We define the following measure of circularity by constant width as:
where corresponds to the minimum of the largest distances of the points on the edge and to the maximum. If is 1, then the object is a body of constant width, and if it is close to 0, the object is a point. The range of this measure is in the interval [0, 1]. This measure is based on the contour of the shape, and because of the way it is defined; it is invariant to rotation and scale.
Relationship Between Perimeter and Diameter
In [25], the following property of is established for a simple closed curve.
Lemma 3.
Every convex and closed curve in the plane, of length and diameter , satisfies . Equality is achieved if and only if the curve has constant width .
The proposition gives us an inequality for convex curves in the plane. Here, D is defined as the largest length between two points on the edge of the object.
However, the proposed inequality is very simple compared to the isoperimetric inequality. From the inequality , we can formulate that the length of the chord is always less than . For convex curves, if we take the quotient of the smaller value between the larger value, it will always be a number between 0 and 1. From this, we can define a measure of shapes that relates their perimeter and diameter.
where corresponds to the perimeter of the shape and to the diameter. From the inequality, we obtain that the domain of this measure is in the interval [0, 1], where a value close to 1 indicates that the object is of constant width.
The two proposed descriptors allow us to measure how close a shape is to an object of constant width.
The data in Table 2 correspond to the descriptors (factor) used to perform the classification and implementation of the PCA. The variables MR, RR, CAC, RSG, FF, and RF correspond to circularity descriptors, and CA is used to measure the convexity or compactness of a shape.

Table 2.
Equation of parameters.
3.4. Shapes Within the Cloud System
Figure 1 presents a digital satellite image captured by the GOES-13 satellite, illustrating the most intense cloud systems generated from the processing of the information. These systems have been superimposed on the image. It is these regions that are characterized by extreme rainfall.
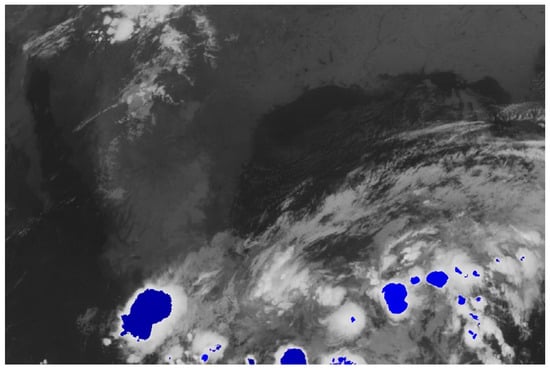
Figure 1.
Areas of Extreme Rainfall (≥50 mm/h) in Hurricane Patricia—19 October 2015, 09:15 UTC.
Figure 2 shows a grayscale satellite image, illustrating cloud formations of varying densities across the scene. At the base, multiple cloud formations of a more intense nature (indicating greater density or thickness) are observable, with red outlines delineating specific regions. The application of red outlines to the map serves to denote regions characterised by elevated rainfall intensity, i.e., areas where precipitation is predicted to be particularly substantial. The contrast between the dark background (possibly land or ocean with lower reflectivity) and the light clouds facilitates the identification of cloud formations, while the red outlines clearly indicate the areas of greatest meteorological interest (see details in Table 3).
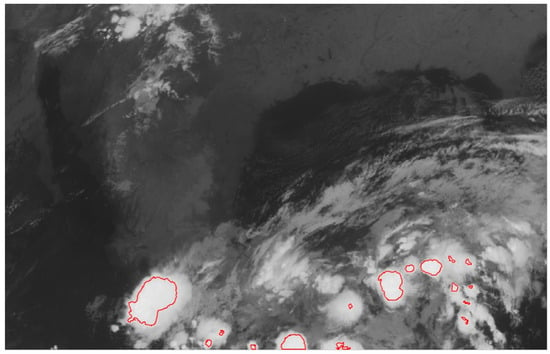
Figure 2.
Segmentation of regions with higher rainfall intensity. The red contours outline the areas identified by the algorithm as regions with stronger rainfall intensity.

Table 3.
Shape descriptor.
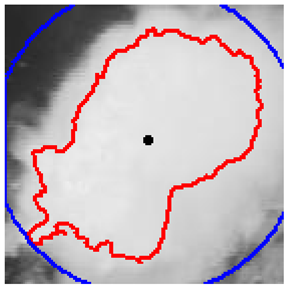
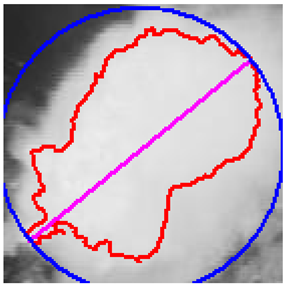
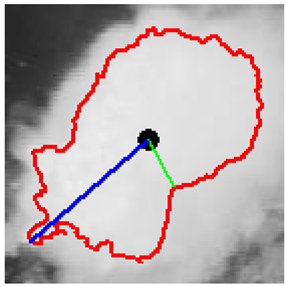
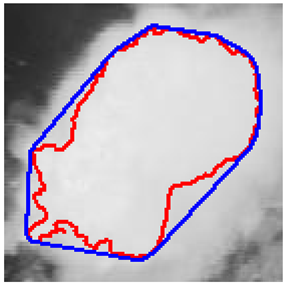
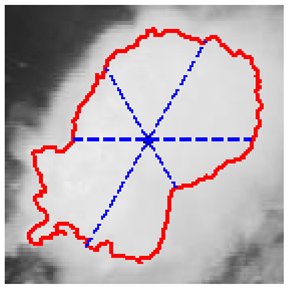
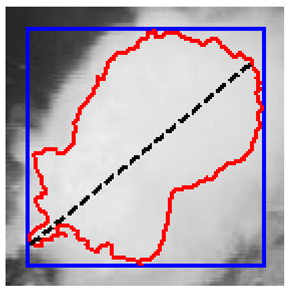
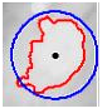
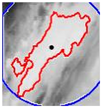
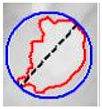
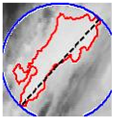
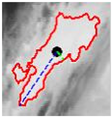
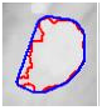
In Table 4, a comparison is drawn between different shapes descriptors (acronyms such as FF, RF, RR, CA, MR, CAC, RSG) applied to cloud clippings obtained from a digital satellite image. Each row corresponds to a particular shape descriptor, and each column shows:

Table 4.
Factors characterizing cloud morphology.
- i.
- The image displays a representation of the cloud, with its outline highlighted in red.
- ii.
- It is hypothesized that the mark, which is possibly blue, may represent either the bounding circle or some geometric reference.
- iii.
- In certain instances, centroids or principal axes are denoted by lines or dots.
As illustrated below each image, a numerical value is assigned to the descriptor for that particular cloud. These values reflect different aspects of the cloud’s geometry, such as its compactness, elongation, circularity, or other shape properties. Consequently, Table 4 offers a visual (through images) and numerical (through values) comparison of how each descriptor characterizes the morphology of the clouds in the satellite image.
In the course of the study on the evolution of the hurricane that occurred from 22 to 24 October 2015, an analysis was carried out on the basis of satellite images from the GOES-13 satellite. The images employed for the analysis extend over a particular time interval from 12:15 am on the 22nd to 8:15 pm on the 24th, during which period the hurricane underwent a transition from Category I to Category V and subsequently back down to Category I. In order to achieve a detailed analysis, the algorithm called AnalysisRainGOES13 was utilized. The primary objective of this algorithm is to process rainfall intensity data obtained through satellite image segmentation. The processing involved the application of PCA and classification using the k-means clustering algorithm. The processed data is contained in a set of CSV files, which correspond to images with dimensions of 817 × 1280 pixels each. Appendix B provides a comprehensive overview of the pseudo-code employed in the implemented algorithm.
4. Results
The results obtained from applying the PCA method to the database containing the different descriptors are presented below. In this initial analysis, the target variable is rainfall intensity, referred to as Rainfall in the database. Rainfall intensity is associated with the average of the intensities recorded for each pixel that constitutes the shape of each cloud system. As illustrated in Figure 3, the centroids of each group are marked with a black cross. It is evident that the groups are well differentiated, indicating that the segmentation performed is reasonable. The number of clusters was chosen using the elbow method. The cumulative normalized distortion shows a clear change in slope up to k = 4; beyond that, improvements are marginal. For parsimony [26], we adopt k = 4, which captures approximately 86–91% of the total without over-segmentation.
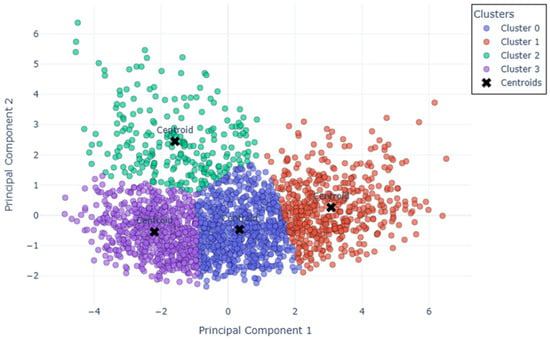
Figure 3.
Two-dimensional visualization of K-Means in the PCA space.
It is illustrated in Table 5, the contribution of each variable to each of the principal components is demonstrated. It is evident that for principal component 1, the variables RR, FF, RF, and CA exhibit the most substantial positive contribution, while RSG contributes significantly negatively. In contrast, principal component 2 is predominantly influenced by the variables Rainfall and K_means, which exhibit a significant positive contribution. A color scale is employed to denote the contribution of each variable to each principal component. In this instance, 74% of the observed variance is accounted for by both components.

Table 5.
Two-component projections. All continuous predictors were standardized (z-score; μ = 0, σ = 1) using StandardScaler (scikit-learn).
The third principal was applied to explore the data, thus enabling the observation of the contribution of each variable to each component, as illustrated in Table 6. A Principal Component Analysis was conducted, resulting in the identification of three principal components. The percentage of explained variance was found to be 84%. As illustrated in Table 6, the positive or negative contribution of each variable to each component is demonstrated.

Table 6.
Projections in three components.
As demonstrated in Figure 4, the incorporation of a novel principal component facilitates enhanced separation of the groups. The five proposed groups are clearly delineated, suggesting that the K-means method produced a satisfactory grouping.
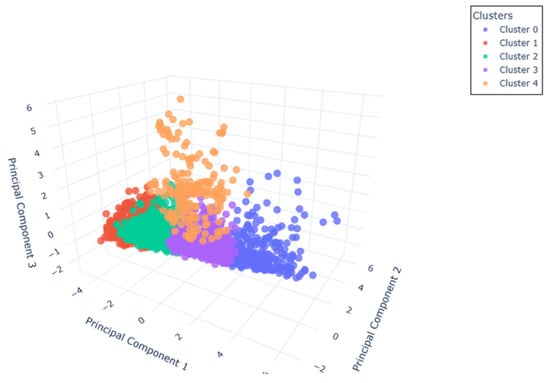
Figure 4.
Three-dimensional visualization of K-Means in the PCA space.
It is illustrated in Table 7, the Principal Component Analyses that were conducted are shown with the percentage of explained variance that they account for. It is evident that for the three target variables examined, the percentage of variance observed is highly comparable for both two- and three-component models. However, an increase in variance is observed when transitioning from two to three components, thereby introducing greater complexity to the model.

Table 7.
Comparative summary of PCA analyses for each target variable.
The correlation circles are displayed in Figure 5. Evidence suggests a strong correlation between the RSG variable and the components. Furthermore, the angle between the three target variables and the RSG variable is found to be minimal, indicating a high degree of correlation between them. RSG can be used as a predictor to estimate the target variable.

Figure 5.
Correlation circles corresponding to the mean, mode, and maximum rainfall intensity, respectively. (a) Mean rainfall intensity variable for each pixel. (b) Rainfall intensity mode in each cloud system. (c) Maximum rainfall intensity in the cloud system.
Following a comprehensive evaluation of the geometric factors, it was determined that only the RSG shape descriptor (perimeter/diameter) demonstrated a positive and statistically significant linear association with the three rainfall-intensity metrics (maximum, mean, and mode). The respective R2 values were determined to be 0.52, 0.40, and 0.34, indicating a strong correlation between the RSG shape descriptor and the rainfall intensity metrics. RSG has been identified as a valuable predictor for early-warning models of extreme rainfall, with the potential to enhance hydrometeorological risk management (Table 8).

Table 8.
R2 from cloud systems with rainfall rates greater than 50 mm/h and considering images larger than 20 pixels.
5. Discussion
From a physical perspective, the configuration of a tropical cyclone is indicative of the dynamic interplay between centrifugal forces, pressure gradients, and latent convection. The presence of an annular structure, for instance, has been linked to a more stable and efficient precipitation regime, characterized by the concentration of precipitation within an eye-wall ring [27]. In contrast, more elongated structures exhibiting multiple bands are indicative of less organized and more dispersed convection [28]. These configurations have a direct impact on rainfall distribution, both in terms of intensity and geographical extent. Research conducted by [1,2] utilized spatial metrics and satellite segmentation to establish a correlation between geometric shapes and precipitation clusters. The study proposed a hydrometeorological regionalization framework that is based on cyclonic geometry. The findings of the present study demonstrate a correlation between precipitation intensity and the geometric configuration of the rain system. It is evident that, while this was not explicitly obtained by [5], it does contribute an additional innovative component to Dvorak’s shapes.
RSG is a strong predictor of rainfall intensity. However, no direct correlation emerges between intensity and the initial factors examined, indicating that cloud-shape descriptors capture organizational features not represented by those variables. Specifically, an RSG descriptor based on cloud morphology was identified, which shows a positive correlation with the maximum, average, and mode values of rainfall intensity. This finding suggests that the RSG descriptor can be a useful tool in early prediction models, especially for anticipating extreme rainfall events. Consequently, this approach has the potential to improve the effectiveness of early warning systems, thus facilitating more effective management of the risks associated with intense meteorological phenomena.
While the conventional approach to the Dvorak technique has centred on the estimation of wind intensity, the advent of high-resolution satellite data, such as that provided by passive microwave sensors or polar orbiting precipitation radars, has facilitated a reinterpretation of the method from a hydrological perspective. Velden et al. [4] and later Ahmed et al. [9] emphasize that advancements in remote sensing can be combined with Dvorak patterns to deduce precipitation rates using geometric proxies, such as the radius of symmetry, eye definition, or convective band width. This contributes to the enhancement of the robustness of impact estimates and the improvement of early warning models for extreme events.
Recent Developments and Future Prospects
The evolution of deep learning algorithms and automated satellite image analysis has prompted research exploring the potential enhancement of the Dvorak technique through artificial intelligence. Yang et al. [29] proposed a neural network-based model for estimating the intensity of tropical cyclones, obtaining promising results that exceed the accuracy of the traditional methodology. These advances suggest that, while the Dvorak technique remains a useful tool, its future application could be complemented or even replaced by more accurate and automatic methods. The integration of data from diverse sources, including microwave sensors and satellite radars, has the potential to enhance the accuracy of tropical cyclone intensity estimation and mitigate the biases observed in the current methodology.
6. Conclusions
The Dvorak technique has been a fundamental methodology for estimating the intensity of tropical cyclones since its development in the 1970s [2]. While it has been demonstrated to be reliable and remains in extensive use, its deficiencies in accurately gauging the intensity of extreme storms have prompted the investigation of novel methodologies founded on emergent technologies. Recent studies suggest that artificial intelligence and multispectral data analysis could overcome the shortcomings of traditional methodology, offering more accurate and consistent estimates. However, until the validation and operationalisation of these new technologies is complete, the Dvorak technique will continue to play a crucial role in tropical meteorology, especially in regions where resources for direct observation are limited. The integration of the Dvorak technique with novel tools has the potential to transform tropical cyclone monitoring, enhancing the capacity to respond to these extreme events.
The study of the geometric shape of tropical cyclones, within the framework of the Dvorak method, is an area of research with profound theoretical and practical implications. Geometry is not just a visual attribute; rather, it is an observable manifestation of underlying dynamic processes that govern convective organisation and, consequently, the distribution and intensity of precipitation. The historical evolution of the method, from its empirical formulation to its versions assisted by artificial intelligence, reflects the scientific community’s ongoing effort to translate visual information into reliable quantitative predictions. The present paper demonstrated a relationship between the geometry of cyclones and the intensity of precipitation. It also explored the usefulness of Dvorak patterns as a morphodynamic analysis tool. The aim of this exploration was to advance understanding of the physical structure of tropical cyclones and their destructive capacity.
We demonstrate that the explainable geometry of precipitating systems provides useful information about rainfall intensity in tropical cyclones. The perimeter-to-diameter ratio (PDR) and related descriptors capture a physical notion of compactness that correlates with mean, modal, and maximum rainfall, complementing wind-centered estimators. Due to their low computational cost and physical clarity, these descriptors are natural candidates for integration into operational nowcasting workflows and to support early warning decisions. Future work should therefore include the following: (i) validation of the approach across multiple basins and seasons, (ii) standardisation of thresholds in physical units (km) and adaptive segmentation, (iii) merging with environmental and orographic predictors, and (iv) evaluation of real-time coupling with operational real-time storm tracking tools.
Author Contributions
Ivan Gonzalez Garcia and Alfonso Gutierrez-Lopez designed the model and the computational framework. Ivan Gonzalez Garcia, Ana Marcela Herrera Navarro and Hugo Jimenez-Hernandez analyzed the data, carried out the implementation and performed the calculations. Alfonso Gutierrez-Lopez wrote the manuscript with input from all authors. All authors have read and agreed to the published version of the manuscript.
Funding
This research received no external funding.
Institutional Review Board Statement
Not applicable.
Informed Consent Statement
Not applicable.
Data Availability Statement
Data are available from the corresponding author, upon reasonable request.
Acknowledgments
The authors are grateful to Autonomous University of Queretaro. The authors acknowledge Jose Alejandro Vargas Diaz, whose leadership and support inspired the accomplishment of this research.
Conflicts of Interest
The authors declare no conflicts of interest.
Appendix A
Table A1 summarizes the cross-tests between five window sizes (number of pixels: 5, 10, 20, 50) and four rainfall-intensity thresholds (30, 40, 50, 60 mm/h). Each cell reports the number of detected objects for that combination. For example, at 50 mm/h and 20 pixels we obtained 2090 records (the dataset used in the main analysis). In general, lower thresholds or smaller windows yield more detections, and vice versa.

Table A1.
Number of detected objects by rainfall intensity and window size.
Table A1.
Number of detected objects by rainfall intensity and window size.
| Rainfall Intensity (mm/h) | 5 Pixel | 10 Pixel | 20 Pixel | 50 Pixel |
|---|---|---|---|---|
| 30 | 3893 | 2923 | 2256 | 1519 |
| 40 | 3491 | 2687 | 2101 | 1451 |
| 50 | 3419 | 2654 | 2090 | 1460 |
| 60 | 3279 | 2540 | 1968 | 1387 |
| 70 | 3164 | 2441 | 1915 | 1369 |
Subsequently, we report the explained-variance levels obtained in the sensitivity analysis for two principal components. For each processing configuration we also provide the explained variance of a 2D PCA, by target metric (Rain/Mode/Max).

Table A2.
Percentage of explained variance (2-component PCA) for Rain, Mode, and Max by rainfall intensity (mm/h) and window size (px).
Table A2.
Percentage of explained variance (2-component PCA) for Rain, Mode, and Max by rainfall intensity (mm/h) and window size (px).
| mm/h | Rain (Mean) | Mode | Max | |||||||||
|---|---|---|---|---|---|---|---|---|---|---|---|---|
| 5 px | 10 px | 20 px | 50 px | 5 px | 10 px | 20 px | 50 px | 5 px | 10 px | 20 px | 50 px | |
| 30 | 77.40 | 79.61 | 80.08 | 78.94 | 76.08 | 78.47 | 79.13 | 78.22 | 78.01 | 80.64 | 81.40 | 80.51 |
| 40 | 77.76 | 79.73 | 79.7 | 78.55 | 76.42 | 78.63 | 78.89 | 77.99 | 78.44 | 80.80 | 81.10 | 80.19 |
| 50 | 77.44 | 79.29 | 79.60 | 78.11 | 76.28 | 78.40 | 78.93 | 77.71 | 78.24 | 80.53 | 81.13 | 79.91 |
| 60 | 77.35 | 78.98 | 79.20 | 78.32 | 76.24 | 78.20 | 78.67 | 77.99 | 77.96 | 79.99 | 80.48 | 79.73 |
| 70 | 77.09 | 78.76 | 79.01 | 78.27 | 76.15 | 78.14 | 78.62 | 78.16 | 77.73 | 79.74 | 80.21 | 79.57 |
In this analysis, we use the mean of each block (Rain, Mode, and Max) as the reference value, and deviations are measured with respect to this central point.
- Rain (mean 78.65): the most stable metric, with a deviation range [−1.56, +1.43]; standard deviation ≈ 0.88; 100% of the values fall within ±2.
- Mode (mean 77.78): range [−1.70, +2.09]; standard deviation ≈ 1.07; 95% within ±2 and 100% within ±3.
- Max (mean 79.90): range [−2.17, +1.50]; standard deviation ≈ 1.10; 95% within ±2 and 100% within ±3.
The results indicate a low and controlled variability across the three metrics analyzed. All values lie within ±3 units of the mean, and at least 95% fall within ±2. This behavior reflects a good statistical stability, where the slight deviations observed in Mode and Max do not represent a significant compromise to the overall consistency of the data. As shown in Table 8, the number of images processed for classification depends on rainfall intensity and shape size. Figure 1 shows a case with a rainfall intensity of 50 mm/h and a shape size greater than 20 pixels.

Table A3.
Dataset preview: 2090 records and 8 variables. Includes shape descriptors and the target variable Rain (mm/h). Corresponding to a rainfall intensity of 50 mm/h and a shape size greater than 20 pixels.
Table A3.
Dataset preview: 2090 records and 8 variables. Includes shape descriptors and the target variable Rain (mm/h). Corresponding to a rainfall intensity of 50 mm/h and a shape size greater than 20 pixels.
| RR | CAC | RSG | FF | RF | MR | CA | Rain (Mean) | |
|---|---|---|---|---|---|---|---|---|
| 1 | 0.065207 | 0.616131 | 1.152256 | 0.30147 | 0.40026 | 0.783499 | 0.768332 | 522.371316 |
| 2 | 0.168134 | 0.51211 | 0.926109 | 0.331562 | 0.284373 | 0.790743 | 0.694915 | 66.610856 |
| 3 | 0.072836 | 0.544925 | 0.613198 | 0.428816 | 0.16124 | 0.711123 | 0.828571 | 71.07168 |
| 4 | 0.189269 | 0.524034 | 0.710681 | 0.581251 | 0.293571 | 0.766087 | 0.898999 | 77.886964 |
| 5 | 0.45881 | 0.605061 | 0.811115 | 0.675506 | 0.444421 | 0.834784 | 0.885496 | 108.083906 |
| … | … | … | … | |||||
| 2086 | 0.239925 | 0.509584 | 0.816662 | 0.545794 | 0.36401 | 0.780322 | 0.812057 | 103.593554 |
| 2087 | 0.509364 | 0.677834 | 0.705976 | 1.2428 | 0.619414 | 0.897059 | 0.947368 | 76.053625 |
| 2088 | 0.361507 | 0.627395 | 1.146804 | 0.340765 | 0.44816 | 0.853739 | 0.746207 | 97.244481 |
| 2089 | 0.143326 | 0.524079 | 1.105967 | 0.396274 | 0.484708 | 0.795356 | 0.779934 | 198.149218 |
| 2090 | 0.292364 | 0.594964 | 0.94791 | 0.519156 | 0.466479 | 0.8156 | 0.808594 | 107.562615 |
Appendix B
Algorithm AnalysisRainGOES13
| //Algorithm for processing rainfall intensity data and performing PCA and k-means. The rainfall_April.csv database contains image segmentation from 22 October 2015, at 12:15 a.m. to 24 October 2015, at 8:15 p.m. During this period, the hurricane went from Category I to Category V and then back to Category I. |
CONTEXT OF THE PROBLEM
|
| INPUT: Set of CSV files (file1, file2, …, file133), pixels, rain OUTPUT: Final classification using k-means based on principal components and shape descriptors. Component projection graphs, correlation circle, and generated clusters. |
STEPS:
- Data loading
- 1.1.
- Read all CSV files containing rainfall intensity information (each cell is a pixel).
- 1.2.
- Store the data in a structure (e.g., list of DataFrames or multidimensional array).
- Define precipitation threshold
- 2.1.
- For each CSV file:
- 2.1.1.
- Apply a filter to retain only those pixels with rainfall intensity > rain mm/h.
- 2.1.2.
- Generate a new file or data structure with precipitation above that threshold
- Image segmentation
- 3.1.
- On the resulting heavy precipitation file:
- 3.2.
- Identify continuous regions of rainfall.
- 3.3.
- Calculate the area (in number of pixels) of each region.
- 3.4.
- Filter and keep only regions with an area > pixels.
- Extraction of statistics and descriptors
- 4.1.
- For each region identified in each filtered file:
- 4.2.
- Calculate the following statistics: Area, ConvexArea, Perimeter, maximum radius, minimum radius, average rainfall intensity in each shape, mode of each shape, maximum of each shape, median, standard deviation, and variance of each shape.
- 4.3.
- From these statistics, calculate the shape and convexity descriptors: MR, RR, CAC, RSG, FF, RF, CA
- Preparation of data for PCA
- 5.1.
- Combine the information from all files (regions and descriptors) into a single dataset.
- 5.2.
- Ensure that each row (observation) contains:
- 5.3.
- Variables (descriptors) [MR, RR, CAC, RSG, FF, RF, CA]
- 5.4.
- Rainfall intensity
- 5.5.
- Also additional statistics (mode, maximum, mean) depending on the analysis required.
- 5.6.
- Normalize the variables.
- Application of PCA
- 6.1.
- Perform six PCA processes:
- 6.2.
- Two and three main components in each analysis.
- 6.3.
- Vary the variables considered (e.g., average variables, mode, maximum value, etc.).
- 6.4.
- Obtain the loadings for each variable and the scores for each observation.
- Classification with k-means
- 7.1.
- For each of the PCA results (scores with 2 or 3 components):
- 7.2.
- Apply the k-means algorithm to group the observations.
- 7.3.
- Determine the optimal number of groups (k) according to the Elbow Method criterion.
- Generating results and visualizations
- 8.1.
- Plot the projections of the principal components (2D or 3D) colored by the k-means clusters.
- 8.2.
- Generate the correlation circle to interpret the contribution of each variable to the principal components.
- 8.3.
- Display tables or graphs illustrating the classification obtained and the relationship with rainfall intensity.
- 8.4.
- Interpret the results.
- End of algorithm
References
- Dvorak, V.F. A Technique for the Analysis and Forecasting of Tropical Cyclone Intensities from Satellite Pictures; NOAA technical memorandum NESS; NESDIS (National Environmental Satellite, Data, and Information Service): Suitland, Maryland, 1973.
- Dvorak, V.F. Tropical Cyclone Intensity Analysis and Forecasting from Satellite Imagery. Mon. Weather. Rev. 1975, 103, 420–430. [Google Scholar] [CrossRef]
- Dvorak, V.F. Tropical Cyclone Intensity Analysis Using Satellite Data; US Department of Commerce, National Oceanic and Atmospheric Administration, National Environmental Satellite, Data, and Information Service: Silver Spring, Maryland, 1984.
- Velden, C.S.; Harper, B.; Wells, F.C.; Beven, J.L.; Zehr, R.; Olander, T.L.; Mayfield, M.; Lander, M.A.; Edson, R.T.; Avila, L.A.; et al. The Dvorak Tropical Cyclone Intensity Estimation Technique: A Satellite-Based Method That Has Endured for over 30 Years. Bull. Am. Meteorol. Soc. 2006, 87, 1195–1210, Supplement in Bull. Am. Meteorol. Soc. 2006, 87, S6–S9. https://doi.org/10.1175/bams-87-9-velden. [Google Scholar] [CrossRef]
- Zhou, Y.; Matyas, C.J. Regionalization of Precipitation Associated with Tropical Cyclones Using Spatial Metrics and Satellite Precipitation. GIScience Remote Sens. 2021, 58, 542–561. [Google Scholar] [CrossRef]
- Houze, R.A. Mesoscale Convective Systems. Rev. Geophys. 2004, 42, 1–43. [Google Scholar] [CrossRef]
- Schiesser, H.H.; Houze, R.A.; Huntrieser, H. The Mesoscale Structure of Severe Precipitation Systems in Switzerland. Mon. Weather. Rev. 1995, 123, 2070–2097. [Google Scholar] [CrossRef]
- Velden, C.S.; Olander, T.L.; Zehr, R.M. Development of an Objective Scheme to Estimate Tropical Cyclone Intensity from Digital Geostationary Satellite Infrared Imagery. Weather. Forecast. 1998, 13, 172–186. [Google Scholar] [CrossRef]
- Ahmed, R.; Mohapatra, M.; Giri, R.K.; Dwivedi, S. An Evaluation of the Advanced Dvorak Technique (9.0) for the Topical Cyclones over the North Indian Ocean. Trop. Cyclone Res. Rev. 2021, 10, 201–208. [Google Scholar] [CrossRef]
- Kossin, J.P.; Emanuel, K.A.; Vecchi, G.A. The Poleward Migration of the Location of Tropical Cyclone Maximum Intensity. Nature 2014, 509, 349–352. [Google Scholar] [CrossRef]
- Kawabata, Y.; Shimada, U.; Yamaguchi, M. The 30-Year (1987–2016) Trend of Strong Typhoons and Genesis Locations Found in the Japan Meteorological Agency’s Dvorak Reanalysis Data. Kisho shushi. J. Meteorol. Soc. Jpn. 2023, 101, 435–443. [Google Scholar] [CrossRef]
- Brown, D.; Franklin, J. Dvorak Tropical Cyclone Wind Speed Biases Determined from Reconnaissance-Based “Best Track” Data (1997–2003). In Proceedings of the 26th Conference on Hurricanes and Tropical Meteorology, Miami, FL, USA, 3–7 May 2004. [Google Scholar]
- Sangster, S.J.; Landsea, C.W. Constraints in Dvorak Wind Speed Estimates: How Quickly Can Hurricanes Intensify? Weather Forecast. 2020, 35, 1235–1241. [Google Scholar] [CrossRef]
- Nakazawa, T.; Hoshino, S. Intercomparison of Dvorak Parameters in the Tropical Cyclone Datasets over the Western North Pacific. Sola 2009, 5, 33–36. [Google Scholar] [CrossRef]
- Zick, S.E. Anatomy of a Storm: A Review of Shape Analysis Research That Fuses Form and Function in Weather Forecasting and Analysis. Prog. Phys. Geogr. Earth Environ. 2022, 47, 152–170. [Google Scholar] [CrossRef]
- Aguilar, J. Severidad por Intensidad de Tormenta Asociada a su Evolución Geométrica Utilizando Redes Neuronales Artificiales; Universidad Autónoma de Querétaro, Facultad de Ingeniería: Santiago de Querétaro, Mexico, 2019; Available online: https://ri-ng.uaq.mx/handle/123456789/1762?mode=full (accessed on 23 May 2025).
- Servicio Meteorológico Nacional. Portal Oficial del Servicio Meteorológico Nacional. 2024. Available online: https://smn.conagua.gob.mx/es/ (accessed on 23 May 2025).
- Gutierrez-Lopez, A. Methodological Guide to Forensic Hydrology. Water 2022, 14, 3863. [Google Scholar] [CrossRef]
- Meza-Ruiz, M.; Gutierrez-Lopez, A. Goes-13 IR Images for Rainfall Forecasting in Hurricane Storms. Forecasting 2020, 2, 85–101. [Google Scholar] [CrossRef]
- Cox, E.P. A Method of Assigning Numerical and Percentage Values to the Degree of Roundness of Sand Grains. J. Paleontol. 1927, 1, 179–183. [Google Scholar]
- Pentland, A. A method of measuring the angularity of sands. Acta Eng. Dom. Trans. R. Soc. Can. 1927, 21. [Google Scholar]
- Ritter, N.; Cooper, J. New Resolution Independent Measures of Circularity. J. Math. Imaging Vis. 2009, 35, 117–127. [Google Scholar] [CrossRef]
- Zunic, J.; Rosin, P.L. A New Convexity Measure for Polygons. IEEE Trans. Pattern Anal. Mach. Intell. 2004, 26, 923–934. [Google Scholar] [CrossRef] [PubMed]
- Yaglom, I.M.; Boltyanskii, V.G. Convex Figures; State Publishing House for Technical and Theoretical Literature: Moscow, Russia, 1951. (In Russian) [Google Scholar]
- Szasz, O.; Rosenthal, A. Eine Extremaleigenschaft Der Kurven Konstanter Breite. Jahresber. Der Dtsch. Math. Ver. 2025, 25, 278–282. [Google Scholar]
- Kubara, M. Katarzyna Kopczewska Akaike Information Criterion in Choosing the Optimal K-Nearest Neighbours of the Spatial Weight Matrix. Spat. Econ. Anal. 2023, 19, 73–91. [Google Scholar] [CrossRef]
- Ryu, S.; Hong, S.-E.; Park, J.-D.; Hong, S. An Improved Conversion Relationship between Tropical Cyclone Intensity Index and Maximum Wind Speed for the Advanced Dvorak Technique in the Northwestern Pacific Ocean Using SMAP Data. Remote Sens. 2020, 12, 2580. [Google Scholar] [CrossRef]
- Rodgers, E.; Gentry, R.C.; Shenk, W.; Oliver, V. The Benefits of Using Short-Interval Satellite Images to Derive Winds for Tropical Cyclones. Mon. Weather. Rev. 1979, 107, 575–584. [Google Scholar] [CrossRef][Green Version]
- Yang, W.; Fei, J.; Huang, X.; Ding, J.; Cheng, X. Enhancing Tropical Cyclone Intensity Estimation from Satellite Imagery through Deep Learning Techniques. J. Meteorol. Res. 2024, 38, 652–663. [Google Scholar] [CrossRef]
Disclaimer/Publisher’s Note: The statements, opinions and data contained in all publications are solely those of the individual author(s) and contributor(s) and not of MDPI and/or the editor(s). MDPI and/or the editor(s) disclaim responsibility for any injury to people or property resulting from any ideas, methods, instructions or products referred to in the content. |
© 2025 by the authors. Published by MDPI on behalf of the International Society for Photogrammetry and Remote Sensing. Licensee MDPI, Basel, Switzerland. This article is an open access article distributed under the terms and conditions of the Creative Commons Attribution (CC BY) license (https://creativecommons.org/licenses/by/4.0/).
