Article

Long-Term LULC Monitoring in El Jadida, Morocco (1985–2020): A Machine Learning-Based Comparative Analysis

Geodynamics and Geomatics Laboratory, Faculty of Science, University Chouaib Doukkali, El Jadida 24000, Morocco
*
Author to whom correspondence should be addressed.
ISPRS Int. J. Geo-Inf. 2025, 14(11), 445; https://doi.org/10.3390/ijgi14110445
Submission received: 10 September 2025 / Revised: 4 November 2025 / Accepted: 7 November 2025 / Published: 10 November 2025

Abstract

Recent advancements in remote sensing and geospatial processing tools have ushered in a new era of mapping and monitoring landscape changes across various scales. This progress is critical for understanding and anticipating the underlying drivers of environmental change. In particular, large-scale Land Use and Land Cover (LULC) mapping has become an indispensable tool for territorial planning and monitoring. This study aims to map and evaluate LULC changes in the El Jadida region of Morocco between 1985 and 2020. Utilizing multispectral Landsat imagery, we applied and compared three supervised machine learning classification algorithms: Random Forest (RF), Support Vector Machine (SVM), and Neural Network (NNET). Model performance was assessed using statistical metrics, including overall accuracy, the Kappa coefficient, and the F1 score. The results indicate that the RF algorithm was the most effective, achieving an overall accuracy of 90.3% and a Kappa coefficient of 0.859, outperforming both NNET (81.3%; Kappa = 0.722) and SVM (80.2%; Kappa = 0.703). Analysis of explanatory variables underscored the decisive contribution of the NDWI, NDBI, and SWIR and thermal bands in discriminating land cover classes. The spatio-temporal analysis reveals significant urban expansion, primarily at the expense of agricultural land, while forested areas and water bodies remained relatively stable. This trend highlights the growing influence of anthropogenic pressure on landscape structure and underscores its implications for sustainable resource management and land use planning. The findings demonstrate the high efficacy of machine learning, particularly the RF algorithm, for accurate LULC mapping and change detection in the El Jadida region. This study provides a critical evidence base for regional planners to address the ongoing loss of agricultural land to urban expansion.

1. Introduction

Land use and land cover (LULC) changes represent a significant global environmental challenge, with implications for natural resource management and ecosystem sustainability [1,2]. LULC dynamics directly or indirectly affect human societies and ecosystems, increasing vulnerability to climate change, degrading soil quality, reducing ecosystem services, and compromising agricultural productivity [3,4]. The prevalent change is the rapid expansion of urban areas into the agricultural land market, changing the spatial distribution of people and economic activities, and complicating land use management [5,6]. The accelerated urbanization and the related changes in land use are having significant environmental impacts. These continually increasing impacts include, among others, soil compaction, soil artificialization, organic matter loss [7], biodiversity loss, water and air resource pollution, and greenhouse gas emissions [8,9].
To monitor and understand these transformations, satellite remote sensing has emerged as a fundamental and indispensable tool. The Landsat program, through its successive sensors (TM, ETM+, and OLI), has provided continuous and freely accessible multispectral data since the 1980s, enabling consistent monitoring across large spatial and temporal scales. These archives make it possible to detect both gradual and abrupt surface modifications. When combined with machine learning (ML) algorithms, satellite time series analyses can effectively capture spatial and temporal landscape variability with enhanced precision and reliability [10,11,12].
In recent years, advances in computational capacity and the emergence of machine learning methods applied to satellite imagery have further improved the accuracy and performance of LULC classification [13]. Supervised algorithms such as Random Forest (RF), Support Vector Machine (SVM), and Artificial Neural Networks (NNET) have shown strong capabilities in discriminating between land cover classes and identifying subtle temporal changes [14,15,16]. The performance of these methods, however, depends heavily on data quality, spatial and spectral resolution, training sample selection, and model configuration, underscoring the need for comparative analyses tailored to local contexts [17]. Furthermore, the long-term continuity of Earth observation programs (e.g., Landsat) provides an exceptional opportunity to assess landscape evolution over several decades [11]. Beyond simple land cover mapping, satellite time series have been successfully used in diverse applications such as crop type classification [18] and crop yield estimation for sugar beet in irrigated areas [19] and wheat in rainfed systems [20].
Several recent studies confirm the effectiveness of these algorithms. Mutale et al. [21] demonstrated that RF and ANN achieved overall accuracy above 90% and outperformed SVM in both urban and agricultural landscapes. Zaman et al. [22] confirmed the performance of RF and SVM in detecting landscape transitions over time using spatio-temporal models. Tesfaye et al. [23] also applied Google Earth Engine (GEE) to compare RF, SVM, and CART over three decades and found that RF, when combined with spectral indices, achieved the highest classification accuracy. Although deep learning and ensemble algorithms such as Convolutional Neural Networks (CNN) and Extreme Gradient Boosting (XGBoost) have shown excellent results, they require large training datasets, high computational resources, and often lack interpretability [12,24]. Therefore, for moderate datasets and long-term analyses, traditional ML algorithms remain the most practical and transparent choice.
In North African countries, numerous studies have examined land use and land cover dynamics using multispectral satellite data; however, most have employed broad temporal intervals, limiting their ability to detect progressive landscape transformations. In Tunisia, Kadri et al. [25] assessed four decades of land cover change using Landsat time series and Random Forest classification on Google Earth Engine, revealing pronounced shifts in semi-arid landscapes. In Algeria, Selka et al. [26] and Hind et al. [27] reported significant urban expansion and vegetation decline in Tlemcen and Algiers, respectively, based on multi-decadal Landsat analyses, while in Egypt, Radwan et al. [28] and Youssef et al. [29] documented rapid urbanization and agricultural land loss in the Nile Delta. Collectively, these studies provide valuable insights into regional land dynamics, yet their broad temporal resolution constrains the ability to capture progressive or cumulative landscape transitions.
The El Jadida region, located along Morocco’s Atlantic coast, provides a representative case study of the complex interactions between human pressure and environmental constraints. It exemplifies the challenges faced by semi-arid agricultural zones in North Africa, where urban growth competes directly with the preservation of fertile croplands. The region’s flat topography, productive soils, and proximity to the Atlantic make it a key agricultural area; however, increasing demographic pressure, industrial development, and tourism expansion have intensified land artificialization. Recurrent droughts and groundwater depletion further exacerbate these pressures, reducing agricultural productivity and threatening ecosystem resilience. As such, El Jadida serves as an emblematic example of the sustainability challenges confronting Mediterranean and semi-arid coastal regions.
Previous studies investigating LULC mapping in this region have adopted diverse methodological approaches. For instance, spectral index thresholding based on rule-based decision trees was applied by El Mjiri et al. [30], while Skittou et al. [31] employed deep learning techniques. Other research has explored unsupervised clustering methods, such as k-means or learning vector quantization (LVQ), to extract meaningful information without prior labeling [32,33]. However, most of these studies relied either on single-date imagery from only two distinct years [34] or on time series with large temporal gaps, typically at intervals of around ten years [35]. Using narrower intervals (e.g., every five years) and generating median composite images for the entire year [35,36] has not yet been explored.
To overcome existing limitations in LULC monitoring, this study employs an enhanced temporal resolution framework based on five-year Landsat composites (1985–2020) using median aggregation to minimize atmospheric noise and cloud contamination. This approach ensures a continuous and consistent depiction of landscape evolution, facilitating the detection of both gradual and abrupt transitions. Within this framework, satellite time series are integrated with a machine learning-based classification approach in a harmonized multi-sensor environment to analyze the spatial and temporal dynamics of LULC in the El Jadida region. The methodology encompasses data acquisition and preprocessing, model training and validation, spatiotemporal analysis at five-year intervals, and the interpretation of results from a sustainable land management perspective. Collectively, this integrated framework enhances classification accuracy, improves understanding of landscape transformation processes, and provides a robust, transferable foundation for evidence-based land use planning and urban development in Morocco and across North Africa.

2. Materials and Methods

2.1. Study Area

The El Jadida region is located in west–central Morocco (Figure 1), between latitudes 32°00′–33°00′ N and longitudes 8°00′–9°30′ W. It encompasses a significant portion of the vital agricultural Doukkala plain, a region renowned nationally for its high productivity. The topography is mainly flat, with a slight slope towards the west in the direction of the Atlantic Ocean. This favorable geography, combined with significant arable land and water resources, underscores the region’s strategic importance for intensive agriculture. The soils of the Doukkala plain are highly diverse, reflecting a wide range of local edaphic conditions [37]. The climate is characterized as semi-arid with a temperate winter and a marked oceanic influence, resulting in hot, dry summers. Precipitation follows a Mediterranean pattern, with the rainy season occurring from October to May. The mean annual rainfall is approximately 371 mm, with a decreasing gradient from the coast towards the interior. Thermally, the region exhibits low interannual variability, with an annual average temperature of 18.5 °C. A distinct bi-modal pattern defines the yearly cycle: a warm period from May to October, with average maximum temperatures reaching 27.3 °C, and a cooler period from November to April, with average minimum temperatures of 10.9 °C.

2.2. Datasets

2.2.1. Satellite Images Acquisition and Processing

The methodological framework of this study integrates the analysis of high-resolution multispectral satellite imagery from eight distinct years (1985, 1990, 1995, 2000, 2005, 2010, 2015, and 2020) acquired from the Landsat program (TM, ETM+, and OLI sensors) with advanced machine learning algorithms for LULC classification. This synergistic approach enables detailed spatial mapping and robust tracking of LULC changes over time. Remote sensing provides consistent, large-area coverage at regular intervals, offering a comprehensive data foundation. By coupling these temporal data with artificial intelligence techniques, the method addresses key limitations of traditional classification approaches enhancing both the accuracy and scalability of LULC change detection [38,39] and other remote sensing applications [36,40].
Landsat surface reflectance data were sourced from the GEE data catalog, specifically utilizing the Tier 1 collections for the Thematic Mapper (TM), Enhanced Thematic Mapper Plus (ETM+), and Operational Land Imager (OLI) sensors (dataset identifiers: LANDSAT/LT05/C01/T1_SR, LANDSAT/LE07/C01/T1_SR, and LANDSAT/LC08/C01/T1_SR, respectively). All subsequent processing was conducted using the GEE platform [32]. Pixels contaminated by clouds and cloud shadows were systematically masked using the quality assessment (QA_PIXEL) band to minimize noise in subsequent analyses [32,40]. A sensor harmonization procedure was applied to ensure radiometric consistency across the multi-sensor, multi-temporal data archive [41]. This was performed using Ordinary Least Square (OLS) regression coefficients with a slope and intercept constant of each band [32].
The following spectral bands were retained for analysis: blue, green, red, near-infrared (NIR), shortwave infrared 1 (SWIR1), shortwave infrared 2 (SWIR2), and thermal infrared. A suite of spectral indices was computed to enhance the discrimination of specific land cover properties:
-
Normalized Difference Vegetation Index (NDVI = (NIRRed)/(NIR + Red)): Utilized to quantify vegetation density and photosynthetic activity.
-
Normalized Difference Water Index (NDWI = (GreenNIR)/(Green + NIR) Employed to identify water bodies and monitor vegetation water content.
-
Normalized Difference Moisture Index (NDMI = (NIRSWIR1)/(NIR + SWIR1) Sensitive to vegetation water stress and moisture content in canopies.
-
Soil-Adjusted Vegetation Index (SAVI = ((NIRRed)/(NIR + Red + 0.5)) * 1.5): Introduced a soil brightness correction factor (L = 0.5) to minimize the influence of bare soil on vegetation signals in arid regions.
-
Modified Soil-Adjusted Vegetation Index (MSAVI = (2 * NIR + 1 − sqrt ((2 * NIR + 1)2 − 8 * (NIRRed)))/2): An iterative improvement upon SAVI that dynamically adjusts the soil background correction.
-
Normalized Difference Built-up Index (NDBI = (SWIR1NIR)/(SWIR1 + NIR)): Calculated to highlight impervious surfaces and built-up areas.
-
Dry Bare Soil Index (DBSI = ((SWIR1 − Green)/(SWIR1 + Green)) − NDVI): Employed to improve classification accuracy by isolating barren land in arid and semi-arid environments.
For each study year (1985, 1990, 1995, 2000, 2005, 2010, 2015, 2020, and 2022), all available images within the annual period from 21 December of the preceding year to 20 December of the target year were compiled. A per-pixel median composite was then generated for each annual period from the stack of spectral bands and derived indices to produce a representative, cloud-reduced image for further analysis.

2.2.2. Ground Data

A dataset of 4230 validated ground truth samples was used to identify six land cover classes, forming the basis for supervised classification. Training sites for these classes, including bare soil (772), beach (6), buildings (721), cropland (2019), forest (184), and water (528), were delineated through the integration of field data using Google Earth Pro imagery. Ground data collection was conducted using visual interpretation of stable land-cover classes observed consistently over 2010, 2015, and 2020, ensuring temporal stability. In addition, intra-annual consistency was verified; for example, forest types in the study area remain green throughout the year. Sampling points were selected using a random, spatially well-distributed approach to ensure full coverage of the study area and avoid spatial gaps. To ensure a consistent comparative framework, the same set of training sites was applied to all classification algorithms employed in this study, enabling the development of robust models for accurate thematic mapping.

2.3. Predictive Modeling

Three widely recognized supervised learning algorithms (RF, SVM, and NNET) were used in this research to differentiate between LULC types. These algorithms were selected based on their proven reliability within the remote sensing domain [14,15,21] and their suitability for the characteristics of our dataset. The RF algorithm was chosen for its ability to effectively process heterogeneous, multi-sensor Landsat datasets while reducing the effects of noise and radiometric variability [42,43]. The SVM was selected for its effectiveness in handling high-dimensional feature spaces and limited training samples [44]. The NNET was used for its ability to model complex, non-linear interactions between spectrally similar classes such as cropland and bare soil [37,45].
RF, an ensemble learning algorithm, was employed for classification due to its robustness and widespread application [46]. The RF algorithm operates by constructing a multitude of decision trees, each trained on a bootstrapped sample of the data and a random subset of features at each node. Predictions are made by aggregating the outputs of all trees through a majority vote mechanism, which enhances generalization and mitigates overfitting.
The SVM algorithm was applied, a method renowned for its effectiveness in high-dimensional classification tasks. The core objective of SVM is to identify the optimal hyperplane that maximizes the margin of separation between classes, thereby enhancing the model’s generalization capability [47]. To handle non-linearly separable data, kernel functions are employed to project inputs into a higher-dimensional feature space.
The NNET classifier was implemented to model the complex, non-linear relationships inherent in the remote sensing data. The model’s architecture consists of multiple layers of interconnected neurons that collaboratively learn hierarchical feature representations [48,49]. Computationally, each neuron applies a weighted sum of its inputs followed by a non-linear activation function.
For hyperparameter tuning, we adopted algorithm-specific optimization strategies via a grid search approach combined with cross-validation. Following [45,50], the RF algorithm was tuned solely on the mtry parameter, which has been shown to exert the greatest influence on model performance. We tested mtry values ranging from 2 to 10, with an increment of 1. For the SVM classifier, a linear kernel was used, and the cost parameter was tuned across values of 0.1, 0.2, 0.5, and 1, along with testing two loss functions (L1 and L2). For the NNET, we optimized the number of hidden units (5, 10, and 15) and the learning weight decay parameter, evaluated at 0.001, 0.01, and 0.1.

2.4. Accuracy Assessment of Models

A stratified sampling strategy was implemented to ensure a representative and balanced distribution of all land cover classes prior to dataset partitioning. Subsequently, the dataset was divided into two subsets, comprising 70% for model training and 30% for validation. The accuracy assessment was conducted on the validation subset using the Kappa coefficient, overall accuracy (OA), and F1-score, providing a comprehensive evaluation of the model’s classification performance and agreement reliability.
K a p p a = N i = 1 r n i i i = 1 r ( n i + × n + i ) N 2 i = 1 r ( n i + × n + i )
where
n i i is the number of correctly classified pixels for class i .
n i + and n + i are the row and column totals of the confusion matrix for class i ,   r e s p e c t i v e l y .
N is total number of validation samples.
r is the total number of land cover class.
O A = i = 1 r n i i N
F 1   s c o r e = 2 · T P 2 · T P + F P + F N = 2 · p r e c i s i o n · r e c a l l p r e c i s i o n + r e c a l l
T P , F P and F N represent the number of true positives, false positives and false negatives for class, respectively.

3. Results and Discussion

3.1. Overall Statistics of Machine Learning Models

The classification performance of three machine learning models (SVM, RF, and NNET) was rigorously evaluated using overall accuracy and 95% confidence intervals (Table 1). The RF model, optimized via cross-validated grid search (optimal mtry = 7), demonstrated superior performance with 90.3% accuracy and a Kappa coefficient of 0.859, indicating excellent agreement with ground truth. The NNET model attained an accuracy of 81.3%, slightly outperforming SVM, which yielded 80.2% accuracy. Both models, however, were statistically inferior to RF.
For the SVM model, the L2 loss function proved more robust than L1, consistently achieving high accuracy (≈0.8) across all cost parameters with greater stability, while L1 exhibited higher variability and required precise parameter tuning to reach optimal performance.
The optimal NNET architecture incorporated 14 input features processed through a single hidden layer of 10 neurons, with weight decay regularization set to 0.1. This configuration effectively balanced complexity and predictive capability while mitigating overfitting. The output layer corresponded to the six target land cover classes: bare soil, beach, built-up areas, cropland, forest, and water.

3.2. Separability of Classes by Machine Learning Classifiers

The confusion matrices of the three classifiers (Table 2, Table 3 and Table 4) reveal clear differences in their ability to discriminate land cover categories. Overall, all models achieved strong results for spectrally distinct categories such as water and forest, whereas considerable confusion persisted among bare soil, buildings, and cropland, which exhibit overlapping reflectance properties in the NIR and SWIR spectral regions.
To further characterize these variations, an assessment for each class of land cover using the F1 score was performed. By combining user accuracy (UA) and producer accuracy (PA), this metric provides a balanced assessment of model performance, particularly useful for classes affected by spectral confusion.
The RF model exhibited the most balanced performance across all categories, with a mean F1-score of 0.89. Water was perfectly classified (157 correct cases; F1 = 1), and forest achieved high recognition (51 correct cases; F1 = 0.94). Cropland was reliably detected (575 correct cases; F1 = 0.93), although moderate confusion occurred with bare soil and buildings. Bare soil (190 correct cases; F1 = 0.84) and buildings (171 correct cases; F1 = 0.82) were reasonably well distinguished despite partial spectral overlap. The beach class displayed limited representation within the study area and, in some years, was not detectable due to its very small spatial extent.
The SVM model, while performing equally well for water (158 correct cases; F1 = 1) and forest (49 correct cases; F1 = 0.94), showed greater sensitivity to spectral similarity. Specifically, bare soil and buildings were frequently confused: 55 bare soil samples were misclassified as buildings, and 22 building samples were predicted as cropland. Cropland retained relatively high accuracy (566 correct cases; F1 = 0.86) but overlap with bare soil (104 misclassifications) reduced class separability. Bare soil showed the lowest performance (F1 = 0.44), while buildings reached F1 = 0.73. Overall, the mean F1-score for SVM was 0.83, confirming that, although it performs well for spectrally distinct classes, it remains more affected by spectral overlap than RF.
The NNET model produced intermediate results, performing well for water (158 correct cases; F1 = 1) and forest (50 correct out of 52; F1 = 0.93), but showing greater confusion among transitional categories. Cropland was accurately detected (562 correct cases; F1 = 0.87) yet frequently misclassified as bare soil (95 cases) or buildings (30 cases). The most pronounced confusion occurred between bare soil and built-up areas, with 37 bare soil pixels classified as buildings and 25 buildings misclassified as bare soil. This pattern suggests that, while NNET effectively captures spectrally distinct land cover types, its performance decreases for classes exhibiting both high intra-class variability and inter-class spectral overlap, resulting in moderate class separability (mean F1 = 0.85).
In summary, all classifiers achieved excellent separability for water and forest, confirming the distinctiveness of their spectral signatures. RF demonstrated the most accurate and balanced performance, making it particularly suitable for heterogeneous landscapes. SVM produced competitive results but was significantly affected by spectral confusion between bare soil and built-up areas, whereas NNET performed well for homogeneous categories but encountered difficulties with transitional zones. These findings underscore the importance of classifier selection in LULC mapping and confirm that misclassifications between bare soil, cropland, and built-up areas mainly result from their high spectral similarity, particularly in the NIR and SWIR regions. Integrating additional spectral indices (e.g., NDVI, NDBI, NDWI) and spatial–textural features can enhance class separability and improve the overall classification accuracy [51,52]. RF stands out for its ability to handle non-linearity and reduce the risk of overfitting [53,54], while SVMs, although effective in distinguishing classes with distinct signatures, are sensitive to parameter choices and imbalances in the training data [55,56]. The NNET model showed significant limitations in discriminating between transition classes, particularly between bare soil and built-up areas. This increased confusion can be explained by the high intra-class variability of these categories and the proximity of their spectral signatures, which make it difficult for a neural network to separate them. These results confirm the observations of [24,57], according to which the performance of NNETs depends heavily on the quality and representativeness of the training data as well as the architecture chosen.

3.3. Predictor Variable Importance and Class Correlation in the RF Model

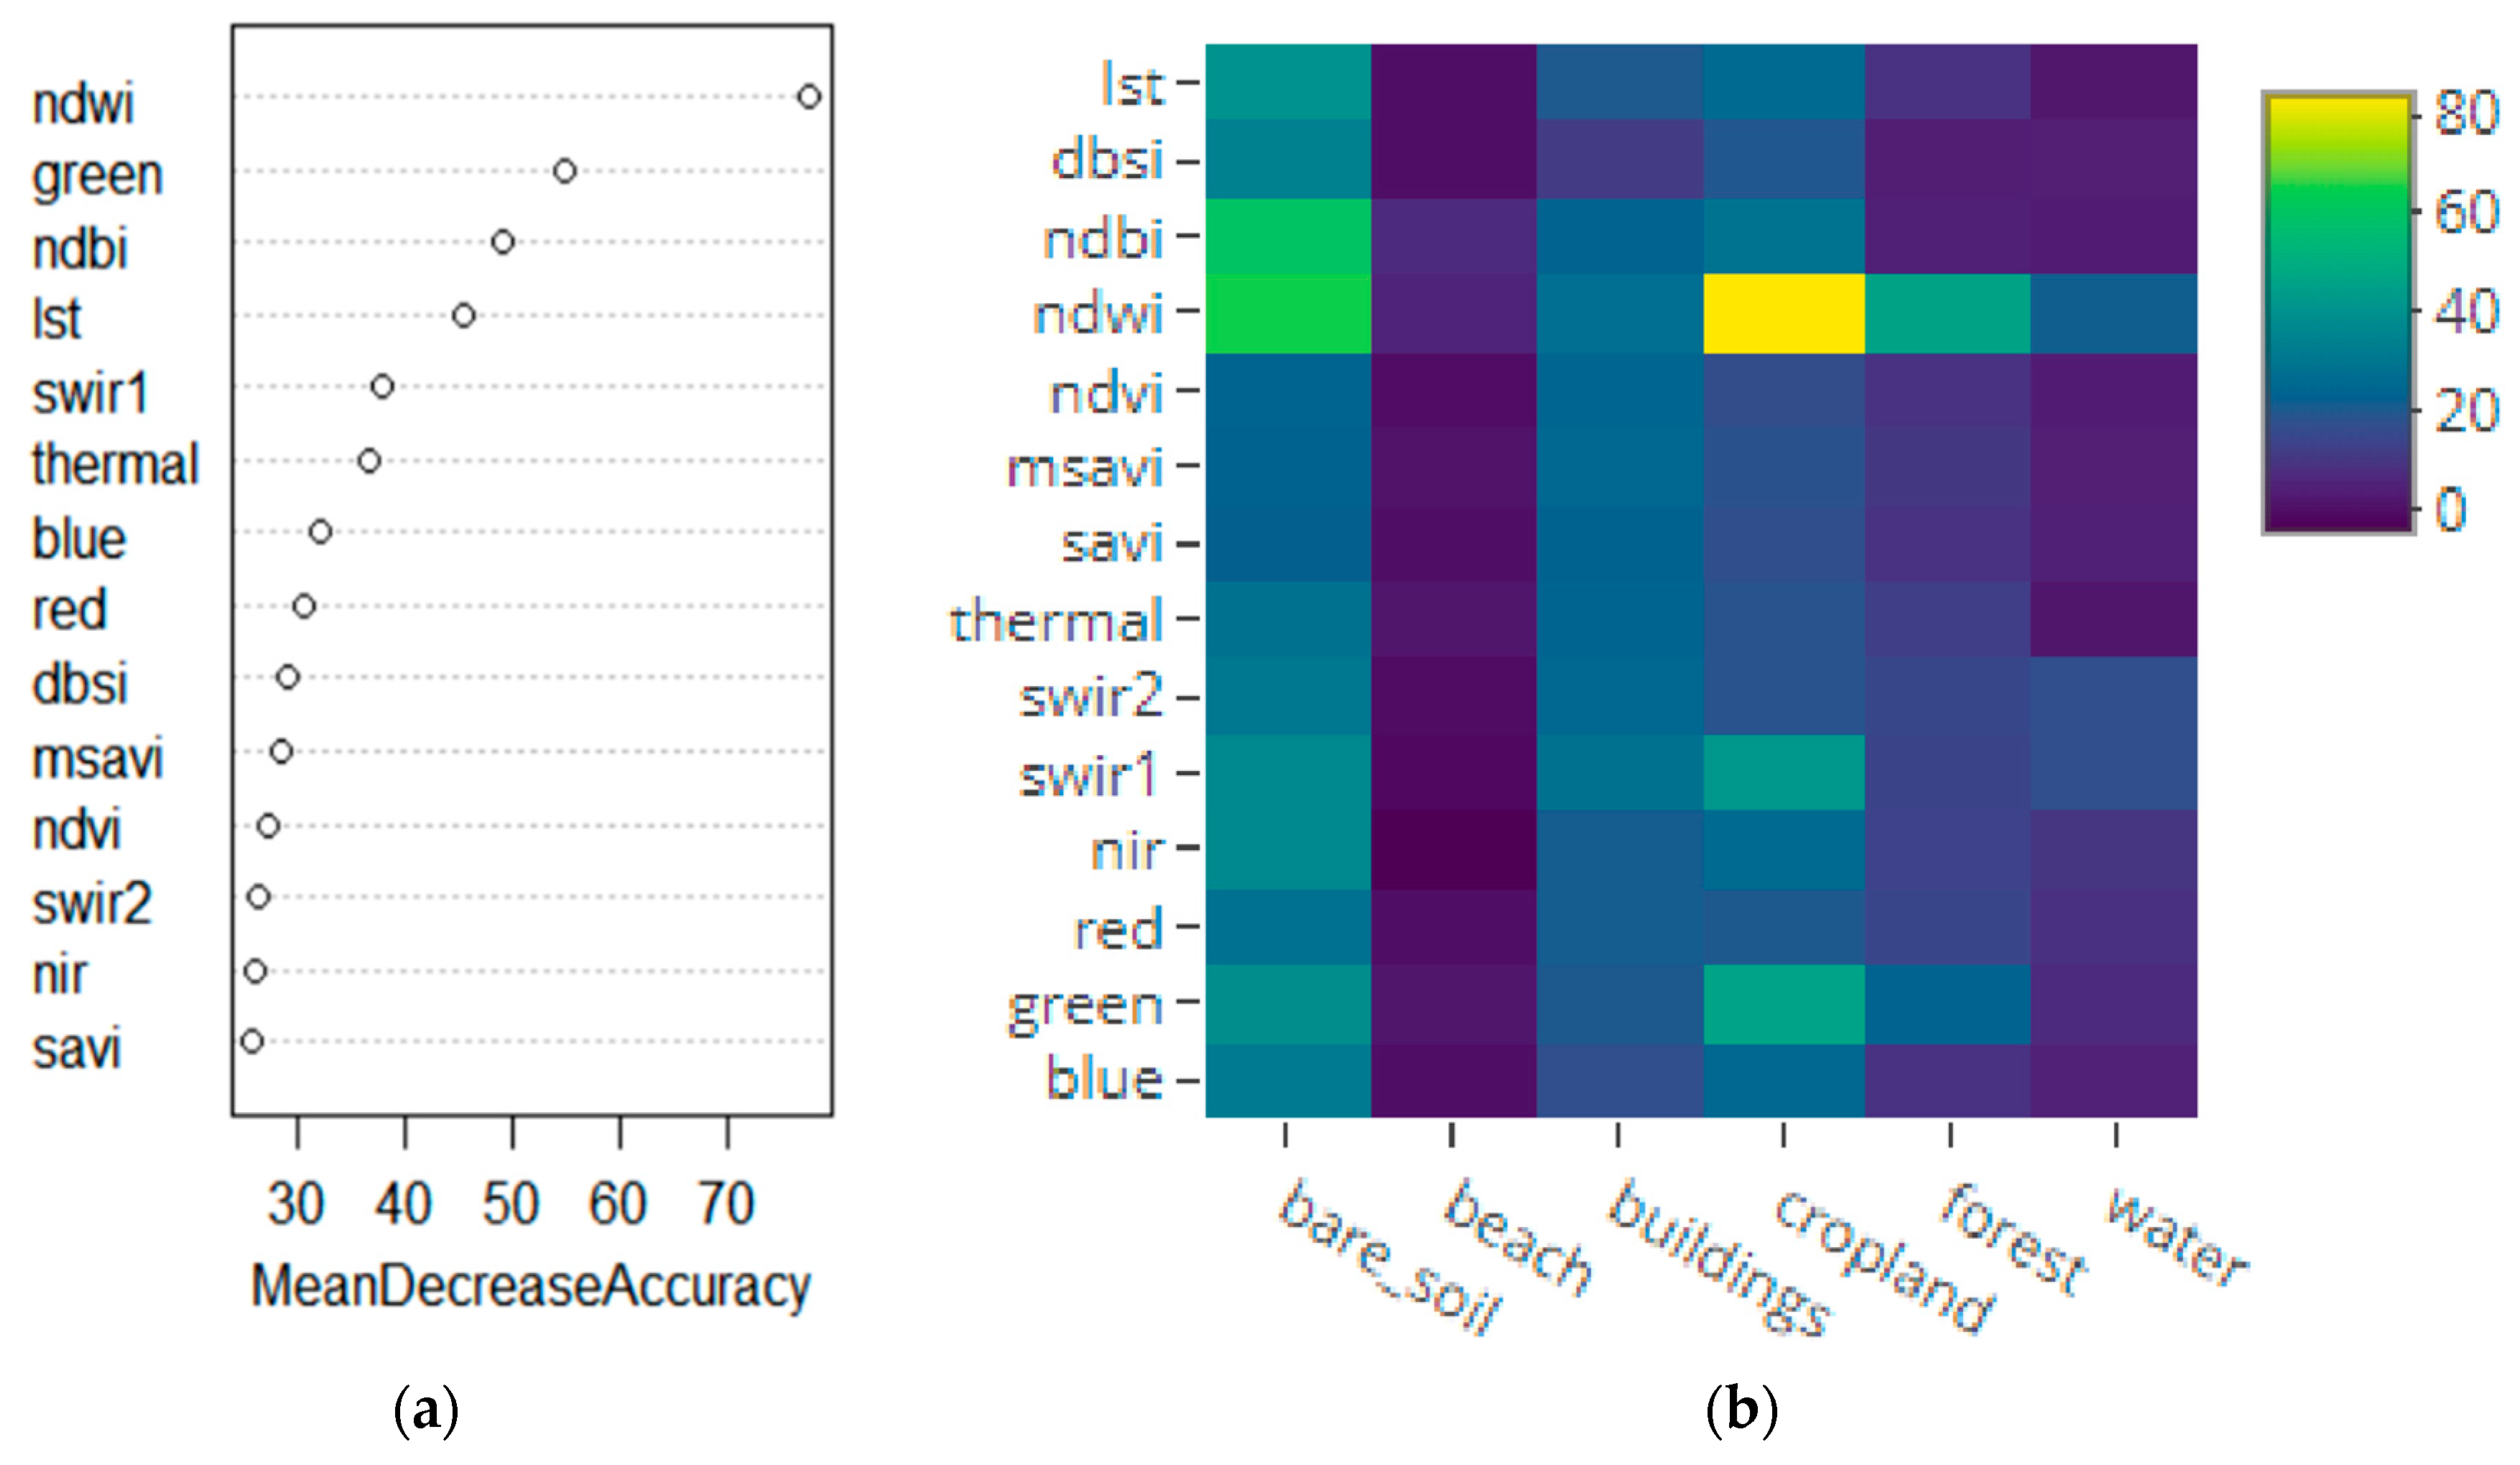
An analysis of variable importance within the optimal RF model reveals the relative contribution of spectral indices and raw bands to land cover classification (Figure 2a). The results indicate a clear hierarchy of predictive utility among the input variables. The analysis identifies the NDWI as the most potent predictor, followed by the green band, the NDBI, and Land Surface Temperature (LST). These key variables effectively captured the primary spectral and thermal characteristics (namely moisture content, vegetation presence, impervious surfaces, and heat) that were most discriminative for the land cover classification task.
NDWI’s primacy highlights a strong capacity to discriminate classes based on moisture content, as it effectively highlights water surfaces and wet areas by leveraging the contrast between the Green and Near-Infrared (NIR) bands. The Green band itself ranked as the second most important variable, confirming its utility in detecting vegetation vigor and moisture.
Substantial contributions were also observed from the NDBI, which effectively delineated urbanized zones, and LST, which provided critical information on thermal dynamics and contrasts between land cover types. The Short-Wave Infrared 1 (SWIR1) and Thermal bands further supported the model; SWIR1 contributed through sensitivity to soil moisture and vegetation structure, while the Thermal band directly measured emitted surface energy.
The blue and red bands demonstrated moderate importance. The blue band aids in detecting atmospheric features and water turbidity, while the red band’s key role in chlorophyll absorption makes it fundamental for calculating vegetation indices like NDVI and SAVI, even though those indices themselves showed limited influence.
In contrast, several traditionally valuable indices (including DBSI, MSAVI, NDVI, and SAVI) exhibited lower importance. This suggests that their utility for assessing vegetation and soil conditions was less critical for this specific classification task, potentially due to seasonal imagery or landscape homogeneity. The variables with the lowest rankings were the SWIR2 band, typically used for detecting fire and wetlands; the NIR band, which was unexpectedly less discriminative despite its common use in vegetation studies; and the SAVI index.
The importance of each variable is reflected in its specific correlations with the target land cover classes (Figure 2b). NDWI showed a significant correlation not only with the ‘water’ class, as expected, but also with ‘buildings’, a relationship potentially arising from spectral confusion with reflective impervious surfaces. Similarly, NDBI correlated strongly with ‘buildings’ and ‘bare soil’, validating its design to identify artificial structures and exposed earth.
The green and SWIR1 bands were strongly associated with ‘cropland’, aligning with their known sensitivity to vegetation health and soil moisture. The visible bands (Blue, Green, Red) showed weaker yet consistent correlations across all classes, indicating a broad, generalized spectral contribution without strong class-specific specialization.
The vegetation indices (NDVI, MSAVI, SAVI) displayed uniformly weak correlations, reinforcing their limited role in the model and suggesting subdued spectral differentiation from vegetation in the study area. In contrast, the thermal variables exhibited a moderate correlation with ‘bare soil’ and ‘beach’ classes, highlighting their utility in identifying classes characterized by higher surface temperatures due to minimal vegetation cover.
Analysis of the RF model showed that the NDWI, green band, NDBI, and LST indices are the main predictors for land cover classification, reflecting the combined importance of water, spectral, and thermal signals. NDWI effectively identifies humid areas, while NDBI and LST detect artificial surfaces and urban heat islands [58,59]. The green band complements this information by characterizing vegetation and soil moisture.
NDWI and NDBI can generate spectral confusion between built-up areas and water bodies in dense urban areas, reducing local accuracy [60]. The importance of variables depends heavily on spatial and seasonal context, with vegetation indices and topographic variables being more discriminating in rural or forested areas, while urban and thermal indices dominate in urban environments [61].
The vegetation indices used, such as NDVI, SAVI, and MSAVI, present reduced importance in this context. Several studies explain this lower contribution by spectral saturation phenomena in densely vegetated areas [62,63] but also by the redundancy of information contained in raw spectral bands and other indices that are more sensitive to moisture (e.g., NDWI and SWIR1). The low importance of NIR and SWIR2 is also notable, reflecting their limited contribution to the local conditions of the study, despite their recognized role in detecting vegetation and wetlands in other contexts.

3.4. Model Performance Comparison

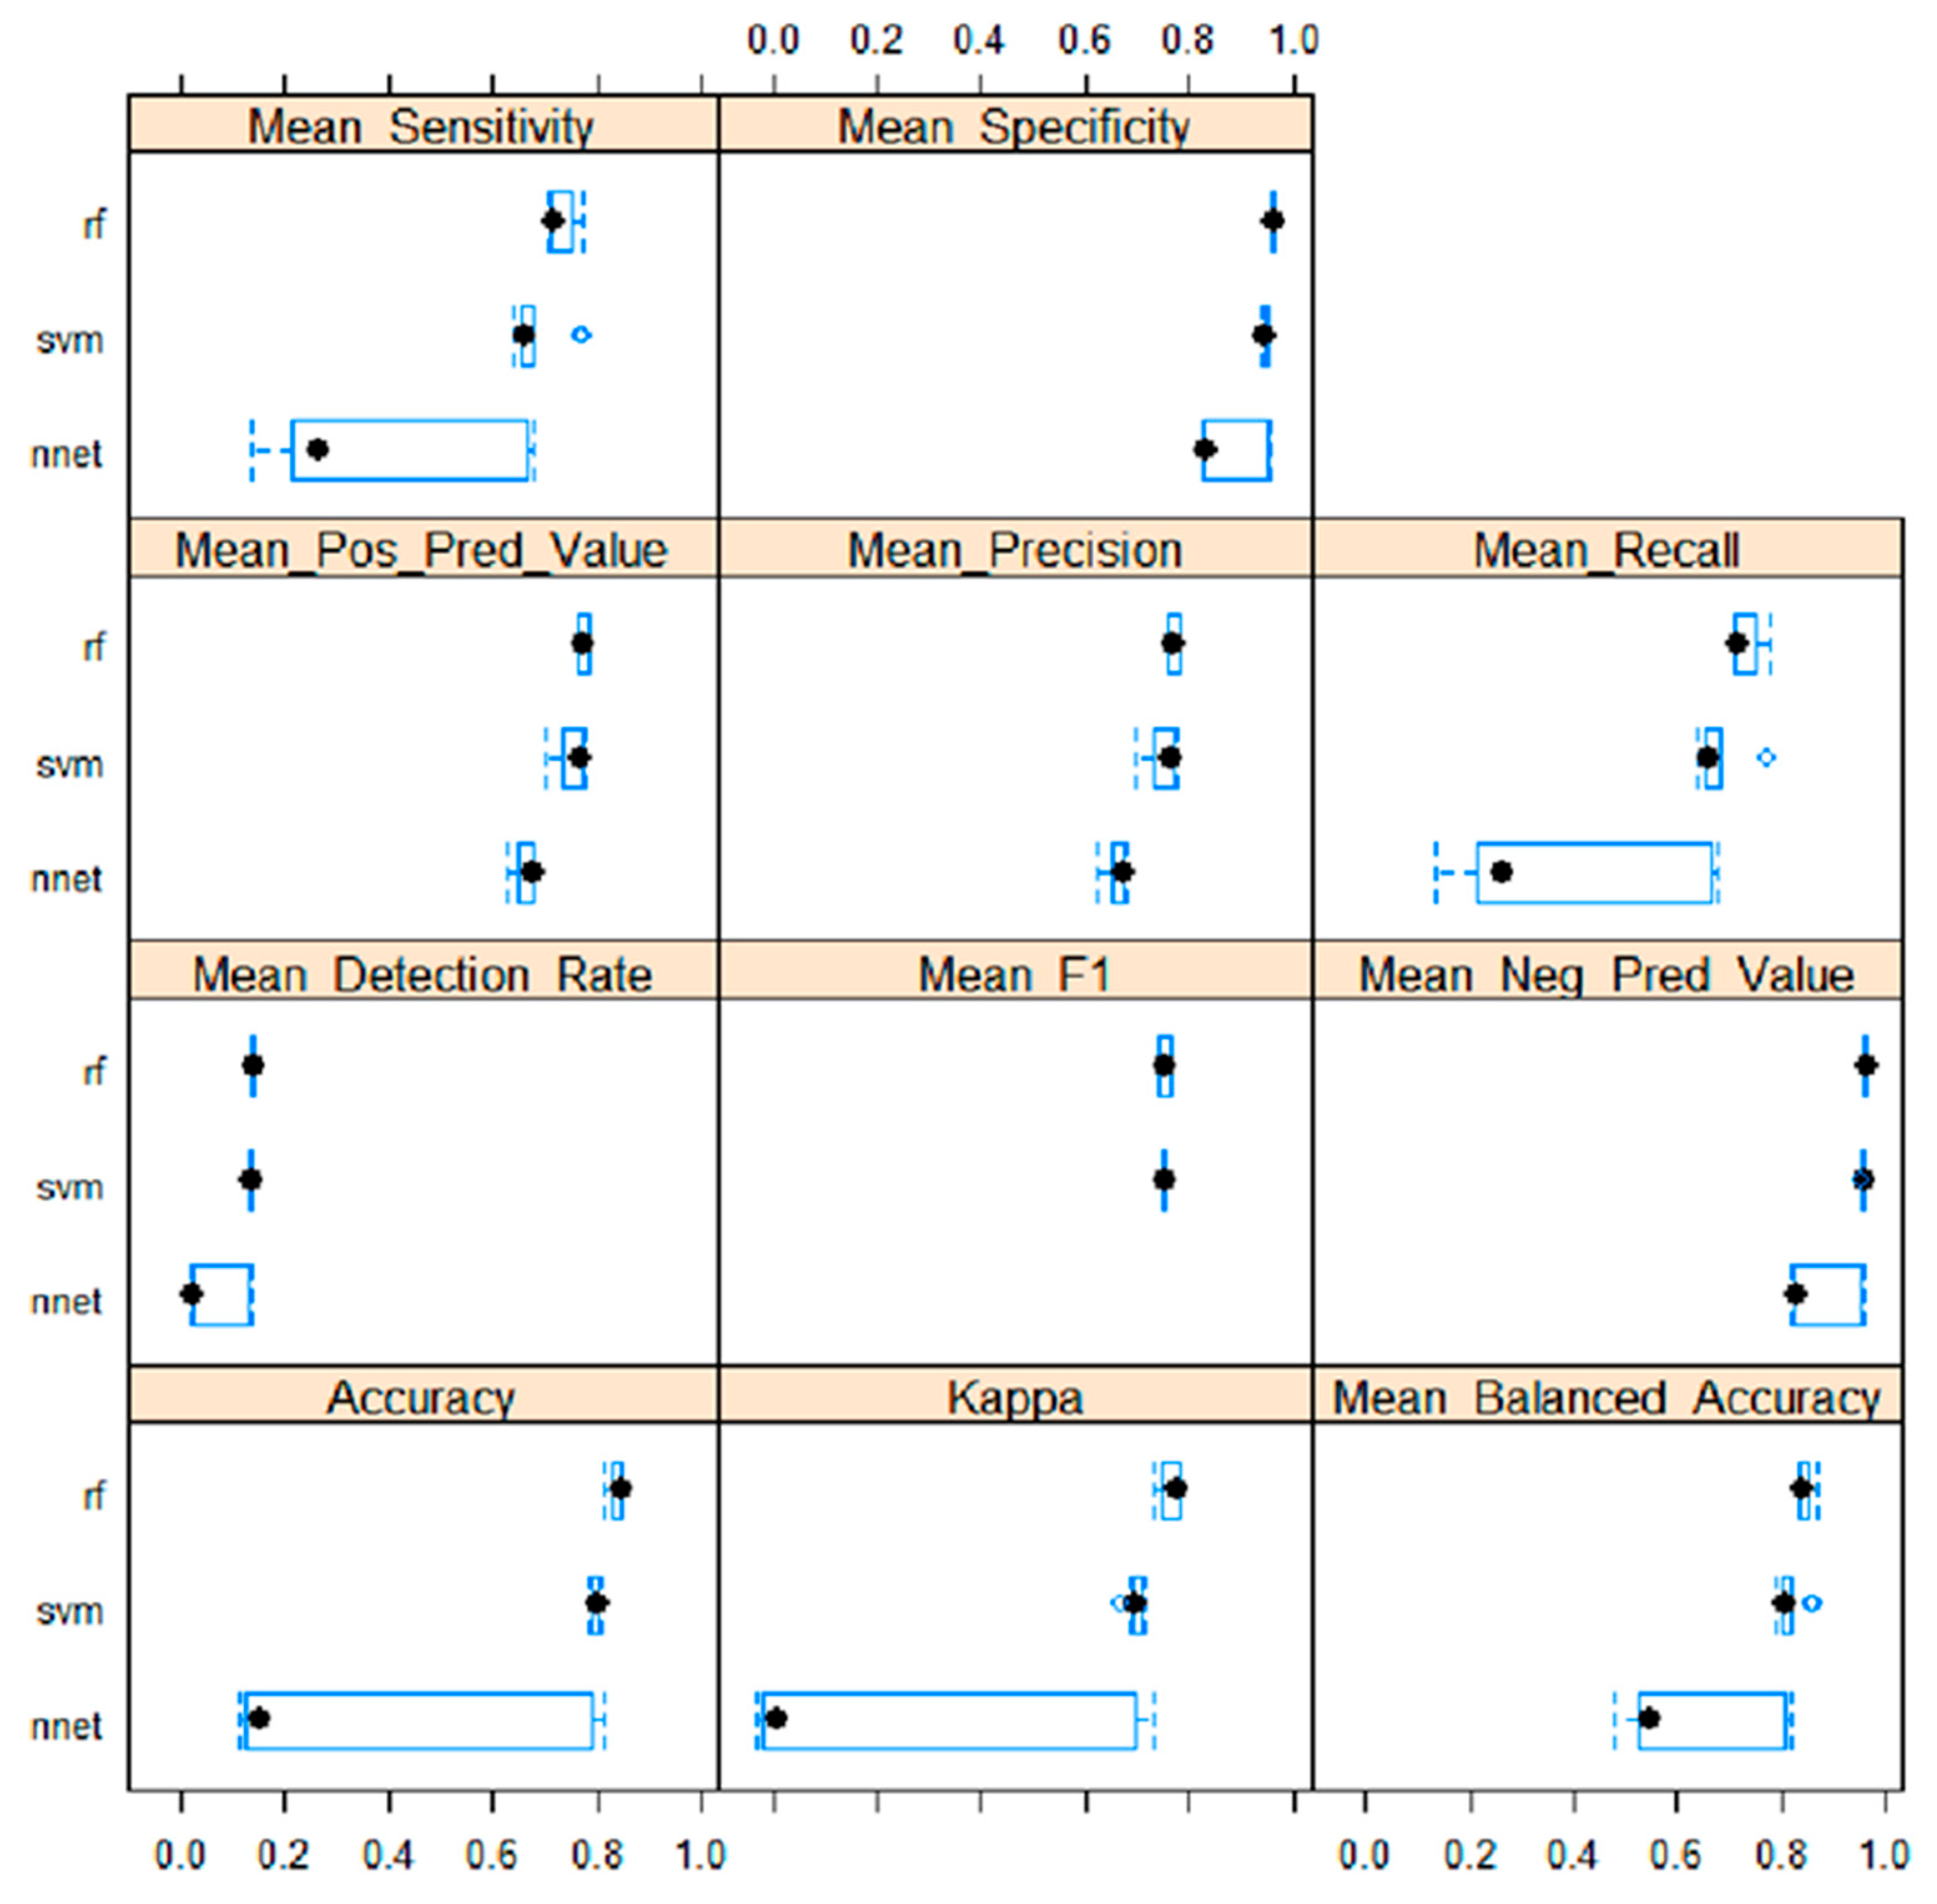
A comparative evaluation of RF, SVM, and NNET was conducted using multiple statistical indicators to identify the most effective model for LULC classification (Figure 3). Among these algorithms, RF achieved the highest overall accuracy, Kappa coefficient, and F1-score, indicating strong agreement with ground-truth data and a balanced performance across precision and recall. It also maintained high sensitivity and precision, confirming its ability to accurately distinguish land-cover classes while minimizing false detections. These results are consistent with previous studies emphasizing RF’s stability and reliability in LULC mapping applications. For instance, ref. [15] reported RF achieving approximately 97% accuracy (Kappa ~0.98) in Dilla Town, Ethiopia, outperforming both SVM (~97%) and NNET (85–96%). Similarly, ref. [21] confirmed the consistent strength of RF in various urban settings in Lusaka and Colombo, where it surpassed SVM and ANN despite spatial and temporal variability.
Similar results have also been reported in several studies in North Africa, confirming the performance of RF for land cover classification in semi-arid and coastal areas, particularly in Tlemcen, Algeria [26], on the Moroccan coast [64], and in central Tunisia [25].

3.5. Temporal Dynamics of Land Cover Classes

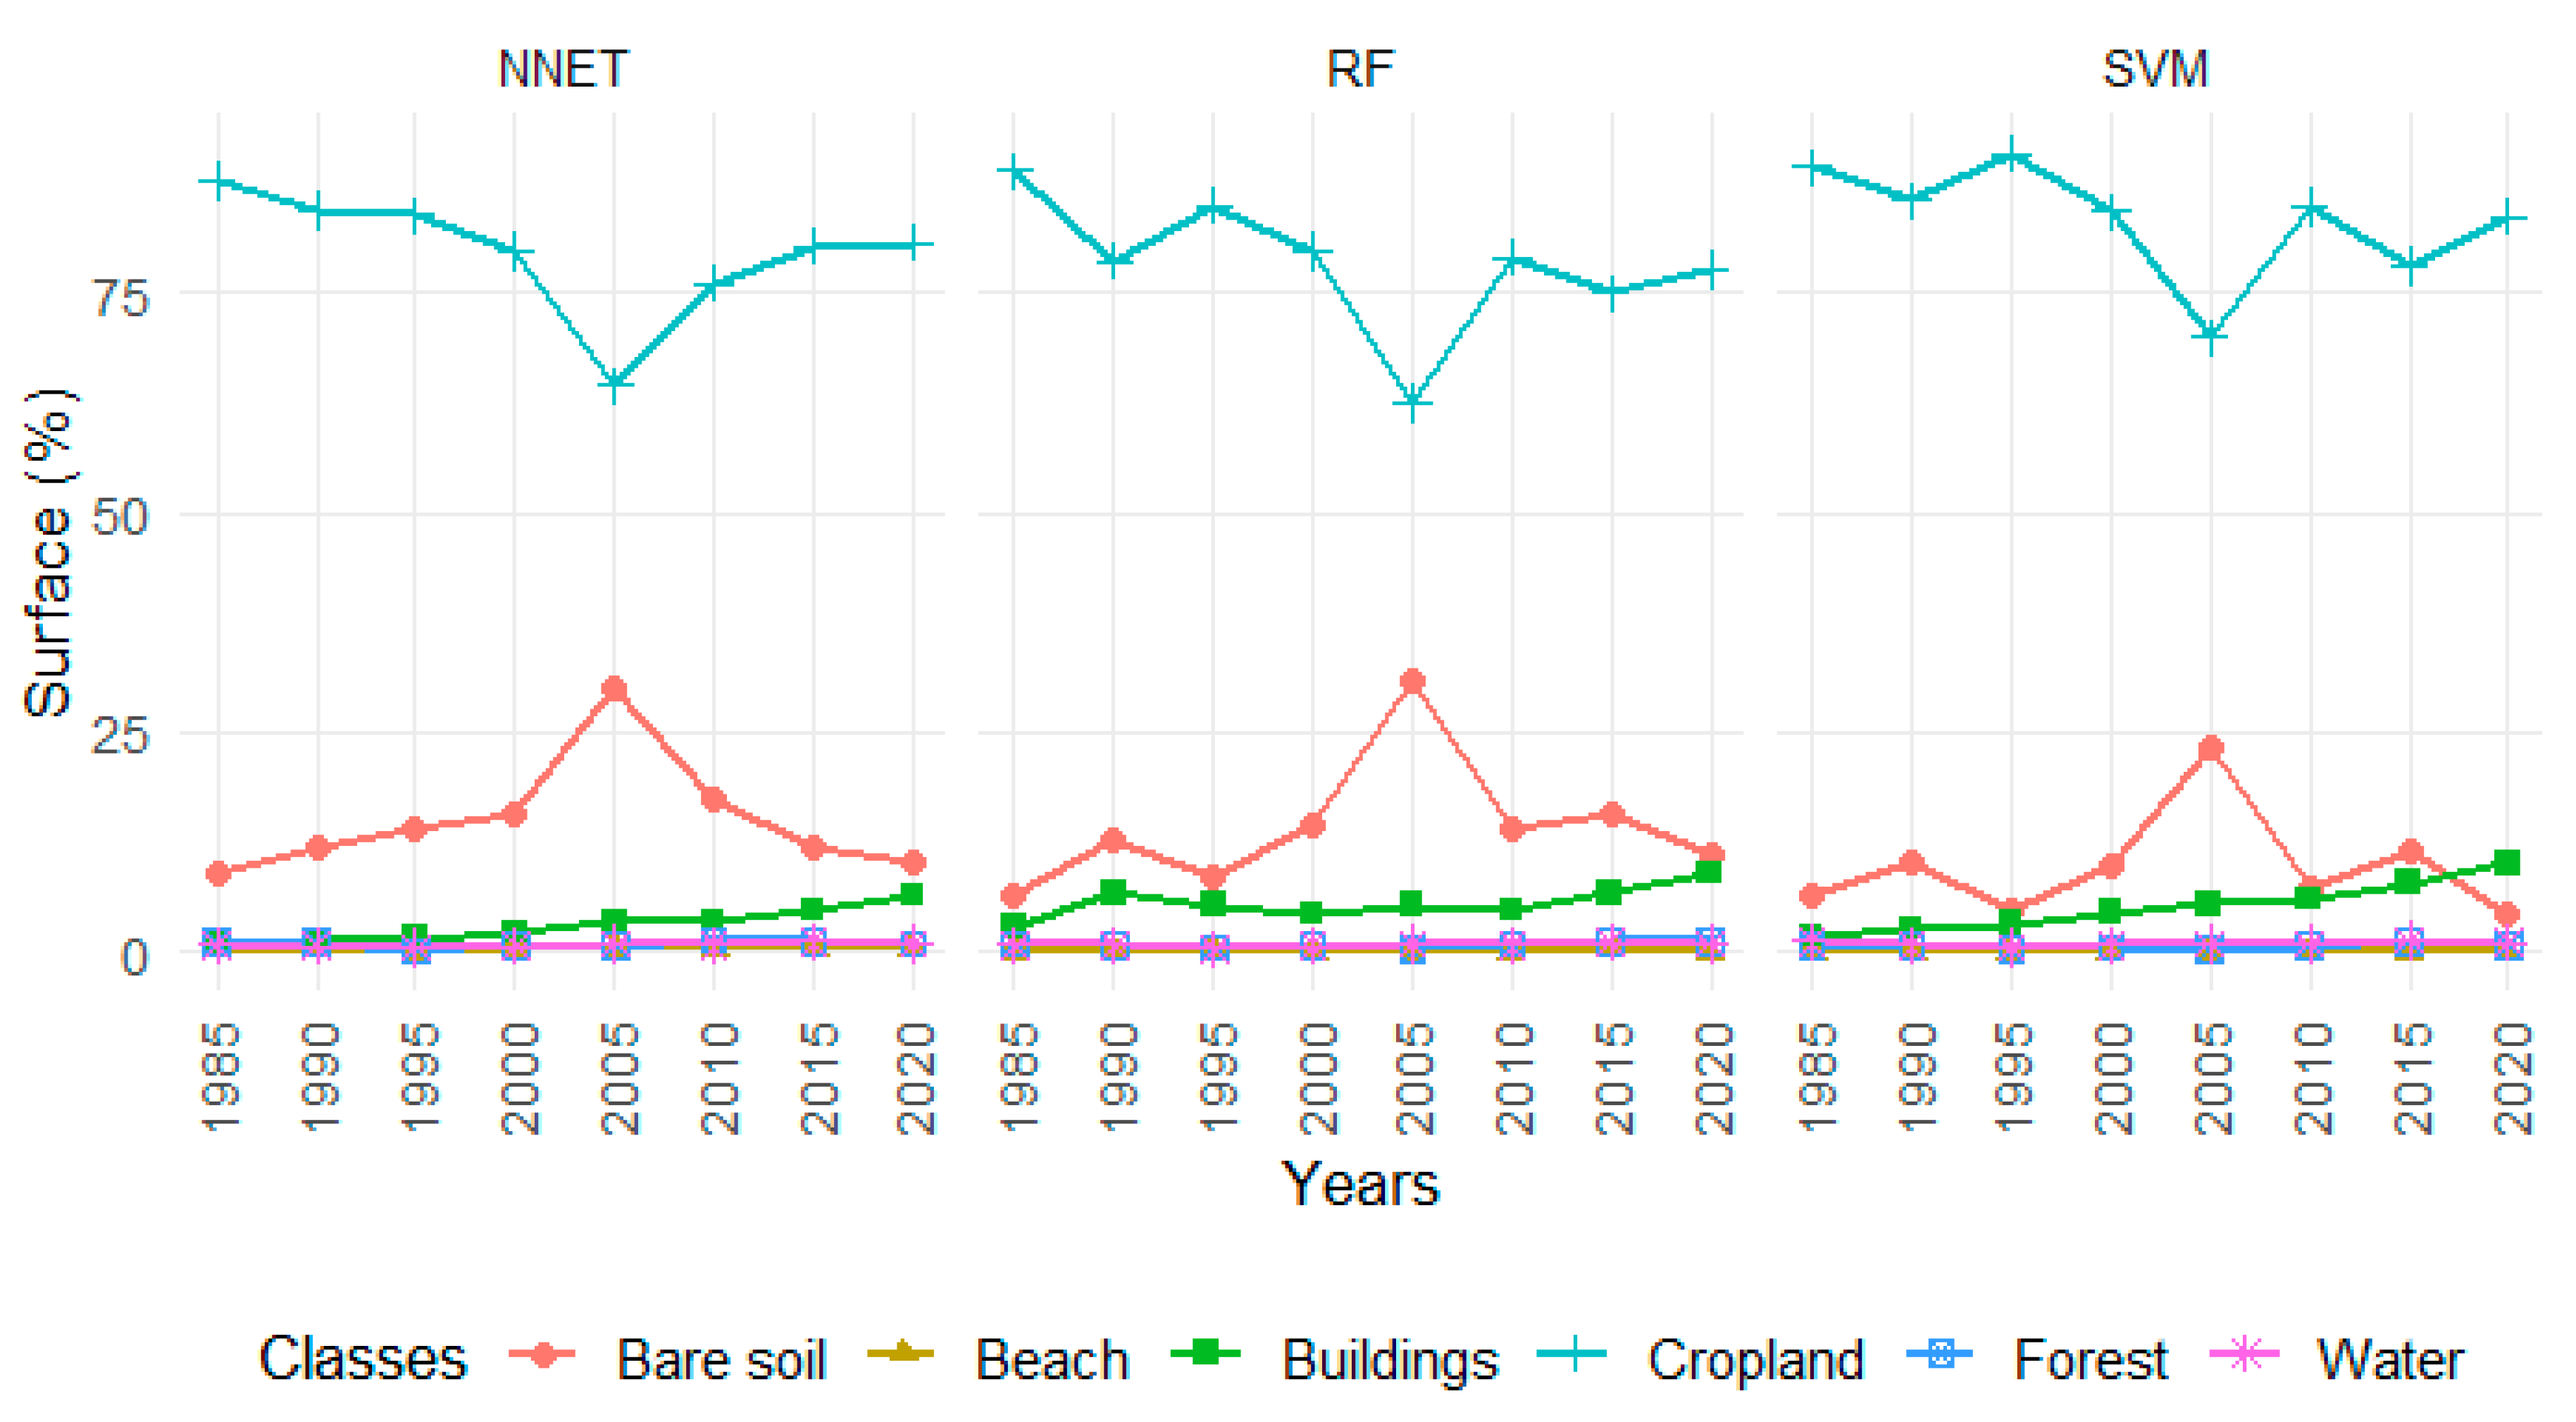
The temporal evolution of the principal land use classes in the El Jadida region was analyzed using NNET, RF, and SVM classifications between 1985 and 2020. The three models show similar trends, confirming the reliability of the observed dynamics (Figure 4).
Cropland constitutes the dominant class throughout the period, covering between approximately 55,000 and 65,000 hectares depending on the year and algorithm. A notable decline occurs around 2005–2010, followed by a partial recovery, potentially attributable to climatic variability or changes in agricultural practices. Forest areas remain globally stable with only a modest decrease over time. In contrast, bare soil shows more marked variations, with a notable peak between 2005 and 2010 in all models, probably linked to temporary soil perturbations, notably the drought of 2005. The Built-up areas show continuous growth, particularly in the results obtained by the RF and SVM algorithms, reflecting population growth and infrastructure development in the El Jadida region [65,66]. Water surfaces remain stable overall, with slight fluctuations linked to seasonal or interannual hydrological variations. The ‘beach’ class remains marginal and virtually unchanged throughout the study period.
The temporal trajectories generated by the three classifiers reveal a consistent evolution of land cover changes. Among these, the RF model ensures smoother transitions from one year to the next and demonstrates greater temporal consistency, minimizing classification noise. This reliability bolsters confidence in the long-term monitoring framework for land use and land cover established for the El Jadida region.

3.6. Spatio-Temporal Dynamics of LULC

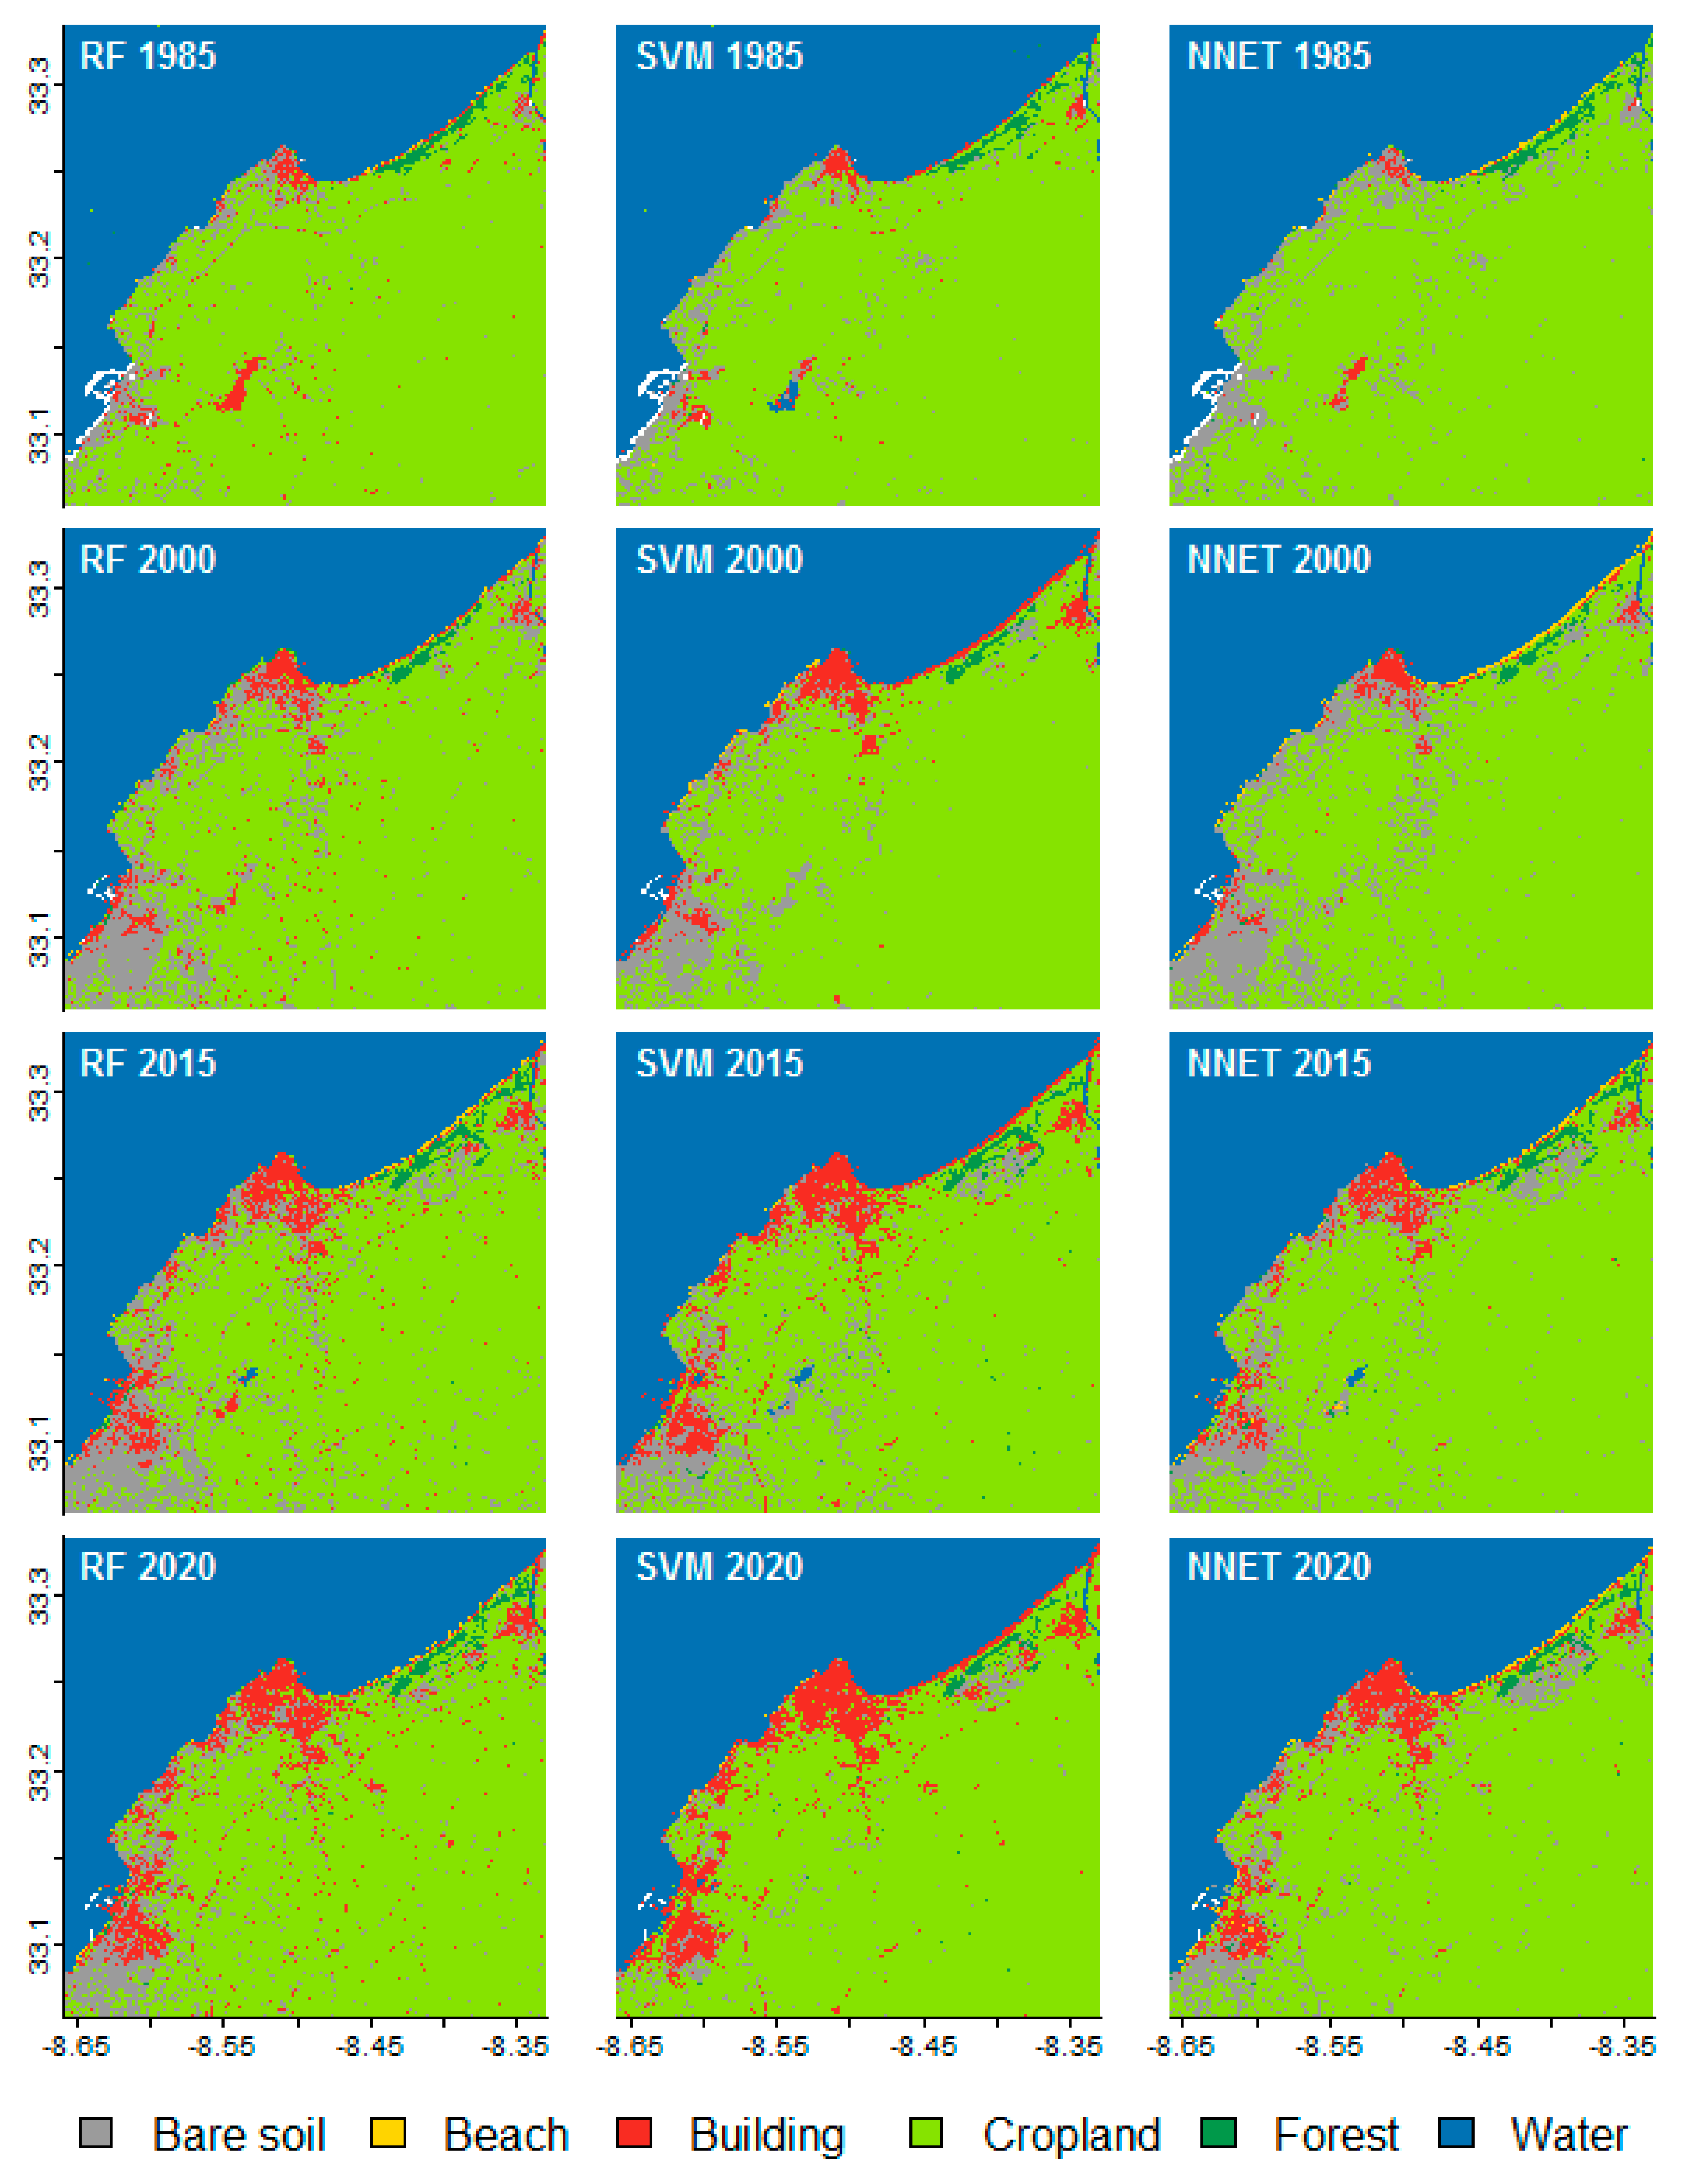
An analysis of the land cover classification results obtained by the RF, SVM, and NNET algorithms allows for a comparative assessment of their spatio-temporal performance. The temporal evolution of land cover classes (Figure 4) reveals similar general trends across the three models, whereas the spatial distribution maps (Figure 5) highlight clear differences in classification accuracy, spatial coherence, and boundary definition.
The temporal analysis highlights the predominance of agricultural land, although a significant decline was observed around 2005–2010, a period marked by repeated droughts and increased anthropogenic pressures. Bare soil shows marked variability with a peak during the same period, while built-up areas are experiencing continuous growth, reflecting rapid urbanization processes at the expense of agricultural land [67,68].
Comparative maps confirm these dynamics: RF provides the most consistent and coherent results, with clear limits between classes and an accurate representation of changes. SVM shows localized confusion, particularly between bare soil and urban areas, and the NNET, although effective for water and forest, generates more spatial noise and errors in distinguishing between crops, bare soil, and built-up areas. Overall, RF demonstrates strong temporal stability and spatial accuracy, confirming its suitability for multi-temporal LULC monitoring in semi-arid coastal regions.
These results confirm the conclusions reached by a series of studies highlighting the effectiveness and reliability of RF for land use classification based on satellite images. Kouassi et al. [69] demonstrated the performance of RF for mapping land cover changes using Sentinel-1 and Sentinel-2 images in Côte d’Ivoire, achieving high overall accuracy and outperforming conventional classification approaches. Similarly, Tuğaç et al. [70] showed that RF produced more reliable results than SVM for classifying agricultural crops from Sentinel-2 and Landsat-8 images, especially when spectral signatures were mixed. Recently, Sultan et al. [71] highlighted the superiority of RF in the Google Earth Engine environment, demonstrating that it consistently outperformed other machine learning algorithms across a variety of landscapes and time periods.
Beyond these classification results, the analysis of LULC dynamics reveals significant spatial and functional transformations across the El Jadida region. Urban expansion has intensified mainly at the expense of cropland, driven by growing demographic and economic pressures [35,66]. Over the past two decades, several regional policies have contributed to these transformations, including the development of tourism infrastructure, the industrial expansion of Jorf Lasfar, and the implementation of territorial strategies focused on sustainability, rational land management, and reducing anthropogenic pressures on ecosystems. Similar trajectories have been observed in other semi-arid regions, where unregulated urban growth accelerates soil degradation and reduces agricultural resilience. This model reflects the complex interactions between human activities and environmental constraints, highlighting the need for preventive and adaptive approaches to land management. Strengthening land use regulations, enforcing zoning policies to preserve fertile soils, and restoring degraded agricultural land are essential to mitigating land use conflicts and maintaining agricultural productivity. Moreover, integrating satellite monitoring systems into regional planning frameworks would enable continuous assessment of land use and support evidence-based decision making for sustainable territorial development.

3.7. Limitations of the Study

The main strength of this study lies in the use of a yearly composite image, generated from a satellite time series, to reduce the variability of land cover across multiple years. However, certain limitations must be acknowledged. On one hand, the static nature of the samples across time points introduces constraints, particularly in representing dynamic land cover classes. On the other hand, limitations also arise from the types of classifiers employed and the remote sensing data used. We relied exclusively on Landsat imagery due to its extensive historical archive dating back to the 1980s. Nevertheless, the incorporation of more recent optical and radar satellite datasets, such as Sentinel-2 and Sentinel-1, could potentially enhance classification performance owing to their higher spatial, temporal, and radiometric resolutions.
Although the classifiers applied in this study yielded reliable results, remote sensing technologies are rapidly evolving, with multi-source data fusion and deep learning approaches emerging as dominant trends. These advanced methods are capable of integrating heterogeneous datasets with varying temporal and spatial characteristics. For example, deep learning architectures can directly process time-series data while incorporating additional geospatial variables such as topography and geomorphology, potentially improving classification accuracy. Despite their promise, these methods demand substantial computational resources and a high level of technical expertise, which may not be readily available in all contexts. Consequently, we argue that when a simpler model can achieve comparable accuracy to a more complex one, the simpler approach remains the more practical and efficient choice.

4. Conclusions

In the El Jadida area, LULC units have been progressively influenced by both anthropogenic and environmental pressures, leading to notable landscape transformations and the gradual degradation of natural resources over recent decades. These changes, mainly driven by the expansion of artificial surfaces associated with urban growth, tourism, industrial development, and population increase, have resulted in the reduction in agricultural land, the fragmentation of natural habitats, and the disruption of the regional ecological balance. The methodological framework adopted in this study, combining Landsat satellite imagery with three machine learning algorithms (RF, SVM, and NNET), proved highly effective for generating accurate and consistent LULC maps. The use of five-year Landsat composites (1985–2020) with median aggregation significantly improved temporal consistency and minimized atmospheric disturbances, thereby enhancing classification reliability. The comparative analysis confirmed the clear superiority of the Random Forest algorithm, which achieved the highest overall accuracy (90.3%) and Kappa coefficient (0.859), demonstrating its robustness in processing heterogeneous and complex datasets. SVM and NNET also performed satisfactorily, though with higher sensitivity to spectral confusion between bare soil, cropland, and built-up areas. Urban expansion emerged as the most significant spatio-temporal change, largely occurring at the expense of agricultural land. Although forest and water areas remained relatively stable, they were indirectly affected by increasing human pressures. Overall, the findings highlight the effectiveness of machine learning approaches for analyzing and monitoring long-term spatiotemporal LULC dynamics. This research enhances understanding of territorial transformation processes and provides valuable insights to support sustainable land use planning and management in semi-arid regions.

Author Contributions

Conceptualization, Ikram El Mjiri and Abdelkrim Bouasria; Methodology, Ikram El Mjiri and Abdelkrim Bouasria; software, Ikram El Mjiri and Abdelkrim Bouasria; Validation, Ikram El Mjiri and Abdelkrim Bouasria; Formal analysis, Ikram El Mjiri and Abdelkrim Bouasria; data curation, Ikram El Mjiri and Abdelkrim Bouasria; Writing—original draft, Ikram El Mjiri, Abdelmejid Rahimi and Abdelkrim Bouasria; Writing—review & editing, Ikram El Mjiri, Abdelmejid Rahimi, Abdelkrim Bouasria, Mohammed Bounif and Wardia Boulanouar; Visualization, Ikram El Mjiri and Abdelkrim Bouasria; supervision, Abdelmejid Rahimi. All authors have read and agreed to the published version of the manuscript.

Funding

This study was conducted without any funding support.

Data Availability Statement

Data is available on Google Earth Engine catalog: https://developers.google.com/earth-engine/datasets/catalog/landsat (accessed on 5 November 2025).

Conflicts of Interest

The authors declare no conflict of interest.

References

  1. Satterthwaite, D.; McGranahan, G.; Tacoli, C. Urbanization and its implications for food and farming. Philos. Trans. R. Soc. B Biol. Sci. 2010, 365, 2809–2820. [Google Scholar] [CrossRef]
  2. Beuchle, R.; Grecchi, R.C.; Shimabukuro, Y.E.; Seliger, R.; Eva, H.D.; Sano, E.; Achard, F. Land cover changes in the Brazilian Cerrado and Caatinga biomes from 1990 to 2010 based on a systematic remote sensing sampling approach. Appl. Geogr. 2015, 58, 116–127. [Google Scholar] [CrossRef]
  3. Turner, B.L.; Lambin, E.F.; Reenberg, A. The emergence of land change science for global environmental change and sustainability. Proc. Natl. Acad. Sci. USA 2007, 104, 20666–20671. [Google Scholar] [CrossRef] [PubMed]
  4. Foley, J.A.; DeFries, R.; Asner, G.P.; Barford, C.; Bonan, G.; Carpenter, S.R.; Chapin, F.S.; Coe, M.T.; Daily, G.C.; Gibbs, H.K.; et al. Global consequences of land use. Science 2005, 309, 570–574. [Google Scholar] [CrossRef] [PubMed]
  5. Mundia, C.N.; Aniya, M. Dynamics of landuse/cover changes and degradation of Nairobi City, Kenya. Land Degrad. Dev. 2006, 17, 97–108. [Google Scholar] [CrossRef]
  6. Seto, K.C.; Fragkias, M.; Güneralp, B.; Reilly, M.K. A meta-analysis of global urban land expansion. PLoS ONE 2011, 6, e23777. [Google Scholar] [CrossRef]
  7. Bouasria, A.; Bouslihim, Y.; Mrabet, R.; Devkota, K. National baseline high-resolution mapping of soil organic carbon in Moroccan cropland areas. Geoderma Reg. 2025, 40, e00941. [Google Scholar] [CrossRef]
  8. Vitousek, P.M.; Mooney, H.A.; Lubchenco, J.; Melillo, J.M. Human domination of Earth’s ecosystems. Science 1997, 277, 494–499. [Google Scholar] [CrossRef]
  9. Geist, H.J.; Lambin, E.F. Proximate causes and underlying driving forces of tropical deforestation: Tropical forests are disappearing as the result of many pressures, both local and regional, acting in various combinations in different geographical locations. Bioscience 2002, 52, 143–150. [Google Scholar] [CrossRef]
  10. Zhu, Z.; Woodcock, C.E. Continuous change detection and classification of land cover using all available Landsat data. Remote Sens. Environ. 2014, 144, 152–171. [Google Scholar] [CrossRef]
  11. Wulder, M.A.; Loveland, T.R.; Roy, D.P.; Crawford, C.J.; Masek, J.G.; Woodcock, C.E.; Allen, R.G.; Anderson, M.C.; Belward, A.S.; Cohen, W.B.; et al. Current status of Landsat program, science, and applications. Remote Sens. Environ. 2019, 225, 127–147. [Google Scholar] [CrossRef]
  12. Richardson, G.; Knudby, A.; Crowley, M.A.; Sawada, M.; Chen, W. Machine learning approaches to landsat change detection analysis. Can. J. Remote Sens. 2025, 51, 2448169. [Google Scholar] [CrossRef]
  13. Yuh, Y.G.; Tracz, W.; Matthews, H.D.; Turner, S.E. Application of machine learning approaches for land cover monitoring in northern Cameroon. Ecol. Inform. 2023, 74, 101955. [Google Scholar] [CrossRef]
  14. Xie, G.; Niculescu, S. Mapping and monitoring of land cover/land use (LCLU) changes in the crozon peninsula (Brittany, France) from 2007 to 2018 by machine learning algorithms (support vector machine, random forest, and convolutional neural network) and by post-classification comparison (PCC). Remote Sens. 2021, 13, 3899. [Google Scholar]
  15. Kasahun, M.; Legesse, A. Machine learning for urban land use/cover mapping: Comparison of artificial neural network, random forest and support vector machine, a case study of Dilla town. Heliyon 2024, 10, e39146. [Google Scholar] [CrossRef] [PubMed]
  16. Jozdani, S.E.; Johnson, B.A.; Chen, D. Comparing deep neural networks, ensemble classifiers, and support vector machine algorithms for object-based urban land use/land cover classification. Remote Sens. 2019, 11, 1713. [Google Scholar] [CrossRef]
  17. Pelletier, C.; Webb, G.I.; Petitjean, F. Temporal convolutional neural network for the classification of satellite image time series. Remote Sens. 2019, 11, 523. [Google Scholar] [CrossRef]
  18. Bouasria, A.; Rahimi, A.; El Mjiri, I.; Namr, K.I.; Ettachfini, E.M.; Bounif, M. Comparative study between two methods of crop classification in the irrigated area of Sidi Bennour. In Proceedings of the 2021 IEEE Third International Sustainability and Resilience Conference: Climate Change, Virtual, 15–17 November 2021; pp. 500–503. [Google Scholar]
  19. Bouasria, A.; Rahimi, A.; El Mjiri, I.; Namr, K.I.; Ettachfini, E.M.; Bounif, M. Use of Remote Sensing Data to Estimate Sugar Beet Crop Yield in the Doukkala Irrigated Perimeter. In Proceedings of the 2021 IEEE Third International Sustainability and Resilience Conference: Climate Change, Virtual, 15–17 November 2021; pp. 504–507. [Google Scholar]
  20. Devkota, K.P.; Bouasria, A.; Devkota, M.; Nangia, V. Predicting wheat yield gap and its determinants combining remote sensing, machine learning, and survey approaches in rainfed Mediterranean regions of Morocco. Eur. J. Agron. 2024, 158, 127195. [Google Scholar] [CrossRef]
  21. Mutale, B.; Withanage, N.C.; Mishra, P.K.; Shen, J.; Abdelrahman, K.; Fnais, M.S. A performance evaluation of random forest, artificial neural network, and support vector machine learning algorithms to predict spatio-temporal land use-land cover dynamics: A case from Lusaka and Colombo. Front. Environ. Sci. 2024, 12, 1431645. [Google Scholar] [CrossRef]
  22. Zaman, A.; Khan, S.A.; Mohammad, N.; Ateya, A.A.; Ahmad, S.; ElAffendi, M.A. Distributed denial of service attack detection in software-defined networks using decision tree algorithms. Future Internet 2025, 17, 136. [Google Scholar] [CrossRef]
  23. Tesfaye, W.; Elias, E.; Warkineh, B.; Tekalign, M.; Abebe, G. Modeling of land use and land cover changes using google earth engine and machine learning approach: Implications for landscape management. Environ. Syst. Res. 2024, 13, 31. [Google Scholar] [CrossRef]
  24. Fu, H.; Li, J.; Lu, J.; Lin, X.; Kang, J.; Zou, W.; Ning, X.; Sun, Y. Prediction of Soybean Yield at the County Scale Based on Multi-Source Remote-Sensing Data and Deep Learning Models. Agriculture 2025, 15, 1337. [Google Scholar] [CrossRef]
  25. Kadri, N.; Jebari, S.; Augusseau, X.; Mahdhi, N.; Lestrelin, G.; Berndtsson, R. Analysis of four decades of land use and land cover change in semiarid Tunisia using Google Earth Engine. Remote Sens. 2023, 15, 3257. [Google Scholar] [CrossRef]
  26. Selka, I.; Mokhtari, A.M.; Aoul, K.A.T.; Bengusmia, D.; KACEMI, M.; Djebbar, K.E.-B. Assessing the impact of land use and land cover changes on surface temperature dynamics using google earth engine: A case study of tlemcen municipality, northwestern Algeria (1989–2019). ISPRS Int. J. Geoinf. 2024, 13, 237. [Google Scholar] [CrossRef]
  27. Hind, M.; M’hammed, S.; Djamal, A.; Zoubida, N. Assessment of land use–land cover changes using GIS, remote sensing, and CA–Markov model: A case study of Algiers, Algeria. Appl. Geomat. 2022, 14, 811–825. [Google Scholar] [CrossRef]
  28. Radwan, T.M.; Blackburn, G.A.; Whyatt, J.D.; Atkinson, P.M. Dramatic loss of agricultural land due to urban expansion threatens food security in the Nile Delta, Egypt. Remote Sens. 2019, 11, 332. [Google Scholar] [CrossRef]
  29. Youssef, Y.M.; Gemail, K.S.; Atia, H.M.; Mahdy, M. Insight into land cover dynamics and water challenges under anthropogenic and climatic changes in the eastern Nile Delta: Inference from remote sensing and GIS data. Sci. Total Environ. 2024, 913, 169690. [Google Scholar] [CrossRef]
  30. El Mjiri, I.; Rahimi, A.; Bouasria, A. Soil artificialization assessment by using time series remote sensing data (case El Jadida). In Proceedings of the 2021 IEEE Third International Sustainability and Resilience Conference: Climate Change, Virtual, 15–17 November 2021; pp. 452–455. [Google Scholar]
  31. Skittou, M.; Madhoum, O.; Khannous, A.; Merrouchi, M.; Gadi, T.; Khyati, S. Predictive Deep Neural Network Model of Doukkala Coastal Domain Land Use with Remote Sensing Data. In Technical and Technological Solutions Towards a Sustainable Society and Circular Economy; Springer: Berlin/Heidelberg, Germany, 2024; pp. 77–89. [Google Scholar]
  32. Bounif, M.; Bouasria, A.; Rahimi, A.; El Mjiri, I. Study of agricultural land use variability in Doukkala irrigated area between 1998 and 2020. In Proceedings of the 2021 IEEE Third International Sustainability and Resilience Conference: Climate Change, Virtual, 15–17 November 2021; pp. 170–175. [Google Scholar]
  33. Ouchra, H.; Belangour, A.; Erraissi, A. Unsupervised learning for land cover mapping of casablanca using multispectral imaging. In Proceedings of the 2024 IEEE ASU International Conference in Emerging Technologies for Sustainability and Intelligent Systems (ICETSIS), Manama, Bahrain, 28–29 January 2024; pp. 1841–1847. [Google Scholar]
  34. Erraissi, A.; Ouchra, H.; Banane, M. Integrating Remote Sensing and Machine Learning for Accurate Detection of Agricultural Zones in El Jadida, Morocco. In International Conference on Optimization, Learning Algorithms and Applications; Springer: Berlin/Heidelberg, Germany, 2024; pp. 35–49. [Google Scholar]
  35. El Mjiri, I.; Rahimi, A.; Bouasria, A. Urban Sprawl Evolution and Soil Artificialization Assessment by Using Satellite Data from 1985 to 2019: Case of El Jadida Metropolitan in Morocco. In Proceedings of the 2020 Second International Sustainability and Resilience Conference: Technology and Innovation in Building Designs, Sakheer, Bahrain, 11–12 November 2020. [Google Scholar] [CrossRef]
  36. Bouasria, A.; Fekkak, A.; Haissen, F.; Jouhari, A.; Berrada, I. Using long-term bare earth composite image and machine learning in lithological mapping of Adrar Souttouf mafic complex (Oulad Dlim massif, Southern Morocco). Remote Sens. Appl. 2025, 38, 101516. [Google Scholar]
  37. Bouasria, A.; Namr, K.I.; Rahimi, A.; Ettachfini, E.M.; Rerhou, B. Evaluation of Landsat 8 image pansharpening in estimating soil organic matter using multiple linear regression and artificial neural networks. Geo-Spat. Inf. Sci. 2022, 25, 353–364. [Google Scholar] [CrossRef]
  38. Vogelmann, J.E.; Gallant, A.L.; Shi, H.; Zhu, Z. Perspectives on monitoring gradual change across the continuity of Landsat sensors using time-series data. Remote Sens. Environ. 2016, 185, 258–270. [Google Scholar] [CrossRef]
  39. Zhu, Z.; Zhang, J.; Yang, Z.; Aljaddani, A.H.; Cohen, W.B.; Qiu, S.; Zhou, C. Continuous monitoring of land disturbance based on Landsat time series. Remote Sens. Environ. 2020, 238, 111116. [Google Scholar] [CrossRef]
  40. Boutafoust, R.; Rahimi, A.; Bouasria, A.; Bouslihim, Y.; Bounif, M. Evaluating the performance of multispectral indices and machine learning for extracting small-scale, non-permanent inland water bodies (Dayas) in Western Morocco. Sustain. Water Resour. Manag. 2025, 11, 90. [Google Scholar] [CrossRef]
  41. Roy, A.; Inamdar, A.B. Multi-temporal Land Use Land Cover (LULC) change analysis of a dry semi-arid river basin in western India following a robust multi-sensor satellite image calibration strategy. Heliyon 2019, 5, e01478. [Google Scholar] [CrossRef] [PubMed]
  42. Pelletier, C.; Valero, S.; Inglada, J.; Champion, N.; Sicre, C.M.; Dedieu, G. Effect of training class label noise on classification performances for land cover mapping with satellite image time series. Remote Sens. 2017, 9, 173. [Google Scholar] [CrossRef]
  43. Bouslihim, Y.; John, K.; Miftah, A.; Azmi, R.; Aboutayeb, R.; Bouasria, A.; Razouk, R.; Hssaini, L. The effect of covariates on Soil Organic Matter and pH variability: A digital soil mapping approach using random forest model. Ann. GIS 2024, 30, 215–232. [Google Scholar] [CrossRef]
  44. Rana, V.K.; Suryanarayana, T.M.V. Performance evaluation of MLE, RF and SVM classification algorithms for watershed scale land use/land cover mapping using sentinel 2 bands. Remote Sens. Appl. 2020, 19, 100351. [Google Scholar] [CrossRef]
  45. Fischer, M.M. Neural networks: A class of flexible non-linear models for regression and classification. In Handbook of Research Methods and Applications in Economic Geography; Edward Elgar Publishing: Cheltenham, UK, 2015; pp. 172–192. [Google Scholar]
  46. Breiman, L. Random forests. Mach. Learn. 2001, 45, 5–32. [Google Scholar] [CrossRef]
  47. Yu, H.; Kim, S. SVM tutorial—Classification, regression and ranking. In Handbook of Natural Computing; Springer: Berlin/Heidelberg, Germany, 2012; pp. 479–506. [Google Scholar]
  48. Mas, J.F.; Flores, J.J. The application of artificial neural networks to the analysis of remotely sensed data. Int. J. Remote Sens. 2008, 29, 617–663. [Google Scholar] [CrossRef]
  49. Yuan, H.; Van Der Wiele, C.F.; Khorram, S. An automated artificial neural network system for land use/land cover classification from Landsat TM imagery. Remote Sens. 2009, 1, 243–265. [Google Scholar] [CrossRef]
  50. Probst, P.; Boulesteix, A.-L.; Bischl, B. Tunability: Importance of hyperparameters of machine learning algorithms. J. Mach. Learn. Res. 2019, 20, 1–32. [Google Scholar]
  51. Salas, E.A.L.; Kumaran, S.S. Hyperspectral Bare Soil Index (HBSI): Mapping soil using an ensemble of spectral indices in machine learning environment. Land 2023, 12, 1375. [Google Scholar] [CrossRef]
  52. Ghorbanian, A.; Kakooei, M.; Amani, M.; Mahdavi, S.; Mohammadzadeh, A.; Hasanlou, M. Improved land cover map of Iran using Sentinel imagery within Google Earth Engine and a novel automatic workflow for land cover classification using migrated training samples. ISPRS J. Photogramm. Remote Sens. 2020, 167, 276–288. [Google Scholar] [CrossRef]
  53. Belgiu, M.; Drăguţ, L. Random forest in remote sensing: A review of applications and future directions. ISPRS J. Photogramm. Remote Sens. 2016, 114, 24–31. [Google Scholar] [CrossRef]
  54. Maxwell, A.E.; Warner, T.A.; Fang, F. Implementation of machine-learning classification in remote sensing: An applied review. Int. J. Remote Sens. 2018, 39, 2784–2817. [Google Scholar] [CrossRef]
  55. Mountrakis, G.; Im, J.; Ogole, C. Support vector machines in remote sensing: A review. ISPRS J. Photogramm. Remote Sens. 2011, 66, 247–259. [Google Scholar] [CrossRef]
  56. Khatami, R.; Mountrakis, G.; Stehman, S.V. A meta-analysis of remote sensing research on supervised pixel-based land-cover image classification processes: General guidelines for practitioners and future research. Remote Sens. Environ. 2016, 177, 89–100. [Google Scholar] [CrossRef]
  57. Abdi, A.M. Land cover and land use classification performance of machine learning algorithms in a boreal landscape using Sentinel-2 data. GIsci Remote Sens. 2020, 57, 1–20. [Google Scholar] [CrossRef]
  58. Aslan, N.; Koc-San, D. The use of land cover indices for rapid surface urban heat island detection from multi-temporal Landsat imageries. ISPRS Int. J. Geoinf. 2021, 10, 416. [Google Scholar] [CrossRef]
  59. Garzón, J.; Molina, I.; Velasco, J.; Calabia, A. A remote sensing approach for surface urban heat island modeling in a tropical colombian city using regression analysis and machine learning algorithms. Remote Sens. 2021, 13, 4256. [Google Scholar] [CrossRef]
  60. Hoang, N.-D.; Tran, V.-D.; Huynh, T.-C. From Data to Insights: Modeling Urban Land Surface Temperature Using Geospatial Analysis and Interpretable Machine Learning. Sensors 2025, 25, 1169. [Google Scholar] [CrossRef]
  61. Amini, S.; Saber, M.; Rabiei-Dastjerdi, H.; Homayouni, S. Urban land use and land cover change analysis using random forest classification of landsat time series. Remote Sens. 2022, 14, 2654. [Google Scholar] [CrossRef]
  62. Melnyk, O.; Brunn, A. Analysis of Spectral Index Interrelationships for Vegetation Condition Assessment on the Example of Wetlands in Volyn Polissya, Ukraine. Earth 2025, 6, 28. [Google Scholar] [CrossRef]
  63. Chafik, H.; Berrada, M.; Legdou, A.; Amine, A.; Lahssini, S. Exploitation of spectral indices NDVI, NDWI & SAVI in random forest classifier model for mapping weak rosemary cover: Application on Gourrama region, Morocco. In Proceedings of the 2020 IEEE International Conference of Moroccan Geomatics (Morgeo), Casablanca, Morocco, 11–13 May 2020; pp. 1–6. [Google Scholar]
  64. Benmokhtar, S.; Robin, M.; Maanan, M.; Bazairi, H. Mapping and quantification of the dwarf eelgrass zostera noltei using a random forest algorithm on a spot 7 satellite image. ISPRS Int. J. Geoinf. 2021, 10, 313. [Google Scholar] [CrossRef]
  65. El Mjiri, I.; Rahimi, A.; Bouasria, A. Remote sensing and GIS at the heart of the smart management of El Jadida City (Morocco). In Proceedings of the 4th Smart Cities Symposium (SCS 2021), Virtual, 21–23 November 2021. [Google Scholar]
  66. El Mjiri, I.; Rahimi, A.; Bouasria, A. Quantification and prediction of urban sprawl and surface temperature and assessment of their impacts on the environment: Case El Jadida (Morocco). Int. J. Glob. Warm. 2022, 26, 374–390. [Google Scholar] [CrossRef]
  67. Lin, Z.; Chen, Z.; Zhang, F.; Li, J.; Liufu, Y.; Cao, L.; Lin, J. Spatiotemporal Variations of Cropland Quality and Morphology Under the Requisition–Compensation Balance Policy. Land 2025, 14, 1235. [Google Scholar] [CrossRef]
  68. Xiong, S.; Yang, F. Dual-Dimensional Management for Human–Environment Coordination in Lake-Ring Urban Agglomerations: A Spatiotemporal Interaction Perspective of Human Footprint and Ecological Quality. Appl. Sci. 2025, 15, 7444. [Google Scholar] [CrossRef]
  69. Kouassi, J.-L.; Gyau, A.; Diby, L.; Bene, Y.; Kouamé, C. Assessing land use and land cover change and farmers’ perceptions of deforestation and land degradation in South-West Côte d’Ivoire, West Africa. Land 2021, 10, 429. [Google Scholar] [CrossRef]
  70. Tuğaç, M.G.; Şimşek, F.F.; Torunlar, H. Classification of Agricultural Crops with Random Forest and Support Vector Machine Algorithms Using Sentinel-2 and Landsat-8 Images. Int. J. Environ. Geoinform. 2024, 11, 106–118. [Google Scholar] [CrossRef]
  71. Sultan, M.; Saleous, N.; Issa, S.; Dahy, B.; Sami, M. Optimizing Land Use Classification Using Google Earth Engine: A Comparative Analysis of Machine Learning Algorithms. ISPRS Ann. Photogramm. Remote Sens. Spat. Inf. Sci. 2025, 10, 863–869. [Google Scholar] [CrossRef]
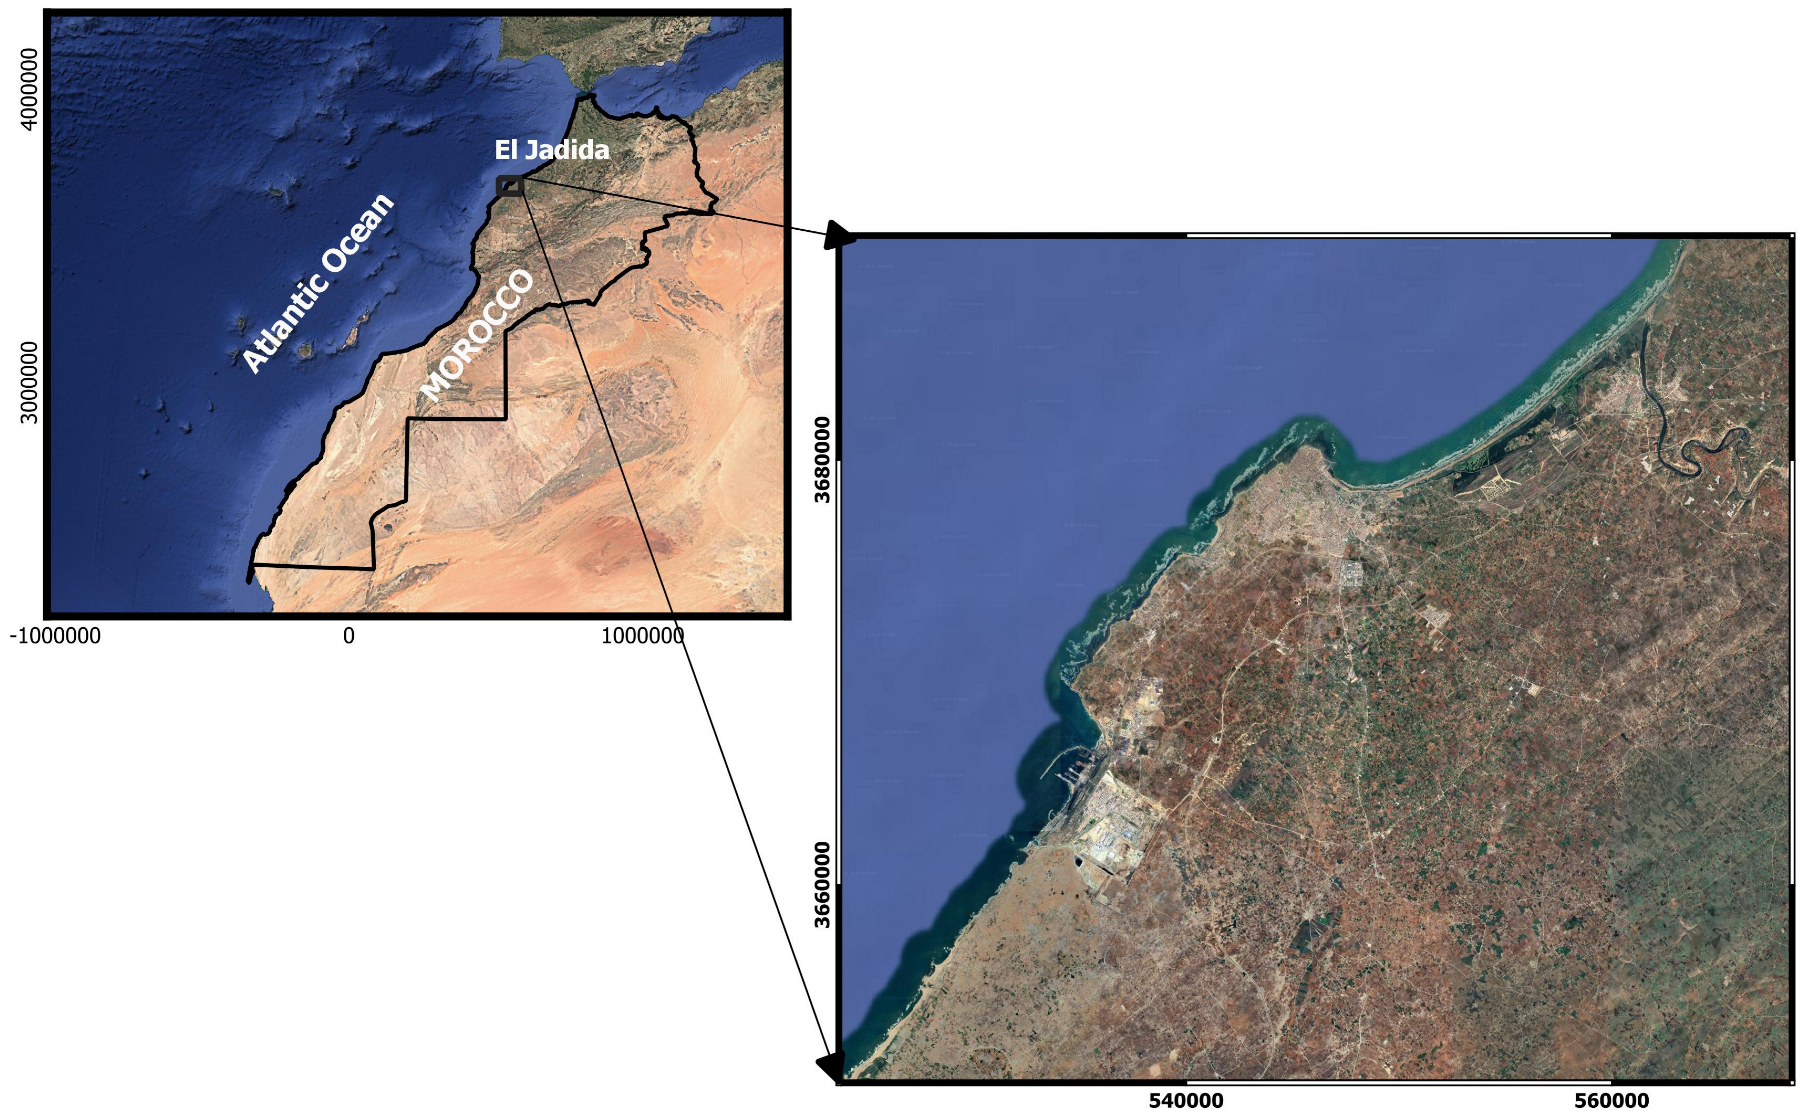
Figure 1. Location of the study area, the El Jadida region, within the Doukkala plain of central-western Morocco.
Ijgi 14 00445 g001
Figure 2. Predictor importance for the random forest model: (a) variable contribution to overall model accuracy, (b) correlation of each variable with specific land cover classes.
Ijgi 14 00445 g002
Figure 3. Comparative Evaluation of Classification Algorithms (RF, SVM, NNET).
Ijgi 14 00445 g003
Figure 4. Temporal dynamics of land cover classes in the El Jadida region (1985–2020) using RF, SVM, and NNET.
Ijgi 14 00445 g004
Figure 5. Land use maps of the El Jadida region obtained using RF, SVM, and NNET classifications for the years 1985, 2000, 2015, and 2020.
Ijgi 14 00445 g005
Table 1. Classification performance metrics for RF, SVM, and NNET classifiers.
RFSVMNNET
Overall Accuracy0.9030.8020.813
CI (LB, UB)(0.88, 0.919)(0.779, 0.824)(0.791, 0.834)
Kappa0.8590.7030.722
Table 2. Confusion matrix of the Random Forest classification.
Bare SoilBeachBuildingsCroplandForestWaterPA (%)
Bare soil190015170085.6
Beach000000-
Buildings181171110184.7
Cropland230305754091
Forest000251096.2
Water00000157100
UA (%)82.3079.29592.799.4-
F1-score (%)83.9-81.89394.499.7-
Table 3. Confusion Matrix of the SVM Classification.
Bare SoilBeachBuildingsCroplandForestWaterPA (%)
Bare soil7205171075.8
Beach000000-
Buildings551171220068.7
Cropland1040405665079.2
Forest0000490100
Water00000158100
UA (%)31.2079.293.689.1100-
F1-score (%)44.2-73.585.894.2100-
Table 4. Confusion Matrix of the NNET Classification.
Bare SoilBeachBuildingsCroplandForestWaterPA (%)
Bare soil111037222075.8
Beach000000-
Buildings250149190068.7
Cropland951305623079.2
Forest0002500100
Water00000158100
UA (%)31.2079.293.689.1100-
F1-score (%)44.2-73.585.894.2100-
Disclaimer/Publisher’s Note: The statements, opinions and data contained in all publications are solely those of the individual author(s) and contributor(s) and not of MDPI and/or the editor(s). MDPI and/or the editor(s) disclaim responsibility for any injury to people or property resulting from any ideas, methods, instructions or products referred to in the content.