You are currently viewing a new version of our website. To view the old version click .
ISPRS International Journal of Geo-Information
  • Article
  • Open Access

24 November 2025

Environmental Sensitivity Index Assessment Based on Factors in Oil Spill Impact in Coastal Zone Using Spatial Data and Analytical Hierarchy Process Approach: A Case Study in Myanmar

,
,
and
1
Faculty of Technology and Environment, Phuket Campus, Prince of Songkla University, Phuket 83120, Thailand
2
Geoinformatics Service and Training Center, Faculty of Technology and Environment, Phuket Campus, Prince of Songkla University, Phuket 83120, Thailand
3
Myanmar Biodiversity Fund, Haling Township, Yangon 11051, Myanmar
*
Author to whom correspondence should be addressed.
This article belongs to the Topic Advances in Earth Observation Technologies to Support Water-Related Sustainable Development Goals (SDGs)

Abstract

Oil spills threaten marine ecosystems and hinder progress toward Sustainable Development Goal (SDG) 14 on ocean conservation and sustainable marine resource use. Coastal ecosystems in Myanmar face growing risks from expanding maritime infrastructure, including ports, special economic zones, and offshore projects. This study aims to develop a spatial Environmental Sensitivity Index (ESI) map for the Tanintharyi region by integrating biological, socio-economic, and physical factors. Using the Analytical Hierarchy Process (AHP), weighting values were derived from local conservation and livelihood experts to ensure regional relevance. The inclusion of chlorophyll-a as a biological indicator improves the assessment of marine productivity and ecosystem health, linking ESI mapping to ocean acidification. The results showed that 8% of the area was very highly sensitive, 25% was highly sensitive, and 23% was moderately sensitive. The most sensitive zones were concentrated along the southern coastline, particularly in Thayetchaung Township, due to dense mangroves, critical habitats, and resource-dependent fisheries. This study presents the first spatial ESI assessment for Tanintharyi, providing a practical framework for oil spill preparedness and ecosystem protection, with potential for future enhancement through integration with oil spill simulation modeling.
Keywords:
oil spill response; ESI; AHP; GIS

1. Introduction

Oil spills are critical environmental challenges affecting coastal and marine ecosystems around the globe [,,,]. They precipitate long-term ecological degradation, interrupt local livelihoods, and damage critical habitats [,]. They compromise worldwide actions toward Sustainable Development Goal (SDG) 14 targets []. Marine pollutants, such as oil and heavy metals, indirectly increase the amount of atmospheric carbon dioxide (CO2), which accelerates ocean acidification []. Acidification affects many species and entire ecosystems, reducing their provision of ecosystem services, such as human food resources [,]. Coastal areas are particularly susceptible due to their high biological productivity and their significance as locations of human interaction. These environments often support complex food webs, endangered species, and socio-economically important sectors such as fisheries and tourism. As shipping activities, offshore exploration, and industrial development along coastlines increase, the frequency and scope of oil spill occurrences have also grown [,,,]. The environmental and socio-economic consequences of these events highlight the urgent need for comprehensive oil spill risk assessments. To meet this demand, the Environmental Sensitivity Index (ESI) was developed as a systematic approach to identify and prioritize coastal regions based on their vulnerability to oil contamination [,,].
Biodiversity-rich Myanmar hosts diverse coastal ecosystems, with the Tanintharyi coast in the south featuring the country’s largest mangrove extent, high mangrove species diversity, seagrass beds, coral reefs, and sandy beaches that serve as fishery nurseries and sea turtle nesting sites [,,]. These ecosystems support small-scale fisheries and sustain local livelihoods, providing essential food security and income for coastal communities []. Recently, industrial development, particularly the Dawei deep-sea port within a special economic zone, has expanded in the region, creating economic opportunities [,] but also posing significant threats to coastal resources, biodiversity, and community livelihoods []. In the absence of a spatially explicit oil spill sensitivity assessment [], and given that shipping transportation is a key mode of trade in the country [], oil spill response efforts may be delayed or misdirected. This highlights the urgent need for proactive ESI assessment to support effective mitigation and sustainable coastal management [,].
The Environmental Sensitivity Index (ESI), developed since 1976 [,,], integrates the following three key components: shoreline classification, biological resources, and human-use features [,,,,,,,,]. Traditionally, ESI maps categorized features without further analysis [], limiting their usefulness for large-scale management and protection planning. To overcome this, the National Oceanic and Atmospheric Administration (NOAA) incorporated Geographic Information Systems (GISs) and remote sensing into the ESI framework [], enabling spatially explicit assessments of coastal sensitivity. Over the following decades, ESI mapping has been widely applied in Europe [], the United States [], and Asia [,,] to support oil spill contingency planning and marine resource protection aligned with SDG 14 [,]. However, representing ESI as spatial data remains challenging due to the complexity of converting multiple parameters and integrating diverse datasets. The accuracy of ESI analyses also depends on locally relevant spatial inputs and expert judgment []. Hence, efficient methods are needed to integrate spatial and local expert-based information for context-specific ESI assessment.
Recent advancements in ESI mapping have increasingly combined GIS and multi-criteria decision-making techniques to improve oil spill sensitivity assessments. The Analytical Hierarchy Process (AHP) approach has been previously applied in both terrestrial [] and marine environments []. The study [] weighted ten physical, biological, and socio-economic indicators under multiple scenarios, while [,] integrated GIS overlays, kernel density, and AHP-derived vulnerability rankings. The study [] suggested further emphasizing the incorporation of dynamic environmental parameters, such as chlorophyll-a concentration and current velocity, to capture temporal variability. These studies collectively demonstrate that integrating expert-driven AHP weighting with GIS-based spatial analysis enhances the accuracy, adaptability, and temporal relevance of ESI mapping. Building on these advancements, the present study applies AHP with expert input to weight locally relevant parameters, including chlorophyll-a among other biological indicators, to develop a spatially explicit and locally informed ESI framework for proactive oil spill sensitivity assessment.
This research aims to systematically characterize the spatial distribution of biological resources, and human-use features along the shoreline, resulting in the derivation of the final ESI. This study converted all input data into spatial datasets, facilitating overlay analysis and ESI computation using the AHP approach. All factors were standardized as grid or raster data at a uniform spatial scale, enabling the spatially explicit representation of risk levels. In the biological resources category, in addition to habitat type, species richness, chlorophyll-a, and protected areas were included in the calculation. Chlorophyll-a serves as an indicator of phytoplankton biomass, reflecting primary productivity and overall marine ecosystem health [,,]. Monitoring chlorophyll-a is particularly relevant for oil spill assessments, as oil contamination can reduce light penetration, disrupt photosynthesis, and alter phytoplankton dynamics, thereby impacting the entire marine food web [,]. Furthermore, the level of chlorophyll content is indirectly associated with rising ocean acidification, as it causes a loss of marine productivity []. For the human-use features category, beaches (existing and potential tourism sites), fishing grounds, and population density were incorporated into the analysis. These factors are directly relevant to oil spill vulnerability, as contamination can affect recreational activities, disrupt fisheries and livelihoods, and pose health risks to densely populated coastal communities [,,,,,].
Despite global advances in ESI mapping, systematic ESI assessments have not been conducted for Myanmar’s coastal regions. Myanmar’s coasts, particularly the biologically rich Tanintharyi region, are highly vulnerable to oil spills and face increasing development pressures, highlighting a significant research gap in spatial sensitivity mapping for effective risk planning and response. This study addresses that gap by developing a spatially explicit, locally informed ESI model that integrates multiple parameters, including chlorophyll-a and expert-weighted factors using the AHP. The approach provides a holistic understanding of oil spill sensitivity and offers a foundation for local emergency planning, informing decision-making for oil spill prevention, resource protection, and sustainable coastal and marine ecosystem management.

2. Materials and Methods

2.1. Study Area

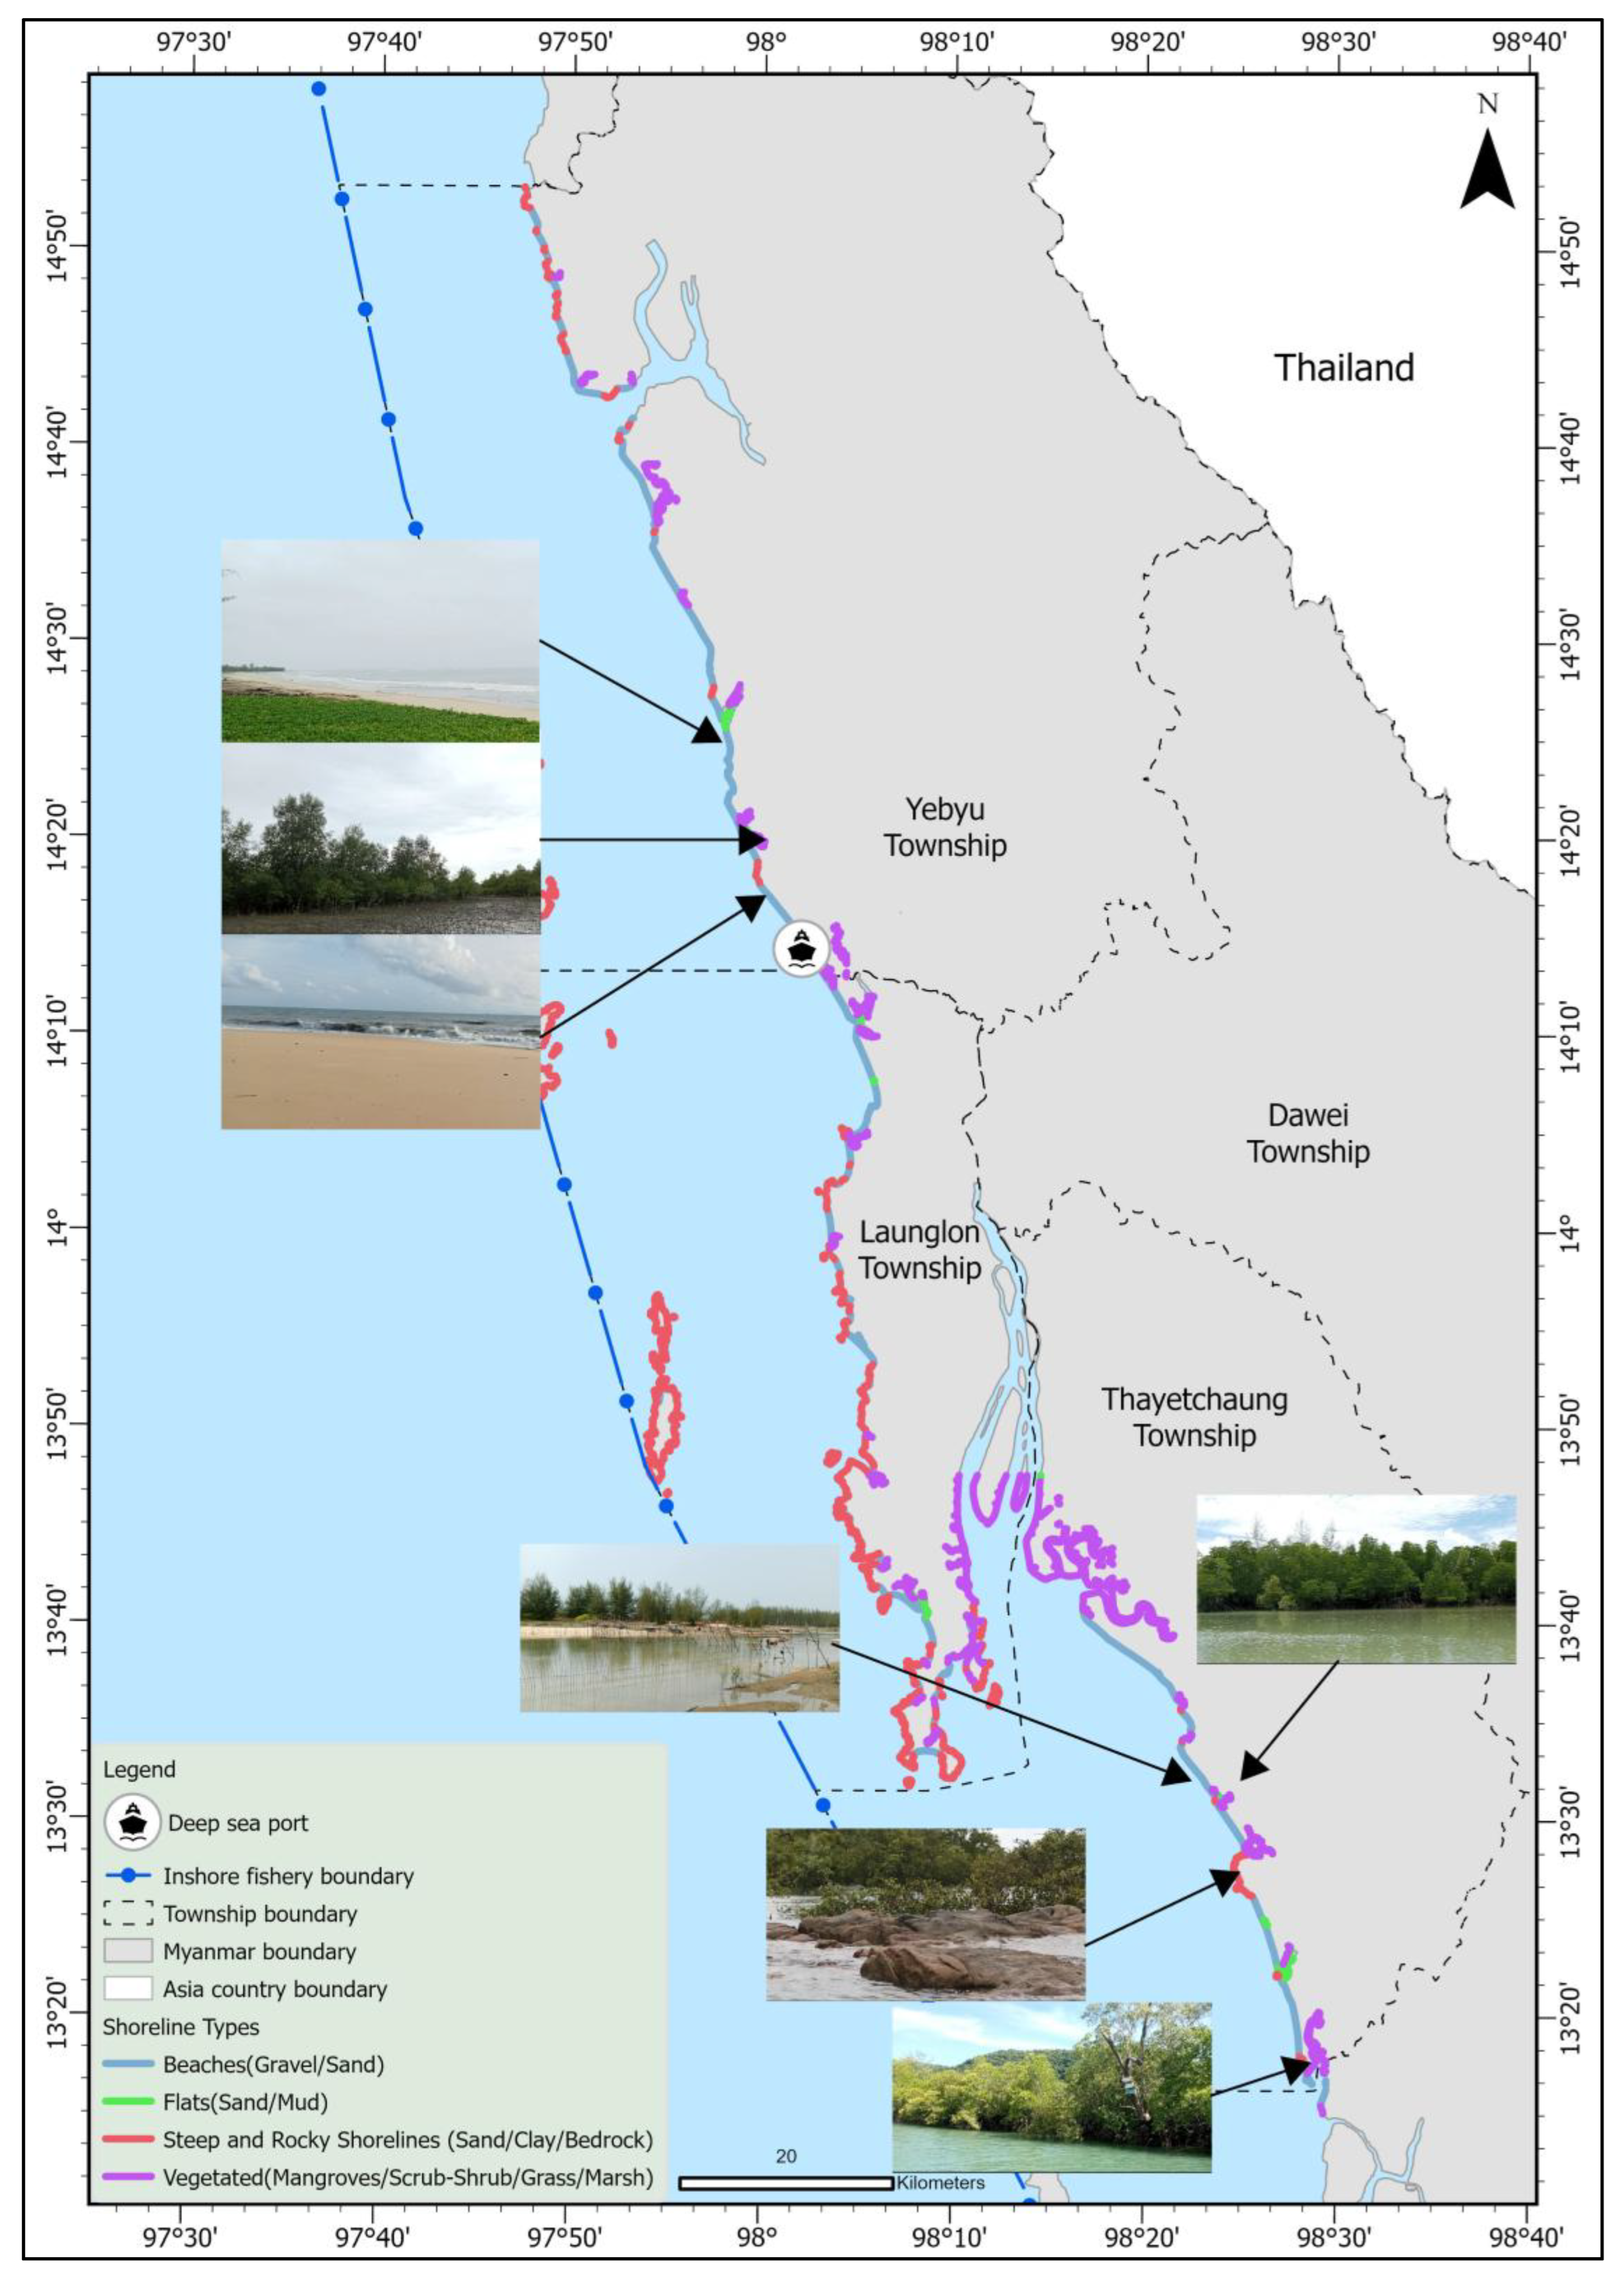
The study area is located along the northern Tanintharyi coast region (97.605–98.492° E and 14.920–13.251° N). The Tanintharyi coast in southern Myanmar, characterized by its fragile ecosystems and increasing development pressures, offers an ideal location for this study [,] (Figure 1). It contains the country’s largest mangrove extent and highest mangrove species diversity [], along with diverse habitats such as mangrove forests, seagrass beds, coral reefs, and sandy beaches that serve as sea turtle nesting sites [,,,]. These ecosystems provide vital nursery and habitat functions for fisheries, supporting small-scale fisheries, local livelihoods, and food security []. However, rapid industrial expansion, particularly the Dawei deep-sea port and special economic zone, which is intended to link South and Southeast Asia with the Greater Mekong Sub-Region, poses serious environmental risks [,,]. In the absence of an oil spill sensitivity assessment [], such developments could threaten both biodiversity and socio-economic stability [,]. Without spatial knowledge of vulnerable areas, oil spill responses may be delayed or misdirected. Proactive assessment and mapping are therefore essential for effective mitigation [,].
Figure 1. Environmental Sensitivity Index (ESI) study area is divided into 5 × 5 km grids between the administrative boundary (north to south), coastline (east), and inshore fishery demarcation line (west). Each grid cell was coded a numerical ID from south to north to facilitate the identification of risk areas.

2.2. Input Data Collection

Geospatial data were collected from a combination of institutional datasets, satellite imagery, and freely available online repositories in the period of 2020–2024 [,,,], as shown in Table 1. The Myanmar Biodiversity Fund (MBF) provided species (marine and coastal), habitat (mudflat), and fishing ground data. Field data were collected in 2020 across 17 villages and 1 ward within the Dawei area. These data were later revised in selected locations in 2024 to improve spatial accuracy. The available data from various sources within the study area were solely considered in this present research []. The data were processed and analyzed using ArcGIS Pro version 3.5 and Google Earth Pro. Table 1 presents the multi-year datasets used in this investigation. Each dataset was transformed to a uniform spatial reference and resolution for integration within the analysis grid [].
Table 1. List of data used in ESI assessment.

2.3. Spatial Framework Development

To facilitate spatial consistency and operational utility, the study area was subdivided into 254 square grids, with a computational grid size of 25 km2 used to more effectively analyze and highlight areas at risk in the environmental sensitivity map [] and to align with the chlorophyll-a data [] (Figure 1). This assessment delineated a buffer of 25 km from the shoreline to the outer line of the inshore fishing area in order to assess the potential impact of oil spills in nearshore waters, which are more vulnerable to community fishing activities and livelihoods [,], due to their proximity to the spill source [,] and the concentration of fishing efforts [,]. These blocks were coded numerically from south to north and grouped into three zones by township administrative boundaries (Yebyu, Launglon, and Thayetchaung Townships). This study considers this block size optimal, as it is neither too large nor too small, allowing for practical emergency response planning and providing a manageable level of detail for oil spill sensitivity mapping [,,].

2.4. Structure of Environmental Sensitivity Index

This present research utilized a systematic GIS-based multi-criteria analysis approach to develop an Environmental Sensitivity Index (ESI) for oil spill risk assessment in the Tanintharyi coastal region of Myanmar. The methodology integrated geospatial techniques with expert-guided assessment through the Analytical Hierarchy Process (AHP), enabling a complete review of coastal environment sensitivity [,]. The approach constructed on established frameworks developed by NOAA, emphasizing the spatial integration of biological, physical, and socio-economic factors [,,,,,].
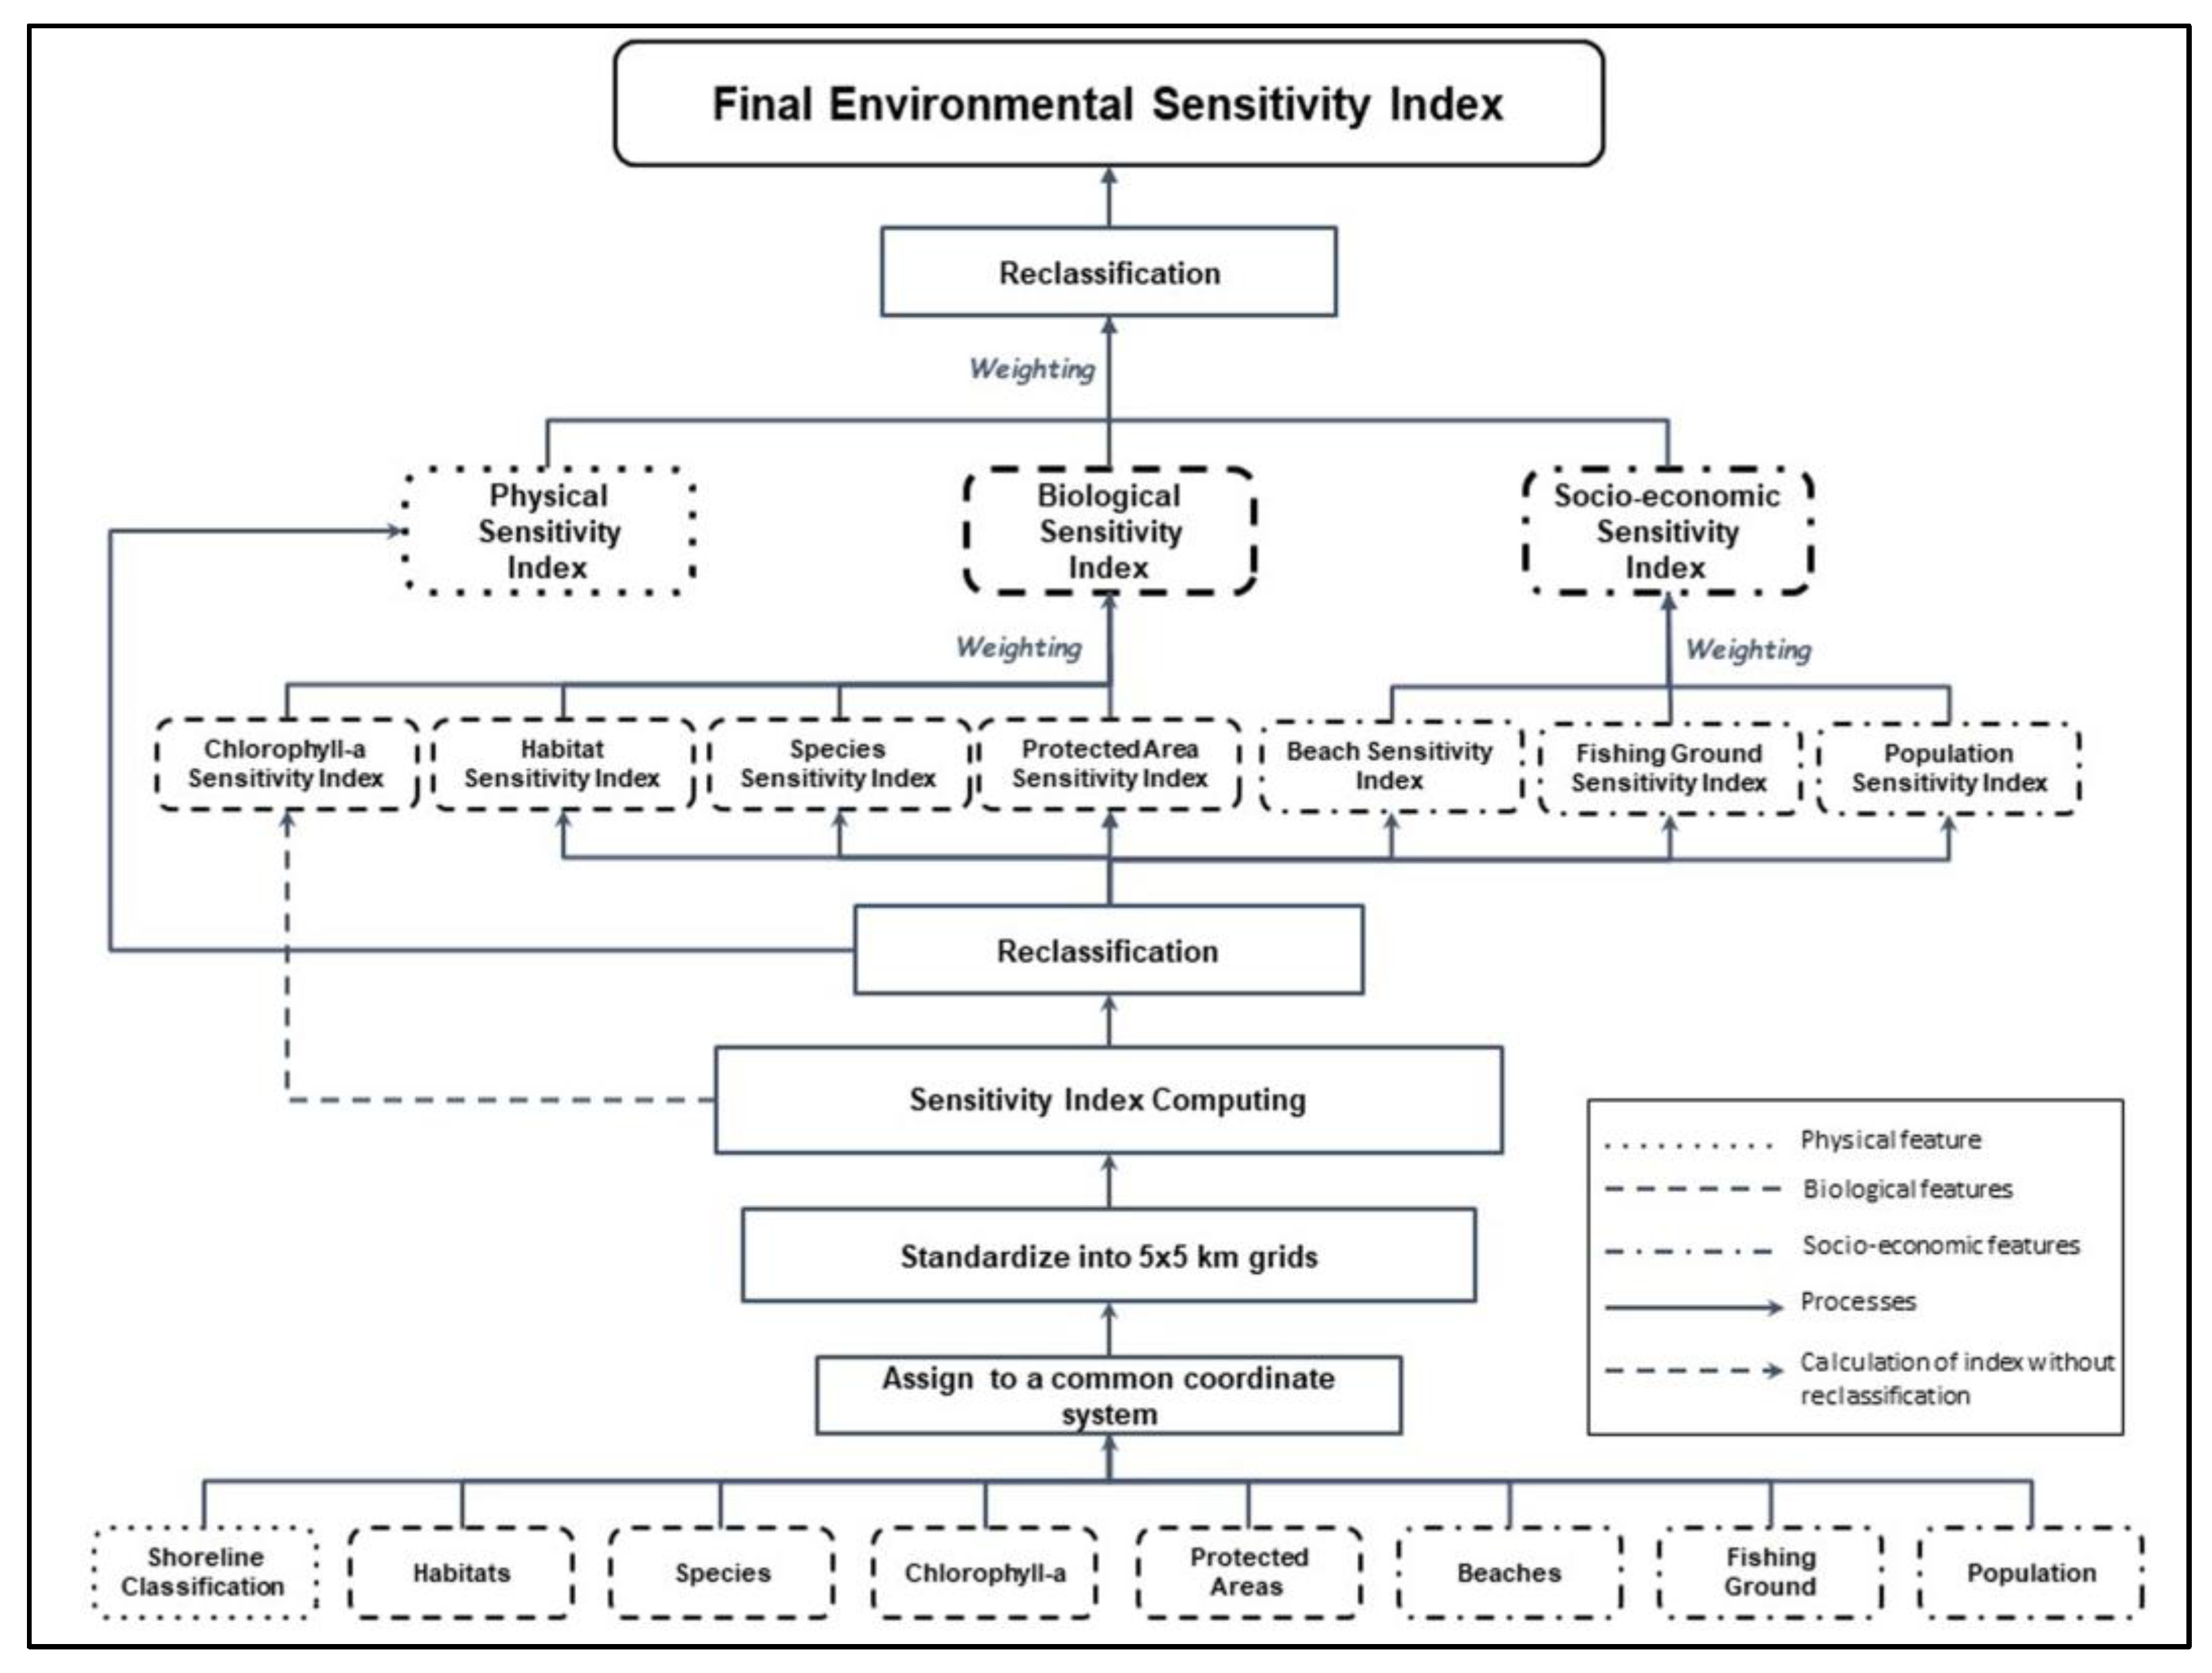
The concept of ESI is the summation of the Physical Sensitivity Index (PSI), Biological Sensitivity Index (BSI), and Socio-economic Sensitivity Index (SESI) as shown in (Equation (1)). Figure 2 demonstrates the Environmental Sensitivity Index analysis framework of this study. PSI focuses on the shoreline type. Oil spillage effects and remediation costs depend on shoreline type, where cleanup activities are typically more difficult and expensive than offshore areas [,,]. BSI includes habitat, species, protected area, and chlorophyll-a indices, reflecting how the natural environment and marine species respond to oil spills, as biological sensitivity is more complex than physical. SESI also involves complexity []. Beach, fishing ground, and human population density indices are considered its sub-components. These represent areas utilized by humans that are economically impacted and could be useful for access or installation of oil spill response equipment [].
Figure 2. Overall approach of environmental sensitivity analysis applied in this study.
The workflow mainly followed the following six steps: (1) grid-based spatial framework development; (2) acquisition and preprocessing of geospatial input data; (3) sensitivity scoring based on literature review and expert knowledge; (4) AHP-based weight derivation; (5) GIS-based overlay analysis and index computations; and (6) classification and mapping of final ESI values.
ESI = Physical Sensitivity + Biological Sensitivity + Socio-economic Sensitivity

2.4.1. Data Standardization

Throughout all index calculation processes, including both the sub-index analysis (e.g., habitat sensitivity, protected area index, socio-economic elements, and species index) and the final sensitivity indices (biological, socio-economic, physical, and overall ESI), two techniques were consistently applied to ensure comparability and standardization across all grid cells. First, any grid cell with unavailable or missing data for a given factor was automatically assigned a null value of zero []. Second, all calculated index results were reclassified into five standardized sensitivity categories (very high to very low) [] using the Natural Break (Jenks) classification approach, which regulates values according to their natural distribution []. To ensure the accuracy and validity of the analysis, both vector and imagery layers were aligned to the WGS 1984 UTM Zone 47N projection.

2.4.2. Calculation of Sensitivity Index

The ESI was determined by incorporating three basic types of elements: physical, socio-economic, and biological sensitivity indices [,,,]. The individual sub-indices were calculated based on a combination of a relevant set of factors, which were standardized, weighted and classified into five sensitivity levels ranging from very high to very low [,,].

2.5. Physical Sensitivity Index Calculation

This study employed shoreline type as the Physical Sensitivity Index (PSI) in the ESI approach. Shorelines were manually digitized using high-resolution World Imagery Base map (Digital Globe, date April 2024) in ArcGIS Pro, with virtual interpretation performed on Google Earth imagery []. Some shoreline types were validated using field photographs taken in accessible areas due to the current country situation (Figure A1). This approach helps to reduce uncertainty from subjective visual classification caused by variations in the tidal stages when aerial and satellite imagery were captured, particularly in differentiation sand beach types with grain size and distinguishing swamp, scrub–shrub, and mangrove areas []. Shoreline classification followed NOAA’s standards, which classify four environments (lake, river, estuarine, and palustrine) with an index range from 1 (very low sensitivity) to 10 (very high sensitivity) [,,,]. However, to integrate quantitative information and ESI within a GIS framework [], the present research applied the recent ESI guideline, which standardized PSI into five levels for oil spill sensitivity [] (Table 2).
Table 2. Summary of the grouped shoreline classification.
After completion of shoreline classification, the Physical Sensitivity Index (PSI) was calculated utilizing an adopted formula from [] (Equation (2)). The PSI for each grid was determined based on the distance to the respective shoreline. The resulting index were grouped into five categories of sensitivity using the Natural Breaks (Jenks) method [], ranging from very low (1) to very high (5). Previous studies [,] also suggested to categorized into five levels. Therefore, an adapted approach utilized five levels for all factors in the ESI calculation.
P S I g = D i × E S I s c o r e i D g
where PSIg is the Physical Sensitivity Index of grid g; Di is the distance of shoreline type i; ESIscorei is the Environmental Sensitivity Index score of shoreline type i (Table 2); and Dg is the total shoreline distance per grid.

2.6. Biological Sensitivity Index Calculation

Biological sensitivity incorporated habitat sensitivity, species presence, protected area coverage and chlorophyll-a concentration. Each layer was assigned a sensitivity score and weighted according to expert judgment using the AHP.

2.6.1. Habitat Sensitivity Index

The study examined four key coastal habitat types: mudflats, coral reefs, mangroves, and seagrass beds. This assessment converted each factor shapefile to be a grid (5 × 5 km) using the union tool, and calculated the area covered by each grid. Similar to the Physical Sensitivity Index calculation, this study also applied scores based on NOAA and International Petroleum Industry Environmental Conservation Association’s (IPIECA) criteria, expert judgment, and previous studies [,,,] to calculate the habitat sensitivity index (HSI). The scores assigned were 3 for seagrass beds, 4 for mudflats and coral reefs, and 5 for mangroves. In order to calculate habitat sensitivity, this study employed a modified formula adapted from [], originally developed for shoreline sensitivity assessment. The modified formula, shown in (Equation (3)), is based on the areal extent of each habitat type within the study grid. This adaptation enables the incorporation of habitat-specific spatial coverage into the sensitivity index, allowing for a more accurate representation of ecological vulnerability. The resulting index values were subsequently reclassified into a five-level scale using the Natural Breaks method.
H S I g = A i × E S I s c o r e i A g
where HSIg is the habitat sensitivity index of grid g; Ai is the area of habitat type i; ESIscorei is the Environmental Sensitivity Index score of habitat i; and Ag is total area of a grid, calculated from summation of each habitat type or 25 km2.

2.6.2. Species Index

Species geospatial data were from biodiversity conservation programs (MBF). These data represent the boundaries of species found within the research area. A total of 15 species were used in this research (Table A1). This evaluation considered marine mammals, reptiles, fish, shore birds, and other coastal species, because they may be affected by oil spills. According to local experts consulted during the survey, all species were considered equally important within the study area. Oil spills cause severe water pollution and disrupt marine and coastal ecosystems, with toxic compounds impacting multiple trophic levels and resulting in long-term ecological damage [,]. The distribution of species was overlaid, and the number of species per grid was counted (presence = 1, absence = 0) within the research area []. This approach follows IPIECA’s presence-count methodology, which has been previously applied to study species occupancy. Therefore, the species index (SI) is the summation of species presented in each grid [,] and then categorized into five classes using the Natural Breaks method.
S I g = i = 1 n P i g
where SIg is the species count of grid g; Pig is the presence value of species i in grid g (1 = present, 0 = absent); n is the total number of species considered.

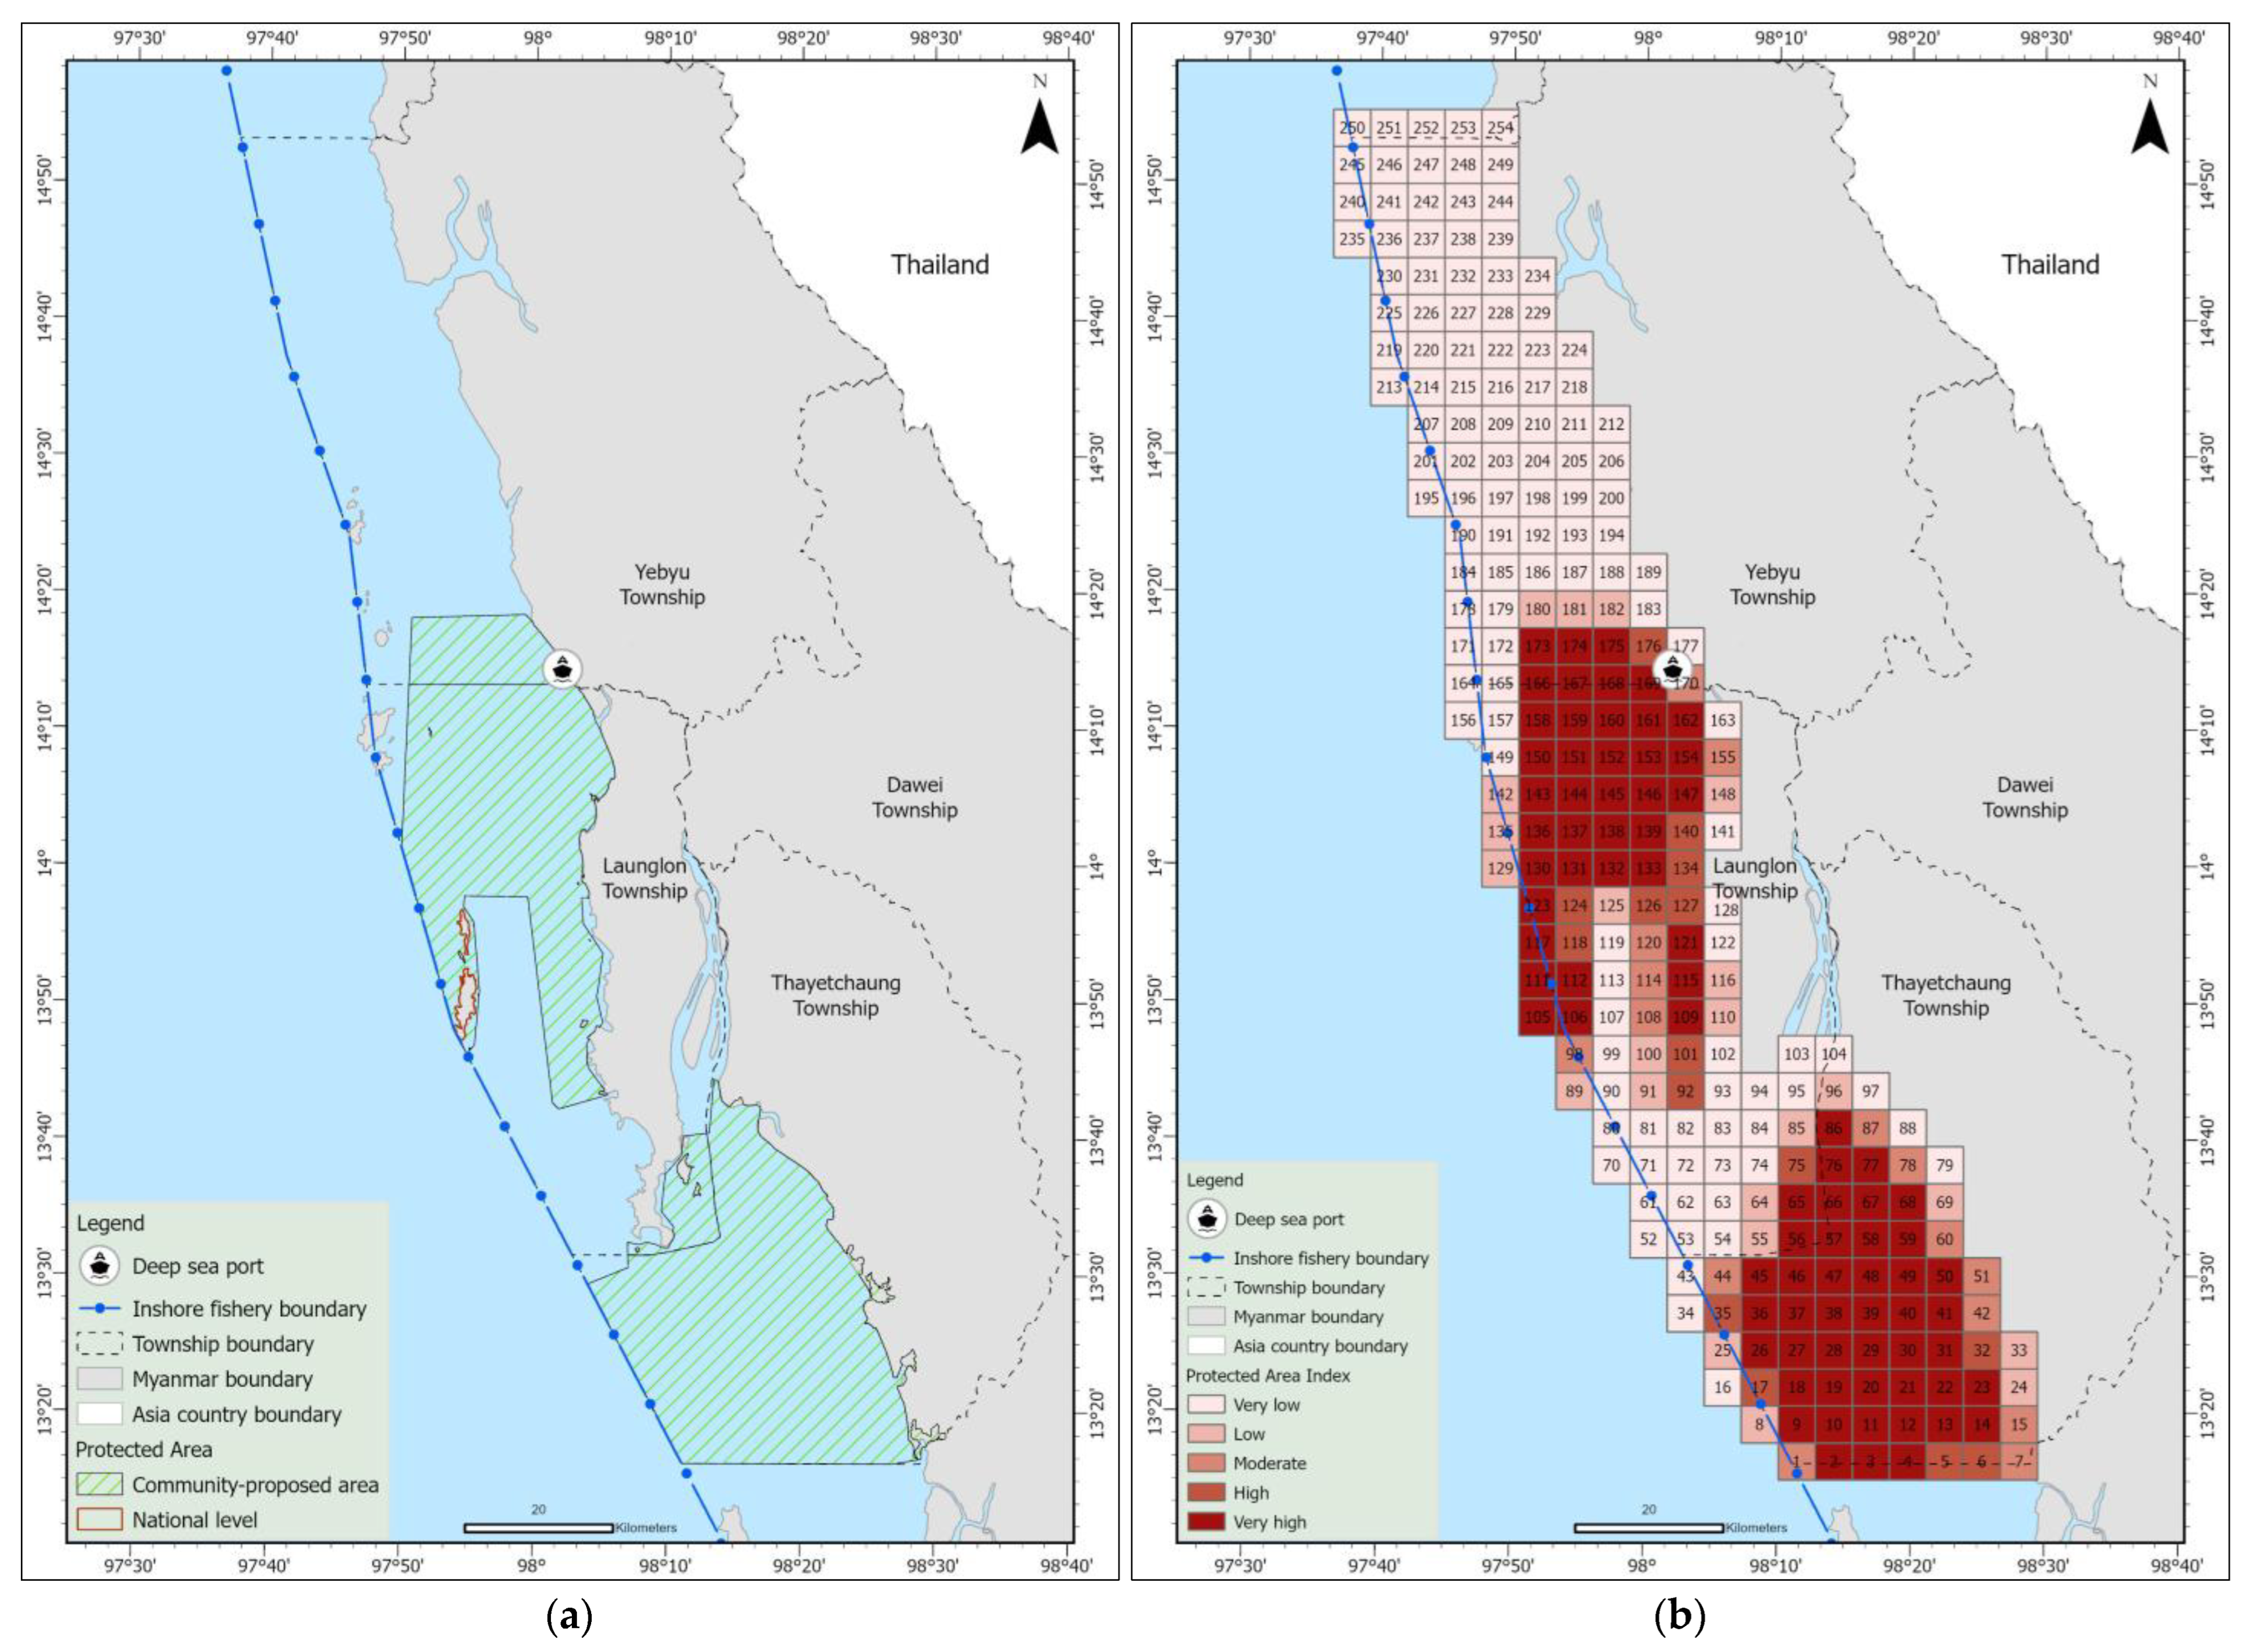
2.6.3. Protected Area Index

Based on [] and expert judgment (marine and terrestrial biologists, conservationists, livelihood professionals, and non-technical local experts), ESI scores of 4 and 5 were assigned to protected area boundaries representing community-proposed protected areas and nationally designated areas, respectively. To overlay the protected area index, the protected area shapefiles were converted from polygon to grid format using the union technique, after which the area within each grid cell was calculated. The protected area index (PI) was then computed using the same formula as for HIS (Equation (3)) and subsequently reclassified.

2.6.4. Chlorophyll-a Index

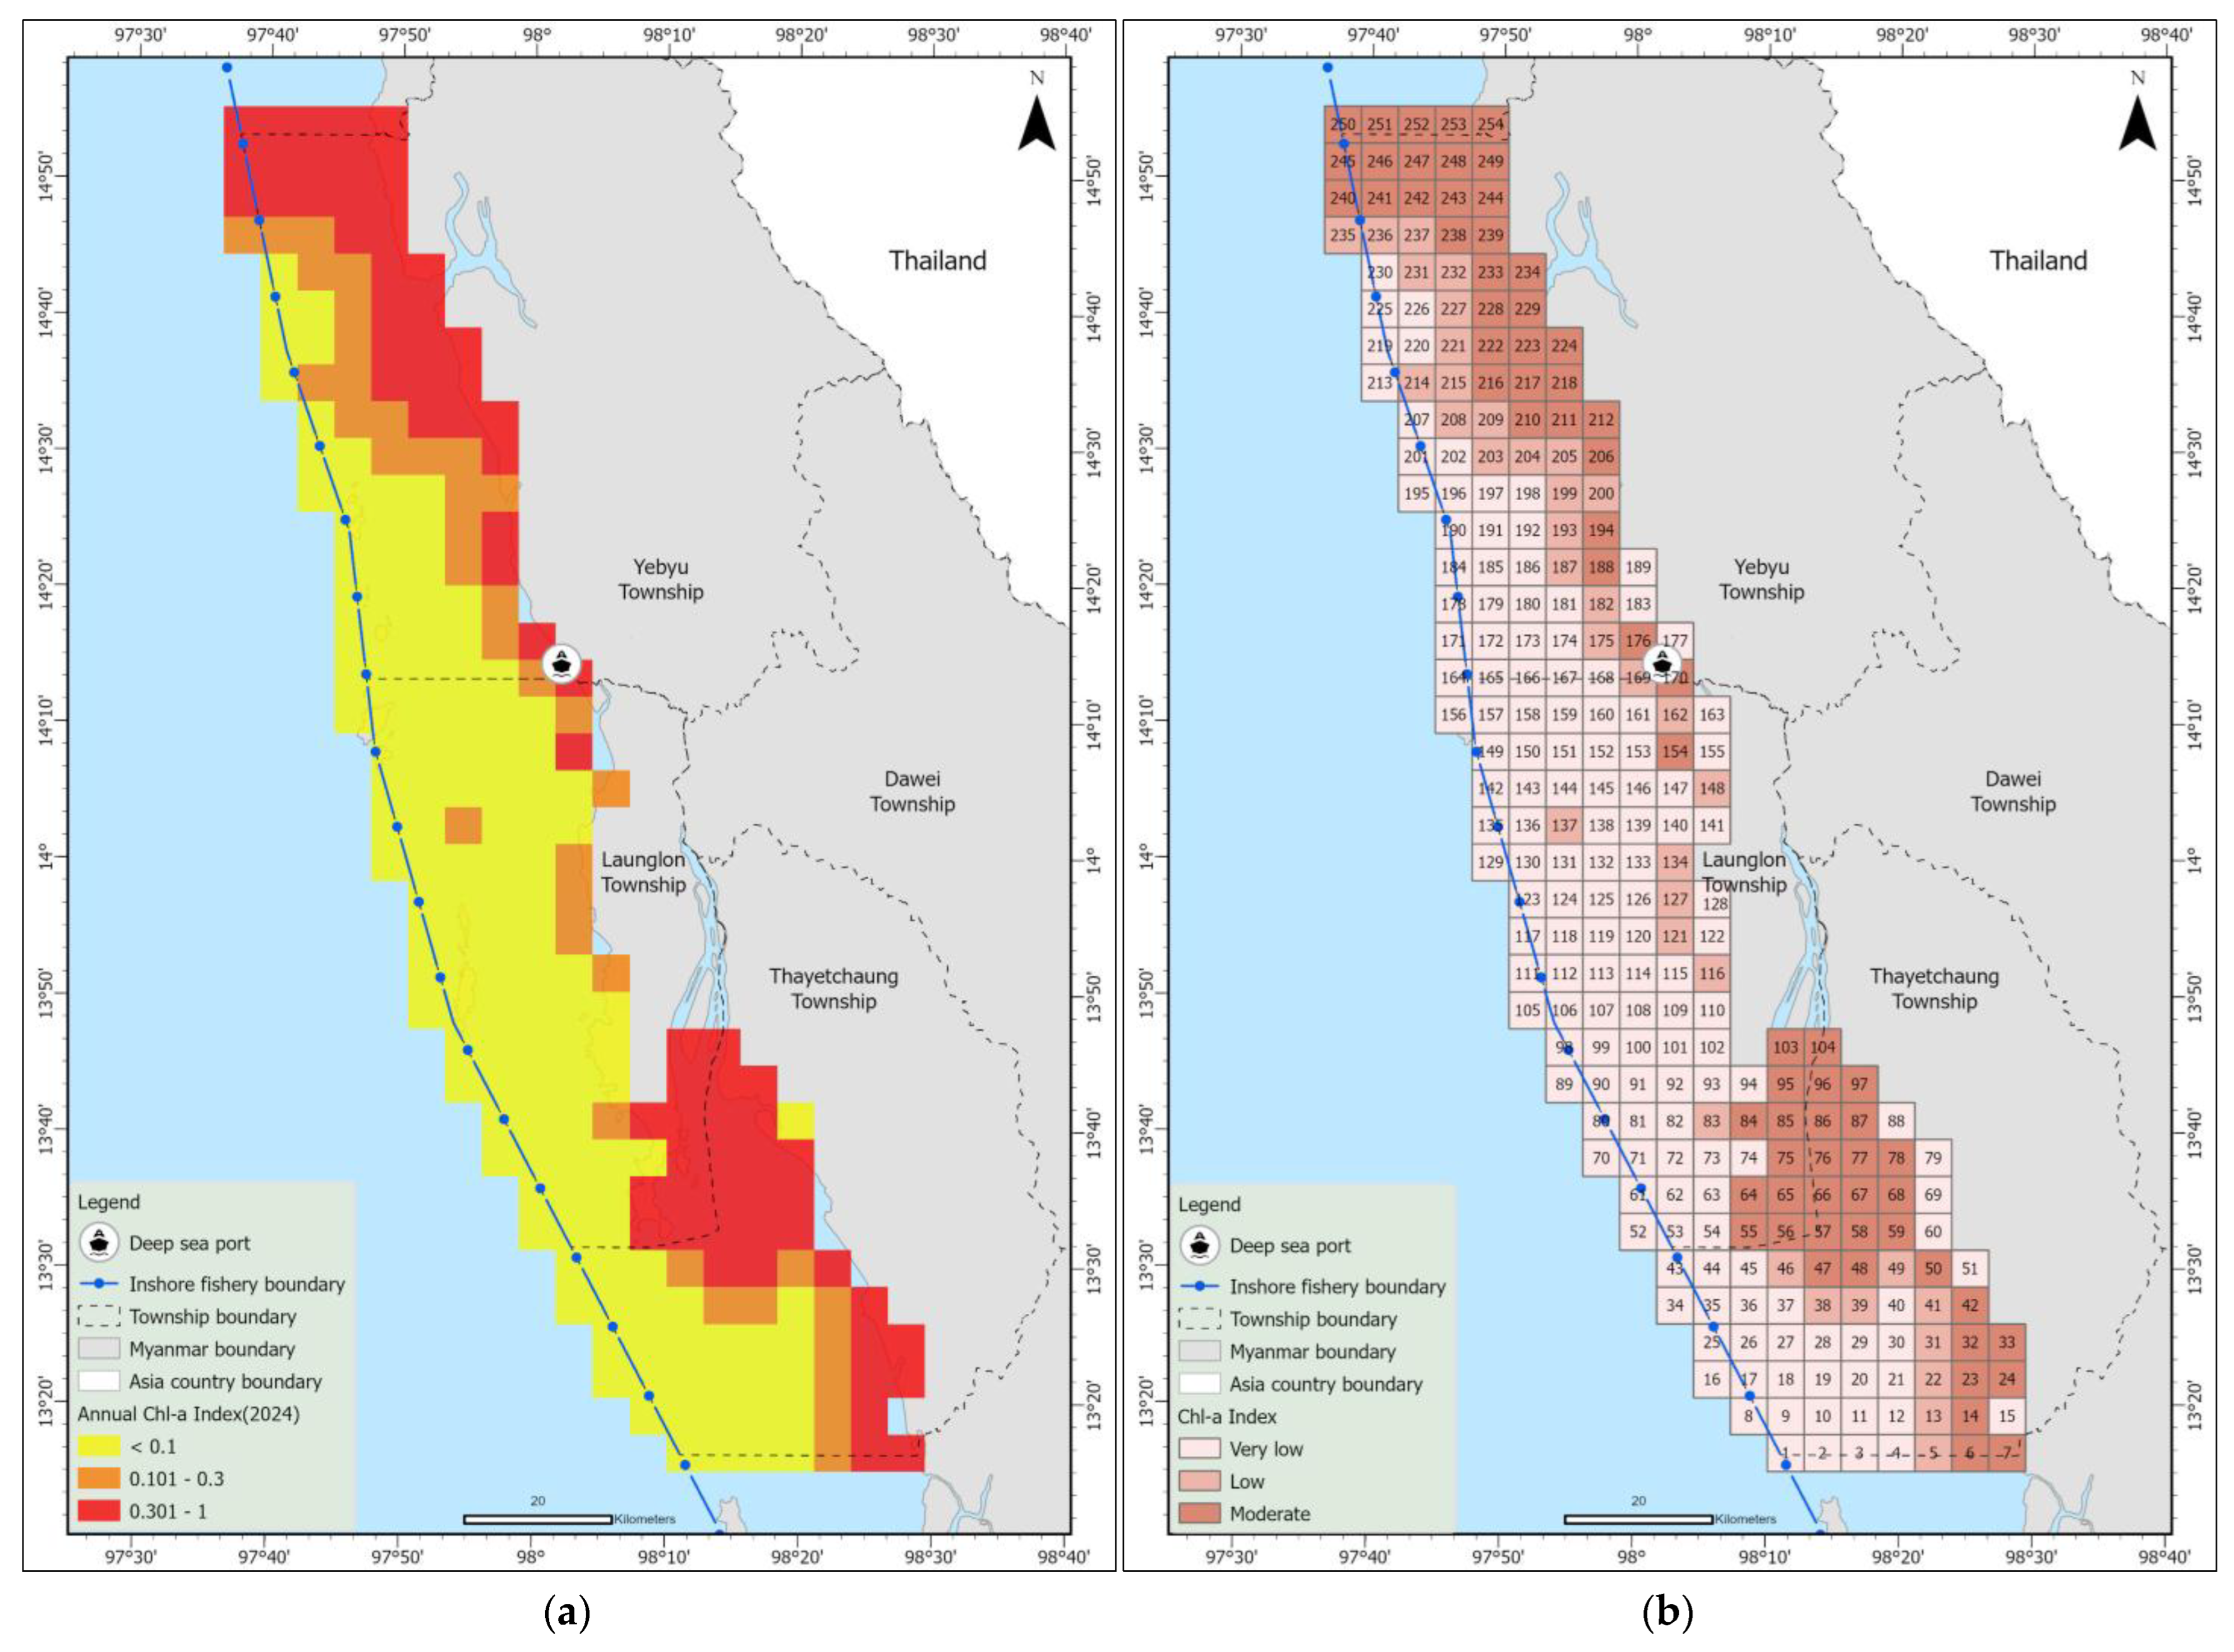
Chlorophyll-a data were obtained from the freely available GCOM-C/SGLI L3 Chlorophyll-a Concentration (V3) dataset provided by Japan Aerospace Exploration Agency. It consists of monthly data for 2024, from which the annual average was calculated []. Maximum values were extracted per grid using the Zonal Statistics tool []. This study proposed a chlorophyll-a index (CAI) with classification thresholds adapted from a previous study for regional-scale application [], with agreement from local experts. Table 3 presents the ranges of chlorophyll-a values and their corresponding CAI scores.
Table 3. Chlorophyll-a sensitivity index classification.

2.6.5. Final Biological Sensitivity Index

The Biological Sensitivity Index (BSI) was computed as a weighted sum [] of the four sub-elements: habitat sensitivity index (HIS), species index (SI), protected area index (PI), and chlorophyll-a index (CAI), as shown in (Equation (5)). Weights were derived from expert AHP scoring, and final scores were reclassified into five categories.
BSI = (HSI × a) + (SI × b) + (PI × c) + (CAI × d)
where HSI is the habitat sensitivity index; SI is the species index; PI is the protected area index; CAI is the chlorophyll-a index; BSI is the Biological Sensitivity Index, and a, b, c, and d are weighting values derived from the AHP approach.

2.7. Socio-Economic Sensitivity Index Calculation

The socio-economic sensitivity was derived from the combination of beach, fishing ground, and population density indices.

2.7.1. Beach Index

Current and potential tourism-related sites were identified by local expert view, and data were from OpenStreetMap (2024). The ESI score for this data is 4, assigned based on expert opinions, as referred to in []. To compute the beach index (BI), beach areas were overlaid with the study’s spatial framework, which was divided into 5 × 5 km grid cells using the union tool, and the beach area within each grid cell was calculated. This study also proposed the BI approach followed by the HSI calculation (Equation (3)), and the results were classified on a 1–5 scale using the Natural Breaks approach.

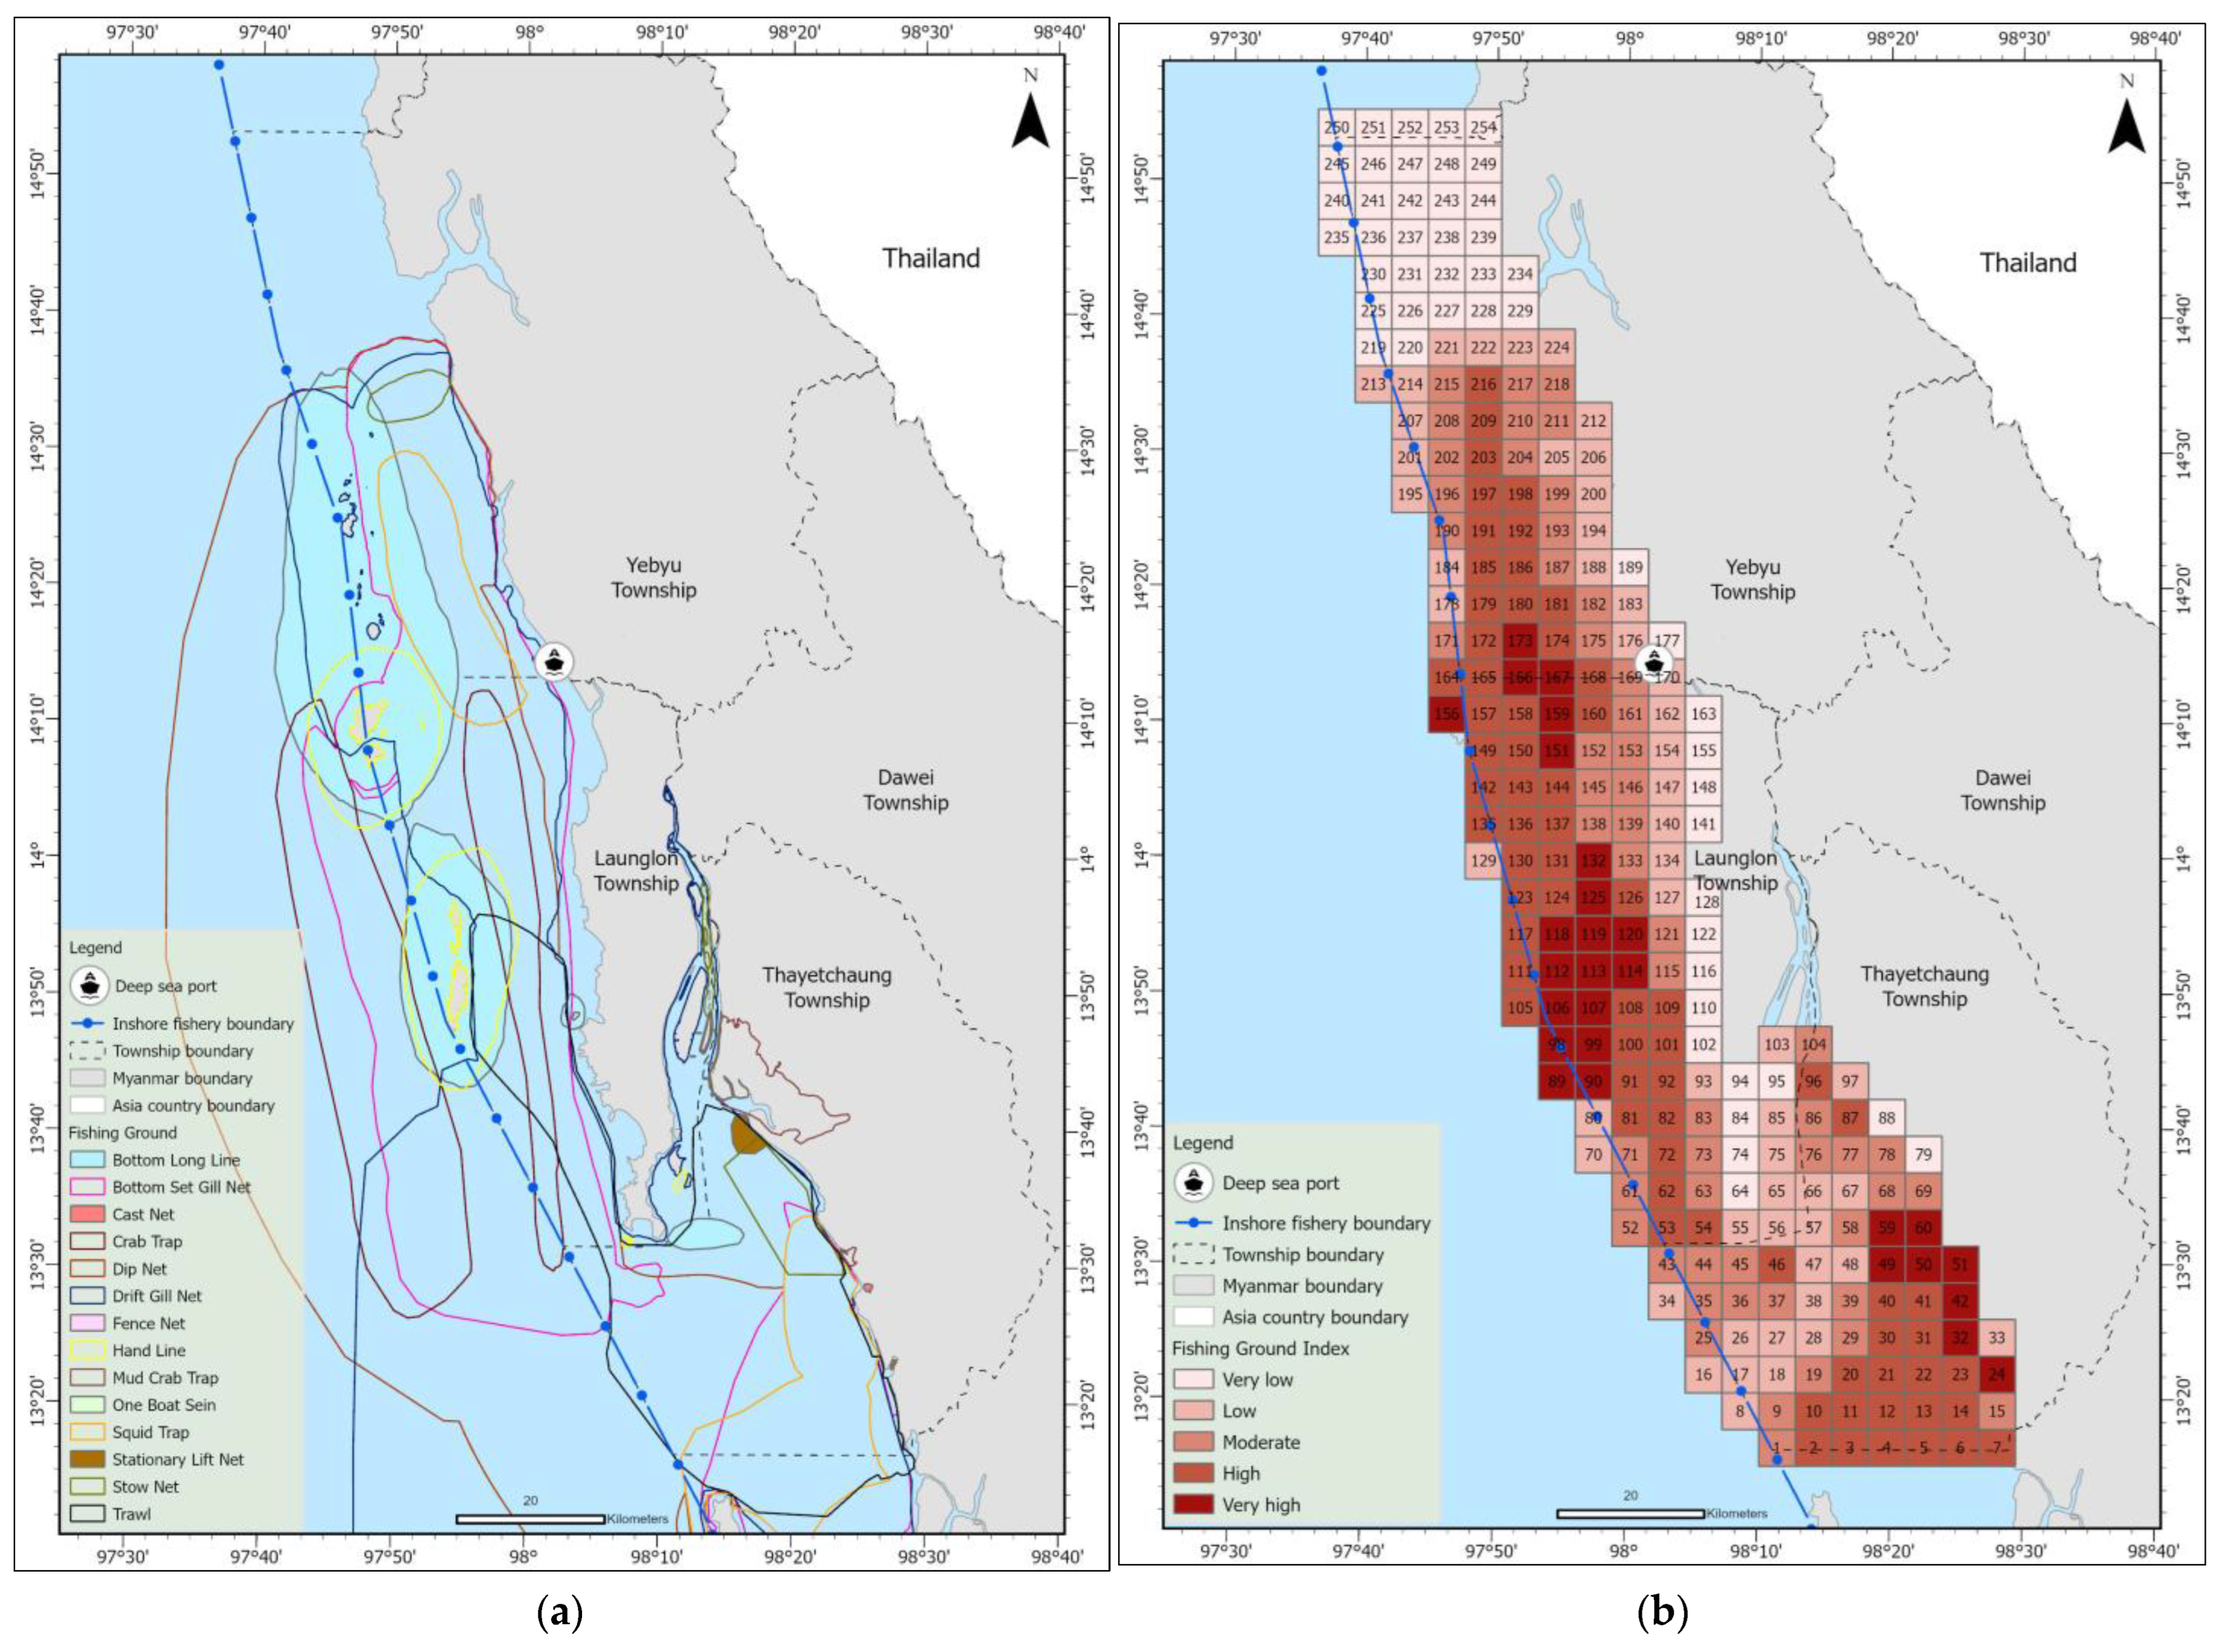
2.7.2. Fishing Ground Index

Fishing grounds were identified based on fishing gear-type data collected for 14 different gear categories within the study area (Table A1). To calculate fishing ground index (FGI) score per grid, this investigation overlaid the distribution of fishing gears onto the spatial framework using the union tool. Since there is no established approach for calculating an FGI, this study proposed a method similar to the SI calculation (Equation (4)) and classified it into five levels using the Natural Breaks method.

2.7.3. Human Population Density Index

Data for calculating human population density was from the 2023 Global Human Settlement Layer (GHSL). The human population density index (PDI) was calculated as shown in Equation (6). The total population per grid within the study area was extracted using the Zonal Statistics tool and classified into five sensitivity levels (Table 4).
P D g = P A g
where PDg is the human population density of grid g; P is the total human population within the grid; and Ag is the total area of a grid or 25 km2.
Table 4. Human population density index classification.

2.7.4. Final Socio-Economic Sensitivity Index Calculation

The socio-economic sensitivity index (SESI) was determined by applying weighted values from expert AHP results (Equation (7)), and the final values were then grouped into five sensitivity categories [,].
SESI = (BI × a) + (FGI × b) + (PDI × c)
where BI is the beach index; FGI is the fishing ground index; PDI is the population density index; SESI is the socio-economic sensitivity index; and a, b, and c are weighting values derived from the AHP approach.

2.8. Final ESI Analysis

The integrated ESI score of each gird was analyzed as a weighted composite of three primary indices (Equation (8)). After that, the values from the final result were reclassified using Natural Breaks [] into five sensitivity levels: 5 (very high), 4 (high), 3 (moderate), 2 (low), and 1 (very low) [,,]. Validated shoreline information mentioned above was integrated into the final ESI results to improve the accuracy of the physical sensitivity. However, this study acknowledges that the datasets used for calculating BSI and SESI differ temporally: Mangrove data are from 2021, while mudflat, species, and community-proposed protected area data are from 2020. Protected area data are from 2025, and chlorophyll-a data are from 2024. Socio-economic datasets included beach (tourism-related sites) data from 2024, fishing ground data from 2020, and population data from 2023. Despite these temporal differences, the datasets were considered sufficiently representative of the study area, as major ecological and environmental conditions are unlikely to have changed substantially over this period.
Final ESI = (PSI × a) + (BSI × b) + (SESI × c)
where PSI is the Physical Sensitivity Index; BSI is the Biological Sensitivity Index; SESI is the socio-economic sensitivity index; Final ESI is the final Environmental Sensitivity Index; and a, b, and c are weighting values derived from the AHP approach.

2.9. Analytical Hierarchy Process

The weighting process followed the Analytical Hierarchy Process (AHP). The AHP method is one of the most common weighting approach, originally proposed by [,]. This method involves pairwise comparisons of sensitivity indicators using a numerical scale to assign relative importance (1 to 9) and calculate the weight scores of each criterion. The resulting comparison matrices were normalized to obtain the corresponding weights of each criterion, that sum to 100%. To avoid contradictions and guarantee logical consistency, the consistency ratio for each matrix did not exceed 10%. AHP is particularly suitable for studies when it comes to integrating expert input with quantitative analysis. This research adopted the AHP method to obtain an unbiased representation of environmentally sensitive areas in the study area [,].
A structured AHP survey was performed to calculate weighted importance of the three main ESI elements: physical, biological, and socio-economic. The factors were selected based on data availability, as Myanmar faces significant data limitations. Subsequently, discussions were held with local experts to identify and prioritize the most relevant factors according to the available datasets. The AHP survey was conducted through an online focus group discussion to obtain expert judgments for the weighting process. This study used 10 experts, as [] suggested that surveys should have 8–15 participants. Participants were selected based on their experiences in coastal community livelihood development, marine conservation, and terrestrial biodiversity in the Tanintharyi coastal area. The professionals were from local non-governmental organizations (LNGOs) and international conservation organizations []. In addition, local experts who live in the coastal area and are actively engaged in coastal conservation, with strong knowledge of the local context, were also included. Most participants were highly familiar with sensitivity map development for oil spill response and were involved in the field data collection process. They individually scored the pairwise comparisons using an AHP Excel template from Business Performance Management Singapore (BPMSG), in which the weighted geometric mean was applied to aggregate individual responses into a group decision matrix []. Their inputs were accumulated, and consistency ratios (CRs) were calculated to ensure values less than 10%, following standard AHP applications in environmental sensitivity studies [,,].

3. Results

3.1. Weighting Result

The experts’ weightings were aggregated and weighted following the AHP-based pairwise comparison matrix for all evaluations (Table 5) [], calculated in an AHP excel template from BPMSG []. Table 6 and Figure 3 present the weight values for ESI and Sub-ESI factors, while Table 7 shows the weighting values from local experts along with the CR values. The BPMSG AHP template calculates the CR using the Alonso and Lamata linear fit formula, which simplifies the traditional CR = CR/RI method by integrating the random index. It computes CR using both the Row Geometric Mean and Eigenvector methods, applying a 0.1 threshold to flag and suggest corrections for inconsistent judgments []. The physical sensitivity, which represents the different types of shorelines (mangrove, rocky, mudflat, and sand), was weighted 0.22, contributing 22% to the overall weighting of the three evaluation components. Biological sensitivity accounted for 39% (weight = 0.39) of the overall weighting. It was divided into four sub-factors (habitat, species, chlorophyll-a, and protected area) weighted at 24%, 13%, 43%, and 20%, respectively. The contribution of socio-economic sensitivity also accounted for 39% of the overall weighting, with its sub-factors (beach, fishing ground, and population density) accounted for at 14%, 69%, and 17%, respectively.
Table 5. Pairwise comparison matrix with judgment scale.
Table 6. Weights assigned to sensitivity factors.
Figure 3. The pie charts illustrate the relative weighting of sub-factors within the biological (a), socio-economic (b), and the three major ESI components (c): physical, biological, and socio-economic features as determined through the AHP assessment. The charts highlight the proportional contribution of each component to the overall sensitivity index.
Table 7. Weighting values from local experts, biological sensitivity, socio-economic sensitivity, and environmental sensitivity.

3.2. Spatial Distribution of Physical Sensitivity Index

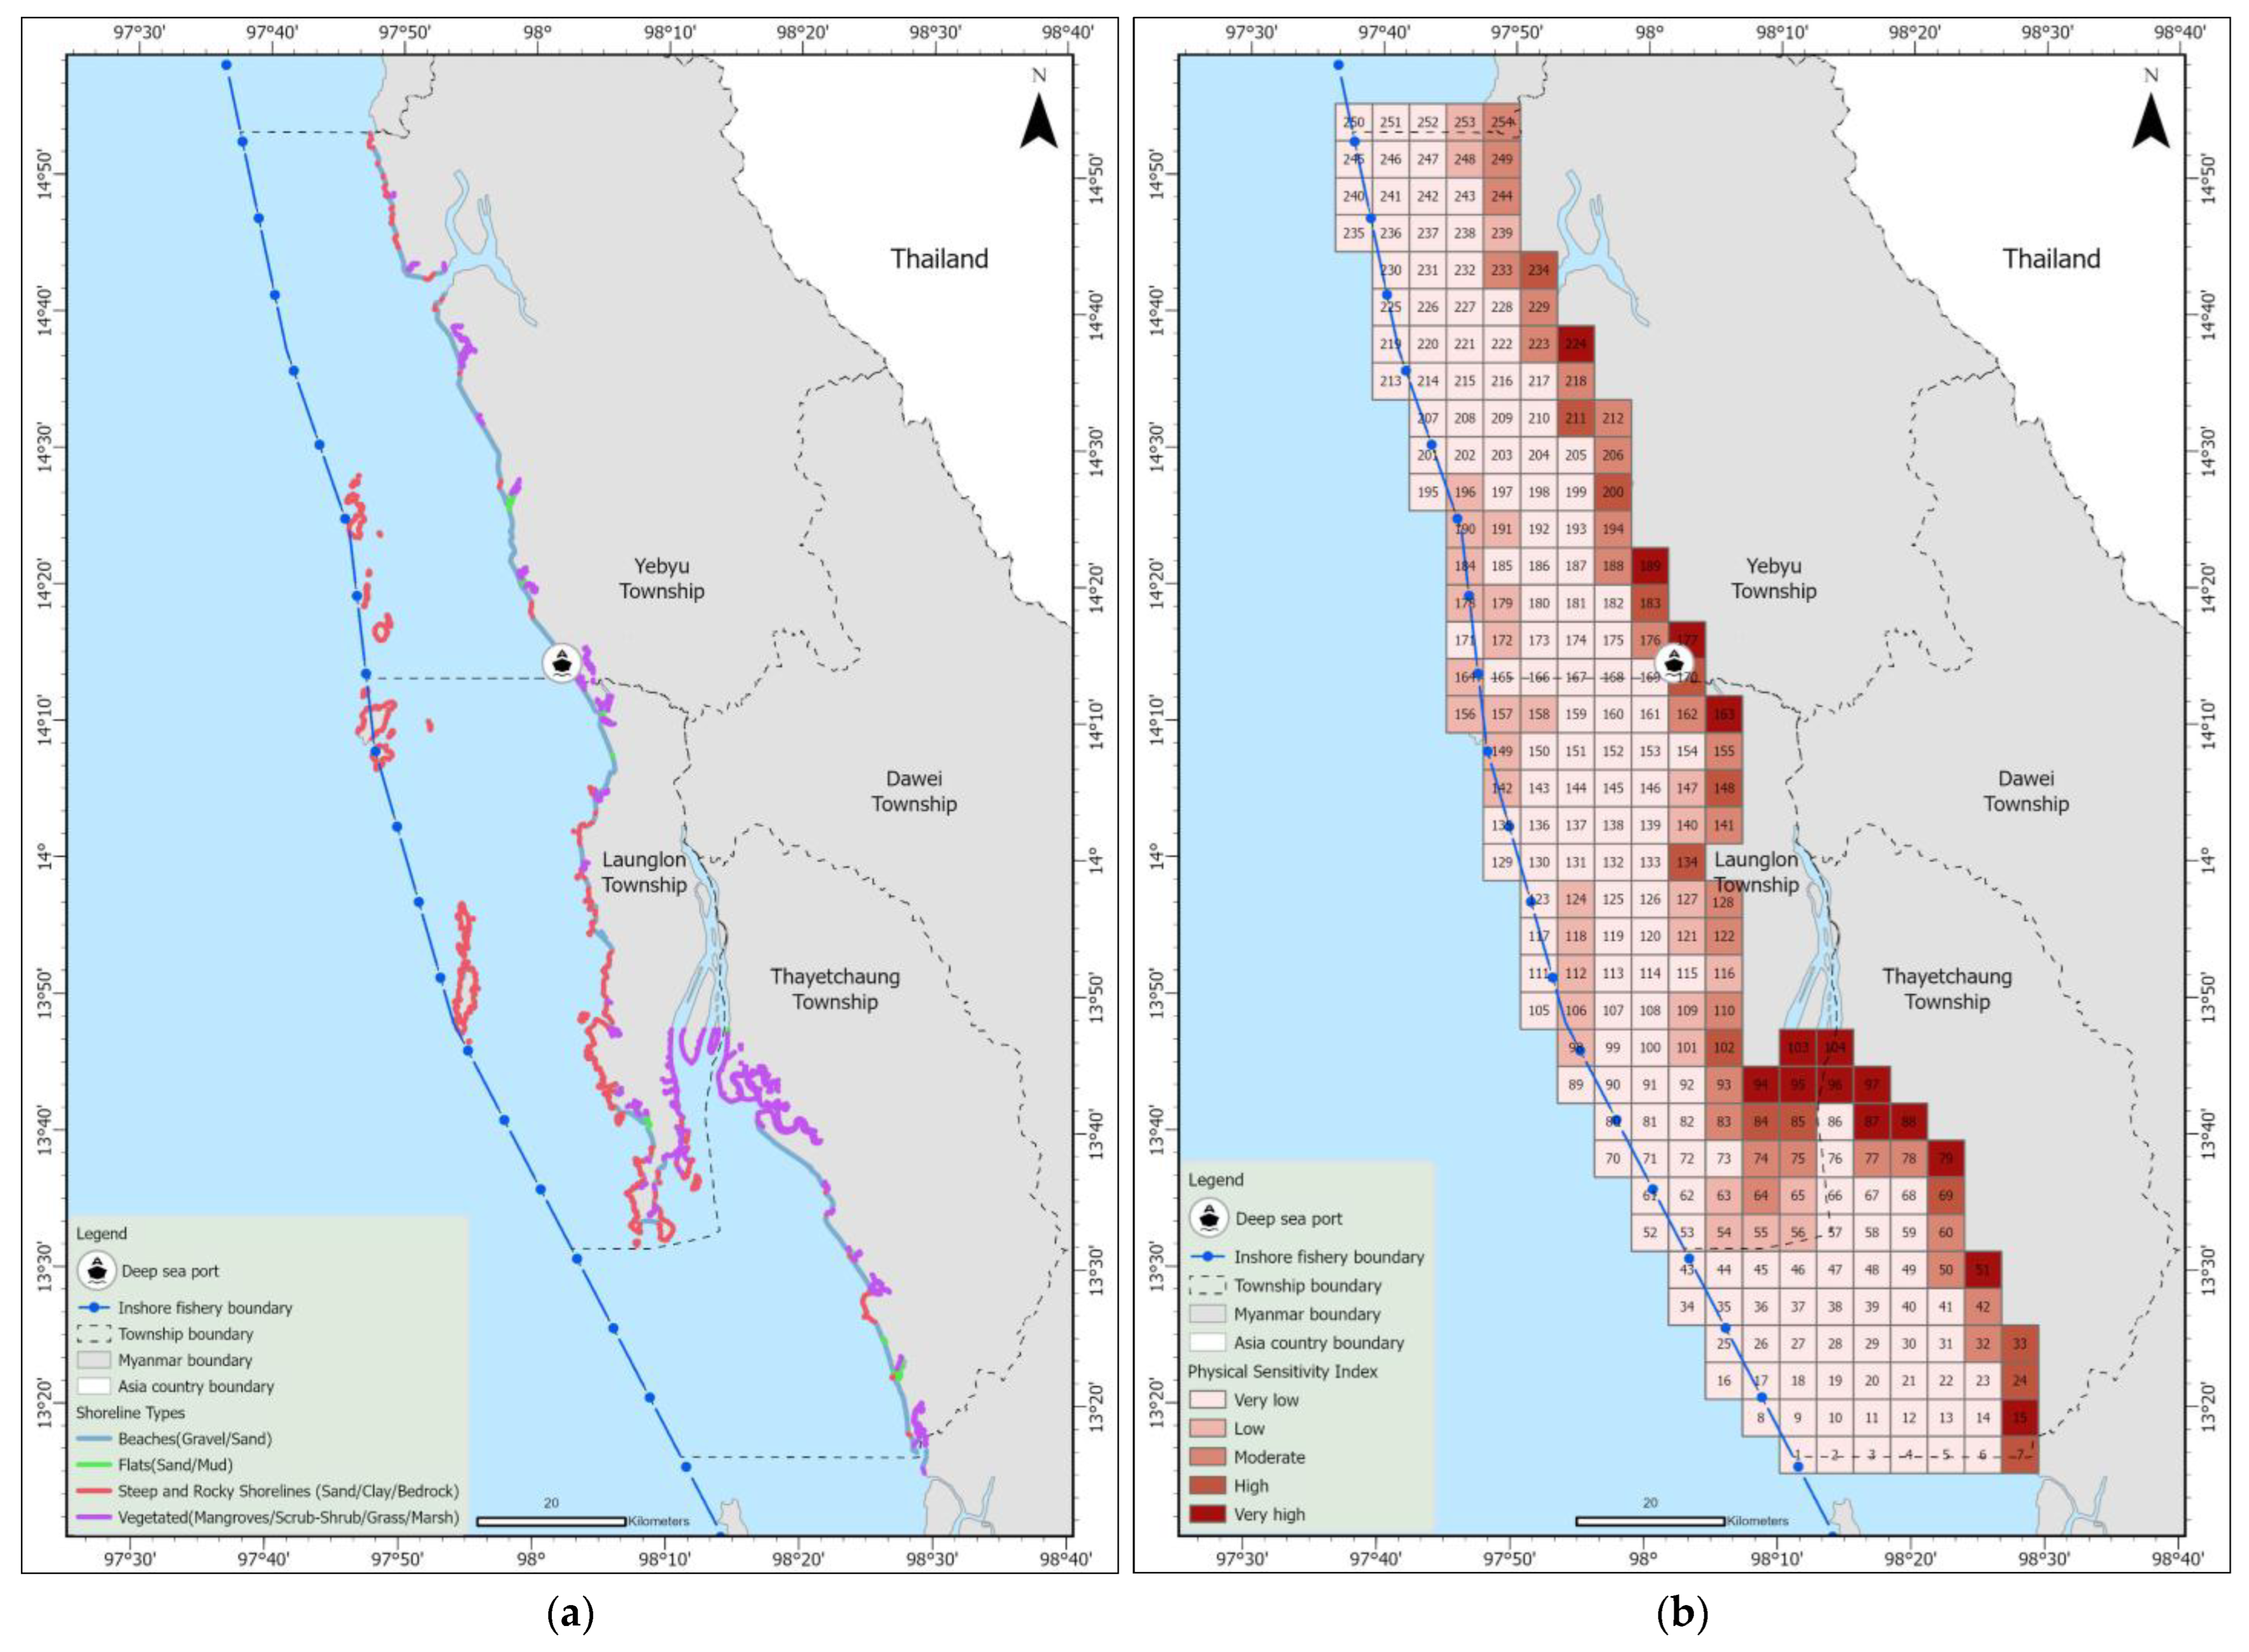
This study applied shoreline type for calculation of Physical Sensitivity Index (PSI). Figure 4 illustrates both shoreline type and PSI. Figure 4a demonstrates the spatial distribution of four shoreline classifications, including steep and rocky shorelines (sand/clay/bedrock), beaches (gravel/sand), flat (mud/sand), and vegetated (mangrove/scrub–shrub/grass/marsh), categorized with sensitivity ratings ranging from 2 to 5. Steep and rocky shorelines, and beach shore types are most common in Launglon Township, while vegetated shores are most abundant in Thayetchaung Township, followed by Launglon and Yebyu Township. Flat shorelines are spread almost equally across the three Townships.
Figure 4. Spatial distribution of shoreline classification (a), and Physical Sensitivity Index (b).
The spatial distribution of PSI across the 254 total grid squares is shown in Figure 4b. PSI analysis revealed that 6% of the grids were categorized as very high sensitivity, followed by 6% as high, 11% as moderate, 13% as low, and 64% as very low. The distribution of PSI reflects the spatial variation in shoreline types and their relative vulnerability to oil spills. Refer to (Figure 4a), very high sensitivity grids were observed to have the longest total length of mangrove shoreline, which is widely recognized for their ecological importance and high vulnerability to oil contamination [,,]. Highlighting specific geographic clusters of physical vulnerability, these grids included eight cells in Thayetchaung Township, four cells in Launglon Township, and three in Yebyu Township.

3.3. Spatial Distribution of Biological Sensitivity Index

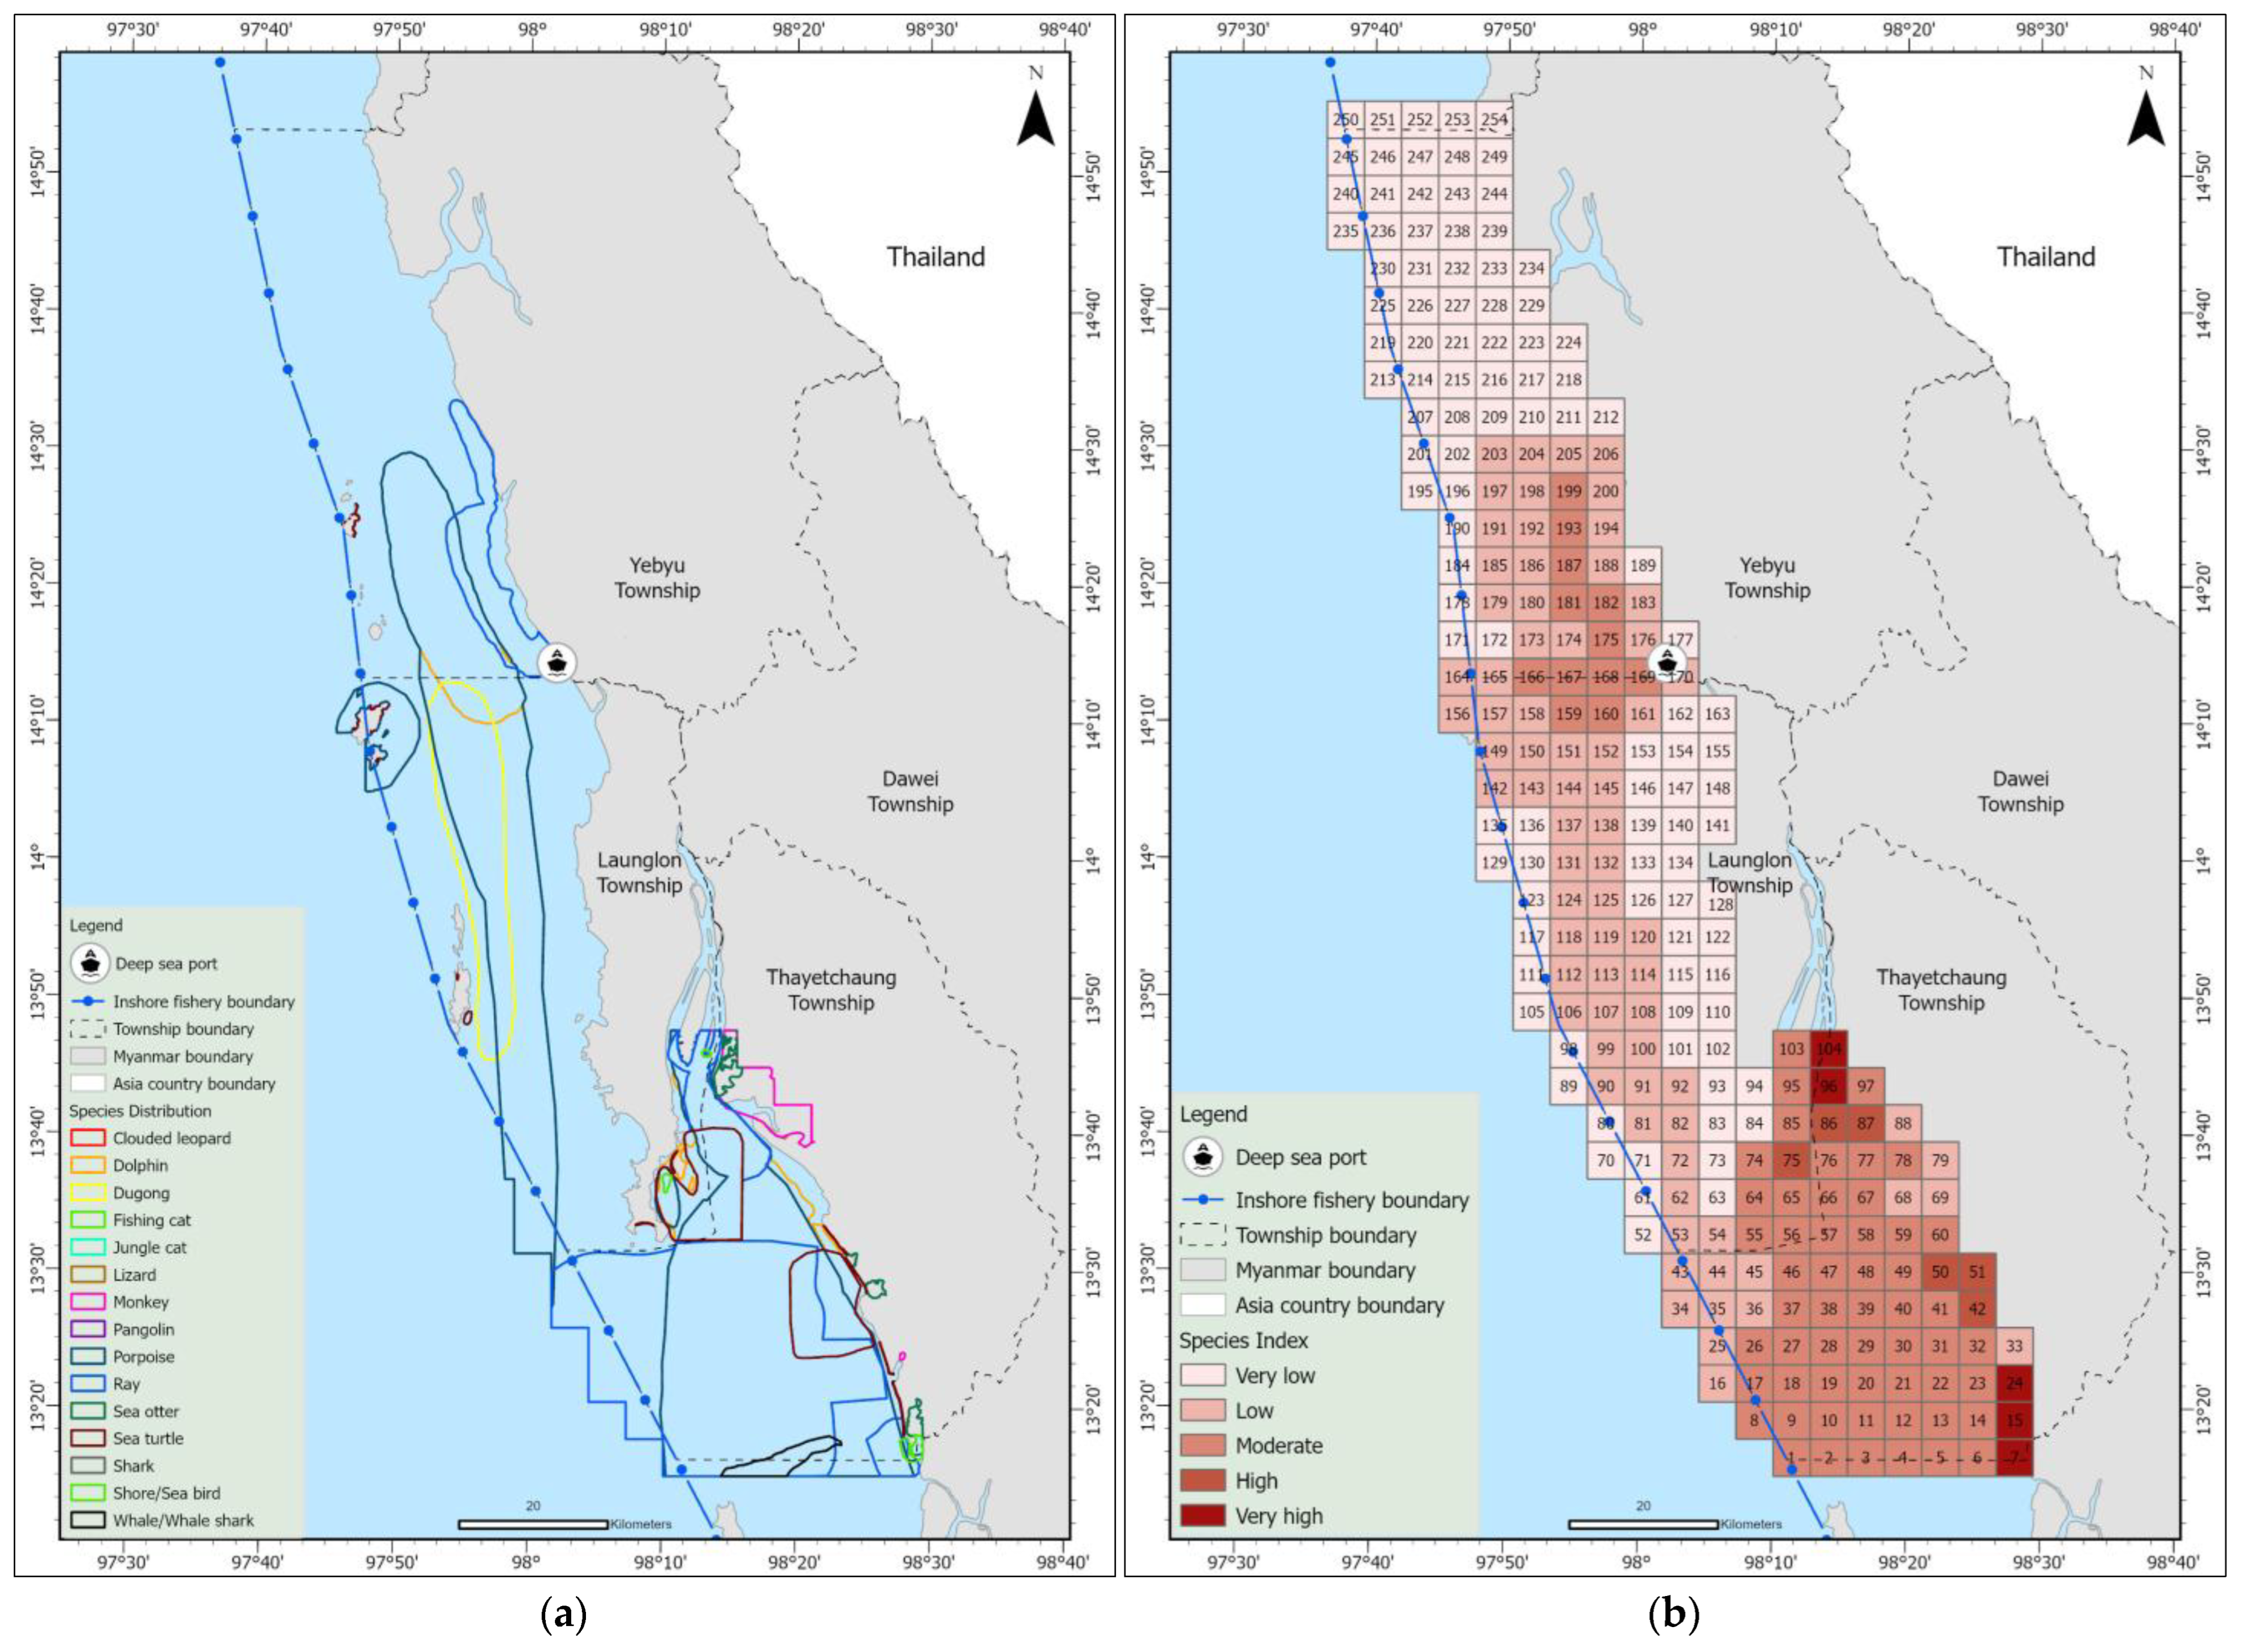
The Biological Sensitivity Index was calculated from habitat (Figure 5b), species (Figure 6b), chlorophyll-a concentration (Figure 7b), and protected areas (Figure 8b). Figure 5, Figure 6, Figure 7 and Figure 8 depict the spatial distribution of biological features and their corresponding sensitivity indices: habitat (Figure 5), species (Figure 6), chlorophyll-a (Figure 7), and protected areas (Figure 8). As shown in Figure 5a, mangrove forests and mudflats cover the largest extent in Thayetchaung Township, while coral reefs and seagrass dominate in Launglon, and Yebyu has the smallest overall habitat area. Figure 6a indicates that species occurrence and richness are highest in Thayetchaung Township, which hosts the greatest species diversity, including dolphins, porpoises, rays, whale sharks, sea turtles, fishing cats, monkeys, and seabirds, followed by Launglon and Yebyu. Figure 7a demonstrates that moderate chlorophyll-a concentrations are greatest in Yebyu Township, whereas Thayetchaung and Launglon exhibit lower values. Finally, Figure 8a shows that protected area coverage and the sensitivity index are largest in Thayetchaung, followed by Launglon and Yebyu, encompassing both nationally designated and community-proposed areas.
Figure 5. Spatial distribution of habitat (a), and habitat sensitivity index (b).
Figure 6. Spatial distribution of species (a), and species sensitivity index (b).
Figure 7. Spatial distribution of chlorophyll-a (a), and chlorophyll-a sensitivity index (b).
Figure 8. Spatial distribution of protected area (a), and protected area sensitivity index (b).
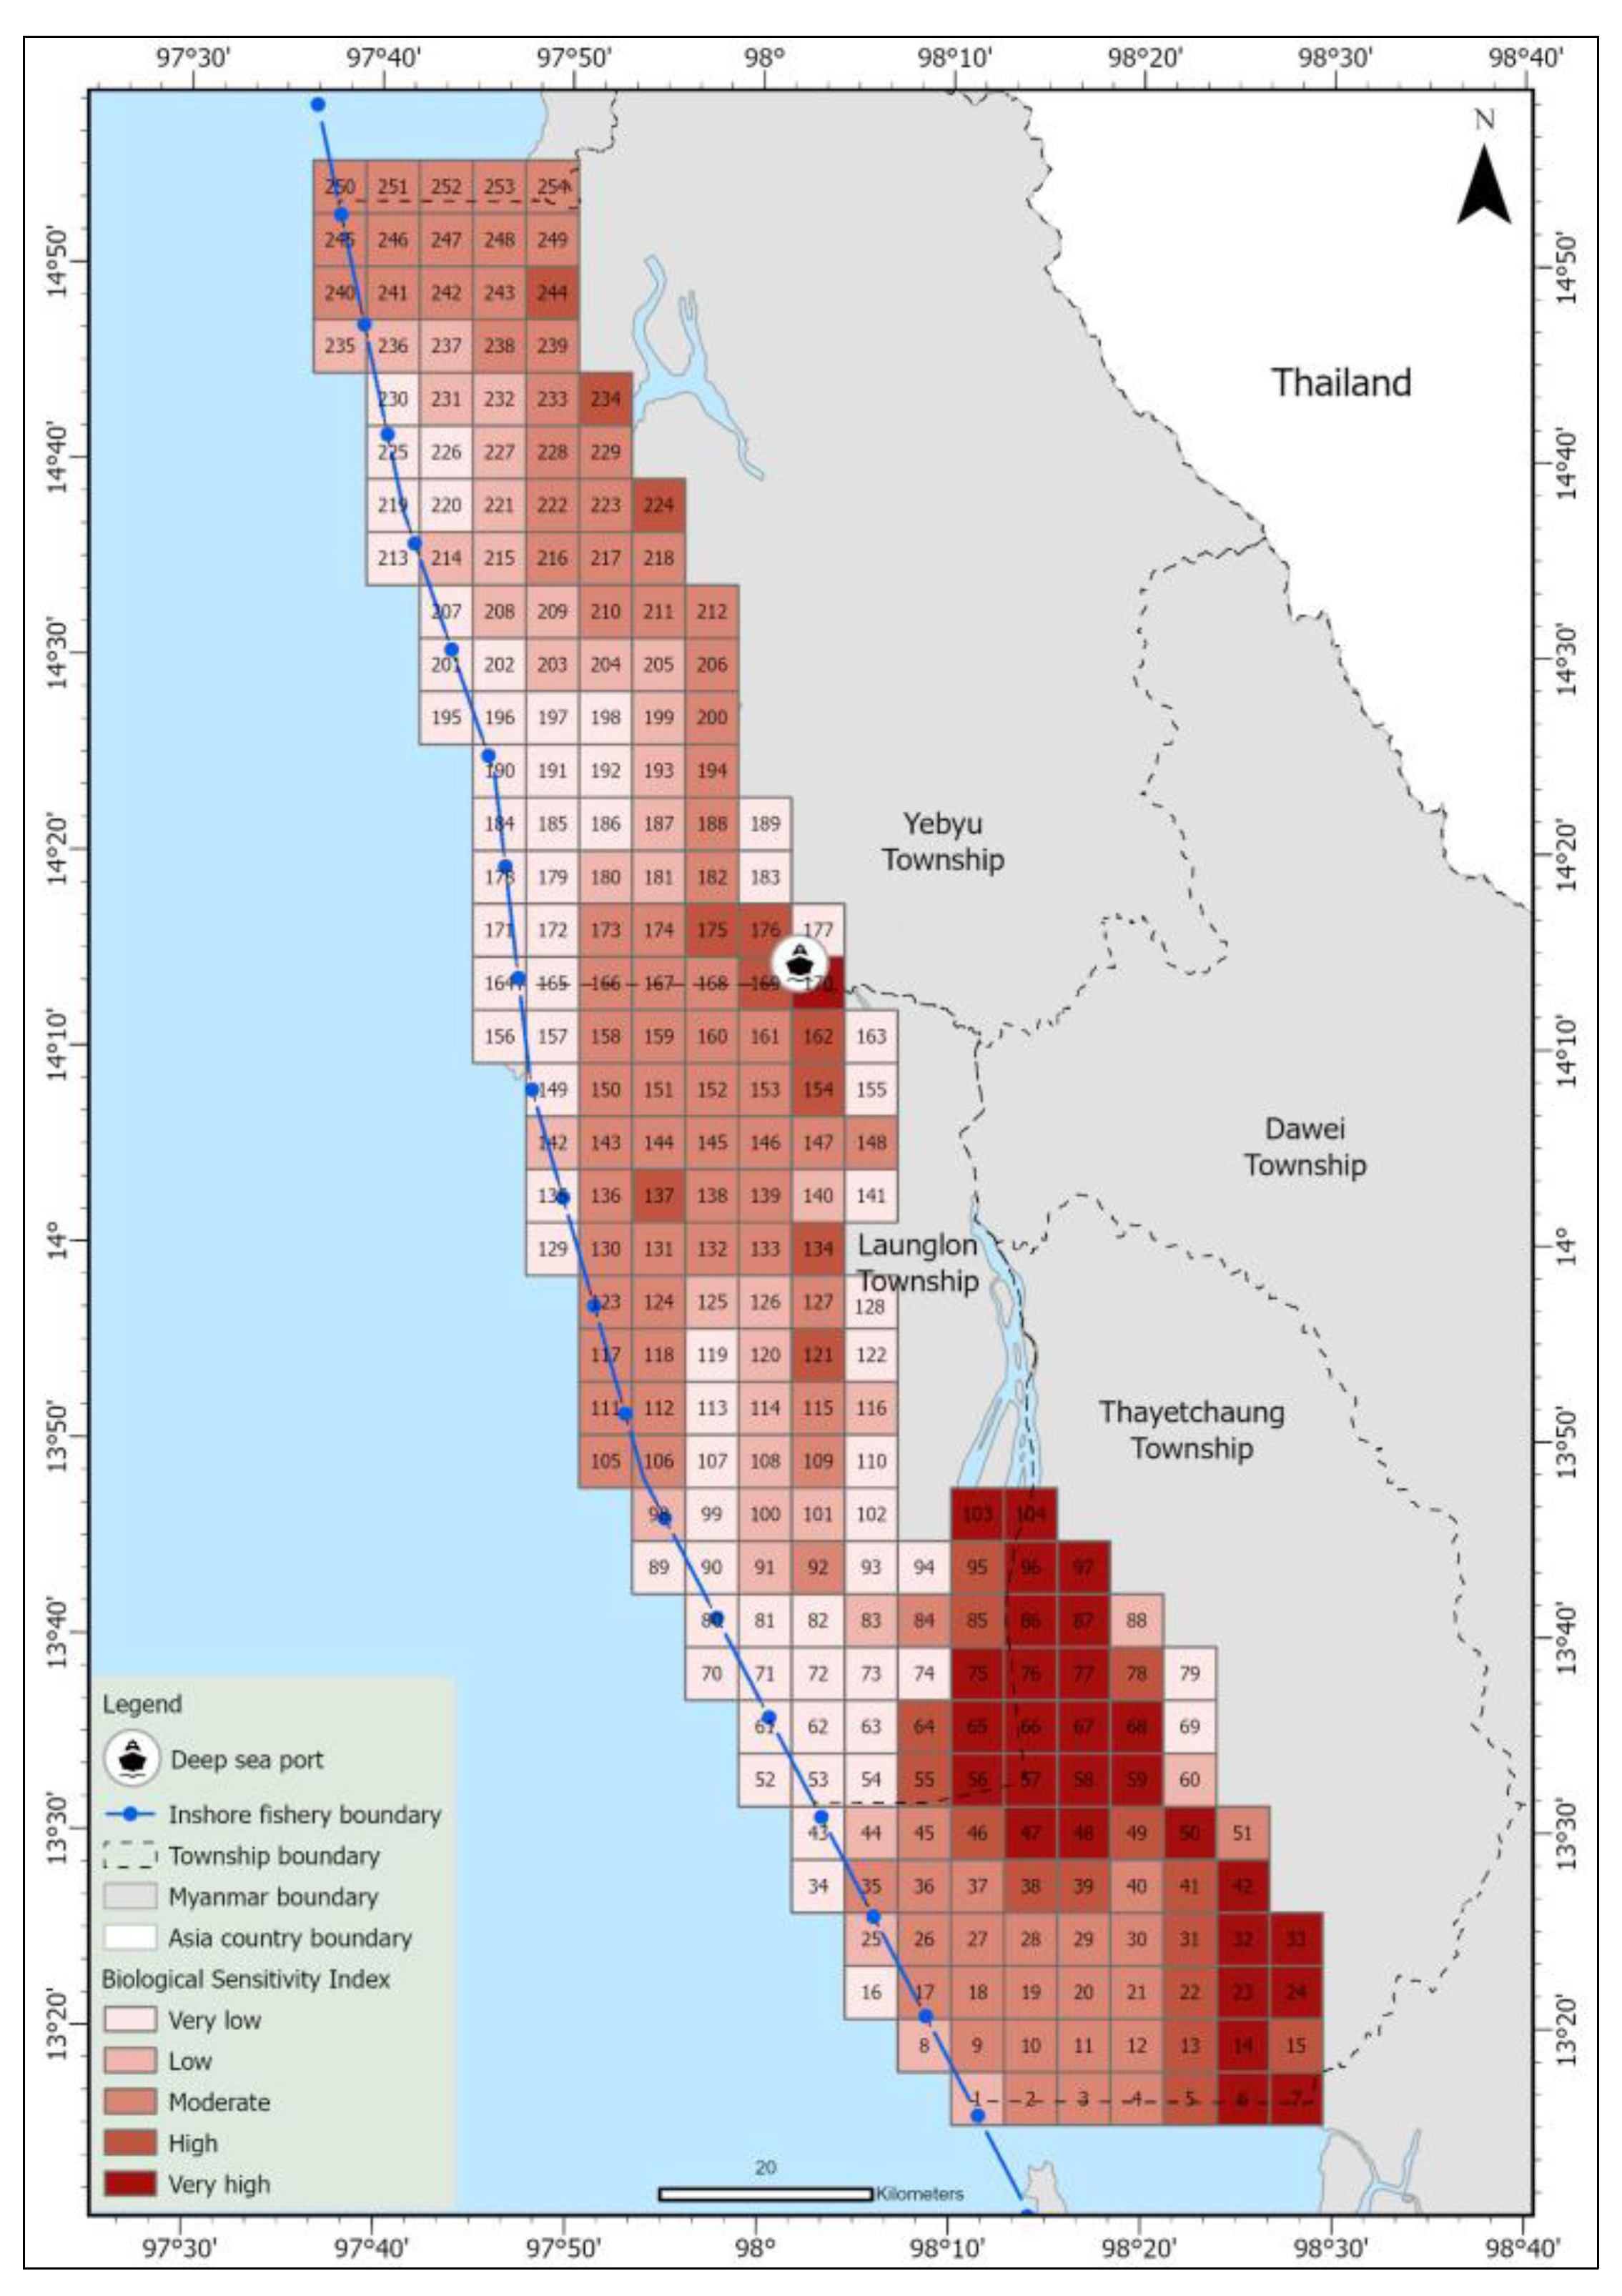
In combination with HI, SI, CAI, and PI, the Biological Sensitivity Index (BSI) is presented in Figure 9. The evaluation results indicated that most spatial grids (37%) were classified as moderately sensitive, while smaller proportions fell into very low (26.4%), low (15%), high (10.2%), and very high (11.4%) categories. Among the grids with very high sensitivity, approximately 83% were concentrated within Thayetchaung Township.
Figure 9. Spatial distribution of Biological Sensitivity Index.

3.4. Spatial Distribution of Socio-Economic Sensitivity Index

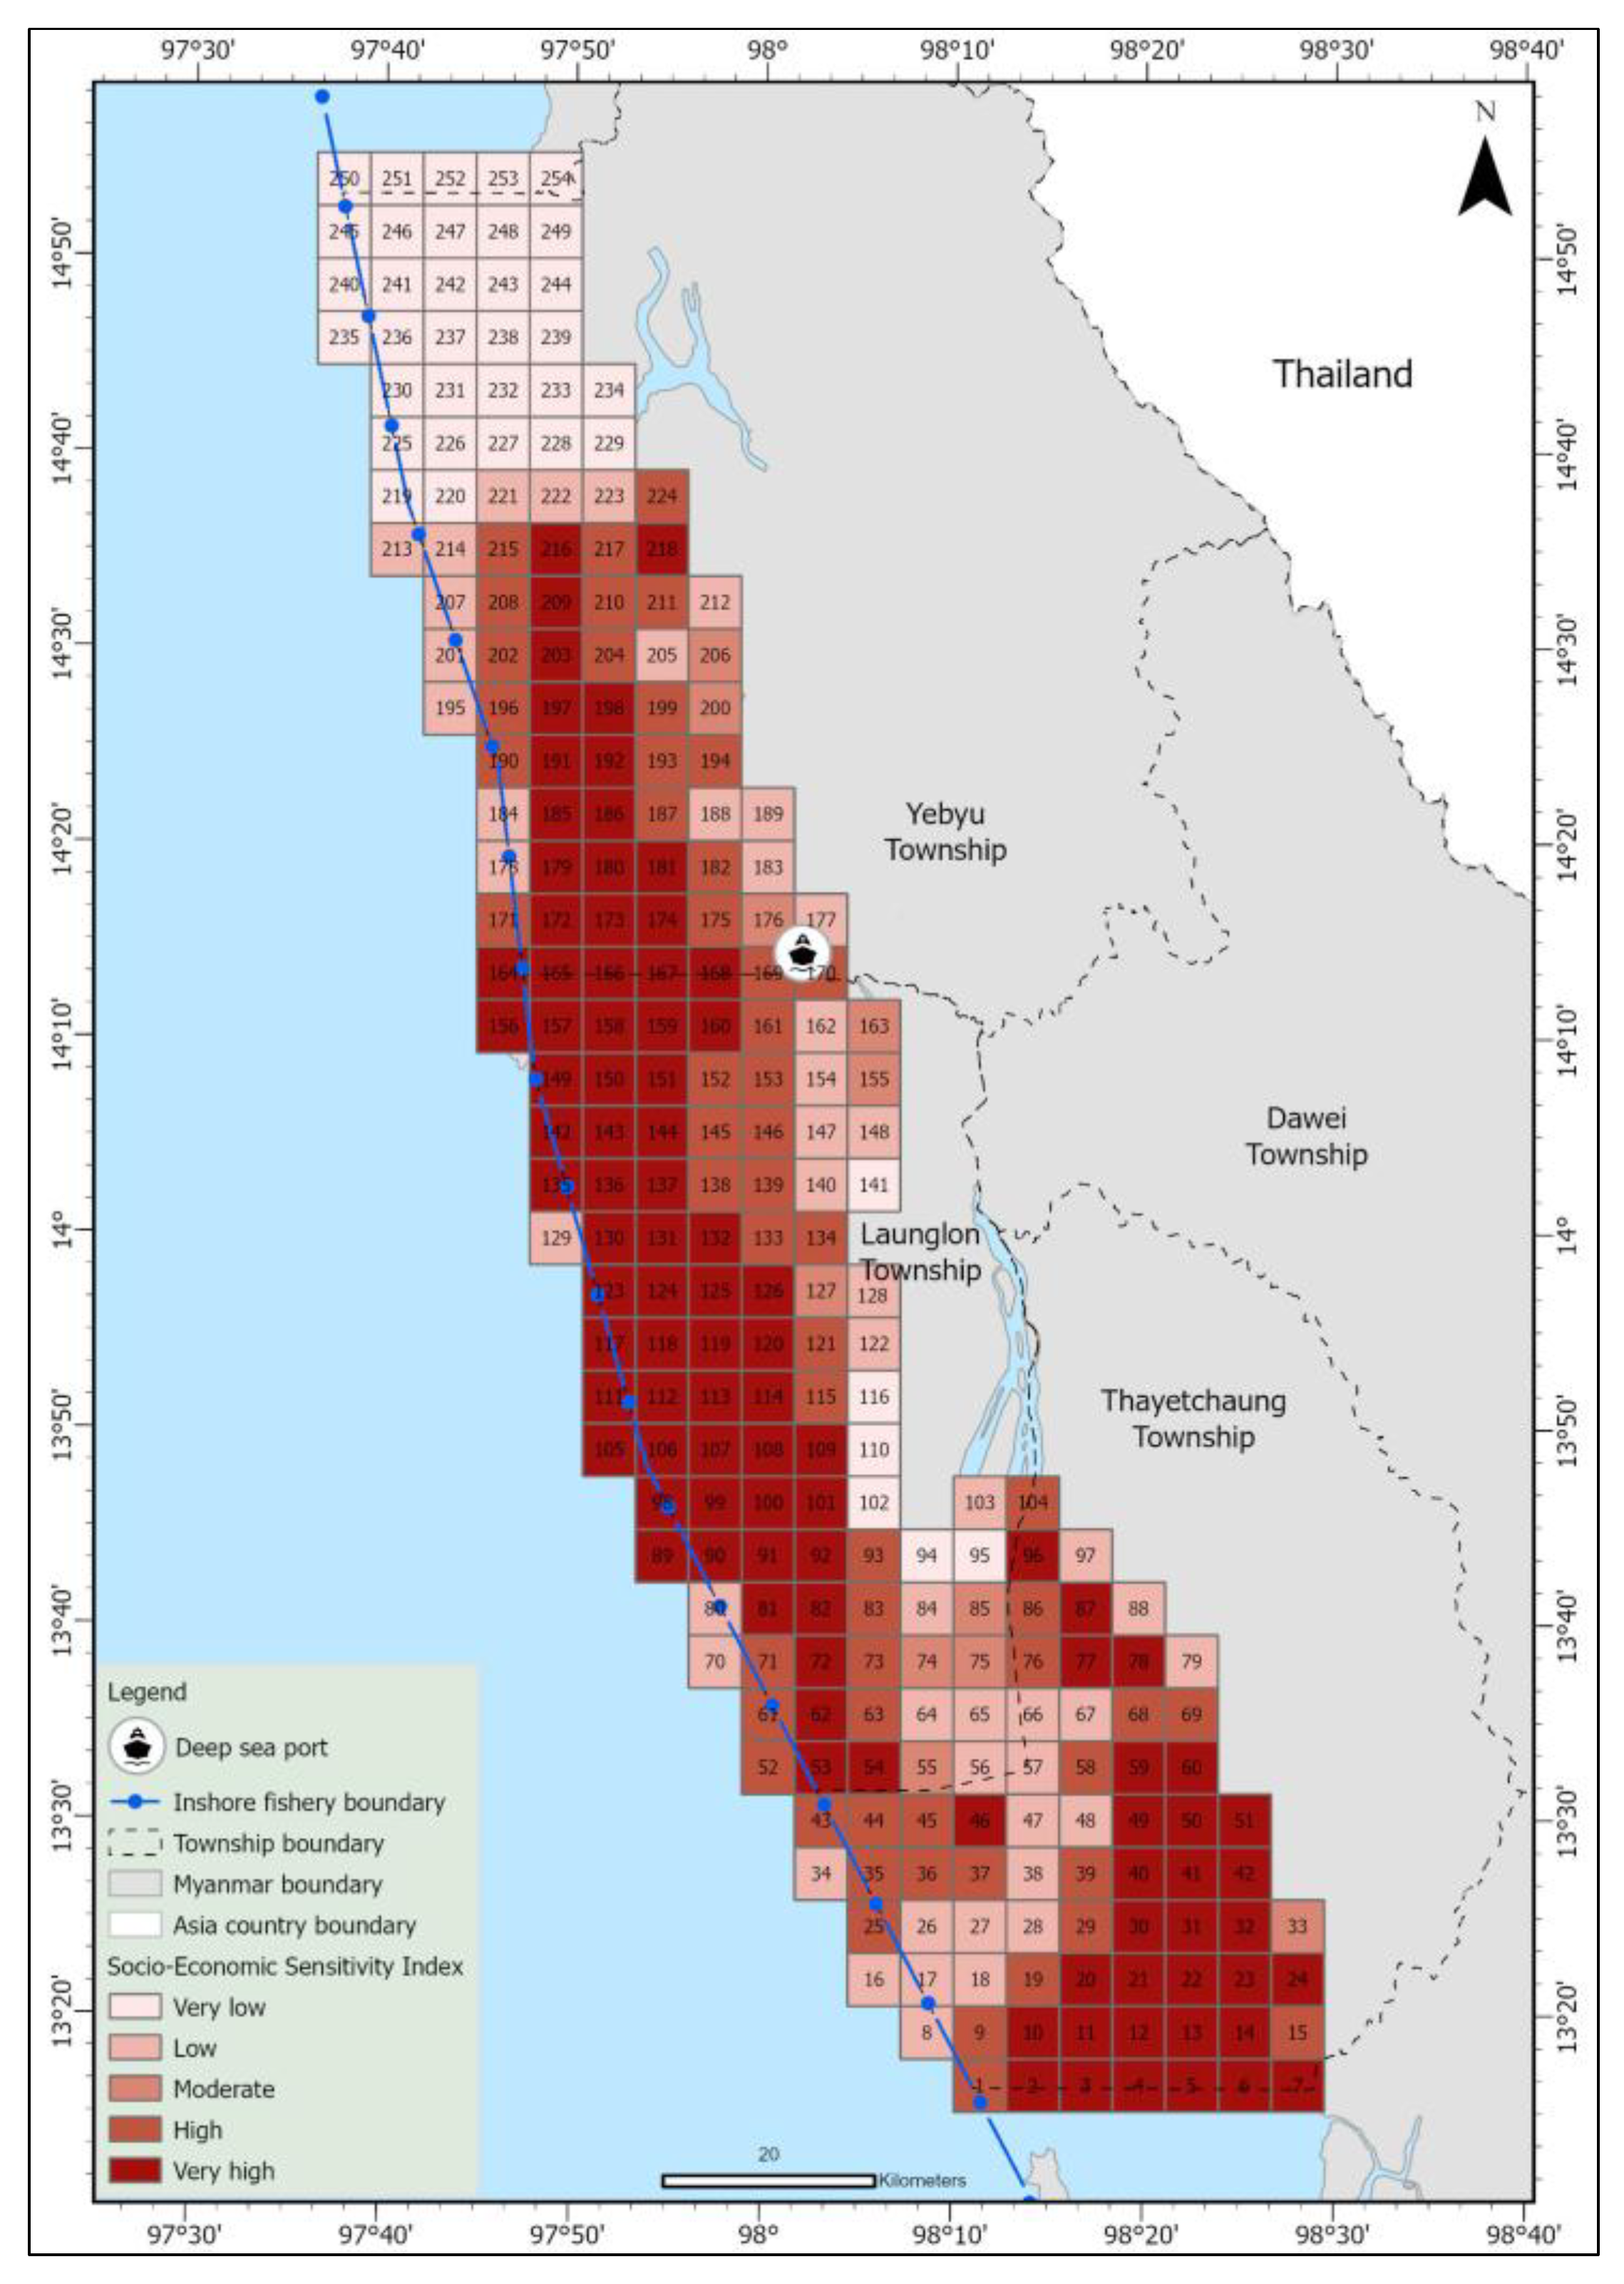
The Socio-Economic Sensitivity Index (SESI), derived from the combination of the beach index (BI) (Figure 10b), fishing ground index (FGI) (Figure 11b), and population index (PI) (Figure 12b), highlights spatial variations across the study area. Figure 10, Figure 11 and Figure 12 illustrate the spatial distribution of human-use features and their corresponding sensitivity indices: beach (Figure 10), fishing ground (Figure 11), and human population (Figure 12). Figure 10a shows that Launglon Township has the largest extent of beach areas, including both existing and potential tourism sites, while Thayetchaung and Yebyu Townships have smaller extents. Figure 11a illustrates the distribution of fishing grounds and their indices based on different fishing gears, with Thayetchaung and Launglon supporting more than six gear types, including bottom-set gill nets, bottom long lines, crab traps, dip nets, drift gill nets, hand lines, squid traps, and trawls. Figure 12a presents coastal population distributions, indicating that Launglon Township has a higher population compared to Thayetchaung and Yebyu.
Figure 10. Spatial distribution of beach (a), and beach sensitivity index (b).
Figure 11. Spatial distribution of fishing ground (a), and fishing ground sensitivity index (b).
Figure 12. Spatial distribution of population (a), and population sensitivity index (b).
After applying the weightings of SESI in Table 6 to (Equation (7)), the results are shown in Figure 13. The analysis of the socio-economic sensitivity index depicted that out of 254 total grid cells, 40% were designated as very high, 22% as high, 4% as moderate, 19% as low, and 15% as very low sensitivity. Among the grids identified as having very high socio-economic sensitivity, nearly half are situated within Launglon Township. This spatial clustering shows that a major contribution fishing area index is more sensitive and intensively distributed in three Townships. These results reflect coastal community dependence on coastal resources [].
Figure 13. Spatial distribution of socio-economic sensitivity index.

3.5. Final Spatial Distribution of Environmental Sensitivity Index

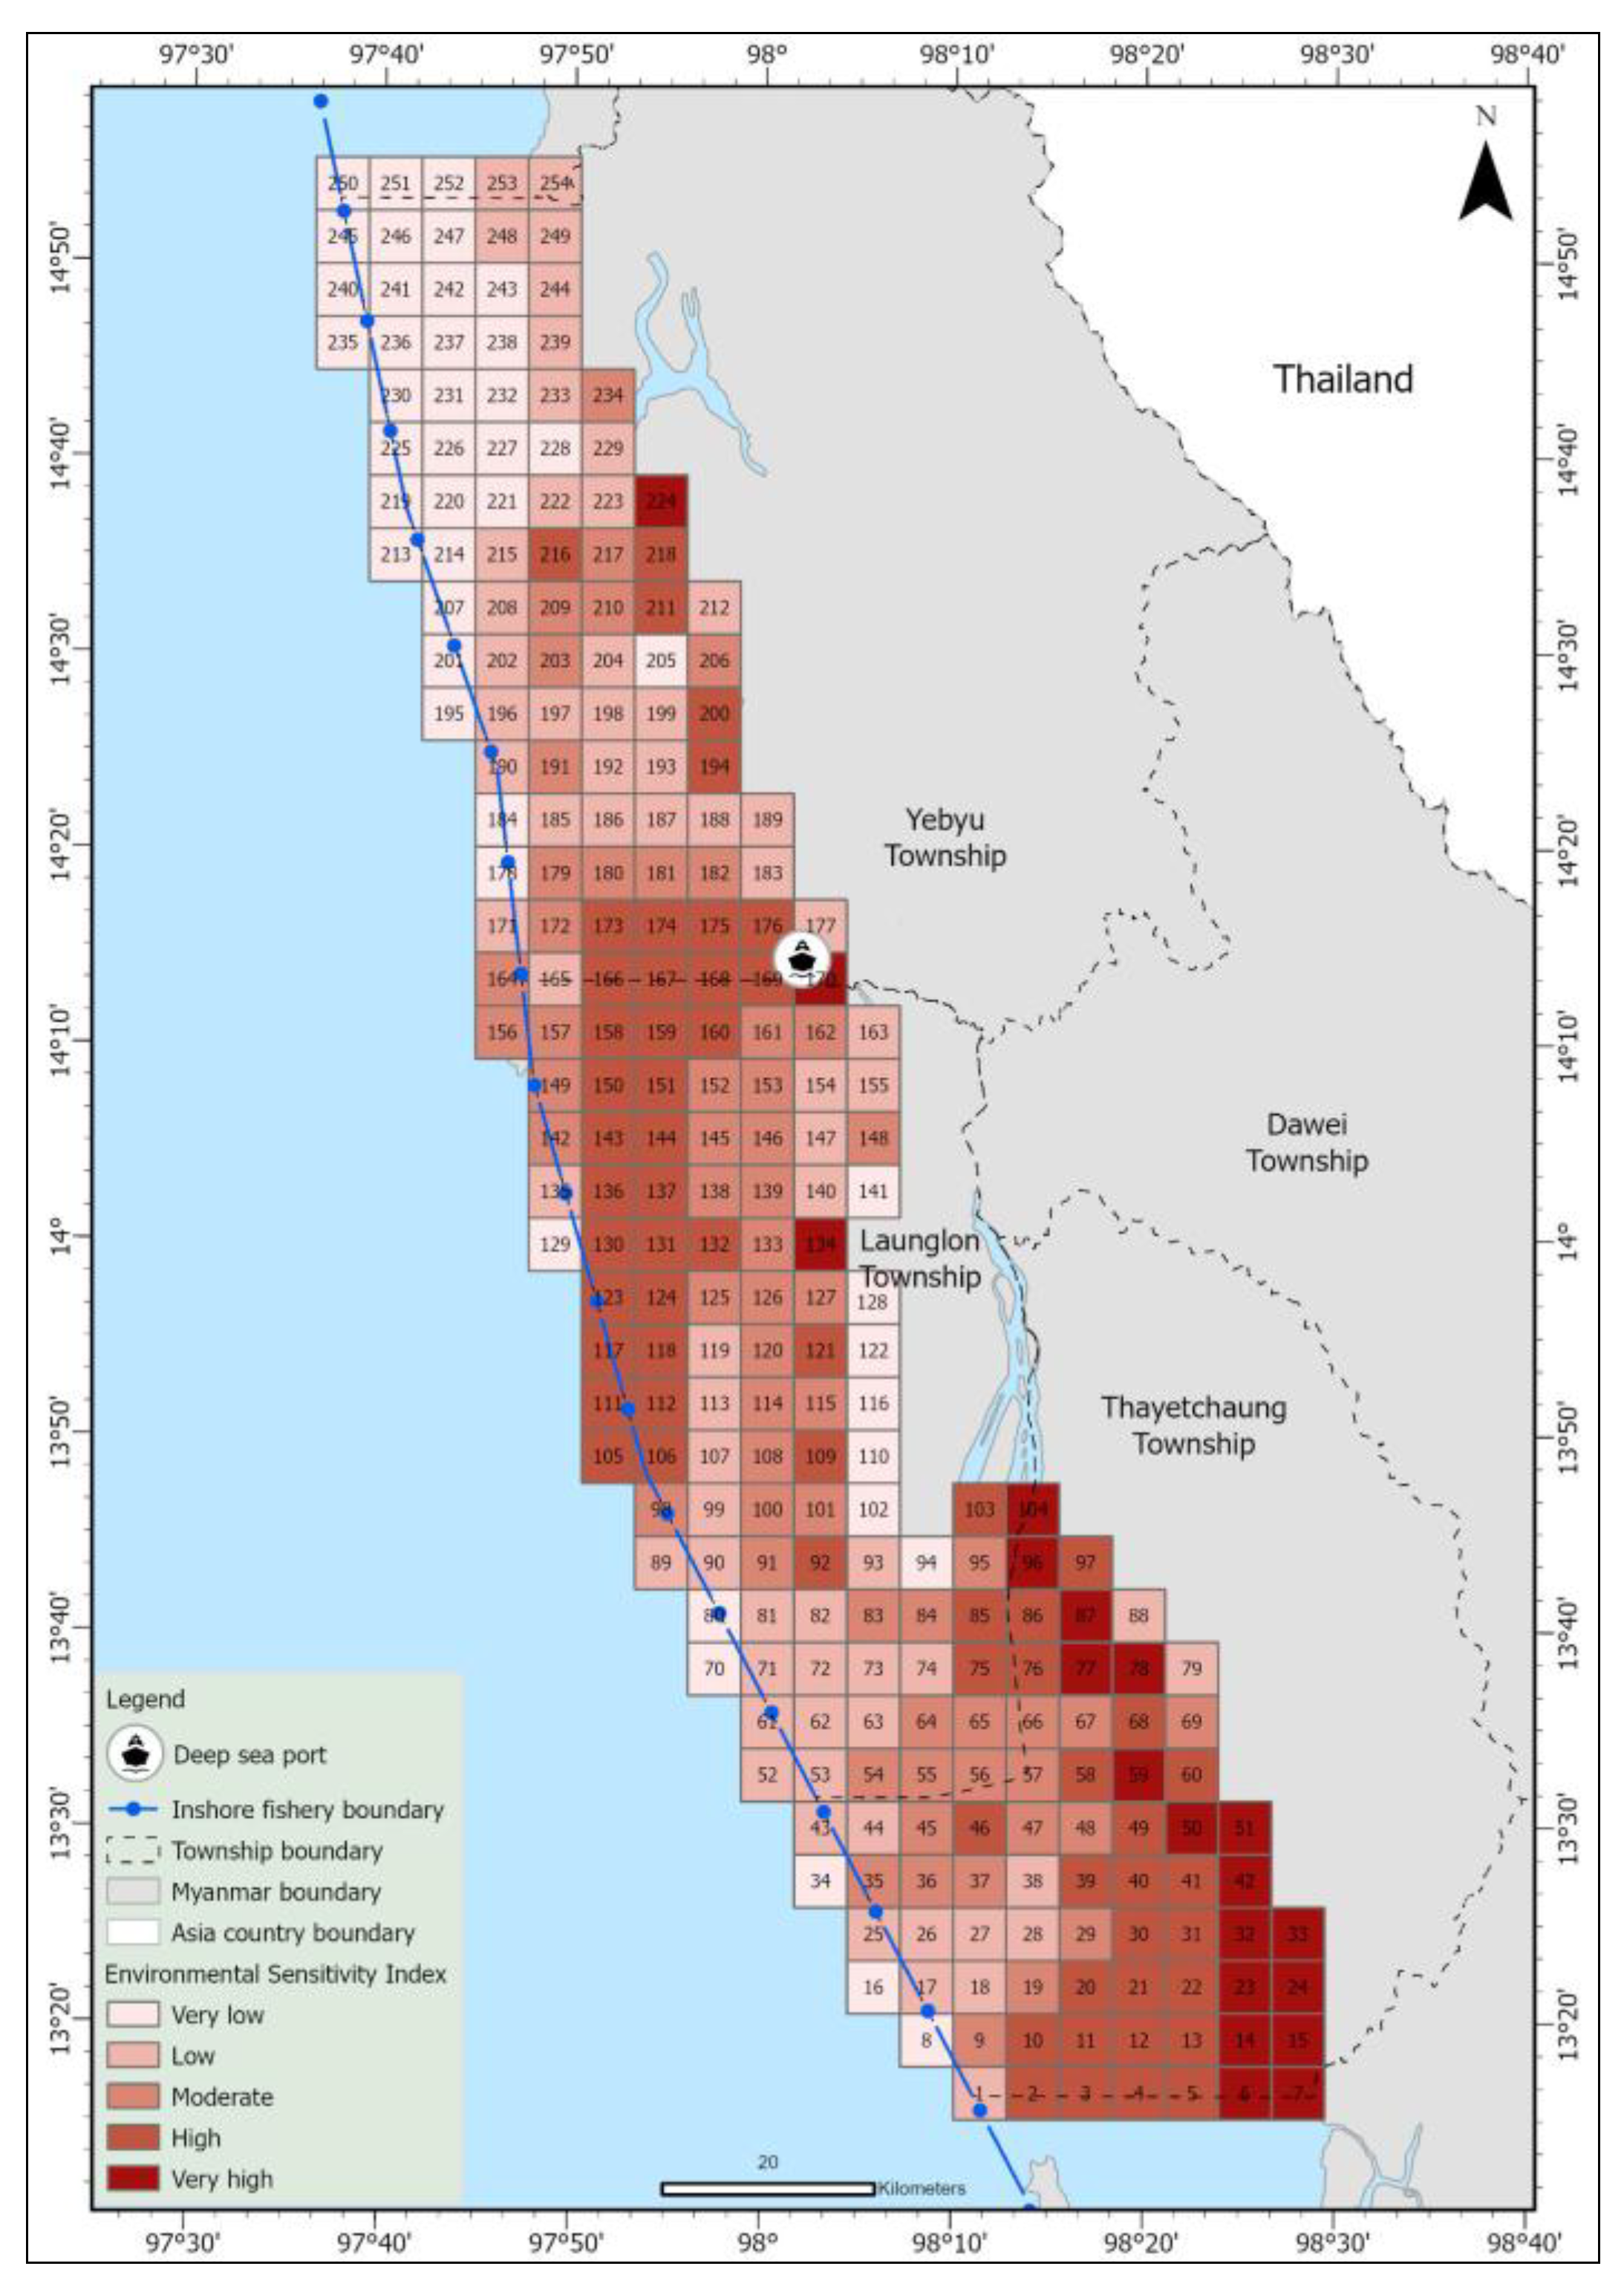
Figure 14 is the final ESI mapping calculated by the combination of PSI, BSI, and SESI using the weighting in Table 6 through the AHP approach. The final ESI analysis of 254 grid cells resulted in the following: very high (8%), high (25%), moderate (23%), low (26%), and very low (18%). Grids with very high sensitivity cover approximately 500 km2. These sensitive grid cells are spatially distributed across the study area from north to south as follows: around 10% (gird IDs: 170, 224) located in Yebyu Township, 5% (grid IDs: 134) in Launglon Township, and 85% (grid IDs = 6, 7, 14, 15, 23, 24, 32, 33, 42, 50, 51, 59, 77, 78, 87, 96, 104) in Thayetchaung Township. Very highly sensitive areas (8%) include dense mangroves, critical habitats for species, and coastal zones supporting resource-dependent fisheries. Highly sensitive areas (25%) were mainly community fishing grounds with moderately important habitats, where oil spills could disrupt local livelihoods and ecological function. Moderately sensitive areas (23%) corresponded to habitats of lower ecological and socio-economic importance, though contamination could still affect ecosystem functions or fisheries. Furthermore, the spatial distribution of very high sensitivity areas was primarily observed along the southern coastline in Thayetchaung Township. In the western inshore areas within Launglon administrative boundary, the high and moderate sensitivity grids were mostly found, while the low and very low sensitivity areas were concentrated in the northern part of the study area in Yebyu Township.
Figure 14. Spatial distribution of Environmental Sensitivity Index of oil spill.

4. Discussion

The varying levels of coastal sensitivity identified in this study reflect the complex interplay between natural vulnerability and human dependence on coastal resources. The concentration of very high sensitivity zones near the ongoing Dawei deep-sea port (within 1 km) and extending 25–120 km along Launglon and Thayetchaung Townships underscores a critical vulnerability: these areas combine low ecological resilience with high socio-economic dependence. The co-location of mangrove habitats, mudflats, and diverse marine species with intensive fishing activities explains why these zones warrant priority attention. Oil contamination in such areas would trigger cascading effects through both ecological and economic systems. Although the port is not yet operational [], the identification of these hotspots demonstrates the value of proactive assessment before industrial activities commence, when prevention strategies can still be optimally designed.
The elevated sensitivity of vegetated shorelines and nearshore habitats stems from their dual role as critical ecological infrastructure and livelihood support systems. Previous studies have shown that such habitats, once contaminated, suffer long-lasting impacts and cause economic losses for fishing communities due to closure of fishing grounds and contamination risk [,,]. Our findings therefore support earlier assessments that identify estuarine and mangrove environments as high priority for oil spill response [,,], but extend this understanding by demonstrating that vulnerability is amplified where ecological sensitivity intersects with high community dependence. By integrating socio-economic factors into the ESI framework, this study contributes to a more comprehensive understanding of vulnerability compared to approaches that focus only on shoreline or biological features [,]. This broader perspective is crucial for local-level response planning because it links ecological damage to tangible livelihood impacts.
The sensitive hotspot areas fall within local authority administrations (Tiers 1 and 2) [,,]. Developing oil spill response plans at this level would minimize impacts at an early stage, ensure cooperation during emergencies, and support protocols to prevent further damage to sensitive areas [,,]. In this way, the study highlighted the importance of proactive risk assessment tools such as ESI mapping to guide resource allocation and prioritize response actions in the most vulnerable zones, thereby ensuring that local authorities and stakeholders are better prepared for ocean health, biodiversity conservation, and coastal resilience.
The methodology was performed as an example for other data-scarce regions with similar environmental challenges [,]. The assessment integrated biological, physical, and socio-economic sensitivity components applying geospatial analysis, offering a holistic framework for assessing coastal sensitivity to oil spills. For the physical component, shoreline classification serves as the foundation for sensitivity assessment []. Previous studies applied various ESI scoring methods [,,]; however, this study adopted the recent NOAA generalized ESI scheme for coding shorelines [], which was more suitable for this study as shoreline types were virtually classified from high-resolution imagery. For the biological component, this research moved beyond simple habitat mapping by incorporating four sub-indices: habitats, species, protected areas, and chlorophyll-a productivity. Biological sensitivity not only considered sensitive habitats such as mangroves, coral reefs, seagrass beds, and mudflats but also integrated species of local importance and community-proposed protected areas. Furthermore, the inclusion of chlorophyll-a as a proxy for ecosystem productivity provides a useful measure of overall marine ecosystem condition [,,], adding an innovative ecological indicator rarely considered in earlier ESI studies. Previous studies [] also suggested incorporating chlorophyll level when assessing sensitivity of oil spill. It is particularly informative for oil spill evaluations because oil films decrease light availability, hinder photosynthetic processes, alter phytoplankton populations, and potentially produce knock-on effects throughout the marine trophic network [,]. For the socio-economic index, fishing grounds, tourism sites, and population density were integrated, representing the direct links between ecological impacts and community livelihoods []. Our approach contrasts with earlier frameworks that primarily focused on ecological conservation priorities [,], because effects on biological variables can indirectly impact socio-economic factors such as fisheries and ecotourism []. This approach also recognizes the dependence of inshore fishing communities on coastal resources, reflecting the evaluation of community-level vulnerabilities.
The combination of ESI with GIS and AHP in this study was employed to overcome the limitations of conventional oil spill sensitivity assessments, which often rely on a single parameter, such as shoreline type []. Representing ESI as spatial data requires converting multiple environmental and socio-economic parameters into a common GIS framework, standardizing them, and integrating them into spatially explicit maps. In this study, physical sensitivity was calculated using a shoreline length-based approach [] and adapted into an area-based framework to assess other factors such as habitats, protected areas, and beaches. Species and fishing ground indices were derived using a presence-count method (1 = present, 0 = absent) following IPIECA’s methodology and previous studies on species occupancy, emphasizing their critical role for prioritizing oil spill response action [,]. The final indices were reclassified using the Natural Breaks (Jenks) method, which provides more statistically robust classification []. Moreover, the analysis incorporated expert-based weighting through the AHP method to reflect local ecological and social contexts, helping to address data limitations []. Although expert knowledge introduces a degree of subjectivity, the AHP method reduced this by ensuring that the logical consistency ratio was maintained below 10% [,,]. The inclusion of AHP strengthens the framework by incorporating expert knowledge on local ecological and socio-economic contexts. In addition, GIS provides the advantage of spatial visualization, allowing decision-makers to identify priority hotspots and allocate resources more effectively. Overall, this integrated method enhances both scientific rigor and practical applicability, providing a robust foundation for oil spill contingency planning, early warning, and coastal management.
This assessment framework directly supports SDG 14 (Life Below Water) by providing tools for multiple targets. The chlorophyll-a productivity indicator specifically addresses Target 14.3 on ocean acidification by establishing baseline ecosystem function, that can reveal productivity losses from pollution and acidification [,]. The integrated sensitivity mapping contributes to Target 14.2 on sustainable management and projection of marine ecosystems by identifying priority areas requiring protection. Furthermore, by linking local oil spill risk assessment to fisheries management and community livelihood, this approach recognizes that local environmental protection actions contribute to global ocean health monitoring and sustainable use strategies (Targets 14.4 and 14.7) []. The framework thus demonstrated how place-based vulnerability assessments can operationalize international sustainability commitments at the local implementation level.

5. Conclusions

This study reveals a comprehensive spatial ESI assessment for the Tanintharyi coastal region of Myanmar, where growing maritime activities, including the Dawei deep-sea port development, pose increasing risks to marine and coastal ecosystems. By integrating physical, socio-economic, and biological sensitivity components through an AHP-based GIS framework, the research demonstrates the spatial distribution of environmental vulnerability to potential oil spills. The output shows that 8% of the grids are classified as very highly sensitive, 25% as highly sensitive, and 23% as moderately sensitive. Moderate to high sensitivity areas were concentrated within specific townships, highlighting priority zones for targeted oil spill contingency planning. Vegetated shorelines and nearshore habitats are highly sensitive due to their dual ecological and livelihood functions, with vulnerability amplified where ecological sensitivity intersects with strong community dependence. These results are consistent with previous coastal vulnerability assessments and demonstrated the effectiveness of combining multi-source datasets within a unified GIS-based assessment framework. These findings will help inform coastal management and policy decisions aimed at balancing development with environmental protection.
Despite attempts to ensure data validity and geospatial relevance, several limitations may affect the accuracy of this analysis. First, temporal inconsistences and differences in spatial scales exist because the datasets were derived from multiple sources collected at different timeframes and resolutions; for example, the species index map may not fully represent the current conditions. Second, seasonally varying variables such as fishing activity and chlorophyll-a concentrations were not included, although they could significantly influence sensitivity []. Third, the AHP approach, while widely accepted for multi-criteria decision-making, is inherently qualitative and dependent on expert judgment. This subjectivity may vary depending on individual interpretation, experience, or familiarity with the local context when assigning weight scores [,]. These limitations highlight the need for more seasonally representative, temporally consistent, and spatially comprehensive datasets in future assessments.
This study represents the first geospatial ESI assessment conducted in the Tanintharyi coastal region and one of the few in Myanmar. By filling a crucial information gap and offering a repeatable procedure, it supports local and national efforts toward environmental protection and sustainable development [,] in Myanmar’s coastal areas. It also provides a scientific foundation for future studies aimed at analyzing oil spill risks under the influence of climate change, rising sea levels, and industrial expansion []. To address these limitations, future work should focus on integrating oil spill trajectory models with the ESI framework to improve risk forecasting, and identify high-priority protection zones through simulating potential spill scenarios [,,]. Such efforts should incorporate multi-temporal depiction of current speed and direction, winds, salinity, and temperature []. These enhancements would enable more localized, dynamic, and effective oil spill contingency planning for Myanmar’s vulnerable coastal regions.

Author Contributions

Conceptualization, Tin Myo Thu, Veeranum Songsom and Thongchai Suteerasak; methodology, Tin Myo Thu, Veeranum Songsom and Thongchai Suteerasak; validation, Veeranum Songsom, Thongchai Suteerasak and Tin Myo Thu; formal analysis, Tin Myo Thu; data curation, Tin Myo Thu and Kyaw Thinn Latt; writing—original draft preparation, Tin Myo Thu; writing—review and editing, Veeranum Songsom and Thongchai Suteerasak. All authors have read and agreed to the published version of the manuscript.

Funding

The ongoing MSc is supported by the PSU-Graduate Studies Scholarship for the Academic Year 2024 (Contract No. PSU_GSS 2567-093), provided by the Graduate Studies Scholarship of Prince of Songkla University, Thailand, and the Faculty of Technology and Environment, Prince of Songkla University, Phuket Campus, Thailand.

Data Availability Statement

Data are available by contacting Tin Myo Thu (tthu@myanmarbiodiversityfund.org).

Acknowledgments

The authors would like to thank the Myanmar Biodiversity Fund (MBF) for providing essential field data, as well as the local experts for their valuable contribution through interview surveys that informed the analysis. We also wish to extend our sincere gratitude to Thaung Htut and Thu Rein from Myanmar Biodiversity Fund; Kyaw Zay Ya, Win Thuya Htut, Aung Htet Oo, Myo Naing Win, and Sar Eh from the Wildlife Conservation Society (Myanmar Program); Naing Htoo from the Rakhine Coastal Region Conservation Association; Sapal Lin from the Dawei Research Association; and Khant Thu, Kyaw Thu Win, Tun Tun Naing, Thein Win, and Win Ko Lat from related governmental departments in Myanmar for their support and contributions.

Conflicts of Interest

The authors declare no conflicts of interest.

Appendix A

Table A1. List of primary- and sub-elements of ESI assessment.
Main
Components
Sub-ComponentsFactorsESI ScoreReferences
BiologicalHabitatCoral reef4[,]
Mangrove5[,,]
Mudflat4[]
Seagrass bed3[,]
Protected areaNational-level protected area5Local expert opinion
Community-proposed conserved area4Local expert opinion
Chlorophyll-a<0.1 mg/m31Local expert opinion
0.1–0.3 mg/m32Local expert opinion
0.3–1.0 mg/m33Local expert opinion
1.0–10.0 mg/m34Local expert opinion
>10.0 mg/m35Local expert opinion
SpeciesDolphin Local expert opinion
Dugong Local expert opinion
Porpoise Local expert opinion
Sea otter Local expert opinion
Whale Local expert opinion
Jungle cat Local expert opinion
Fishing cat Local expert opinion
Monkey Local expert opinion
Pangolin Local expert opinion
Clouded leopard Local expert opinion
Turtle Local expert opinion
Lizard Local expert opinion
Ray Local expert opinion
Shark/Whale shark Local expert opinion
Shore bird Local expert opinion
Socio-
Economic
Fishing groundBottom-set gill net Local expert opinion
Cast net Local expert opinion
Crab trap Local expert opinion
Dip net Local expert opinion
Drift gill net Local expert opinion
Fence net Local expert opinion
Hand line Local expert opinion
Mud crab trap Local expert opinion
One-boat sein Local expert opinion
Squid trap Local expert opinion
Stationary lift net Local expert opinion
Stow net Local expert opinion
Bottom long line Local expert opinion
Trawl Local expert opinion
BeachCurrent/Potential tourism4Local expert opinion
Figure A1. Shoreline type verification in accessible areas.

References

  1. Iskakov, B.; Nurakynov, S.; Dabas, J.; Zhantayev, Z.; Balakay, L.; Dedova, T.; Yelisseyeva, A.; Sydyk, N. Enhancing Environmental Sensitivity and Vulnerability Assessments for Oil Spill Responses in the Caspian Sea. Sustainability 2024, 16, 9566. [Google Scholar] [CrossRef]
  2. Wang, Y.; Du, P.; Liu, B.; Wu, X. Geographic information system-based comprehensive oil spill risk assessment in China’ s Bohai Sea. Front. Mar. Sci. 2023, 10, 1141962. [Google Scholar] [CrossRef]
  3. Venesjärvi, R.; Jolma, A.; Helle, I. Sensitivity index for conservation priority ranking in the oil spill response: A case study for the coastal and marine species and habitat types in the Baltic Sea. Ecotoxicol. Environ. Saf. 2023, 257, 114936. [Google Scholar] [CrossRef] [PubMed]
  4. Adesipo, A.A.; Freese, D.; Nwadinigwe, A.O. Prospects of in-situ remediation of crude oil contaminated lands in Nigeria. Sci. Afr. 2020, 8, e00403. [Google Scholar] [CrossRef]
  5. Zhang, Z.; Sun, H.; Guo, Y. The Impact of Marine Oil Spills on the Ecosystem. Int. J. Eng. Sci. Technol. 2024, 2, 2857–2958. [Google Scholar] [CrossRef]
  6. D’Affonseca, F.M.; Vieira Reis, F.A.G.; Corrêa, C.V.d.S.; Wieczorek, A.; Giordano, L.d.C.; Marques, M.L.; Rodrigues, F.H.; Costa, D.M.; Kolya, A.d.A.; Veiga, V.M.; et al. Environmental sensitivity index maps to manage oil spill risks: A review and perspectives. Ocean Coast. Manag. 2023, 239, 106590. [Google Scholar] [CrossRef]
  7. Palomino, E. SDG 14 Life Below Water. In Actioning the Global Goals for Local Impact; Springer: Singapore, 2020; pp. 229–246. [Google Scholar] [CrossRef]
  8. Zeng, X.; Chen, X.; Zhuang, J. The positive relationship between ocean acidification and pollution. Mar. Pollut. Bull. 2015, 91, 14–21. [Google Scholar] [CrossRef]
  9. Pawar, P.R. Anthropogenic threats to coastal and marine biodiversity: A review. Int. J. Mod. Biol. Res. 2016, 4, 35–45. [Google Scholar]
  10. Hemmati, A.; Amiri, F.; Kouhgardi, E. Environmental sensitivity index mapping for the oil spill at a heavily industrialized area on the Northern Coast of the Persian Gulf. J. Coast. Conserv. 2024, 28, 17. [Google Scholar] [CrossRef]
  11. Onyegeme-Okerenta, B.M.; West, O.L.; Chuku, L.C. Concentration, dietary exposure and human health risk assessment of total petroleum and polycyclic aromatic hydrocarbons in seafood from coastal communities in Rivers State, Nigeria. Sci. Afr. 2022, 16, e01186. [Google Scholar] [CrossRef]
  12. Perairan, J.I.; Perikanan, P.; Gautama, D.A.; Muntasib, E.K.S.H.; Yonvitner, Y. Environmental sensitivity spatial analysis for oil spill mitigation in rote Ndao district waters. DEPIK 2024, 13, 483–493. [Google Scholar] [CrossRef]
  13. Utomo, S.W.; Risdianto, R.K.; Tambunan, R.P.; Hernawan, U. Environmental sensitivity index analysis for coastal protection of oil spill in Fakfak, Papua, Indonesia. Glob. Nest J. 2021, 23, 241–248. [Google Scholar] [CrossRef]
  14. Flores-Medina, P.W.; Sepp-Neves, A.A.; Coppini, G.; Morales-Caselles, C. Strategic environmental sensitivity mapping for oil spill contingency planning in the Peruvian marine-coastal zone. Sci. Total Environ. 2022, 852, 158356. [Google Scholar] [CrossRef] [PubMed]
  15. Zöckler, C.; Aung, C. The Mangroves of Myanmar. In Sabkha Ecosystems; Springer: Cham, Switzerland, 2019; pp. 253–268. [Google Scholar] [CrossRef]
  16. Pe, M. On the Sustainable Management of The Bay of Bengal Large Marine Ecosystem Department of Fisheries Fishing Grounds of Myanmar and Landing Sites Prepared by Myint Pe (National Consultant) General Description of Coastal Area. Marine Ecosystems Living Mari. 2004. Available online: http://www.boblme.org/documentRepository/Nat_Myanmar.pdf (accessed on 12 April 2025).
  17. Zöckler, C.; Delany, S.; Barber, J. Sustainable Coastal Zone Management in Myanmar; ArcCona Ecological Consulting Flora Fauna International: Cambridge, UK, 2013; p. 60. [Google Scholar]
  18. Thein, S.N.S.; Yang, H.L.; Liu, Z.B. Current Situation of Maritime Transport and Logistics in Myanmar. Int. J. Transp. Veh. Eng. 2019, 13, 419–424. [Google Scholar]
  19. Nwe, M.M.M.; Wu, L.; Ikeya, T.; Okayasu, A. Shoreline Change Analysis At Tanintharyi, Myanmar By Land-Water Boundary Detection on Satellite Images. J. Jpn. Soc. Civ. Eng. Ser. B3 Ocean Eng. 2022, 78, I_799–I_804. [Google Scholar] [CrossRef]
  20. Ko Ko Naing, K.T. Challenges Facing Myanmar in Developing A National Contingency Plan for Marine Pollution. Kaos GL Derg. 2020, 8, 147–154. [Google Scholar] [CrossRef]
  21. Saw, T.; Sanda, N.; Hualong, Y. Deep Sea Port Development in Myanmar. J. East China Norm. Univ. (Nat. Sci.) 2019, 2, 2–6. [Google Scholar]
  22. Rutherford, N. Environmental Sensitivity Index (ESI): State of the Program. In Proceedings of the 2024 International Oil Spill Conference (IOSC), New Orleans, LA, USA, 13–16 May 2024; pp. 1–15. [Google Scholar]
  23. IPIECA. Sensitivity Mapping. Sensit. Mapp. Vis. Anal. 2012, 2012, 95–102. [Google Scholar]
  24. Oceanic, N.; Noaa, A.A. Environmental Sensitivity Index Guidelines, Version 4.0; U.S. Department of Commerce: Washington, DC, USA, 2019.
  25. Davidson, M.A. Environmental Sensitivity Index Guidelines, Version 3.0; U.S. Department of Commerce: Washington, DC, USA, 2002.
  26. Sensitivity, E.; Guidelines, I. Environmental Sensitivity Index Guidelines, Version 2.0; U.S. Department of Commerce: Washington, DC, USA, 1997.
  27. Neafie, J.; Albakassova, M.; Bayramov, E. Assessing socio-economic and natural vulnerability to oil spills: A case study of Azerbaijan’s Caspian shoreline. Int. J. Water Resour. Dev. 2024, 41, 152–175. [Google Scholar] [CrossRef]
  28. Jensen, J.R.; Ramsey, E.W.; Holmes, J.M.; Michel, J.E.; Savitsky, B.; Davis, B.A. Environmental sensitivity index (Esi) mapping for oil spills using remote sensing and geographic information system technology. Int. J. Geogr. Inf. Syst. 1990, 4, 181–201. [Google Scholar] [CrossRef]
  29. Recuero Virto, L. A preliminary assessment of the indicators for Sustainable Development Goal (SDG) 14 “Conserve and sustainably use the oceans, seas and marine resources for sustainable development”. Mar. Policy 2018, 98, 47–57. [Google Scholar] [CrossRef]
  30. Wekpe, V.O.; Whitworth, M.; Baily, B. Terrestrial environmental sensitivity index mapping (TESIM) of the coastal areas of the Niger Delta region of Nigeria. Sci. Afr. 2024, 24, e02152. [Google Scholar] [CrossRef]
  31. Sardi, S.S.; Qurban, M.A.; Li, W.; Kadinjappalli, K.P.; Manikandan, P.K.; Hariri, M.M.; Tawabini, B.S.; Khalil, A.B.; El-Askary, H. Assessment of areas environmentally sensitive to oil spills in the western Arabian Gulf, Saudi Arabia, for planning and undertaking an effective response. Mar. Pollut. Bull. 2020, 150, 110588. [Google Scholar] [CrossRef]
  32. Du, Y.; Zhang, X.; Ma, S.; Yao, N. Chlorophyll-a concentration variations in Bohai sea: Impacts of environmental complexity and human activities based on remote sensing technologies. Big Data Res. 2024, 36, 100440. [Google Scholar] [CrossRef]
  33. Huang, H.; Wang, W.; Lv, J.; Liu, Q.; Liu, X.; Xie, S.; Wang, F.; Feng, J. Relationship between Chlorophyll a and Environmental Factors in Lakes Based on the Random Forest Algorithm. Water 2022, 14, 3128. [Google Scholar] [CrossRef]
  34. Franklin, J.B.; Sathish, T.; Vinithkumar, N.V.; Kirubagaran, R. A novel approach to predict chlorophyll-a in coastal-marine ecosystems using multiple linear regression and principal component scores. Mar. Pollut. Bull. 2020, 152, 110902. [Google Scholar] [CrossRef]
  35. Sharma, K.; Shah, G.; Singhal, K.; Soni, V. Comprehensive insights into the impact of oil pollution on the environment. Reg. Stud. Mar. Sci. 2024, 74, 103516. [Google Scholar] [CrossRef]
  36. Fierro, C.; Lloyd, R. Effects of Ocean Acidification on Chlorophyll Content. E-Res. A J. Undergrad. Work. 2014, 1, 6. [Google Scholar]
  37. Miranda, R.J.; Pinto, T.K.O.; Lopes, R.V.R.; Santos, J.W.; Sampaio, C.L.S.; Santos, R.G.; Pereira, P.H.; Cardoso, A.T.; Malhado, A.C.; Ladle, R.J. Oil Spill Disaster in Southwest Atlantic Coast: An Evaluation of Short-Term Effects on Coral Reef Benthic Assemblages. An. Acad. Bras. Cienc. 2022, 94, e20210401. [Google Scholar] [CrossRef]
  38. Aung, T.T. Mangroves in Myanmar. In Mangroves Biodiversity, Livelihoods and Conservation; Springer: Singapore, 2022; pp. 331–371. [Google Scholar] [CrossRef]
  39. Htay, Y.Y.; Htun, S.; Lwin, M.L.; Kyu, T.T. Comparison on the Seagrass Community at the Three Sites Near Dawei, Tanintharyi Region, Myanmar. J. Myanmar Acad. Arts Sci. 2021, XIX, 4B. [Google Scholar]
  40. Reich, D.; Balouskus, R.; McCay, D.F.; Etkin, D.S.; Michel, J.; Lehto, J. An environmental vulnerability model for oil spill risk analyses: Examples from an assessment for the state of Alaska. In Proceedings of the 37th AMOP Technical Seminar on Environmental Contamination and Response, Ottawa, ON, Canada, 5 May 2014; pp. 65–89. [Google Scholar]
  41. Rustandi, Y.; Damar, A.; Rakasiwi, G.; Afandy, A.; Hamdani, A.; Mulyana, D. Environmental sensitivity index mapping as a prevention strategy against oil spill pollution: A case study on the coastal area of South Sumatera Province in Indonesia. In Proceedings of the IOP Conference Series: Earth and Environmental Science, Penang, Malaysia, 9–11 September 2019; Volume 414. [Google Scholar] [CrossRef]
  42. Sekovski, I.; Del, L.; Armaroli, C. Development of a coastal vulnerability index using analytical hierarchy process and application to Ravenna province (Italy). Ocean Coast. Manag. 2020, 183, 104982. [Google Scholar] [CrossRef]
  43. Wang, Y.; Tang, C.; Du, P.; Liu, B.; Li, Y.; Chen, C. Spatial Differentiation Assessment of the Vulnerability of Marine Protected Areas to Oil Spill Stress in the Bohai Sea. J. Mar. Sci. Eng. 2023, 11, 1877. [Google Scholar] [CrossRef]
  44. Li, Q.; Guo, F.; Guan, Y. A GIS-Based Evaluation of Environmental Sensitivity for an Urban Expressway in Shenzhen, China. Engineering 2018, 4, 230–234. [Google Scholar] [CrossRef]
  45. Hernawan, U.; Risdianto, R.K. Oil spill contingency plan (OSCP) by environmental sensitivity index (ESI) analysis at East Barito District, South Barito District and Kapuas District (Tamiang Layang, Buntok and surrounding area), Central Kalimantan Province. In Proceedings of the IOP Conference Series: Earth and Environmental Science, West Java, Indonesia, 17–20 September 2019; Volume 500. [Google Scholar] [CrossRef]
  46. Aarts, G.; Fieberg, J.; Matthiopoulos, J. Comparative interpretation of count, presence-absence and point methods for species distribution models. Methods Ecol. Evol. 2012, 3, 177–187. [Google Scholar] [CrossRef]
  47. Rakasiwi, G.; Damar, A.; Rustandi, Y.; Hermanto Wibowo, A. Environmental sensitivity index assessment algorithm in coastal areas: A method. In Proceedings of the IOP Conference Series: Earth and Environmental Science, Bogor, Indonesia, 12–16 August 2019; Volume 420. [Google Scholar] [CrossRef]
  48. Hu, C.; Feng, L.; Lee, Z.; Franz, B.A.; Bailey, S.W.; Werdell, P.J.; Proctor, C.W. Improving Satellite Global Chlorophyll a Data Products Through Algorithm Refinement and Data Recovery. J. Geophys. Res. Ocean. 2019, 124, 1524–1543. [Google Scholar] [CrossRef]
  49. Saaty, R.W. The analytic hierarchy process-what it is and how it is used. Math. Model. 1987, 9, 161–176. [Google Scholar] [CrossRef]
  50. Forman, E.; Peniwati, K. Aggregating individual judgments and priorities with the Analytic Hierarchy Process. Eur. J. Oper. Res. 1998, 108, 165–169. [Google Scholar] [CrossRef]
  51. Goepel, K.D. AHP Excel Template with Multiple Inputs. 2013. Available online: https://bpmsg.com/wordpress/wp-content/uploads/2012/04/AHPcalc-v2017-03-29.pdf (accessed on 12 April 2025).
  52. Harik, G.; Alameddine, I.; Maroun, R.; Rachid, G.; Bruschi, D.; Astiaso Garcia, D.; El-Fadel, M. Implications of adopting a biodiversity-based vulnerability index versus a shoreline environmental sensitivity index on management and policy planning along coastal areas. J. Environ. Manag. 2017, 187, 187–200. [Google Scholar] [CrossRef] [PubMed]
  53. Rustandi, Y.; Damar, A.; Fahrudin, A.; Rakasiwi, G.; Affandy, A.; Hamdani, A.; Mulyana, D. An approach to environmental sensitivity index study at coastal area toward oil spill accident: A case study on the northern and southern coast of Madura Island. In Proceedings of the IOP Conference Series: Earth and Environmental Science, Bogor, Indonesia, 12–16 August 2019; Volume 420. [Google Scholar] [CrossRef]
  54. Chen, J.; Yang, S.; Li, H.; Zhang, B.; Lv, J. Research on geographical environment unit division based on the method of natural breaks (Jenks). Int. Arch. Photogramm. Remote Sens. Spat. Inf. Sci.—ISPRS Arch. 2013, 40, 47–50. [Google Scholar] [CrossRef]
Disclaimer/Publisher’s Note: The statements, opinions and data contained in all publications are solely those of the individual author(s) and contributor(s) and not of MDPI and/or the editor(s). MDPI and/or the editor(s) disclaim responsibility for any injury to people or property resulting from any ideas, methods, instructions or products referred to in the content.

Article Metrics

Citations

Article Access Statistics

Multiple requests from the same IP address are counted as one view.