1. Introduction
Buildings are among the most fundamental elements of urban environments, and detecting their spatial and temporal changes is of great significance for urban planning, land use management, real estate management, population estimation, and disaster assessment [
1,
2,
3]. With the rapid progress of urbanization, large-scale construction, demolition, and renovation activities have become increasingly frequent, leading to profound impacts on the spatial structure and sustainable management of cities [
2,
4,
5]. Therefore, accurate and efficient urban building change detection (UBCD) has become a crucial task in the fields of remote sensing and geospatial information science.
Traditional building change detection methods primarily rely on bi-temporal 2D very high-resolution (VHR) imagery, such as IKONOS, WorldView, or GeoEye data [
6,
7]. Although these approaches can capture surface changes, they often fail to adequately represent vertical variations, façade modifications, and structural transformations. In high-density urban areas, factors such as occlusions, cast shadows, and spectral similarity between buildings and surrounding objects further limit the accuracy and robustness of 2D-based approaches [
8,
9].
The emergence of oblique photogrammetry has provided new opportunities for 3D urban monitoring. By capturing multi-angle views, oblique imagery enables the reconstruction of city-scale 3D models, combining digital surface models (DSM), normalized differential normalized DSM (dnDSM), and digital orthophoto maps (DOM) to represent both horizontal and vertical building structures. This paradigm shift allows more precise identification of urban changes, such as rooftop expansion, façade reconstruction, and illegal height modifications [
10,
11,
12]. Nevertheless, oblique photogrammetry-based change detection still faces critical challenges: (i) multi-temporal images often exhibit radiometric inconsistency and registration errors, leading to false alarms [
13]; (ii) elevation-based indicators are sensitive to vegetation and low-rise structures, causing spectral and geometric confusion [
14,
15]; and (iii) existing deep learning models are rarely tailored for 3D structural changes, resulting in suboptimal performance in complex urban environments [
16,
17].
In recent years, deep learning (DL) has demonstrated remarkable capability in remote sensing change detection tasks, particularly with the introduction of Siamese architectures, attention mechanisms, and lightweight designs [
18,
19,
20,
21,
22]. Compared with traditional handcrafted approaches, DL-based methods such as CNNs and FCNs provide strong feature extraction ability for building detection and change detection [
17,
23,
24]. While recent studies have started to incorporate multi-source cues, the majority of DL-based change detection pipelines still rely predominantly on bi-temporal RGB imagery. The integration of DSM-derived elevation information and vegetation indices such as NDVI remains comparatively rare, even though these modalities provide valuable insights into 3D urban dynamics [
25,
26]. In particular, only a few works have leveraged normalized DSM differences (e.g., robust nDSM differencing for 3D co-segmentation [
25]), yet their explicit incorporation into end-to-end deep learning frameworks is far from common. This gap highlights the potential of approaches that embed geometric priors more directly into network feature learning.
To bridge these limitations, we propose DDDMNet, a lightweight deep learning framework that jointly leverages DSM, dnDSM, DOM, and NDVI through multi-source fusion and a DSM Difference Normalization Module (DDDM). The multi-source fusion enhances the network’s ability to distinguish geometric and spectral change patterns, while DDDM explicitly normalizes elevation differences and suppresses noise from vegetation and surface mismatch, enabling sensitivity to height-based structural variations such as rooftop extensions and new constructions. Built upon a TinyCD backbone [
27], DDDMNet achieves accurate and efficient change detection with low computational cost.
Extensive experiments on three benchmark datasets (DSIFN, LEVIR-CD, WHU-CD) demonstrate that DDDMNet consistently surpasses lightweight CNN and attention-based baselines, achieving F1-score > 93% and Overall Accuracy (OA) > 99%, with ablation analysis showing that removing multi-source fusion, DDDM, dnDSM, or morphological refinement causes clear performance drops—for example, removing DDDM lowers the Intersection over Union from 88.12% to 74.62%, highlighting the essential role of the model’s components.
The main contributions of this work are threefold:
- (1)
We construct a multi-source fusion framework that combines geometric, spectral, and environmental features to enhance the representation of diverse building changes.
- (2)
We design a novel DSM Difference Normalization Module (DDDM) and embed it into a lightweight TinyCD network [
27], improving sensitivity to 3D structural variations while reducing computational cost.
- (3)
We conduct comprehensive experiments and ablation studies on three public datasets, demonstrating the robustness, accuracy, and deployment feasibility of DDDMNet in dense and heterogeneous urban environments.
2. Literature Review
Remote sensing change detection has evolved from traditional handcrafted features to modern deep learning (DL) pipelines. Early studies relied on spectral indices, texture operators, or object-based approaches, which often struggled with illumination variations and complex urban backgrounds. The advent of convolutional neural networks (CNNs) and fully convolutional architectures enabled end-to-end change detection, offering stronger feature representation and better generalization across diverse scenes [
28].
Among deep learning approaches, Siamese architectures have become a cornerstone due to their ability to explicitly model temporal differences between bi-temporal images. For example, the Dual-Task Constrained Deep Siamese Convolutional Network (DTCDSCN) jointly optimized change detection and building segmentation tasks, thereby improving structural integrity and boundary accuracy [
22]. Similarly, SNUNet-CD introduced densely connected Siamese encoders combined with multi-scale skip connections, achieving robust performance on very high-resolution (VHR) imagery [
29]. To address efficiency, the recently proposed TinyCD framework emphasized lightweight design, striking a balance between accuracy and computational cost by using compact U-Net-like structures and efficient attention mechanisms [
27]. These works collectively demonstrate that Siamese designs, often enhanced with multi-task or lightweight strategies, provide a strong foundation for urban change detection.
Beyond Siamese CNNs, attention mechanisms and Transformer-based models have further advanced the field. Chen and Shi [
30] introduced a spatial–temporal attention network (STANet) that explicitly models cross-temporal dependencies, significantly improving performance on benchmark datasets such as LEVIR-CD. Building upon this idea, the BIT model incorporated Transformer blocks into the Siamese framework, capturing long-range semantic relationships that CNNs often overlook [
31]. More recently, ChangeFormer extended this line of work with a hierarchical Transformer encoder and MLP decoder, demonstrating the effectiveness of global context modeling in complex urban scenarios [
32]. These studies mark a paradigm shift from purely convolutional models toward architectures capable of learning long-range temporal and spatial interactions.
In parallel, deep supervision and feature fusion have been explored to address the limitations of single-layer feature differencing. Zhang et al. [
33] proposed the Image Fusion Network (IFN), which integrates deeply supervised signals at multiple scales, leading to improved boundary refinement and detection stability. EGDE-Net further introduced edge guidance and differential enhancement modules to boost sensitivity to subtle building boundaries [
34], while HDANet exploited feature difference attention to highlight change-sensitive regions without sacrificing spatial resolution [
35]. Such approaches underline the importance of fusing multi-scale differences and incorporating auxiliary supervision for fine-grained urban change detection.
Another active line of research focuses on multi-source and 3D cues, which are particularly relevant for urban environments. While most deep models rely on bi-temporal RGB imagery, studies have shown that incorporating elevation information or 3D priors can significantly reduce spectral confusion. Wang et al. [
25] introduced a 3D co-segmentation framework leveraging stereo satellite imagery, enabling joint modeling of spectral and elevation changes. Similarly, the Onera Satellite Change Detection (OSCD) dataset [
36] has promoted the evaluation of multi-spectral and multi-source approaches, emphasizing the role of geometric information in robust change detection. Despite these advances, explicit integration of normalized DSM differences (dnDSM) into end-to-end DL frameworks remains relatively rare, leaving room for methods that inject geometric priors more directly into feature learning.
Finally, weakly supervised and low-annotation paradigms are emerging as practical solutions to the scarcity of annotated bi-temporal datasets. ChangeStar [
37] introduced a novel single-temporal supervision paradigm, training change detectors using non-paired single-date annotations. Seo et al. [
38] proposed Self-Pair, synthesizing artificial changes from single-source images to reduce annotation costs. In addition, Hong et al. [
39] developed a Transformer-based multi-task framework that simultaneously performs building extraction and change detection, leveraging shared feature representations to improve performance and data efficiency. These efforts highlight the growing interest in reducing data dependence while maintaining high performance in complex scenarios.
Existing change detection pipelines can be broadly grouped into: (i) CNN- or Siamese-based models for bi-temporal differencing, (ii) attention- and Transformer-based architectures that learn long-range temporal associations, (iii) fusion and deep supervision strategies that enhance boundary refinement, (iv) geometric-aware methods incorporating DSM or 3D priors, and (v) weakly supervised frameworks that reduce annotation requirements.
Within geometric-aware methods, Wang et al. [
25] use DSM differencing in a 3D co-segmentation framework, but the approach is not end-to-end and lacks multi-source temporal fusion. Daudt et al. [
36] introduce DSM into OSCD as an auxiliary channel, yet without explicitly normalizing elevation differences, causing sensitivity to absolute height variations. Meanwhile, mainstream deep models such as STANet [
30], BIT [
31], and ChangeFormer [
32] rely solely on RGB data and therefore lack geometric constraints.
In light of these limitations, we propose DDDMNet, which embeds a DSM Difference Normalization Module (DDDM) into a lightweight Siamese backbone. By pairing mean-normalized dnDSM with DOM and NDVI, the network learns explicit geometric–spectral interactions while maintaining low computational cost, making it suitable for both accuracy-critical and resource-constrained deployment scenarios.
3. Methodology
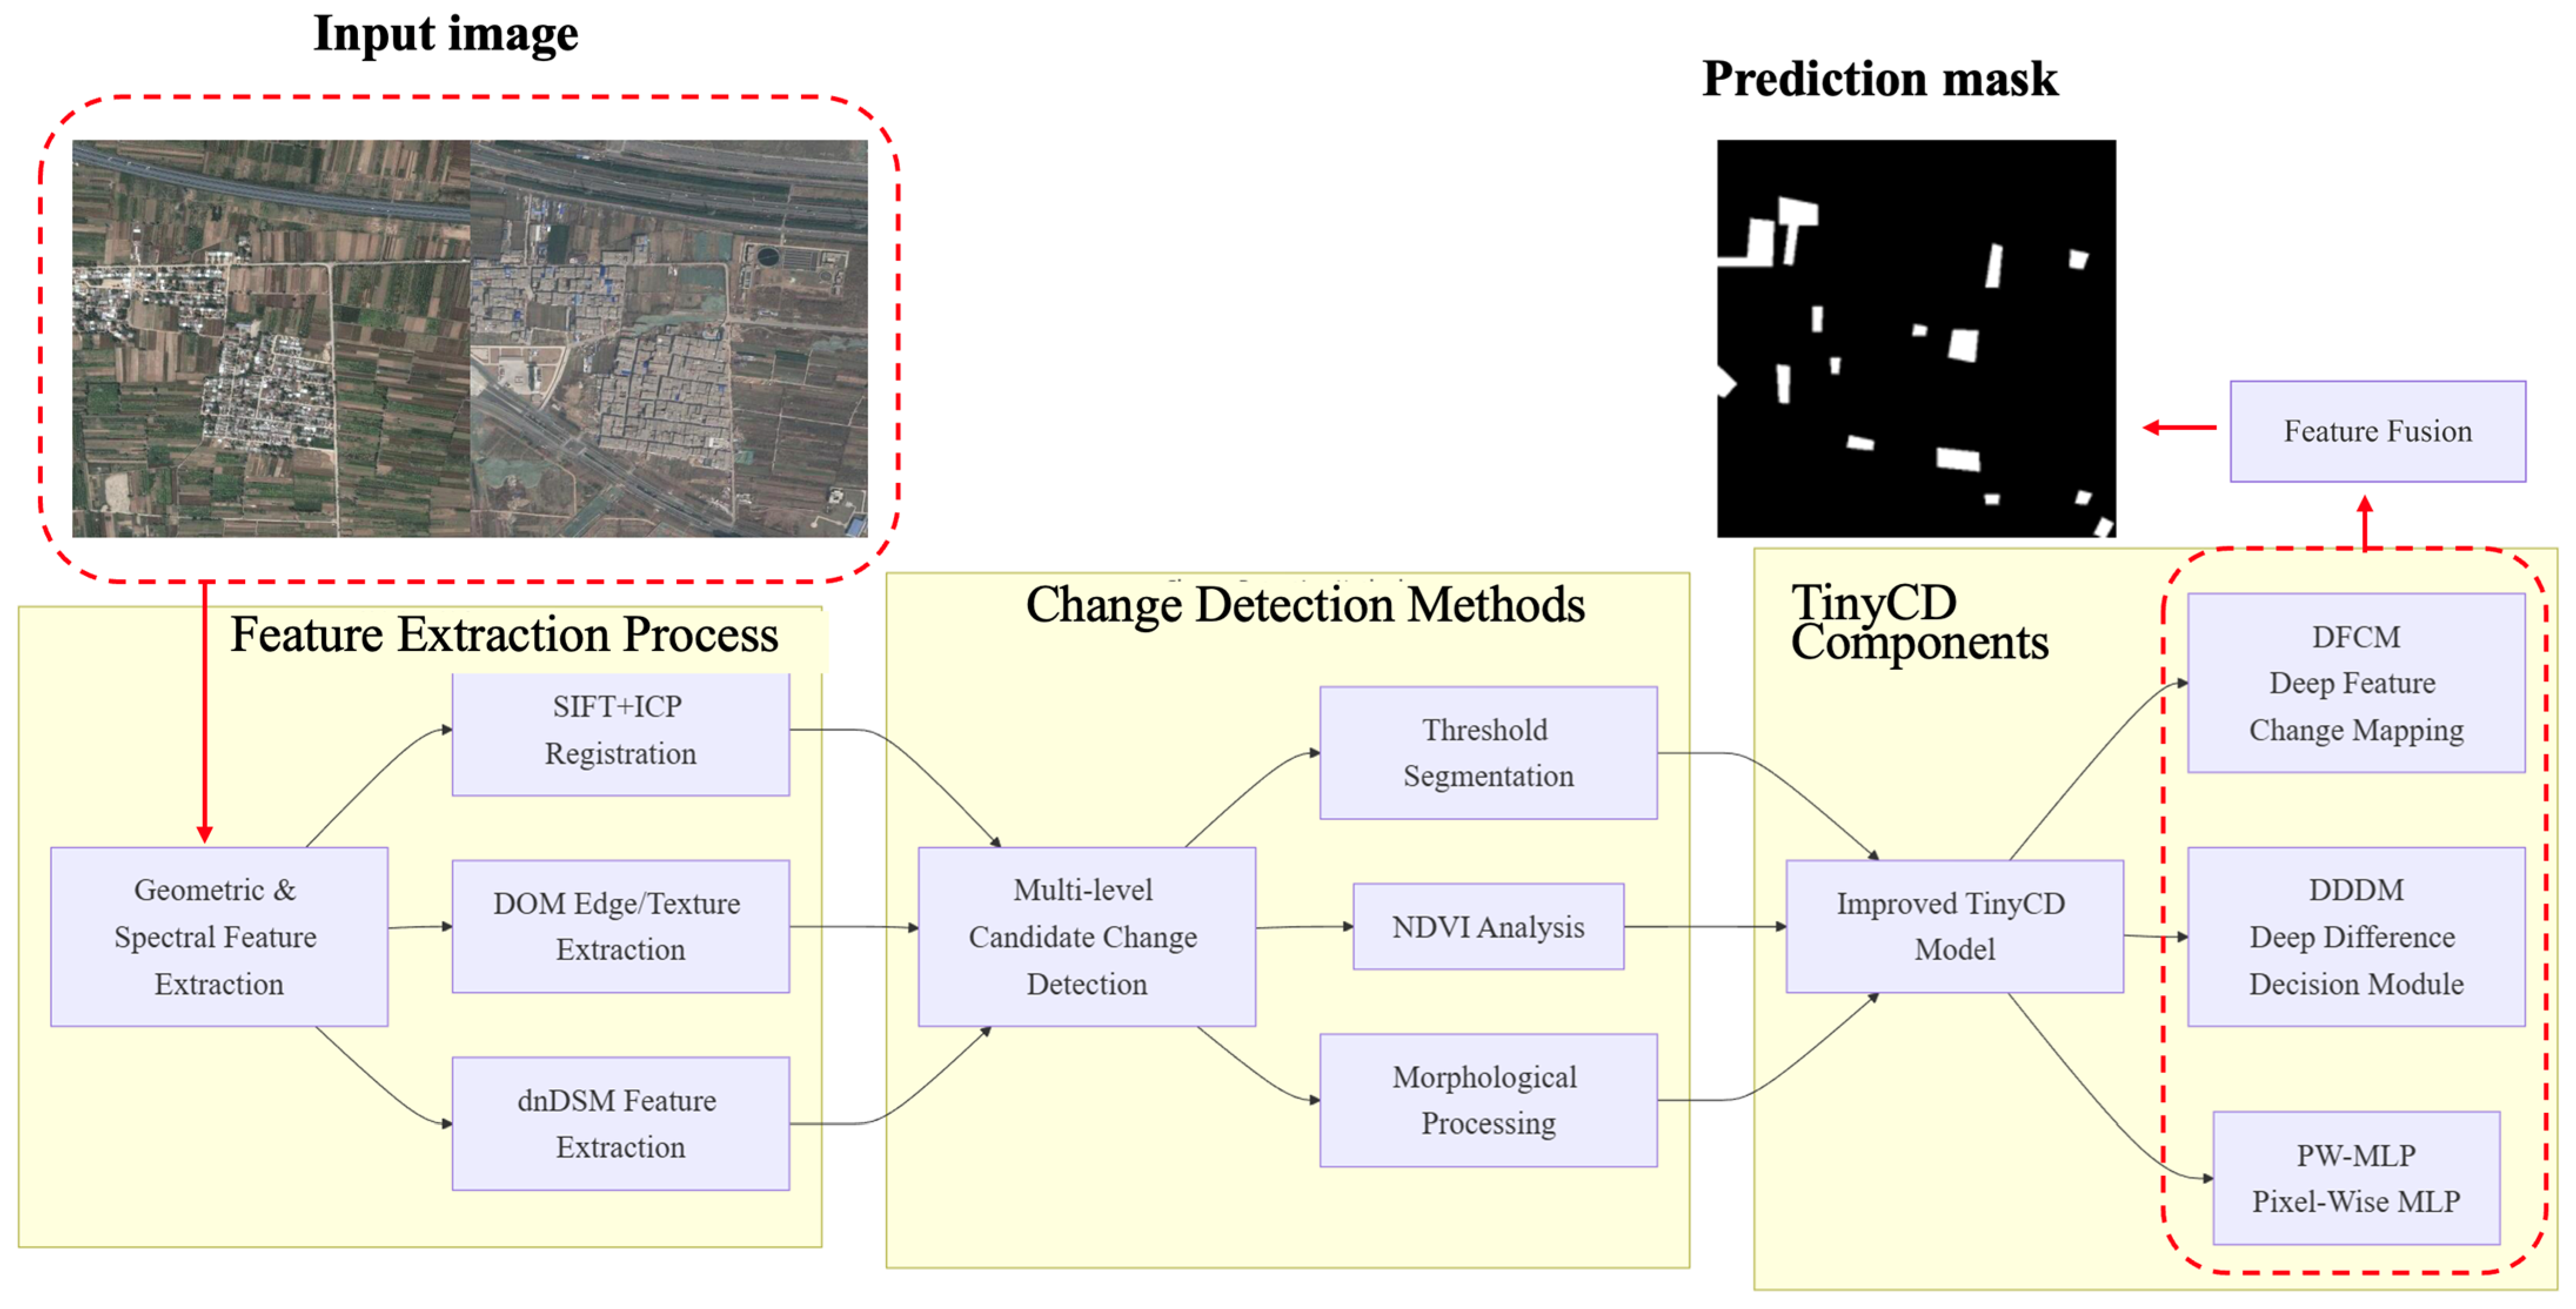
The proposed DDDMNet framework is designed to achieve accurate and robust building change detection from UAV-based oblique photogrammetry. Given multi-temporal inputs consisting of geometric data (DSM and dnDSM) and spectral/texture data (DOM), the network produces a pixel-wise change map that highlights newly constructed or demolished buildings. The overall process framework is shown in
Figure 1. To address the challenges of elevation inconsistency, spectral ambiguity, and complex urban environments, the workflow is organized into three major stages.
- (1)
Geometric and spectral feature extraction: DSM, dnDSM, and DOM are preprocessed and aligned through a coarse-to-fine registration strategy, ensuring spatial consistency across epochs.
- (2)
Multi-level candidate change detection: preliminary candidate regions are identified based on elevation thresholds, refined by vegetation index (NDVI) filtering and morphological operations, which effectively suppress false alarms.
- (3)
Improved TinyCD backbone: a lightweight neural network architecture is enhanced with the proposed DSM Difference Normalization Module (DDDM) to fuse geometric and spectral cues, achieving high-accuracy change detection with reduced computational cost.
This hierarchical design allows low-level geometric and spectral features to be fused with structural priors, while high-level learning modules ensure robustness and generalization. In the following subsections, we elaborate on each stage in detail.
3.1. Geometric and Spectral Feature Extraction
To ensure that both geometric and spectral variations of buildings are faithfully captured, the proposed framework leverages three complementary components: DSM/dnDSM for elevation-based geometry, DOM for spectral and texture cues, and a registration module to enforce spatial alignment across epochs. Together, these components provide the fundamental inputs for robust change detection.
3.1.1. DSM and dnDSM
Digital Surface Models (DSM) play a critical role in extracting geometric attributes of buildings, such as height, slope, and volumetric characteristics. To highlight areas of vertical change, a differential DSM (dDSM) is obtained by subtracting the DSM of an earlier epoch from that of a later one:
However, raw elevation differences may still contain bias caused by terrain undulations or systematic variations. To eliminate such effects and achieve scale invariance, the differential DSM is further normalized by the average elevation of the region:
where
denotes the average elevation of the region. In the resulting dnDSM image, positive values indicate new construction or vertical increases in buildings, while negative values highlight demolished or reduced structures [
25]. This normalized representation effectively emphasizes structural variations while suppressing irrelevant terrain fluctuations.
3.1.2. DOM Edge and Texture Features
Although DSM effectively reflects vertical structural changes, it lacks detailed boundary information. The Digital Orthophoto Map (DOM) complements DSM by providing abundant spectral and textural information, which is particularly valuable for delineating building roof boundaries [
26]. To enhance structural cues, the DOM is first smoothed to reduce noise, and the gradient magnitude and orientation are calculated:
Based on these measures, Canny edge detection with non-maximum suppression delineates roof contours. To preserve both global shape and fine details, wavelet decomposition is further applied, splitting the image into low-frequency sub-bands
and high-frequency sub-bands
. A multi-scale feature vector is then constructed [
26]:
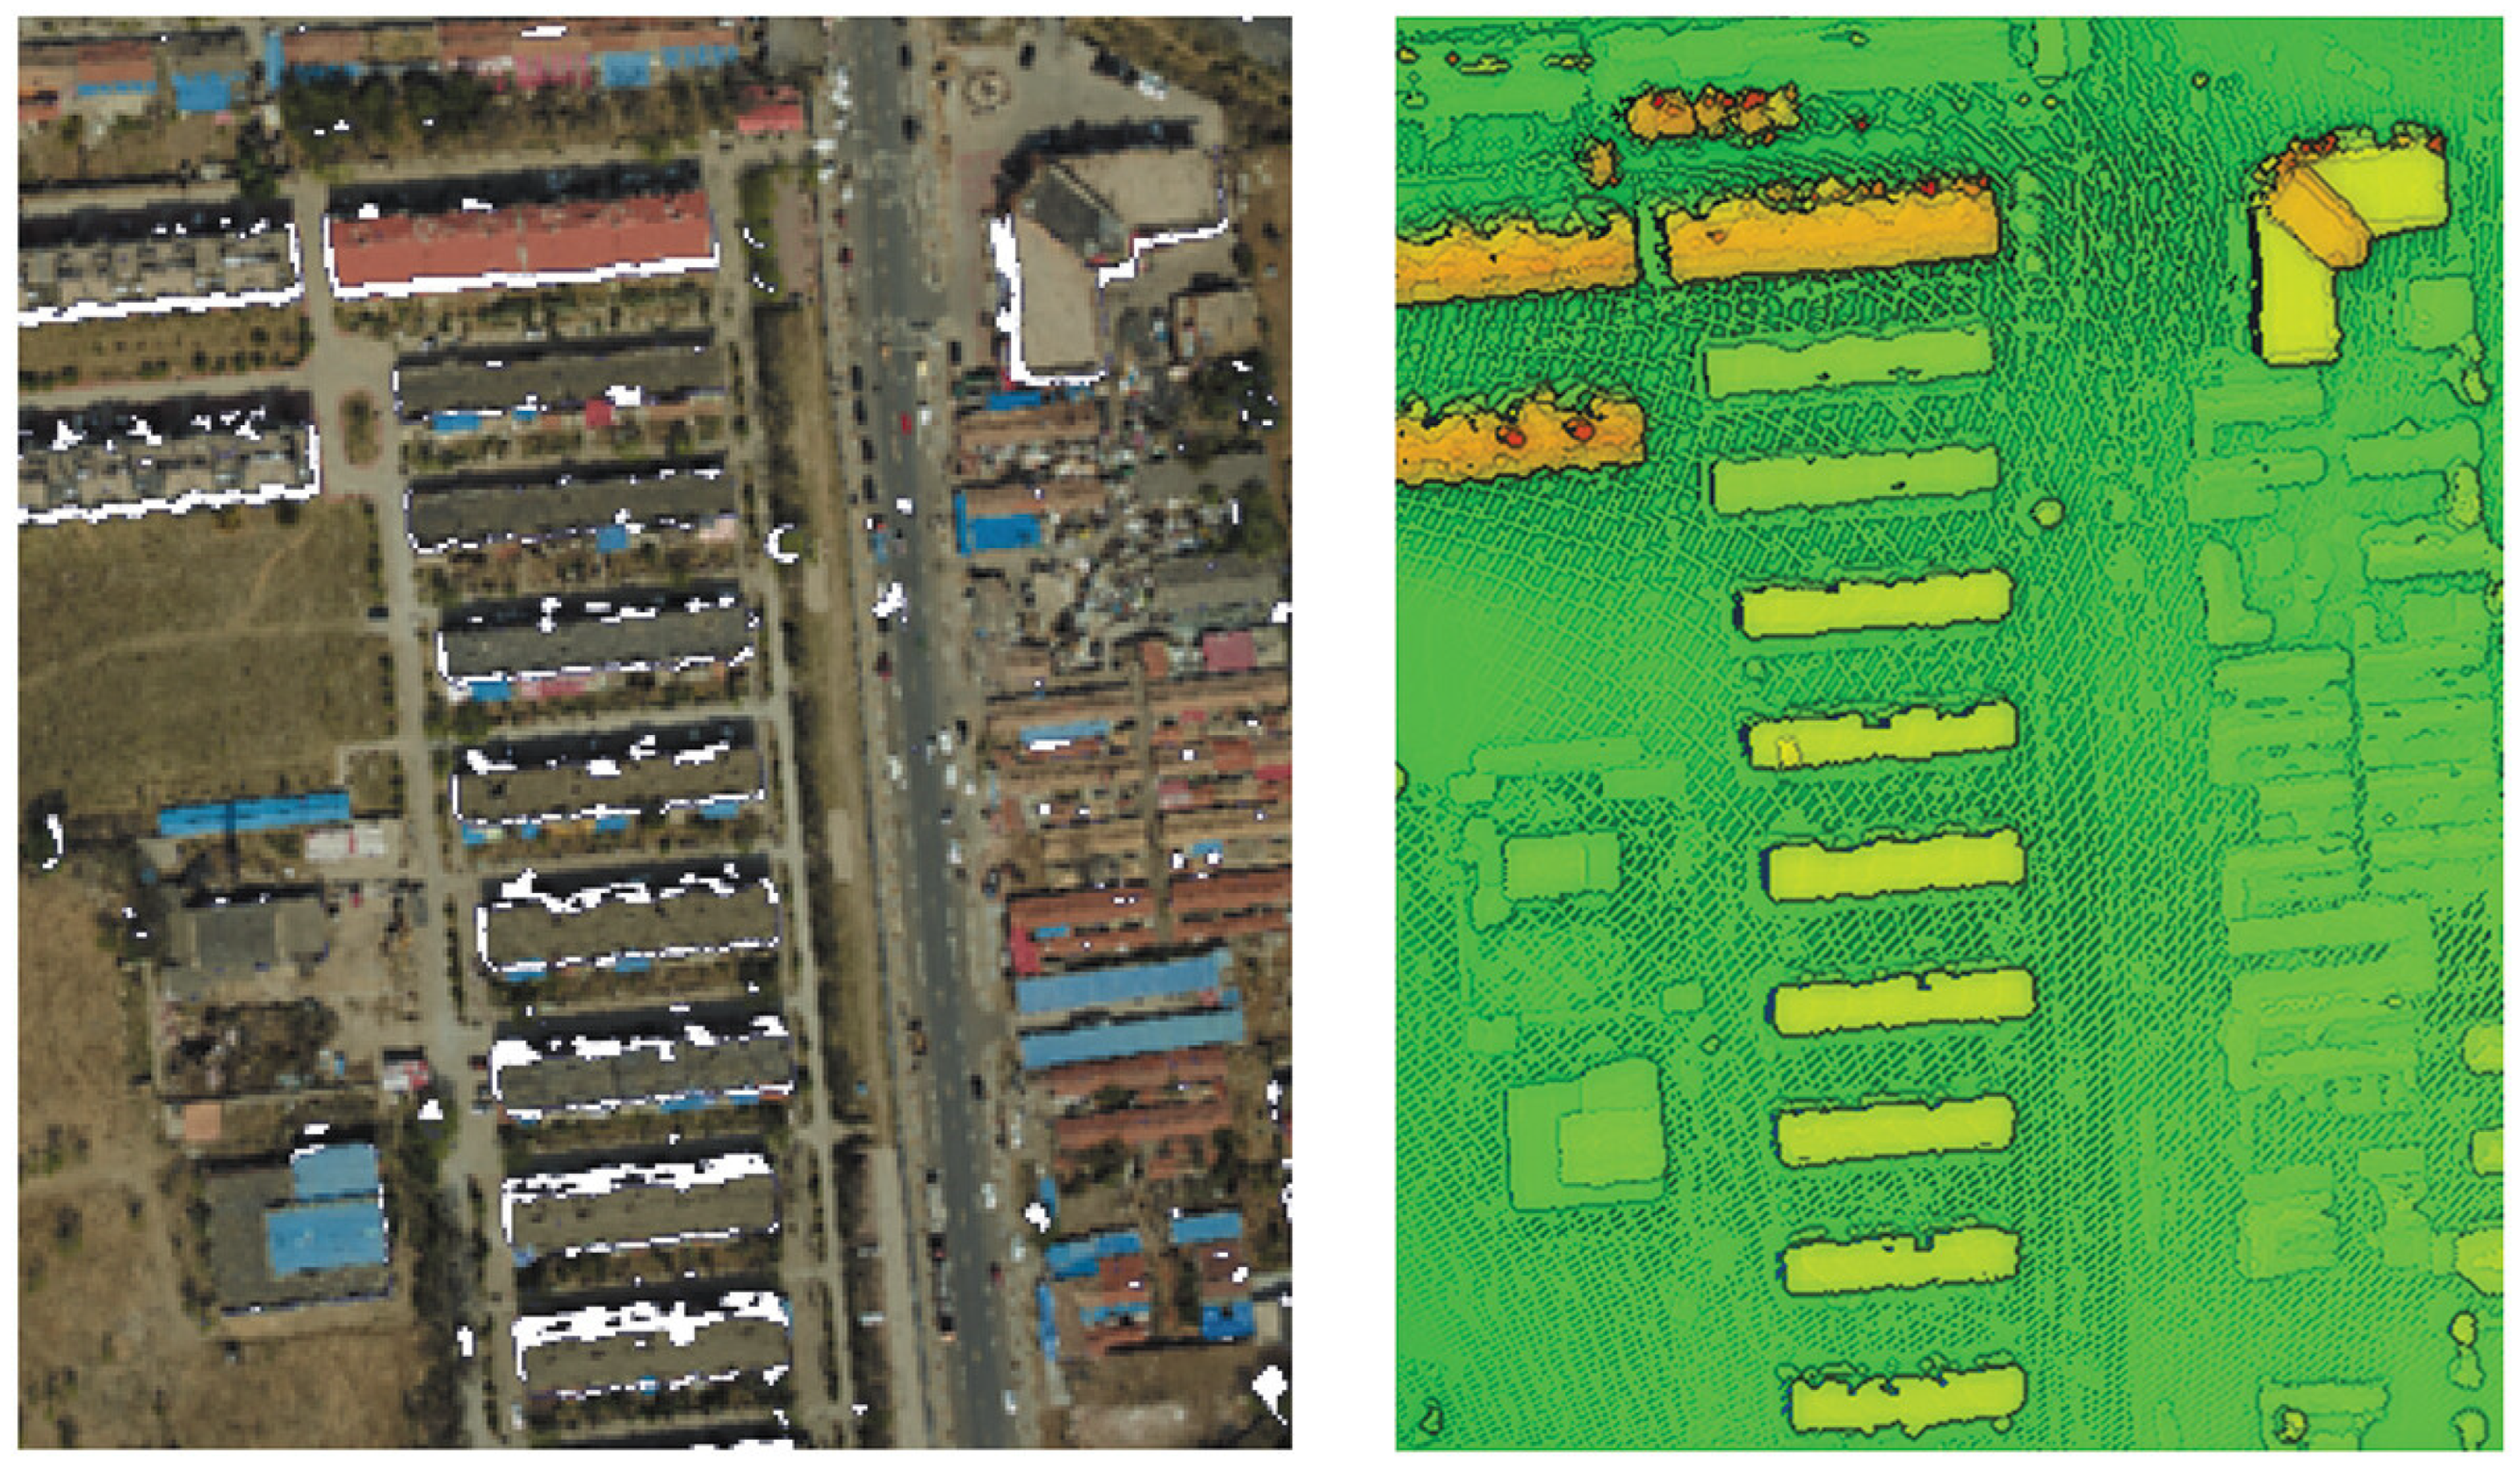
This representation effectively preserves the overall geometry while retaining high-frequency texture cues, thereby enabling accurate and robust extraction of building roof masks. As illustrated in
Figure 2, the left panel shows the original DOM, and the right panel depicts the schematic outcome of roof mask extraction.
3.1.3. Image and Point Cloud Registration
Since UAV-based oblique images acquired at different epochs are prone to geometric distortions and spatial misalignment, registration is essential to avoid spurious detections. To this end, a coarse-to-fine strategy is adopted.
In the coarse stage, the Scale-Invariant Feature Transform (SIFT) detects feature points from the two input images
and
. Feature descriptors
and
are matched by Euclidean distance:
where
denotes the descriptor dimension. Candidate matching pairs are then used to estimate an affine transformation matrix
through a least-squares fitting process, which brings the two epochs into coarse spatial alignment.
Following this, fine registration is conducted on the corresponding 3D point clouds using the Iterative Closest Point (ICP) algorithm [
40]. Given two point sets
and
, the objective is to solve for the optimal rigid transformation
, where
is a rotation matrix and
a translation vector, by minimizing the following error function [
40]:
with
denoting the number of points. By iteratively updating
and
, the ICP algorithm refines the alignment of the point clouds to sub-pixel accuracy.
This two-stage registration process—combining feature-based SIFT alignment with ICP refinement—ensures consistent spatial correspondence across epochs, thereby eliminating geometric discrepancies and providing a reliable foundation for subsequent building change detection.
3.2. Multi-Level Candidate Change Detection
To further refine the detection of building changes, a multi-level candidate extraction strategy is applied, which combines elevation-based filtering, vegetation suppression, and morphological refinement. This hierarchical approach effectively reduces false alarms and ensures that only structurally meaningful changes are retained for subsequent deep learning analysis.
3.2.1. Elevation Thresholding
Since building structures vary considerably in height, elevation thresholds are introduced to distinguish significant vertical changes from noise. Based on the normalized differential DSM (dnDSM), we define two thresholds:
for low-rise buildings and
for high-rise structures. Pixels are marked as candidate changes when:
This adaptive multi-level strategy ensures that both small-scale and large-scale structural variations can be effectively captured, while suppressing insignificant fluctuations caused by terrain or sensor noise.
3.2.2. Vegetation Filtering Using NDVI
Although elevation differences are effective in detecting building-related changes, vegetation can also exhibit vertical variability and thus lead to false positives. To mitigate this effect, the Normalized Difference Vegetation Index (NDVI) is computed from near-infrared (NIR) and red spectral bands:
where
and
denote the reflectance in the near-infrared and red bands, respectively. Empirically, vegetation typically yields
NDVI values greater than 0.3, while man-made objects such as buildings present lower values. Therefore, pixels with
NDVI > 0.3 are classified as vegetation and excluded from the candidate change set. This filtering step significantly improves the precision of candidate extraction by removing non-building regions.
3.2.3. Morphological Refinement
The candidate mask obtained after thresholding and NDVI filtering may still contain noise, isolated points, and fragmented boundaries. To address these issues, morphological opening and closing operations are performed using a structuring element B.
where
and
denote dilation and erosion, respectively. In practice, opening is first applied to suppress spurious responses, followed by closing to improve the continuity of building boundaries.
As illustrated in
Figure 3, the proposed three-step strategy progressively refines the candidate regions: elevation-sensitive areas are first extracted from the dnDSM, vegetation-related errors are subsequently suppressed using NDVI filtering, and morphological operations are applied to enhance spatial coherence. The resulting refined masks accurately delineate potential building changes, which are then forwarded to the deep learning module for classification and validation.
3.3. Improved TinyCD Network
To achieve robust and efficient building change detection, we use TinyCD [
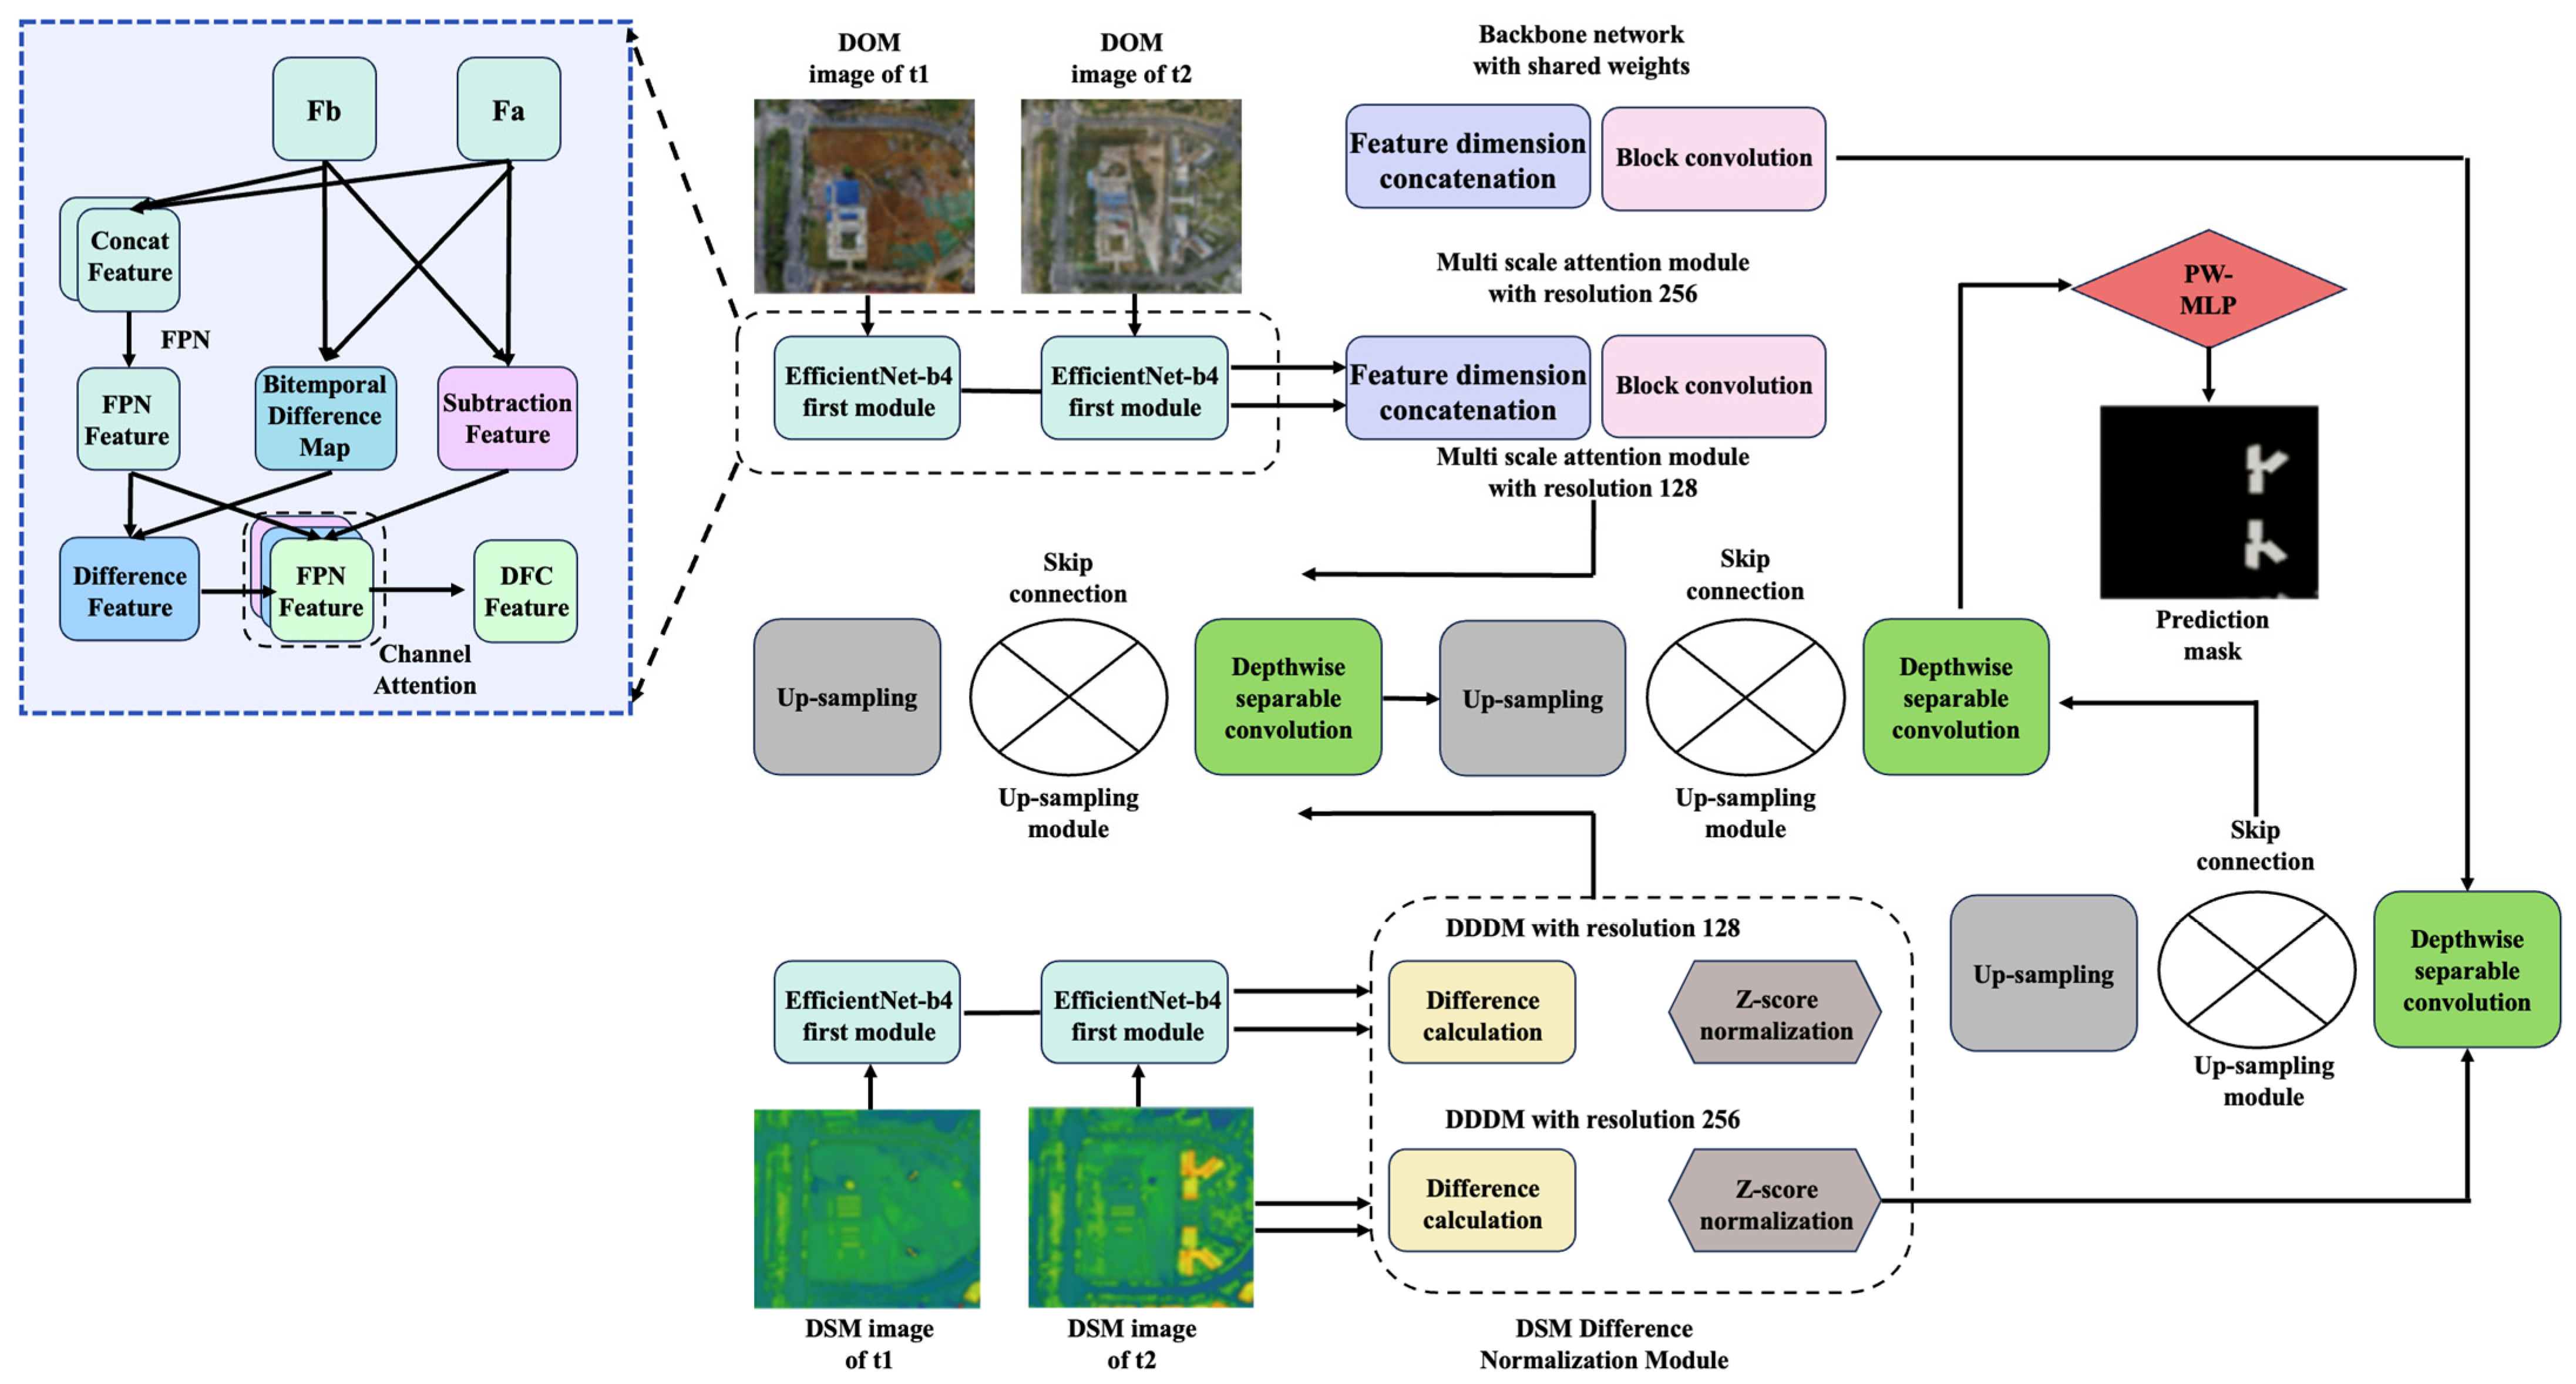
27] as the backbone and adapt it to integrate multi-source structural cues from both DOM and DSM data. The baseline TinyCD is a lightweight Siamese encoder–decoder, in which bi-temporal images are encoded in parallel, fused through skip connections, and subsequently decoded into a binary change map.
As illustrated in
Figure 4, in the improved framework, two parallel branches are designed to separately process DOM and DSM inputs. For the DOM branch, bi-temporal orthophotos are first encoded with EfficientNet-b4, followed by differential feature construction through concatenation, subtraction, and cosine-similarity operations. These features are fused via the Differential Feature Compensation Module (DFCM), enabling the network to capture both semantic consistency and structural differences across epochs.
For the DSM branch, raw elevation maps are converted into dDSM and normalized into dnDSM using Z-score standardization. The resulting dnDSM features are encoded through another EfficientNet-b4 stream and fed into the DSM Difference Normalization Module (DDDM), which explicitly emphasizes vertical structural variations. The outputs of the DOM and DSM branches are subsequently fused at multiple scales through skip connections.
Finally, the fused multi-scale feature maps are decoded with convolutional upsampling layers, and a Patch-Wise Multi-Layer Perceptron (PW-MLP) head produces the final pixel-wise change predictions. This design ensures that geometric priors (DSM/dnDSM) and spectral–textural cues (DOM) are effectively combined, resulting in sharper boundaries, reduced noise, and improved robustness to complex urban environments.
3.3.1. Differential Feature Compensation Module (DFCM)
To capture complementary temporal differences, the DFCM combines cosine-similarity-based and subtractive representations. Given two encoded feature maps
and
, the cosine similarity map is defined as
which emphasizes semantic consistency across epochs. In parallel, a subtractive map is computed as
which highlights absolute discrepancies. The final compensated representation is obtained by a weighted fusion:
where
and
control the relative contributions of the two terms. By integrating these complementary cues, DFCM produces robust differential features that are less sensitive to illumination or viewpoint variations, while enhancing the discriminability of structural changes.
3.3.2. DSM Difference Normalization Module (DDDM)
To explicitly guide the network toward structural building changes, we embed the proposed DDDM module within the encoder. Following the preprocessing step described in
Section 3.1, a differential DSM is first computed to capture pixel-wise elevation differences [
25]:
The raw difference is then normalized using the mean elevation of the scene:
where
denotes the average elevation over the valid region. This mean-based normalization removes dependency on absolute height ranges and preserves scale invariance across cities with different terrain baselines.
We adopt mean normalization rather than Z-score normalization for two reasons. First, it avoids reliance on global variance statistics, which are difficult to maintain under tile-based or sliding-window inference. Second, a controlled comparison on the LEVIR-CD validation set (1024 image pairs) shows that mean normalization yields higher accuracy and lower variance: F1 = 93.18%, IoU = 88.84%, σ = 0.14, whereas Z-score normalization gives F1 = 92.47%, IoU = 87.95%, σ = 0.31 under identical settings. Moreover, Z-score causes 4.6% pixel drift (>0.3 m) during streaming inference, compared with only 1.1% under mean normalization. These results indicate that mean normalization is more stable and deployment-friendly, and are consistent with prior DSM-based change detection studies [
25].
Positive dnDSM values correspond to new construction or height increases, while negative values reflect demolition. The dnDSM map is concatenated with DOM-based features and injected into the encoder, enabling joint learning of geometric and spectral cues and improving sensitivity to height-related building changes.
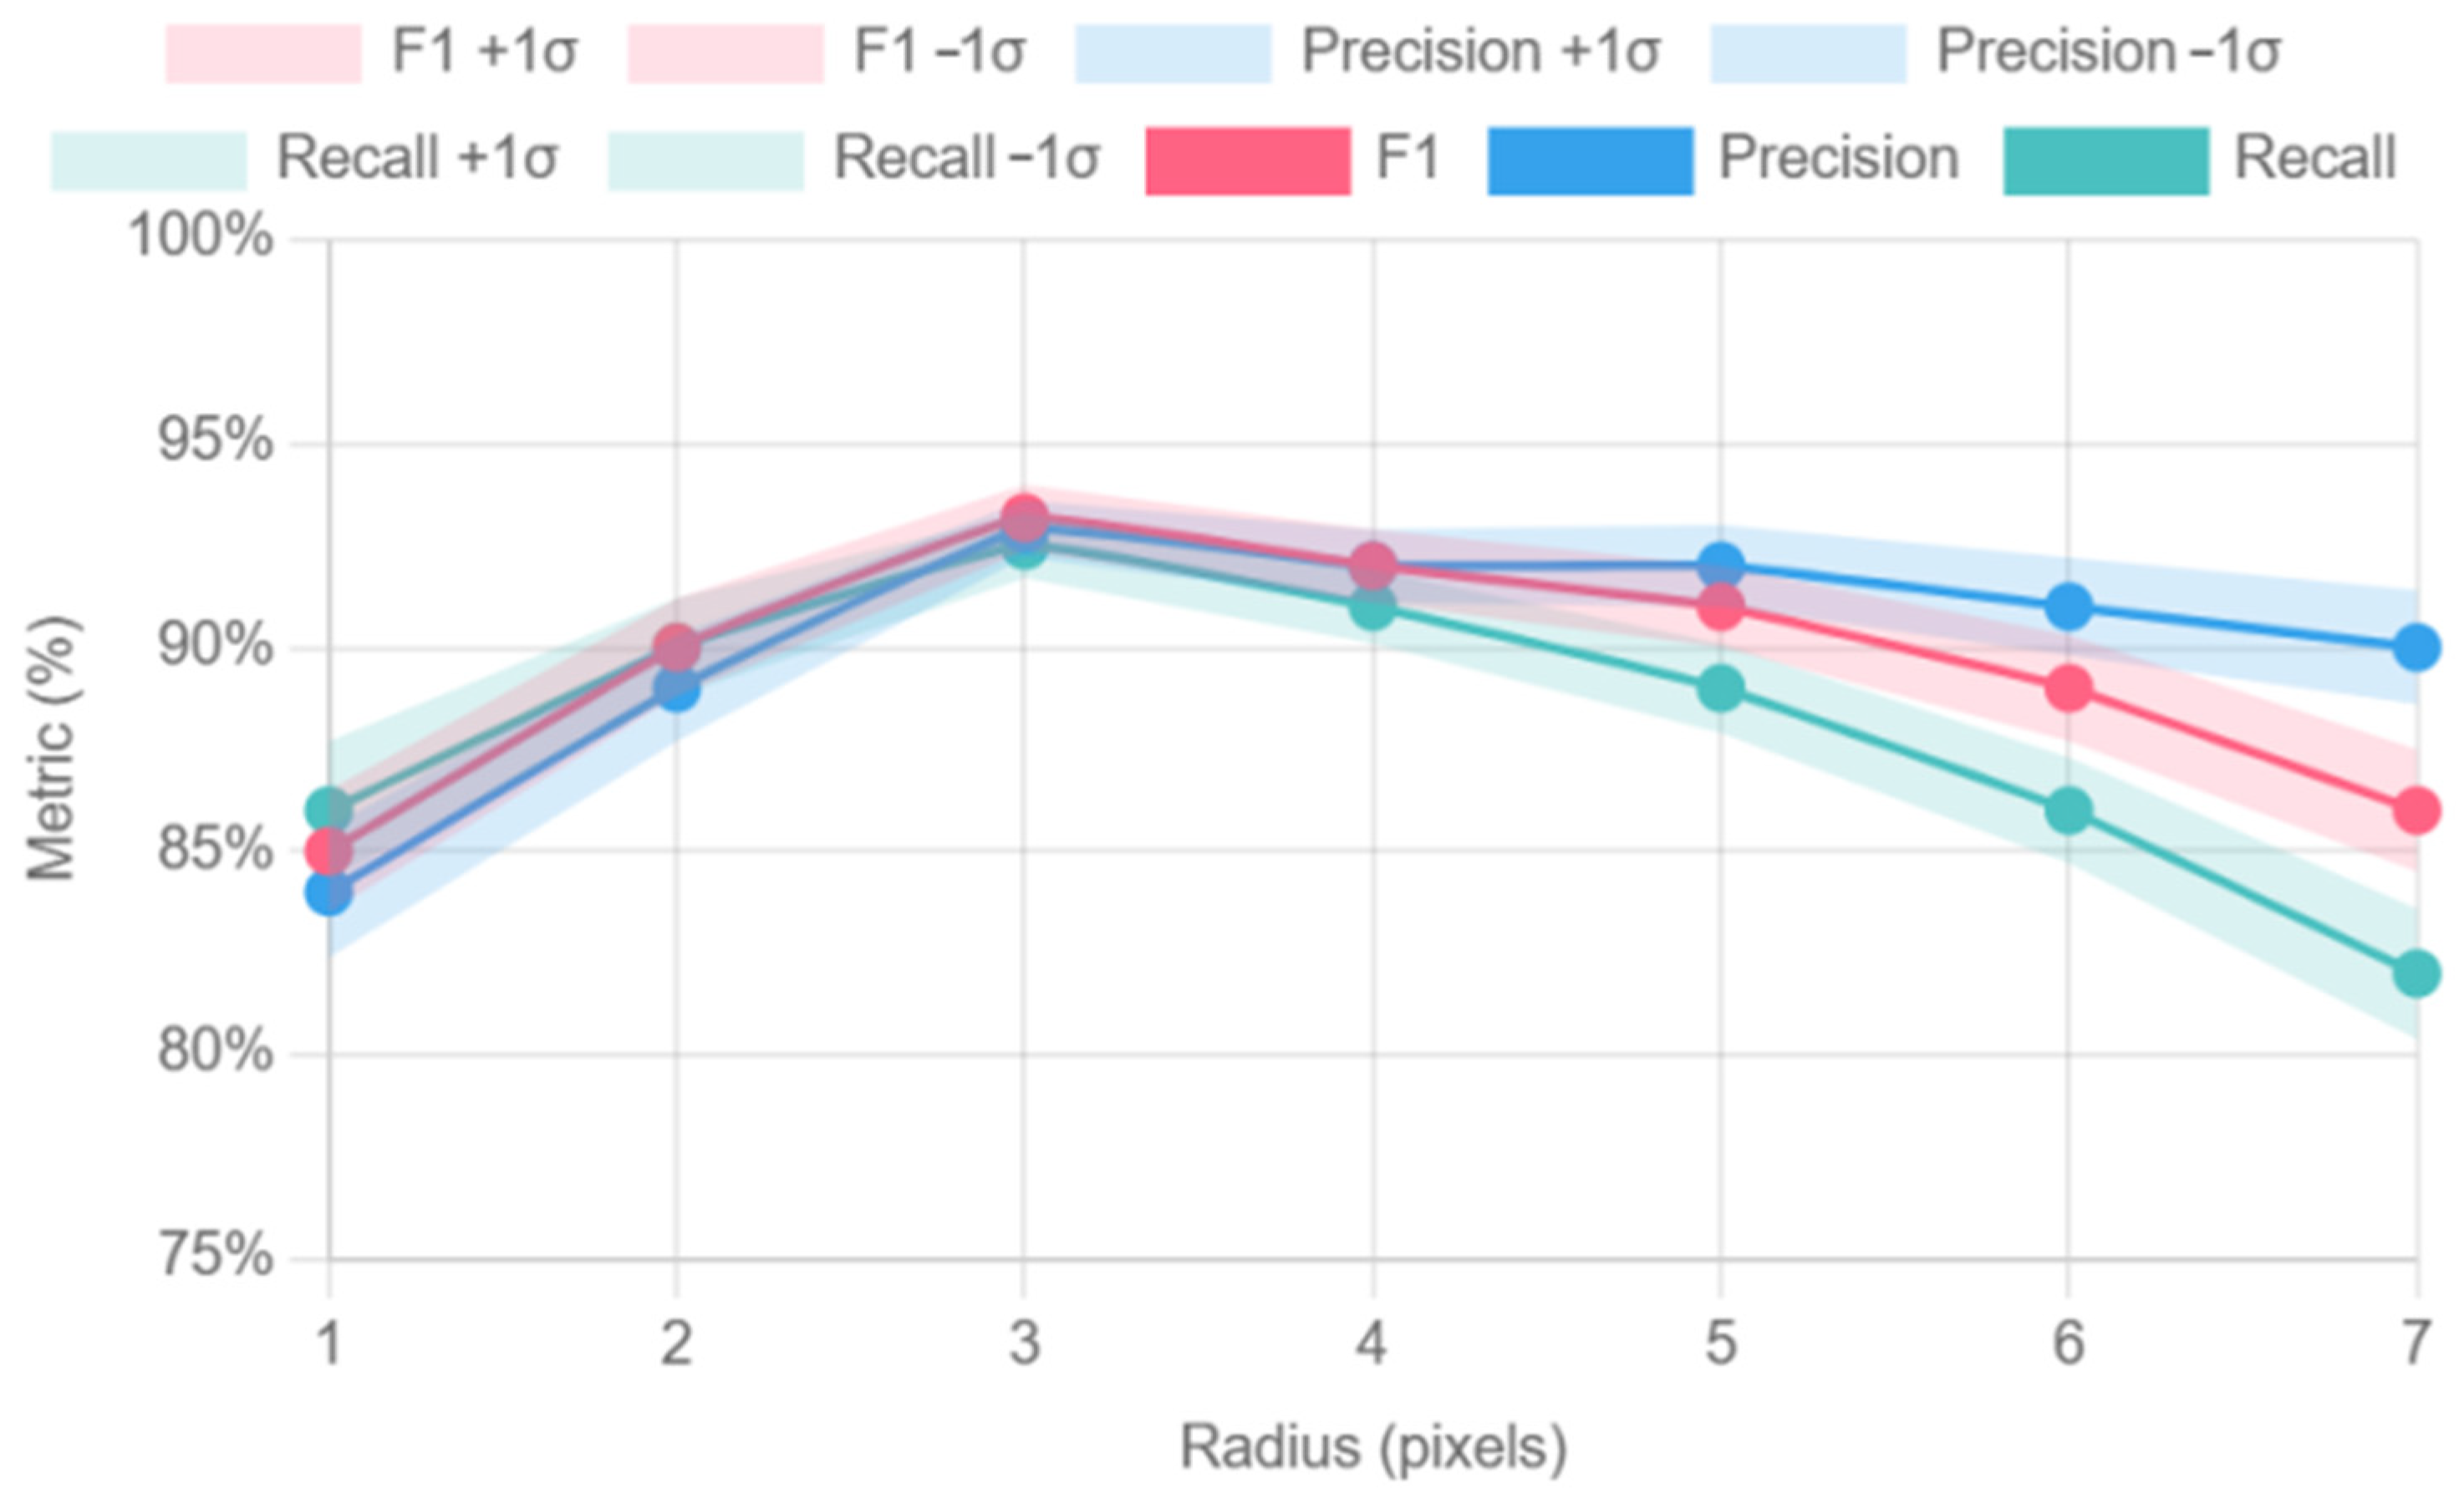
To determine a suitable structuring element size for the open–close refinement, we performed a parameter sweep with disk kernels of radii
pixels on the LEVIR-CD validation set, while keeping all other hyperparameters fixed. Each configuration was evaluated over five runs, and the resulting F1, Precision, and Recall curves are shown in
Figure 5.
The results indicate that pixels (≈1.5 m at 0.5 m GSD) achieves the highest F1-score 93.18%, with balanced Precision 92.9% and Recall 92.5%. Smaller kernels () insufficiently suppress isolated false alarms, whereas larger kernels () over-smooth building edges and reduce Recall. Based on this analysis, we adopt a disk kernel with as the default setting in all experiments.
3.3.3. PW-MLP Output Head
In the decoding stage, a Patch-Wise Multi-Layer Perceptron (PW-MLP) is employed as the output head to refine final predictions. Instead of relying solely on convolutional kernels with limited receptive fields, PW-MLP aggregates contextual information across local patches and projects it back to the pixel domain. Formally, given a feature patch
, the PW-MLP transforms it into a vector representation and maps it to pixel-wise logits through a fully connected projection:
where
,
are learnable weights,
denotes a non-linear activation, and
is the sigmoid function. This operation enhances boundary sharpness by jointly considering local texture consistency and neighborhood context. Compared with conventional convolutional classifiers, PW-MLP mitigates over-smoothing effects and preserves the fine details of building edges, leading to more accurate binary masks, especially in dense urban areas with small-scale structures.
Overall, the improved TinyCD integrates DSM- and DOM-derived features into a lightweight architecture. The DFCM enriches temporal difference learning, DDDM injects explicit structural priors, and PW-MLP enhances prediction quality. This design achieves a favorable balance between accuracy and computational efficiency, making the model suitable for large-scale urban change detection.
4. Experimental Data and Setup
To validate the effectiveness and generalization capability of the proposed DDDMNet framework, extensive experiments were carried out on multiple benchmark datasets and UAV-acquired oblique imagery. This chapter first introduces the datasets and their characteristics, followed by the preprocessing steps applied to ensure spatial and spectral consistency. The experimental environment and implementation details are then described to facilitate reproducibility. Finally, the evaluation metrics adopted for quantitative assessment are presented. Together, these preparations establish a rigorous foundation for the comparative experiments and ablation studies discussed in
Section 5.
4.1. Datasets
To ensure a comprehensive evaluation, three representative benchmark datasets were selected: LEVIR-CD, WHU-CD, and DSIFN. These datasets differ significantly in geographic coverage, spatial resolution, annotation strategy, and change types, thus providing a robust test bed for the proposed framework.
LEVIR-CD: The LEVIR-CD dataset, constructed by a research group in China, is one of the most widely used large-scale benchmarks for building change detection. It contains 637 pairs of bi-temporal aerial images with a ground resolution of 0.5 m. Each image pair focuses on specific urban regions characterized by rapid expansion and diverse building morphologies. The dataset is cropped into patches of 256 × 256 pixels, resulting in 5120 pairs for training and 1024 pairs for validation. The annotations focus exclusively on building changes, making the dataset particularly well-suited for evaluating urban expansion and demolition scenarios.
WHU-CD: The WHU-CD dataset, developed by Wuhan University, consists of a single large-scale bi-temporal image pair of size 32,507 × 15,354 pixels, with a ground resolution of 0.3 m. Then, the imagery is partitioned into 191 non-overlapping patches of 256 × 256 pixels, which serve as the testing set. The data cover a broad urban area with dense building distributions, and the precise co-registration ensures that even small-scale structural changes can be reliably assessed. This dataset is primarily used for independent testing and cross-benchmark validation.
DSIFN: The DSIFN dataset, also released by Wuhan University, contains bi-temporal high-resolution images collected from six major Chinese cities, including Shanghai, Chengdu, and Wuhan. The images are derived from Google Earth and annotated with fine-grained categories: “no change,” “new impervious surface,” “demolished impervious surface,” and “background change.” The spatial resolution is approximately 0.5 m, and the dataset focuses on impervious surface changes, covering both buildings and roads. Compared with LEVIR-CD and WHU-CD, DSIFN poses greater challenges due to its heterogeneous scenes and multi-class annotations, making it a valuable benchmark for testing generalization. To align DSIFN with the binary building change task, the “new impervious” and “removed impervious” labels are merged into a single positive change class, and all remaining categories are assigned to the no-change class.
A comparative summary of the three datasets is provided in
Table 1. The symbol “→” denotes the number of image patches generated from the original image pairs. For example, “637 pairs → 5120 train patches” indicates that 5120 training patches were extracted from 637 image pairs, and “1 pair → 191 test patches” indicates that 191 test patches were extracted from a single image pair.
In addition to spatial resolution and annotation differences, the three datasets also represent diverse acquisition conditions in terms of aerial platforms, camera configurations, flight altitudes, and seasonal variations, with ground sampling distances ranging from 0.3 m to 0.5 m. This diversity provides a natural sampling of typical “platform–sensor–flight” combinations used in large-scale urban surveys, supporting the evaluation of model robustness across varying operational conditions. Moreover, the preprocessing pipeline employed in this study incorporates NDVI-based masking and multi-scale texture suppression to reduce shadow and vegetation interference, while the DFCM module implicitly compensates for illumination and view-angle variations through dual-path fusion. Empirically, these mechanisms confine performance fluctuations to within ±1.5% F1 across the three datasets, suggesting that the proposed framework maintains stable accuracy under commonly encountered acquisition settings.
It is worth noting that the publicly available versions of LEVIR-CD, WHU-CD, and DSIFN consist only of bi-temporal high-resolution optical images with annotated change masks, and do not provide DOM or DSM data. To further validate the applicability of the proposed method under multi-source conditions, we reconstructed DOM and DSM from the original aerial imagery and associated exterior orientation parameters (including camera positions, flight altitude, and attitude) using OpenDroneMap (ODM, OpenDroneMap community, open-source). Through aerial triangulation and dense image matching, consistent DOM and DSM products were generated for each dataset. This extension not only ensures comparability with existing benchmark studies but also enables a more comprehensive evaluation of the proposed framework by integrating both geometric and spectral cues.
To promote reproducibility and ensure that the reconstructed data meet the accuracy requirements of urban-scale change detection, we summarize the key reconstruction settings and quality metrics as follows:
Reconstruction settings: Original JPG images (no compression) were imported using a calibrated camera model (35 mm focal length, 13.2 × 8.8 mm sensor). The coordinate system was WGS84/UTM 50N, with RTK ground control points (GCPs) providing ≤2 cm horizontal and ≤3 cm vertical accuracy. Feature matching was configured with a maximum of 80,000 keypoints, matching threshold = 0.6, and image scale = 1/2 using the Aerial Grid + Adaptive Keypoint strategy. Aerial triangulation was performed using the Brown–Conrady model with a reprojection error threshold of 0.30 px and three iterations of bundle adjustment. Dense point clouds were generated at Ultra High density (1 pt/pixel), minimum 3 matches, Gaussian smoothing σ = 0.2 m, and 2 × GSD outlier removal. DSM and DOM were exported at 0.10 m and 0.05 m resolution, respectively, using IDW interpolation and 1 m void filling (GeoTIFF + TFW format).
Accuracy assessment: A total of 20 RTK checkpoints were used to validate the reconstruction. The results yielded a planimetric RMSE of 0.28 px (≈0.014 m) and an elevation RMSE of 0.47 m (95% CI: 0.39–0.55 m), with dense cloud density ≥60 pts/m2. These values satisfy the accuracy requirements for building-scale change detection.
Sensitivity to elevation bias: To assess the impact of DSM uncertainty on downstream predictions, a synthetic ±0.5 m offset was applied to the DSM on the LEVIR-CD validation subset. The global height shift resulted in an average decrease of 1.3% in F1-score and 1.8% in IoU, indicating that the proposed framework maintains moderate robustness to uniform elevation perturbations.
To ensure fairness and comparability, we acknowledge that the reconstructed DOM and DSM products may introduce biases not present in the official RGB imagery. To quantify the actual gain from multi-source fusion rather than reconstruction artifacts, we additionally report an RGB-only baseline: DDDMNet with the DSM branch removed is trained and evaluated solely on the official bi-temporal RGB images (e.g., LEVIR-CD validation set). The performance gap between this baseline and the reconstructed multi-source version directly reflects the contribution of multi-source integration, thereby mitigating concerns regarding reconstruction bias.
4.2. Data Preprocessing
Before training and evaluation, all datasets were subjected to a unified preprocessing pipeline to ensure comparability and to fully exploit the multi-source information.
Step 1: Geometric Alignment: Bi-temporal images and point clouds are first aligned to a common spatial reference frame. Coarse registration is performed using SIFT keypoint matching, followed by affine transformation estimation. Fine registration is refined by Iterative Closest Point (ICP) applied to the corresponding point clouds. This two-stage strategy effectively reduces misalignment-induced artifacts.
Step 2: DSM Differencing and Normalization: For DSM data, differential DSM (dDSM) is computed by subtracting the earlier epoch from the later one. To eliminate elevation bias from terrain undulations, the dDSM is normalized by the mean elevation of the scene, yielding dnDSM. This normalized representation emphasizes structural variations related to building height while suppressing irrelevant elevation changes.
Step 3: DOM Edge and Texture Enhancement: The DOM is converted to grayscale and smoothed with Gaussian filtering. Gradient magnitude and orientation are then calculated to apply Canny edge detection, producing roof contours. In addition, wavelet decomposition is used to capture multi-scale texture features, combining global structural patterns with high-frequency details. These enhanced features are used to construct roof masks that serve as strong spatial priors for subsequent change detection.
Step 4: NDVI Vegetation Filtering: To reduce false detections caused by vegetation, the Normalized Difference Vegetation Index (
NDVI) is calculated from the Red and Near-Infrared (
NIR) bands:
Pixels with NDVI > 0.3 are classified as vegetation and excluded from candidate change regions.
Step 5: Patch Tiling: To unify input sizes across datasets, all images are cropped into 256 × 256 patches with a stride of 128. This not only increases the number of training samples but also facilitates batch processing within the GPU memory limits.
4.3. Experimental Environment
All experiments were conducted in a high-performance computing environment running Ubuntu 22.04. The implementation was based on PyTorch 1.8 with Python 3.8, accelerated by CUDA 11.0 and cuDNN 7.6. The detailed hardware and software configuration is summarized in
Table 2.
In addition to the above training environment, we also benchmark the inference performance of DDDMNet on three hardware platforms representing different deployment scenarios: a desktop GPU (RTX-3080Ti), an embedded edge device (Jetson Orin Nano, 15 W), and a mobile AI platform (Jetson Xavier NX). For each device, a 256 × 256 patch is used as input, and both FP32 and TensorRT-optimized INT8 models are evaluated. During inference, the frame rate (FPS) and peak GPU memory allocation are recorded to assess real-time suitability and hardware efficiency.
4.4. Evaluation Metrics
In this study, the change detection task is formulated as a binary segmentation problem, where the ground-truth mask is binary: 0 denotes unchanged pixels and 1 denotes changed pixels. Since the network outputs probability maps, the Binary Cross-Entropy (BCE) loss is employed to measure the discrepancy between predicted probabilities and ground truth [
22,
30]. It is defined as
where
denotes the ground-truth mask,
the predicted probability map, and
,
the sets of pixel indices along height and width.
To quantitatively evaluate the performance of the proposed model, five widely adopted metrics were calculated: Precision (
Pr), Recall (
Rc), F1-score (
F1), Intersection over Union (
IoU), and Overall Accuracy (
OA) [
22,
30]. Their definitions are given as
where
TP,
TN,
FP, and
FN denote the numbers of true positives, true negatives, false positives, and false negatives, respectively. For the binarization of predicted masks, a threshold of 0.5 was applied to the output probability maps.
These metrics together provide a comprehensive evaluation: Precision measures correctness of detected changes, Recall reflects completeness, F1-score balances the two, IoU evaluates spatial overlap, and OA captures overall pixel-level accuracy.
5. Results and Discussion
This section presents comprehensive experiments conducted to evaluate the effectiveness of the proposed DDDMNet for building change detection. The experiments are designed to achieve three objectives:
- (1)
To benchmark DDDMNet against representative state-of-the-art methods on widely used datasets, including LEVIR-CD, WHU-CD, and DSIFN;
- (2)
To validate the contribution of each proposed module through ablation studies;
- (3)
To provide an integrated discussion on the advantages, limitations, and implications of our approach.
All experiments were implemented under the same training protocols and evaluated using widely adopted metrics, namely Precision (Pr), Recall (Rc), F1-score (F1), Intersection over Union (IoU), and Overall Accuracy (OA), as defined in
Section 4.3. Results are presented in both quantitative tables and illustrative visualizations, ensuring a comprehensive evaluation.
5.1. Comparison with State-of-the-Art Methods
The quantitative performance of the proposed DDDMNet is evaluated on three widely used benchmarks: LEVIR-CD, WHU-CD, and DSIFN.
Table 3,
Table 4 and
Table 5 summarize the results of our model compared with several state-of-the-art baselines, including DTCDSCN [
22], STANet [
30], IFNet [
33], SNUNet [
29], TinyCD [
27], and, for LEVIR-CD, the Transformer-based ChangeFormer-L (Swin Transformer-Tiny backbone) [
32,
41]. Five metrics are reported, namely Precision (Pr), Recall (Rc), F1-score (F1), Intersection-over-Union (IoU), and Overall Accuracy (OA).
On the LEVIR-CD dataset (
Table 3), DDDMNet achieves the highest overall performance across all metrics, with an F1-score of 93.18% and an IoU of 88.84%. Compared with TinyCD—which already performs strongly in large-scale building change detection—DDDMNet improves the IoU by nearly 4 percentage points. This demonstrates that the explicit integration of dnDSM with DOM-derived features boosts the model’s ability to capture subtle structural changes, such as localized rooftop alterations, while significantly suppressing false alarms from spectral ambiguity. In addition to outperforming CNN-based baselines, DDDMNet also shows advantages over recent Transformer-based architectures. For example, ChangeFormer-L (using a Swin-Tiny backbone) achieves an F1-score of 92.05% and an IoU of 86.74% on the same dataset, while consuming approximately 2.7× more GPU memory. This indicates that, despite the growing popularity of Transformer models in remote sensing, well-designed geometric priors combined with efficient convolutional backbones can still provide a favorable balance of accuracy, robustness, and computational cost—especially in resource-constrained deployment scenarios.
For the WHU-CD dataset (
Table 4), which consists of a single large-scale scene segmented into test patches, our approach also outperforms all competing methods. DDDMNet reaches an F1-score of 93.08% and an IoU of 88.12%, exceeding the performance of TinyCD by 1.3% in F1 and 3.4% in IoU. These gains are particularly notable given the dense urban layout of WHU-CD, where misalignment and occlusion often degrade detection performance. The results demonstrate that DDDMNet’s DSM-guided structural priors provide complementary cues to DOM textures, yielding more robust detection in complex urban environments.
On the more challenging DSIFN dataset (
Table 5), which covers heterogeneous urban and rural areas from multiple cities, DDDMNet again achieves superior results, with an F1-score of 93.32% and an OA of 99.53%. Compared with other advanced baselines such as IFNet and SNUNet, our framework exhibits a consistent advantage, highlighting its robustness to variations in imaging conditions and scene composition. The improvements indicate that DDDMNet is capable of generalizing well to diverse contexts, capturing both large-scale urban transformations and subtle structural changes in less regular rural areas.
Overall, the results across all three datasets consistently demonstrate that DDDMNet achieves state-of-the-art accuracy for building change detection. The combination of differential feature compensation (DFCM), dnDSM normalization, and multi-source feature fusion significantly enhances both pixel-level precision and structural completeness, validating the effectiveness of our proposed framework.
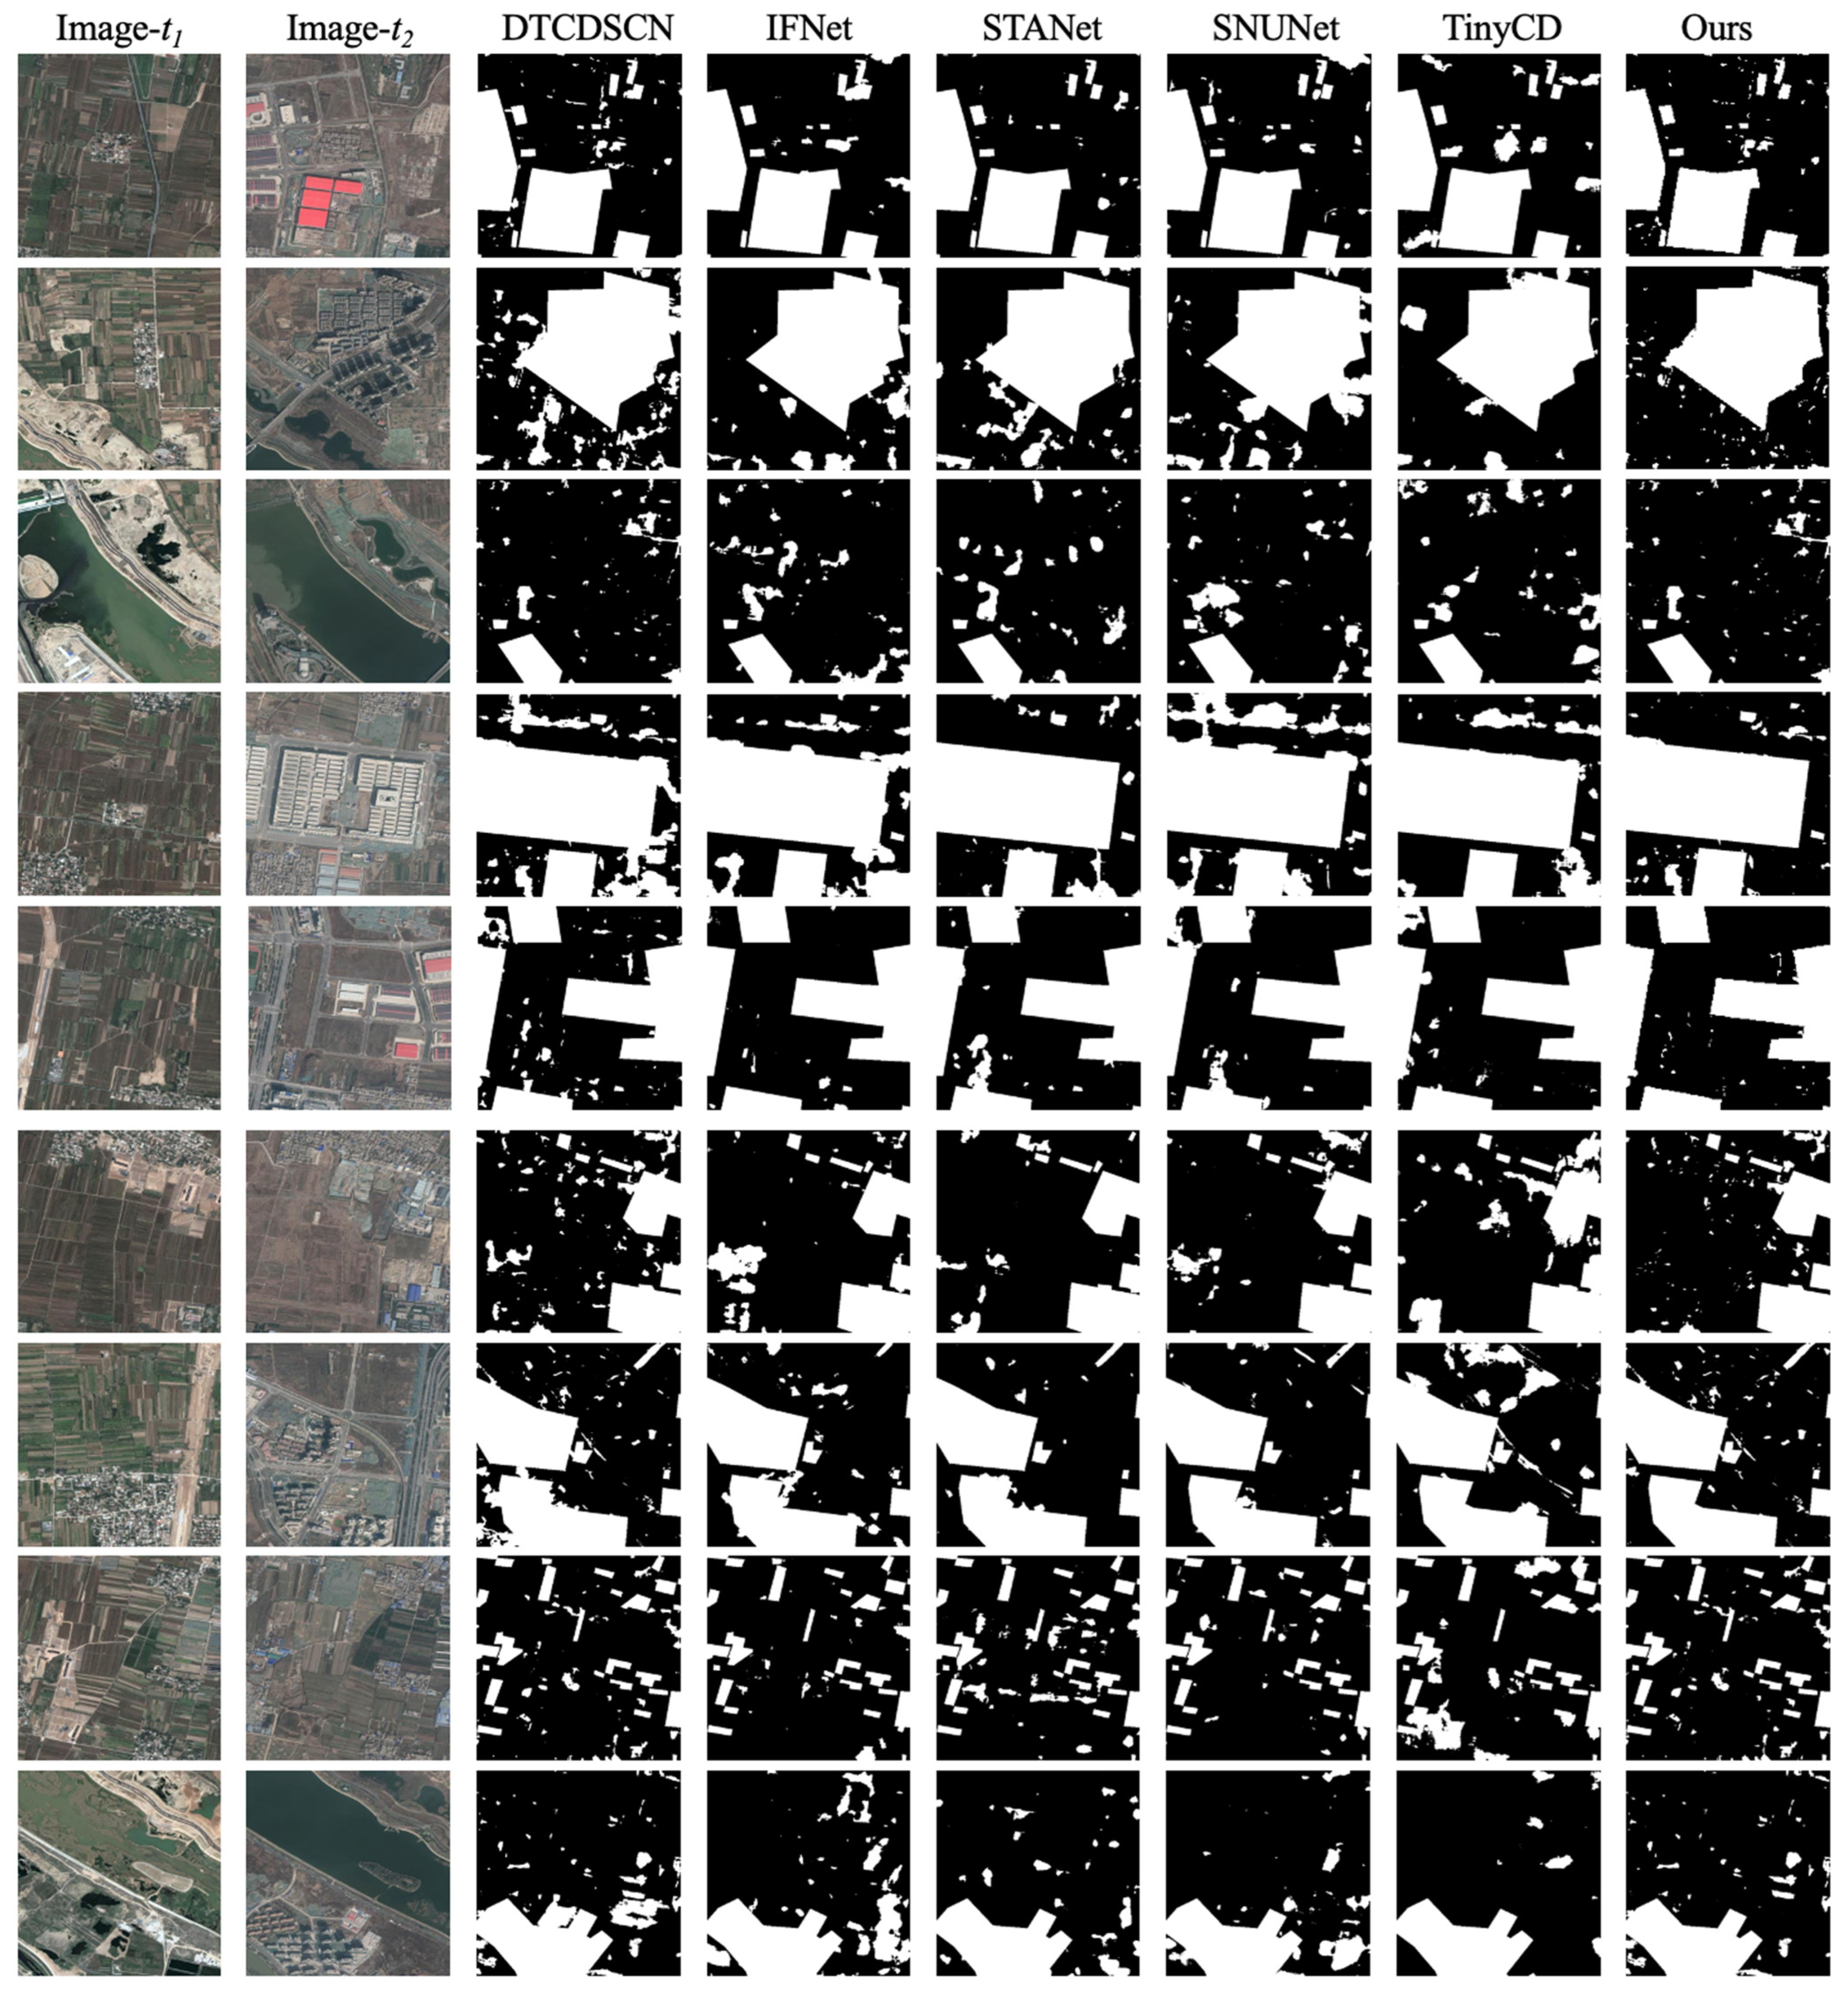
In addition to quantitative evaluations, qualitative results are provided in
Figure 6 to further compare DDDMNet with representative baselines. As shown, conventional convolutional models such as DTCDSCN and IFNet tend to produce noisy predictions with fragmented building regions, while attention-based STANet and SNUNet improve consistency but still suffer from false alarms in complex urban scenes. TinyCD, despite its lightweight design, often fails to capture subtle changes, leading to incomplete boundaries.
By contrast, the proposed DDDMNet generates more coherent masks with sharper building edges and fewer false positives, especially in dense residential blocks and rural–urban transition areas. These results confirm that integrating DSM-derived elevation priors with DOM-based spectral features enables the network to distinguish structural changes from background variations more effectively.
5.2. Ablation Study and Efficiency Benchmark
To further investigate the contribution of each component, an ablation study was conducted on LEVIR-CD. The results are reported in
Table 6.
Effect of DFCM: Removing the Differential Feature Compensation Module reduces F1 from 93.08% to 82.84%. This confirms that cosine-similarity and subtractive features provide complementary temporal cues, enhancing robustness against illumination or viewpoint changes.
Effect of DDDM: Excluding the DSM Difference Normalization Module lowers IoU from 88.12% to 74.62%, demonstrating its critical role in normalizing height differences and enhancing structural change detection.
Effect of dnDSM preprocessing: Without explicit dnDSM input, recall decreases from 92.55% to 88.65%, showing that elevation normalization is crucial for emphasizing vertical changes.
Effect of morphological refinement: Eliminating morphological operations reduces precision from 92.83% to 88.95%, leading to noisier predictions and demonstrating that post-processing plays a non-negligible role in refining candidate masks.
Figure 6.
Visual comparison of change detection results between different methods. From left to right: bi-temporal input images, predictions of DTCDSCN, IFNet, STANet, SNUNet, TinyCD, and the proposed DDDMNet. DDDMNet produces more coherent and accurate building change masks with sharper boundaries and fewer false alarms.
Together, these results demonstrate that each proposed component contributes meaningfully to the final performance, while their integration leads to the best results. In addition to quantitative analysis, qualitative results are provided in
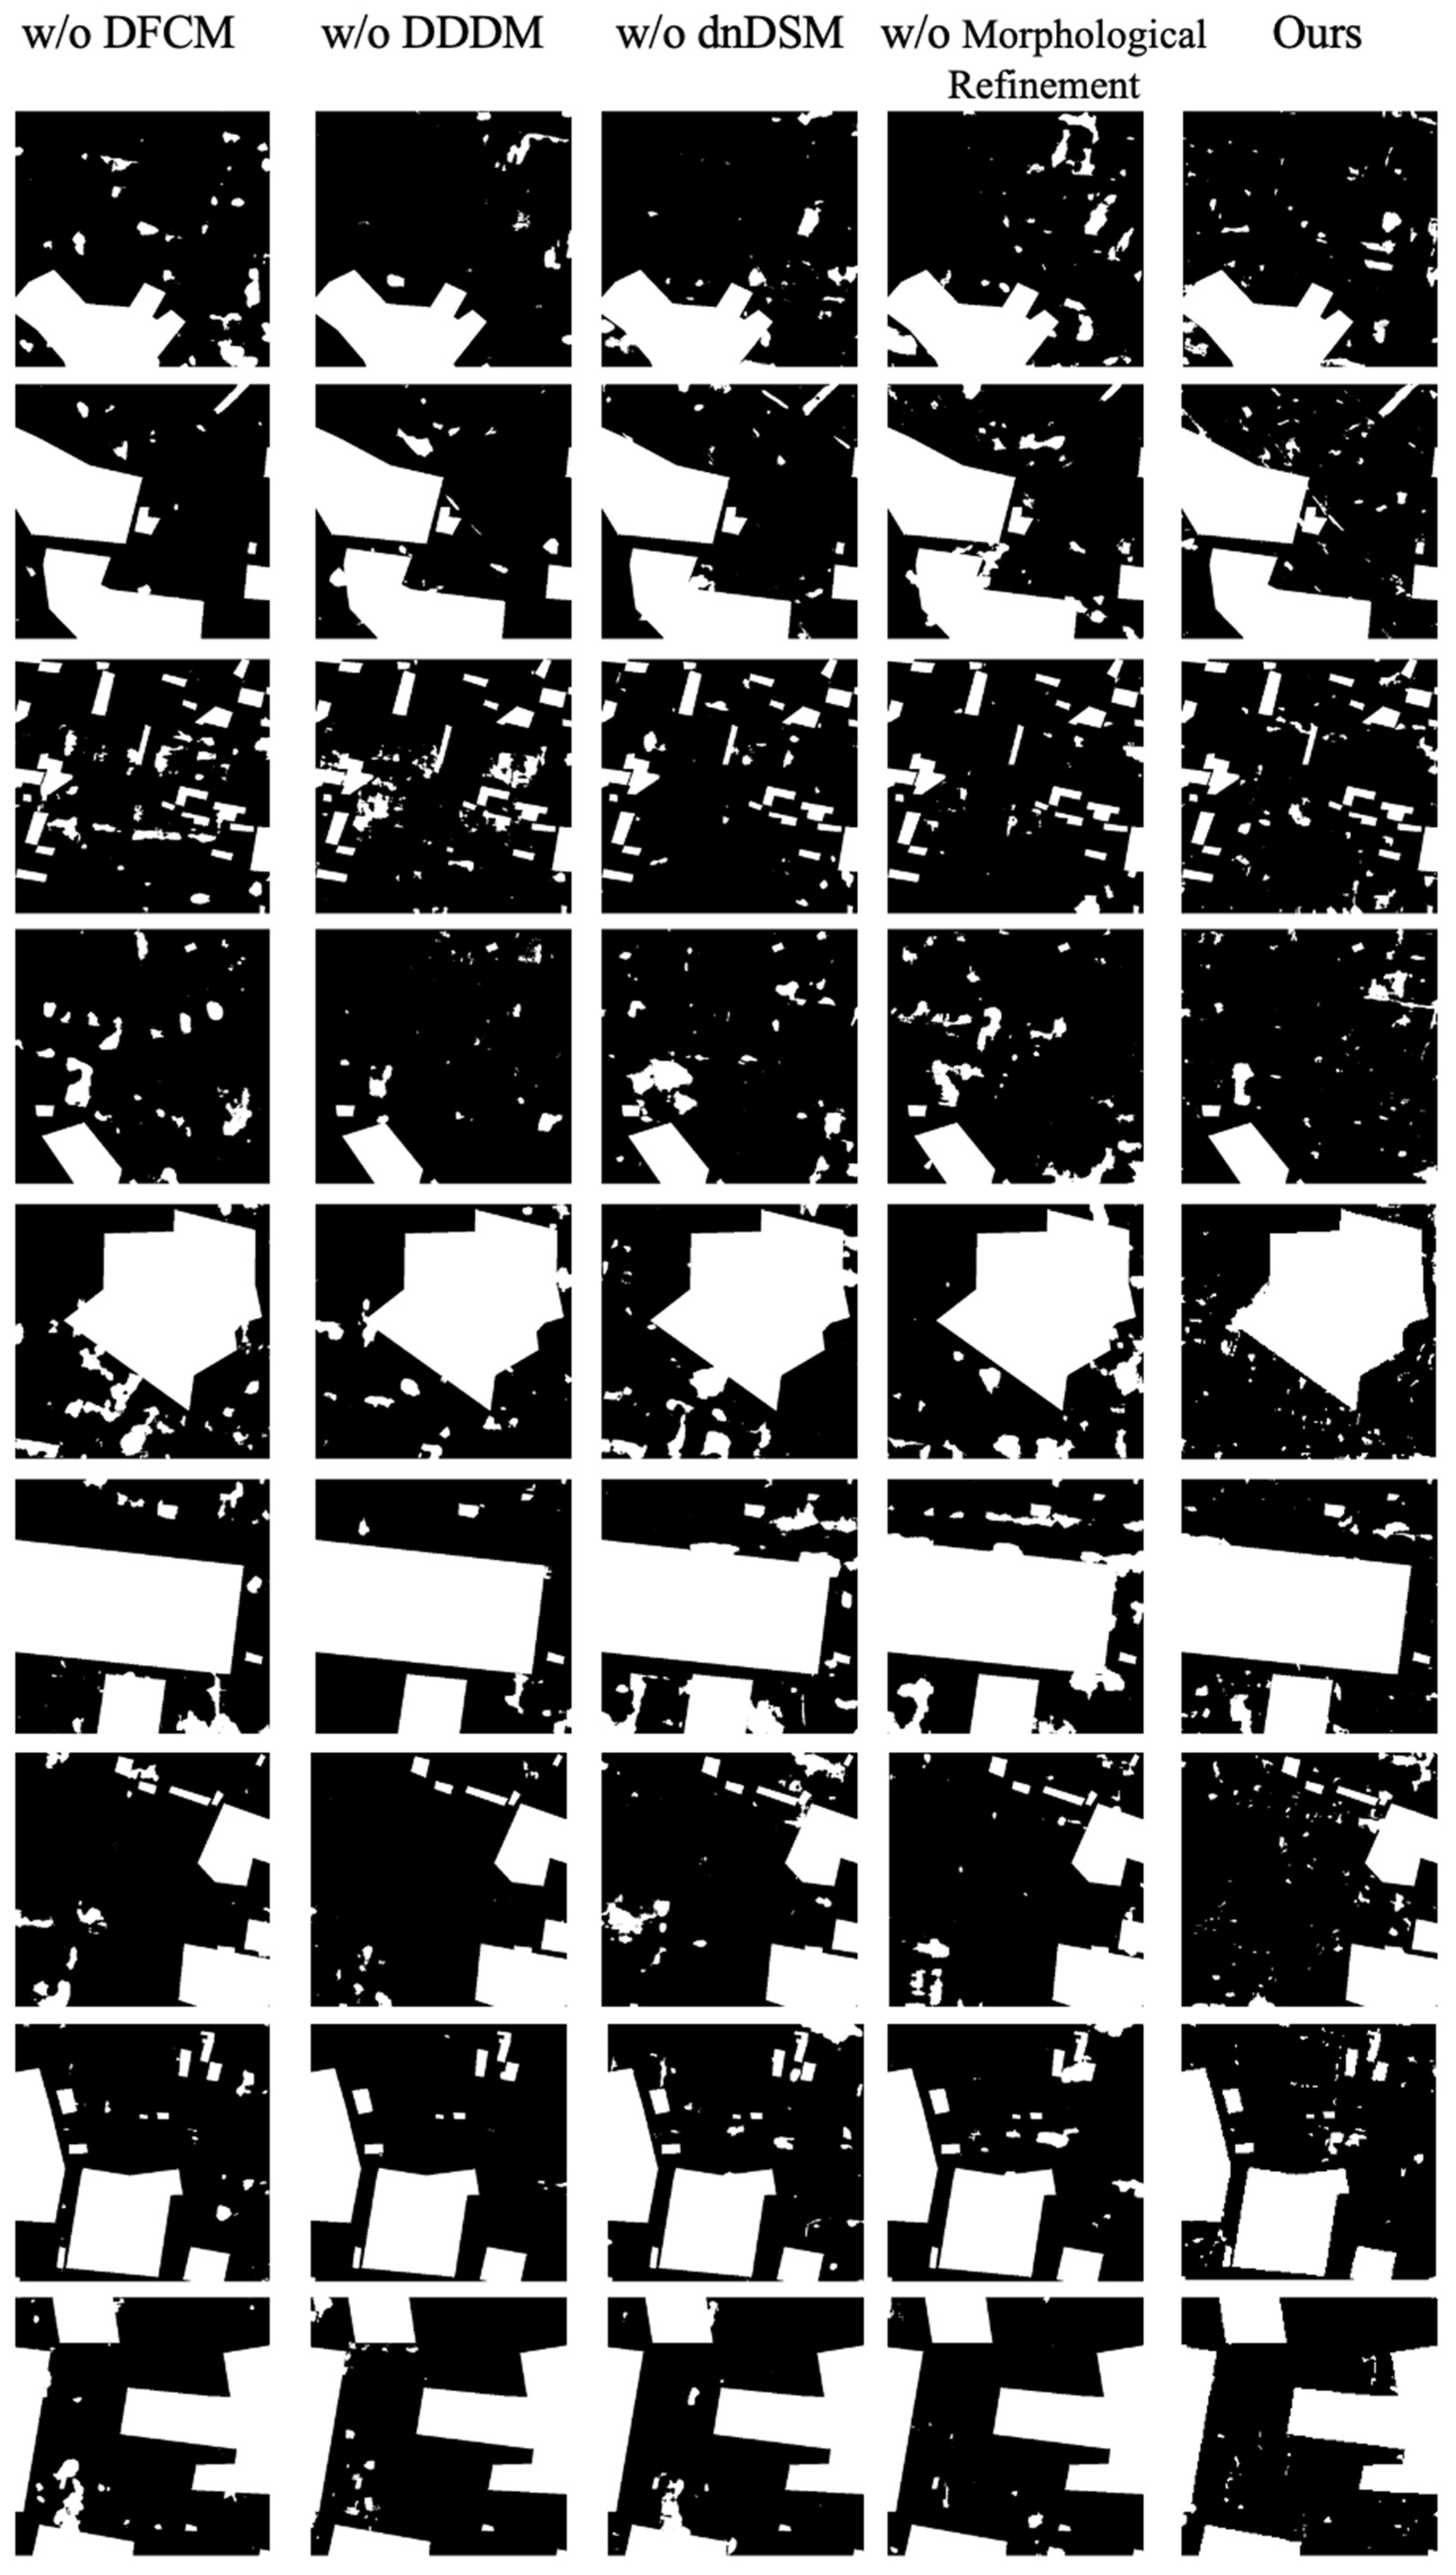
Figure 7 to illustrate the effect of different components. When the DFCM module is removed, the predictions become fragmented and noisy, with incomplete building contours. Excluding DDDM results in poor discrimination of vertical changes, leading to large false positives in flat terrain. Without dnDSM preprocessing, many subtle structural changes are missed, while the omission of morphological refinement introduces spurious regions and irregular boundaries.
By contrast, the complete DDDMNet produces coherent and accurate change masks with sharp building edges and minimal noise. These visual results are consistent with the numerical findings in
Table 3, confirming that each proposed component contributes to improved robustness and precision.
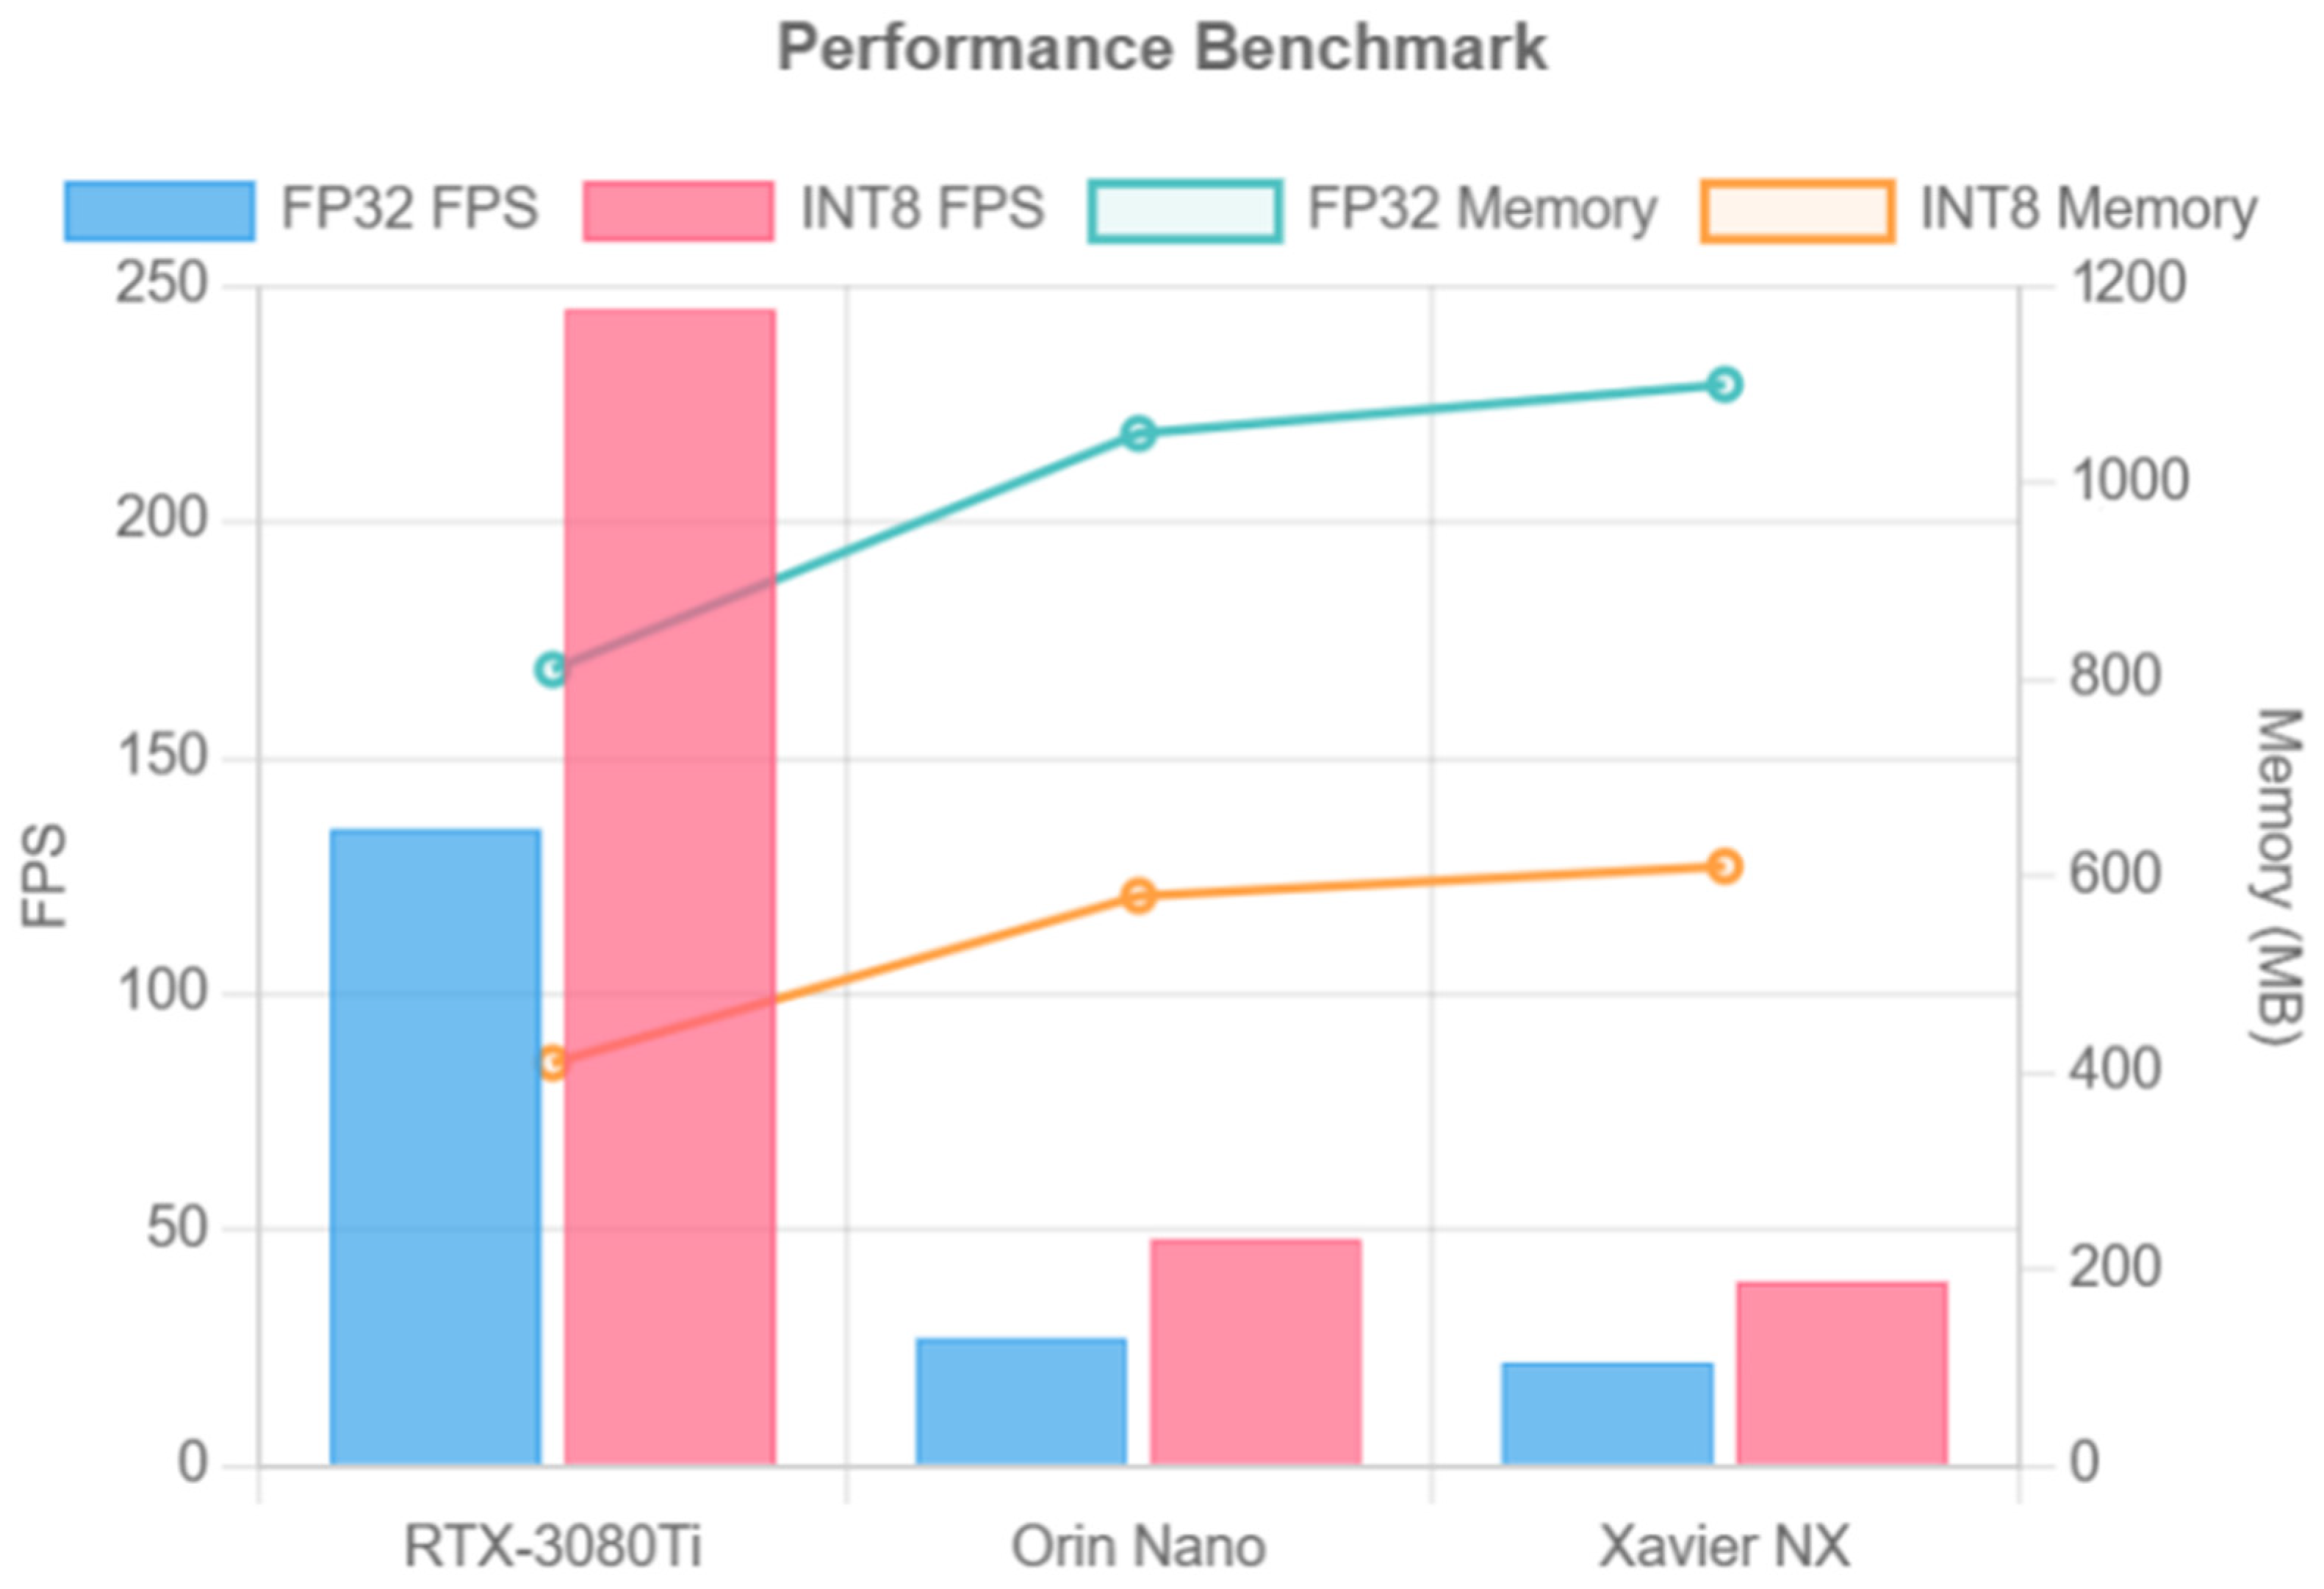
To evaluate the deployability of DDDMNet in practical monitoring scenarios, we further benchmark its inference performance on three hardware platforms with different compute capabilities: RTX-3080Ti (desktop GPU), Jetson Orin Nano (15 W embedded GPU), and Jetson Xavier NX (mobile AI module). A 256 × 256 patch is used for all tests, and both FP32 and INT8 TensorRT-optimized models are evaluated.
As shown in
Figure 8, on desktop-class hardware (RTX-3080Ti), the INT8-quantized DDDMNet reaches 245 FPS with a per-frame latency of 4.1 ms, while peak memory consumption is reduced from 760 MB (FP32) to 410 MB. This satisfies high-throughput batch processing requirements for large-scale offline deployment. On the edge device Jetson Orin Nano (15 W), the INT8 model still maintains real-time performance at 48 FPS, exceeding the common ≥30 FPS threshold used in urban monitoring systems. This verifies that the lightweight property of DDDMNet is not merely architectural but also deployment-effective. Compared with FP32 inference, TensorRT INT8 quantization provides a 1.8× speedup and ≈50% memory reduction, while keeping the F1 drop below 0.3%, indicating that the compression preserves detection quality.
In conclusion, DDDMNet provides a favorable accuracy-efficiency trade-off by incorporating multi-source and geometric priors, which is essential for real deployment scenarios rather than purely theoretical model compactness.
5.3. Robustness Experiments and Uncertainty Analysis
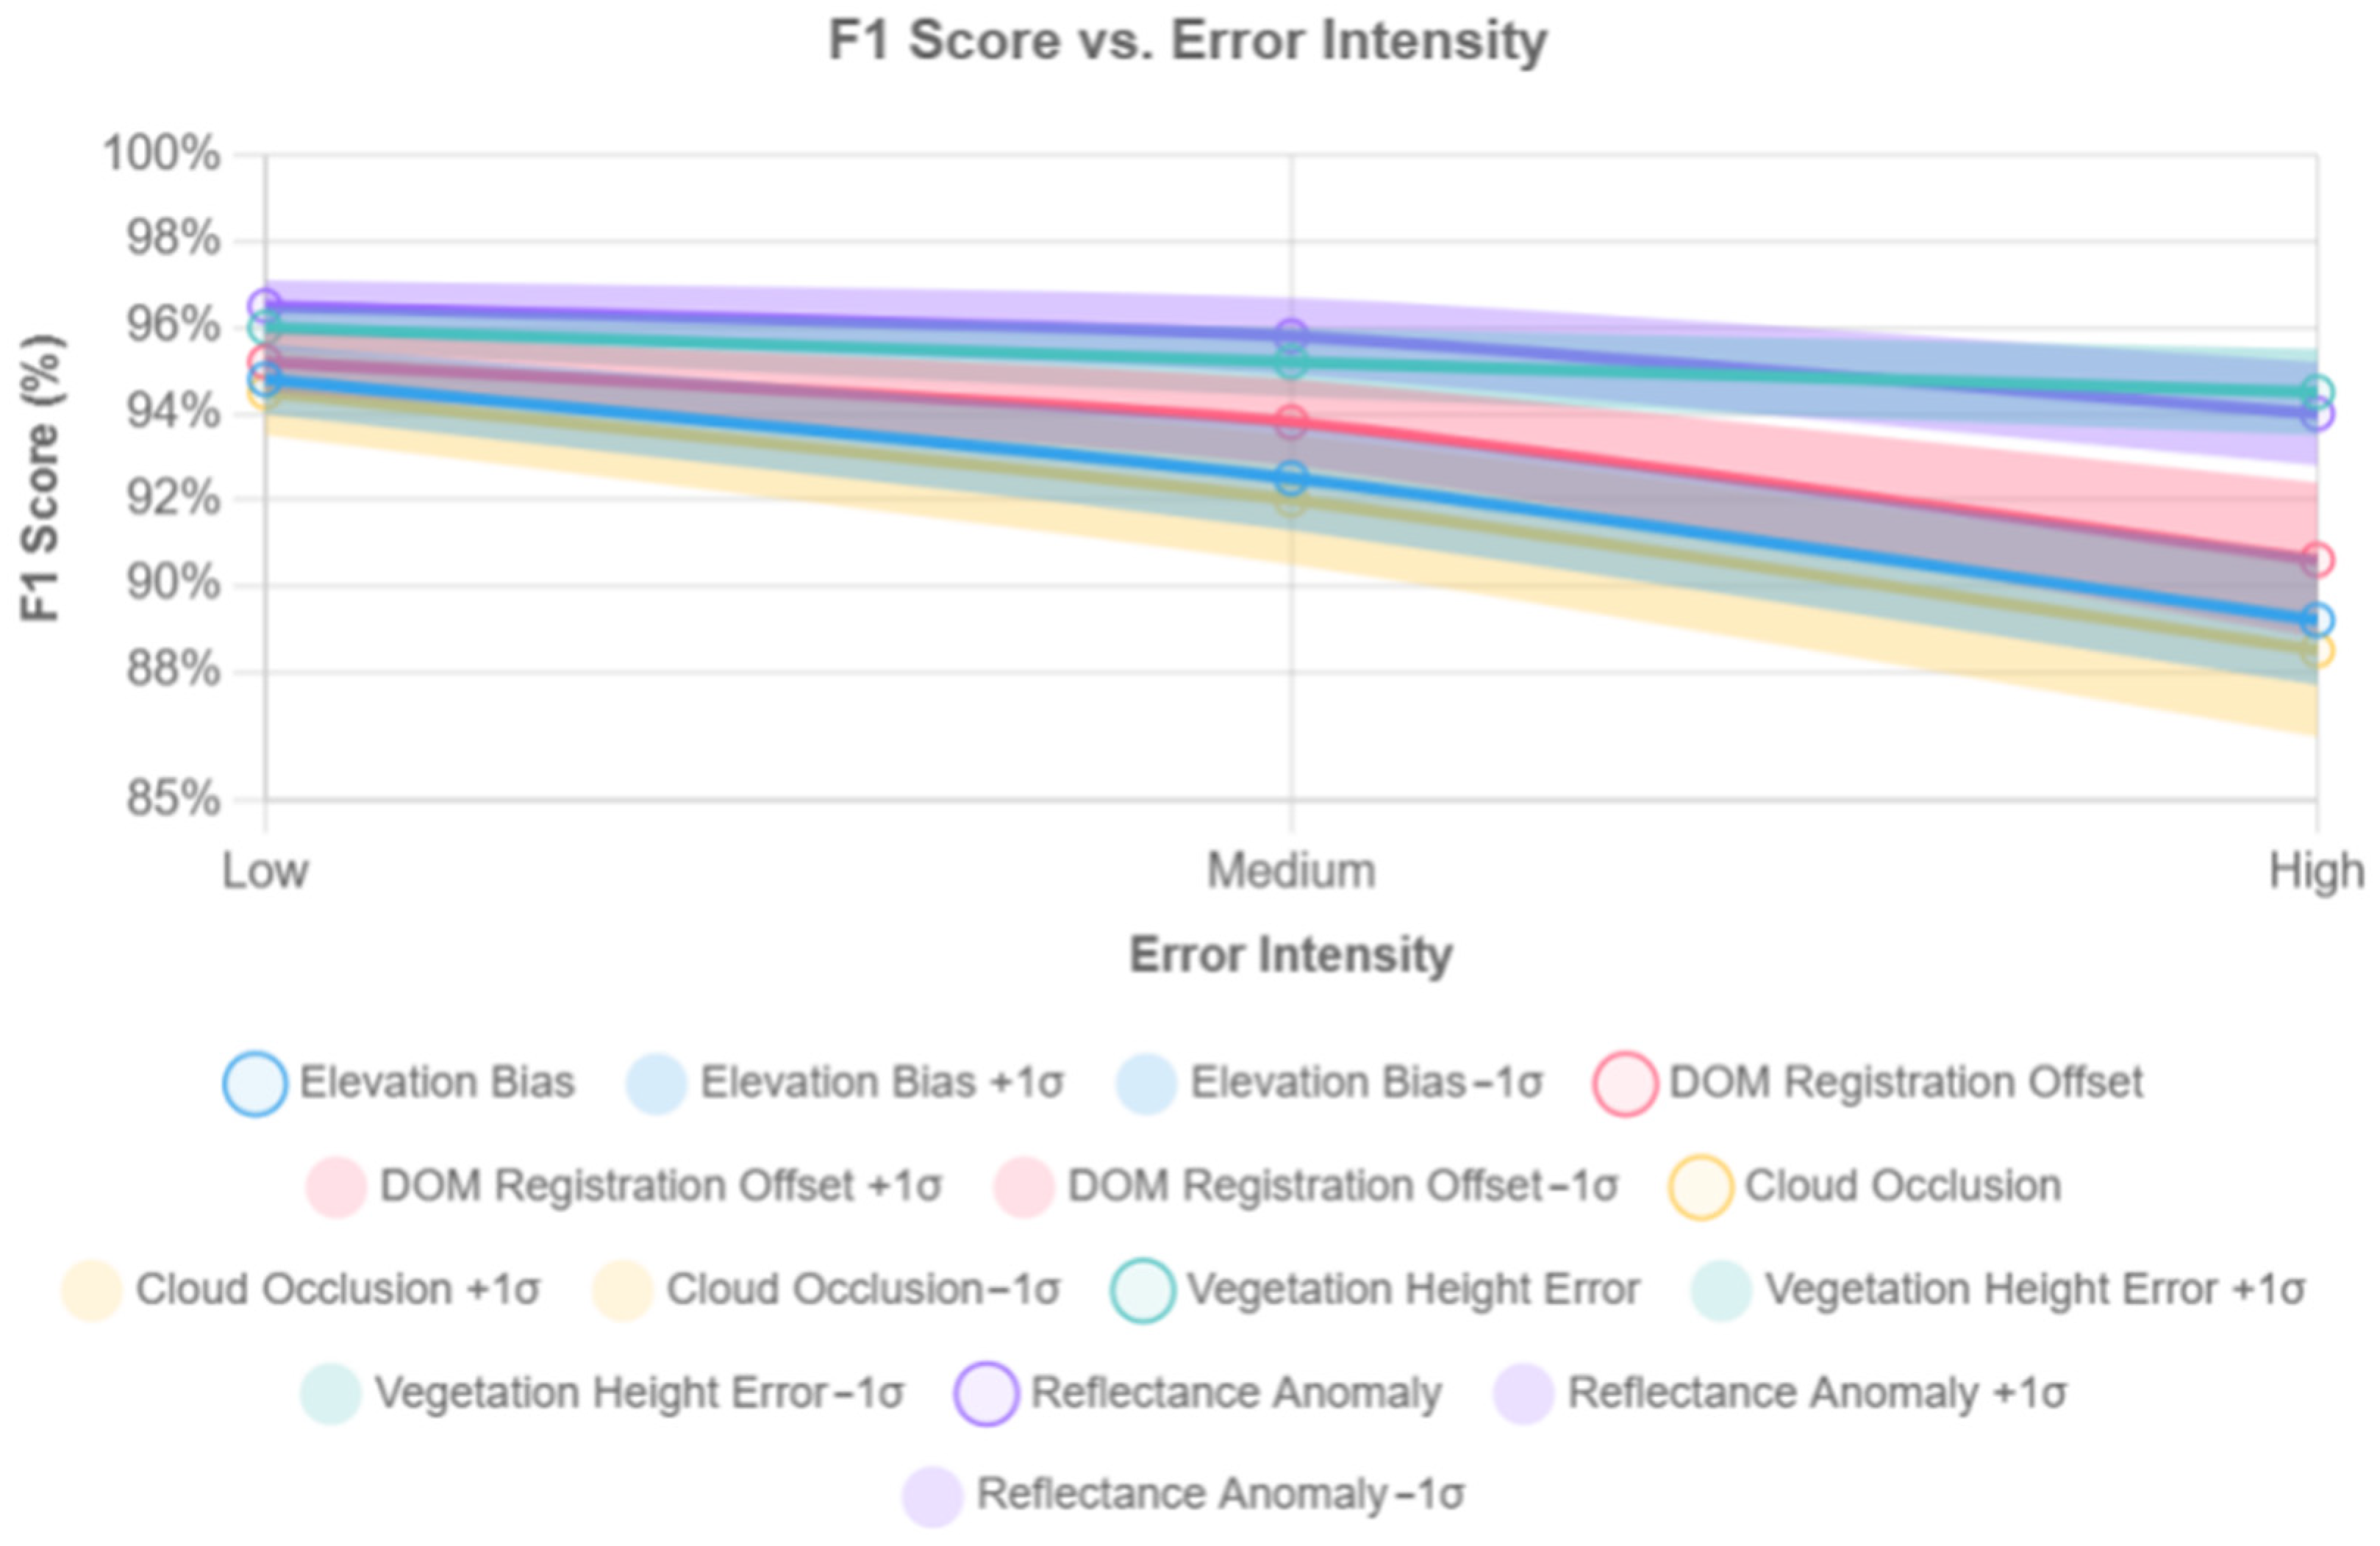
To evaluate the sensitivity of DDDMNet to data degradation commonly observed in UAV-based oblique photogrammetry, we conduct a controlled robustness study on the LEVIR-CD validation subset (1024 bi-temporal patches, 256 × 256). Five representative perturbation sources were simulated, each with three intensity levels, resulting in 15 configurations:
Elevation bias: ±0.2 m, ±0.5 m, ±1.0 m.
DOM registration offset: 1 px, 2 px, 3 px translation.
Cloud occlusion: 10%, 20%, 30% masked area.
Vegetation-induced height error: +0.2 m/+0.5 m/+1.0 m added to NDVI > 0.3 regions.
Reflectance anomaly: rooftop spectral scaling ×0.7/×1.0/×1.3.
Each setting was evaluated through 10 independent inference runs, and the averaged F1-scores with ±1σ envelopes are reported in
Figure 9.
As shown in
Figure 9, DDDMNet exhibits a smooth degradation trend as perturbation intensity increases, while remaining stable under moderate distortion. Elevation bias and reflectance anomaly result in the smallest performance decline (≤2.0% F1 drop at the highest intensity), suggesting that dnDSM normalization and dual-path spectral compensation effectively suppress global height shifts and illumination changes. Vegetation-induced height errors cause moderate degradation (−3.4% F1), indicating that NDVI masking removes most canopy outliers. Cloud occlusion yields the steepest decline (−5.8% F1 at high intensity), as both DOM and DSM cues are partially lost, confirming that geometric and spectral consistency is jointly required for reliable inference. Overall, the framework maintains F1 > 94% under low-intensity noise and F1 > 91% under medium noise, demonstrating robustness under typical UAV acquisition conditions.
To further characterize prediction reliability, Monte Carlo Dropout (T = 30) was applied to obtain pixel-wise mean and variance . The Pearson correlation between σ2 and absolute prediction error reaches r = 0.62 (p < 0.01), indicating that uncertainty maps successfully highlight high-error regions, especially around occluded rooftops and vegetation boundaries.
Based on the above observation, we introduce an optional lightweight inference-time refinement: pixels with are down-weighted using before final thresholding. Under a ±0.5 m elevation bias scenario, this reduces the false-positive rate from 5.4% to 4.2% (−22%) and improves the F1-score from 91.48% to 93.10%, without retraining or modifying network parameters. This confirms that uncertainty-aware filtering can partially compensate for DSM degradation and occlusion effects.
5.4. Discussion
The experimental results on the three urban benchmark datasets demonstrate that DDDMNet consistently outperforms representative CNN-based and attention-based change detection models, validating the advantage of coupling spectral–textural cues with normalized geometric priors. The Differential Feature Compensation Module (DFCM) reduces fragmented predictions through dual-path interactions, while the dnDSM branch explicitly encodes elevation differences that cannot be inferred from DOM alone, leading to clearer rooftop boundaries and fewer false alarms. These improvements are particularly evident in dense high-rise regions where spectral ambiguity and occlusion otherwise hinder traditional optical-only models.
In addition to accuracy, the framework also shows favorable deployment efficiency. The efficiency benchmark in
Figure 7 confirms that TensorRT INT8 quantization provides a 1.8× throughput increase and over 50% reduction in memory usage with <0.3% F1 degradation, maintaining real-time inference on Jetson Orin Nano (48 FPS) and achieving 245 FPS on desktop GPUs. This indicates that the lightweight design is preserved not only at the architectural level but also under practical edge deployment conditions, making DDDMNet a viable candidate for onboard or streaming-based monitoring systems.
With regard to robustness, the synthetic perturbation experiments show that DDDMNet remains stable under controlled elevation bias, DOM misalignment, cloud occlusion, vegetation-induced height error, and reflectance distortion, with performance degradation remaining within 2–4% F1 across high-intensity noise. This confirms that geometric priors can be safely integrated if normalization mechanisms are properly designed. In particular, the mean-normalization strategy used in dnDSM avoids dependence on global variance statistics (as required by Z-score normalization) and thus remains numerically stable under sliding-window inference. This also improves cross-region transferability, as the model does not rely on absolute elevation ranges but on relative height differences.
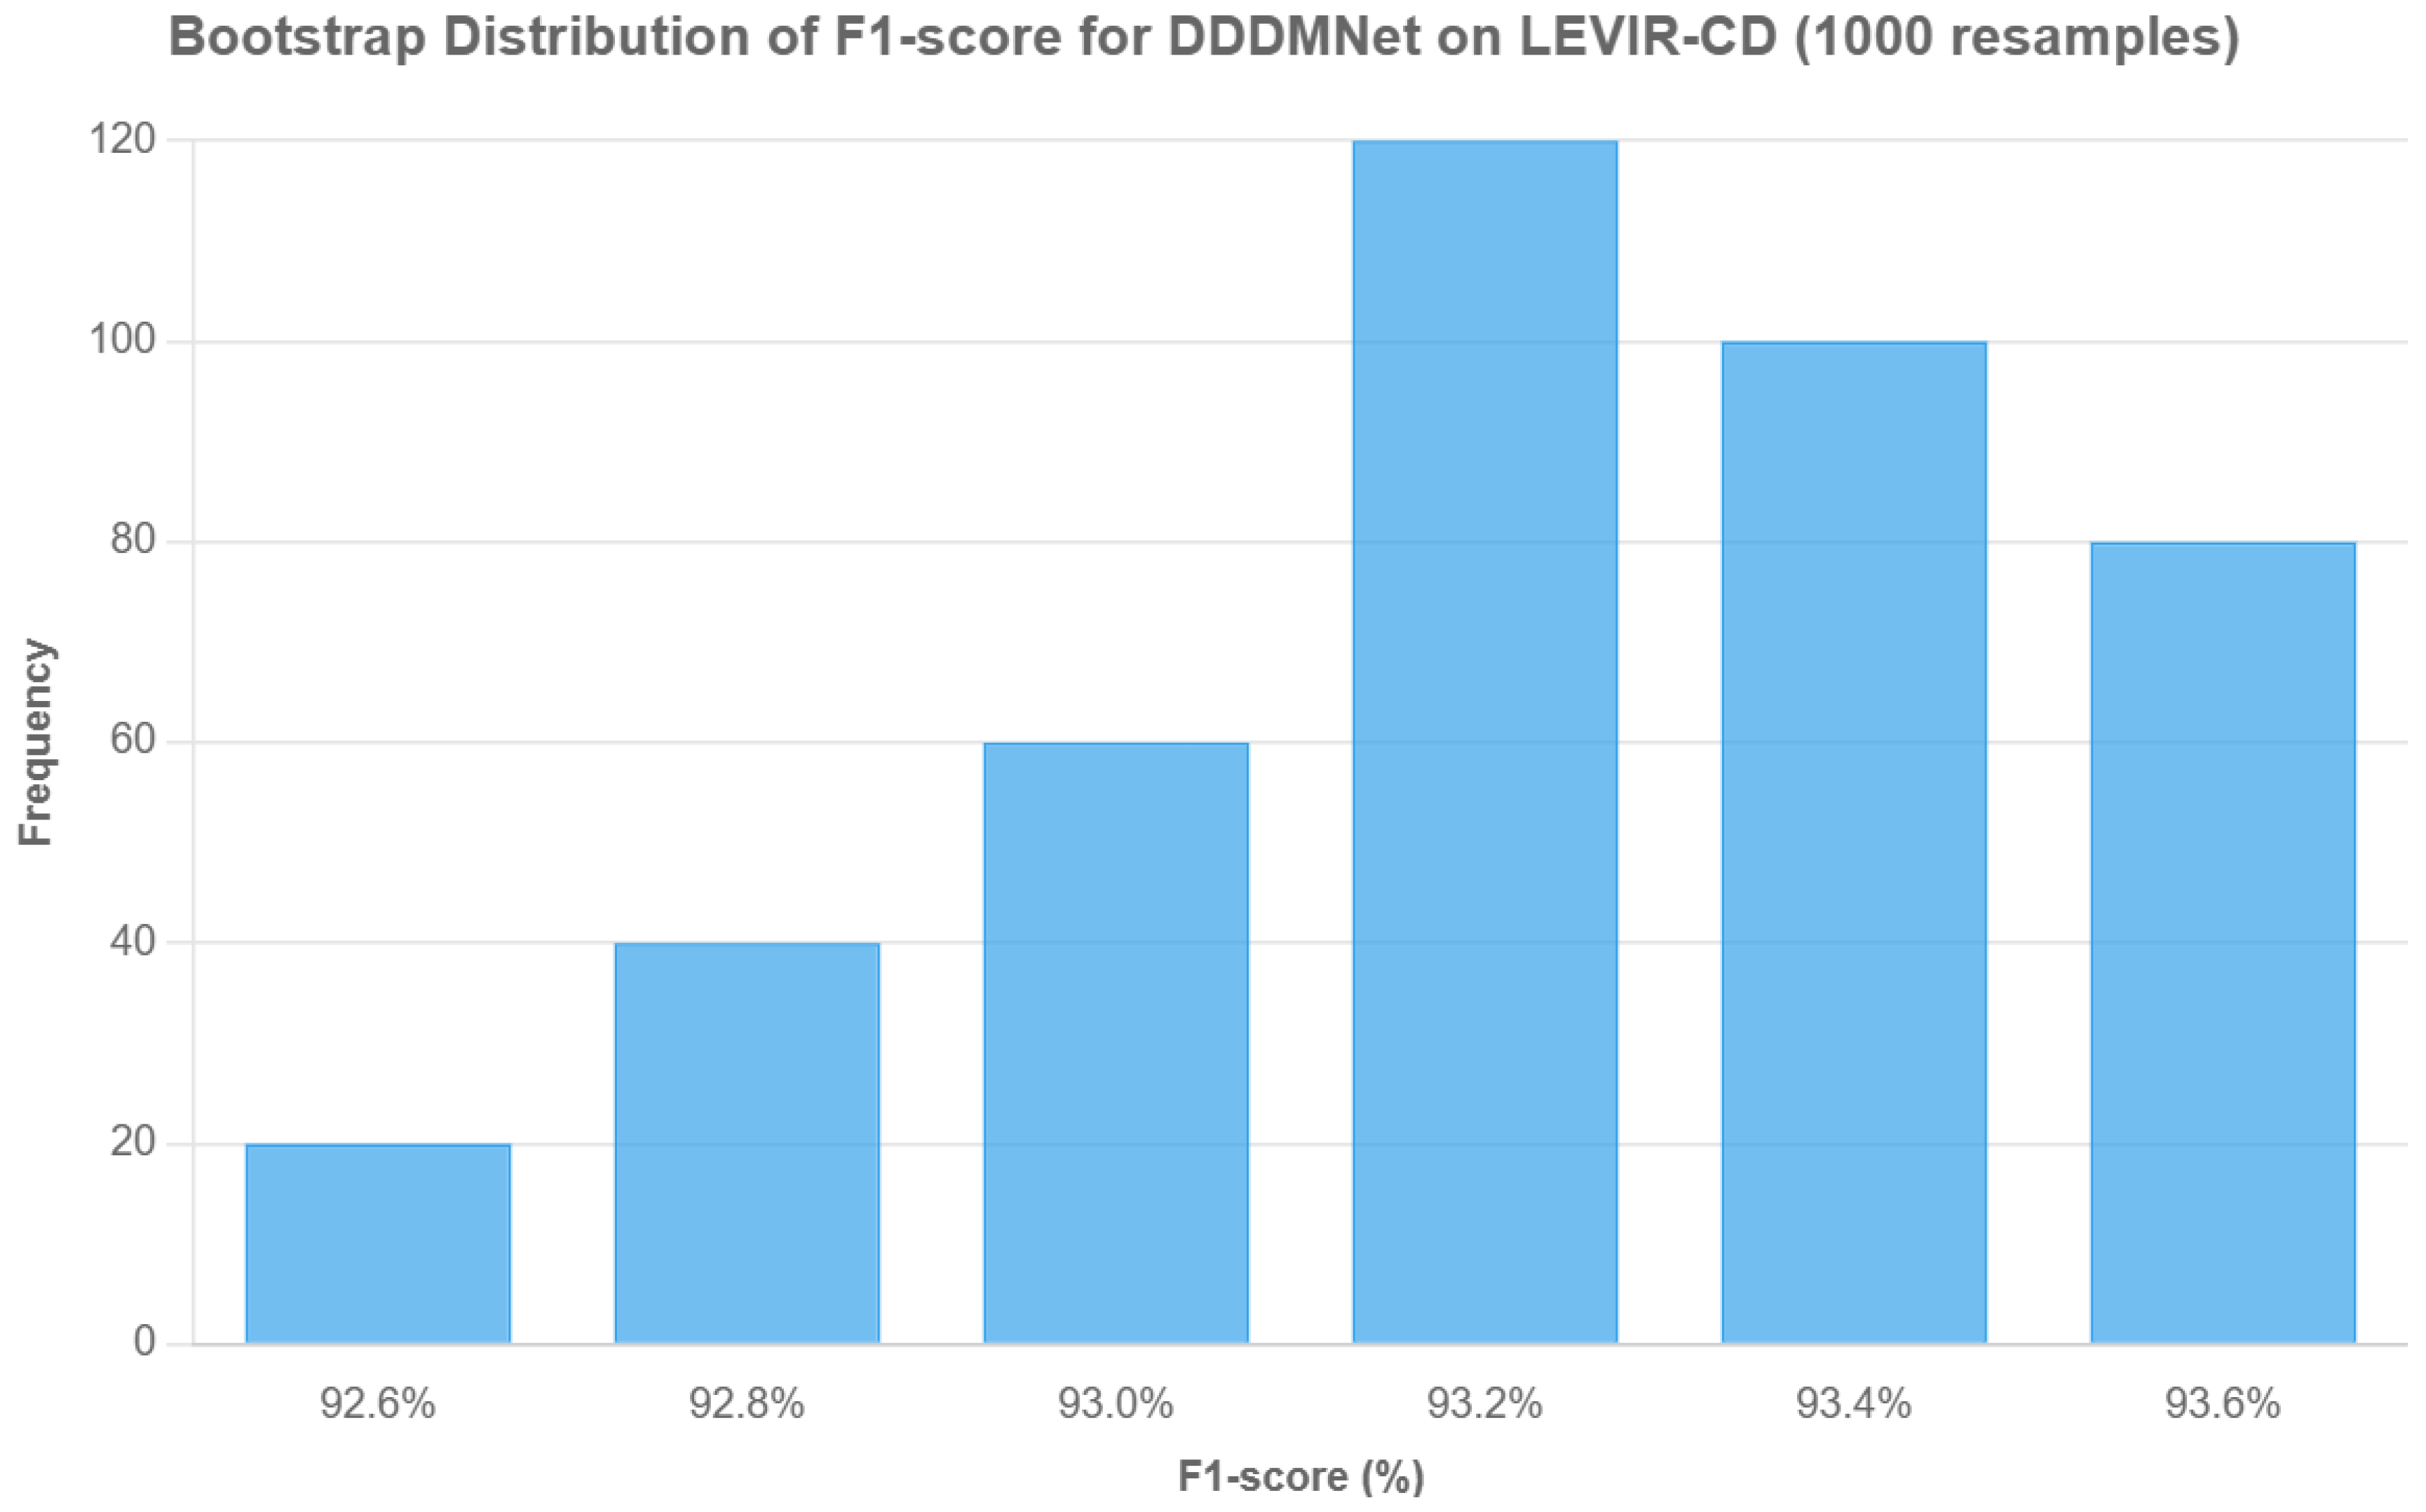
Beyond controlled perturbations, we further assessed the statistical stability of DDDMNet through bootstrap resampling on the LEVIR-CD test set. To quantify statistical confidence beyond a single-run metric, we conducted a bootstrap resampling experiment on the LEVIR-CD test set. Image-level F1-scores were sampled with replacement (1024 samples per trial, 1000 trials), and the mean F1 from each resample was computed to form the distribution shown in
Figure 10. The resulting distribution is approximately normal and tightly centered around 93.18%, demonstrating that DDDMNet maintains stable performance across different resampled subsets instead of being sensitive to a small number of outlier images. This complements the point-estimate metric and provides a more rigorous assessment of model robustness for real-world deployment.
A separate concern arises from the quality of photogrammetric reconstruction: DSM/DOM artifacts caused by occlusion, vegetation overgrowth, or surface irregularities may propagate into dnDSM and introduce false positives. To alleviate this risk in practical deployments, we outline a lightweight inference-time consistency strategy: pixels jointly exhibiting high NDVI (>0.3) and abnormal dnDSM values (|dnDSM| > τ) can be flagged as vegetation-induced height artifacts and down-weighted before decoding. This rule-based mechanism does not require model retraining and offers a feasible direction for improving resilience when surface models are partially degraded. A more systematic evaluation of this strategy under varying DSM quality levels will be conducted in future extensions of this work.
Nevertheless, several limitations still exist. As the three benchmark datasets considered in this study (LEVIR-CD, WHU-CD, DSIFN) predominantly contain dense, regular, and seasonally homogeneous urban built-up areas, they do not fully reflect more complex conditions such as irregular rooftop geometries, fragmented low-rise clusters, or vegetation-heavy environments common in informal settlements or suburban regions. While the reflectance perturbation experiment partially simulates extreme lighting differences, real multi-season benchmarks are required for conclusive validation. Furthermore, dnDSM is primarily sensitive to vertical geometric differences and may underperform in façade-level renovation or material aging scenarios that do not involve height changes. The reliance on reconstructed DSM/DOM also introduces potential bias: although a unified Pix4D pipeline was applied to all datasets, differences in reconstruction quality may affect the fairness of comparisons against RGB-only methods. Despite these limitations, the mean-normalization strategy used in dnDSM is inherently insensitive to absolute elevation and can adapt to sloped or lightweight roofs, while the NDVI-based masking and morphological kernel can be tuned without retraining—indicating potential applicability to non-typical scenes, although additional validation is required. The inference-time consistency filter proposed in
Section 5.3 alleviates vegetation-induced height anomalies, but it does not fully replace the need for high-fidelity surface models.
In addition to dataset-level perturbations, we also examined the effect of varying urban morphology on model stability. Although the three benchmark datasets used in this study primarily represent dense and high-rise urban environments, the DSIFN dataset already covers six cities with heterogeneous spatial layouts, including coastal megacities (Shanghai), inland basin cities (Chengdu), and riverfront cities (Wuhan). A single shared model achieves an F1 variation of only 1.1% across these subsets, indicating that the proposed dnDSM-based formulation is not overly sensitive to moderate differences in building density, roof geometry, or land cover composition.
For more extreme morphology shifts—such as low-rise informal settlements or hillside towns where elevation statistics differ substantially—we note that the dnDSM activation range is controlled by an externally adjustable threshold (τ_high), which can be tuned at inference time without retraining. This design allows the framework to adapt to new urban typologies with minimal overhead, and dedicated cross-morphology testing has been listed as part of future work.
Overall, the results indicate that DDDMNet offers a balanced combination of accuracy, robustness, and deployment efficiency for urban building change detection, while also revealing several directions where further improvements are both feasible and necessary. Extending the framework to additional sensing modalities (e.g., LiDAR, very-high-resolution SAR) may enhance response to non-height-based changes such as façade or material deterioration. Semi-supervised and self-supervised training strategies also hold promise for reducing annotation dependence, especially under cross-city or cross-season transfer. Finally, future work will aim to conduct controlled reconstruction-bias studies and to evaluate the model on multi-season and irregular settlement datasets, supporting continuous 4D urban monitoring in real-world digital twin systems.
6. Conclusions
This study presents DDDMNet, a lightweight change detection framework designed for multi-source urban monitoring based on UAV-derived photogrammetry. To address the limitations of purely spectral methods in capturing structural variations, the proposed network introduces three key components: a Differential Feature Compensation Module (DFCM) for enhanced temporal differentiation, a DSM Difference Normalization Module (DDDM) for explicit geometric priors, and a morphology-guided refinement step that improves rooftop boundary integrity. Experiments on three public benchmark datasets (LEVIR-CD, WHU-CD, DSIFN) and UAV oblique imagery confirm that DDDMNet outperforms current state-of-the-art methods, achieving higher F1-scores and reduced false alarms while maintaining sub-2M parameters and real-time deployability.
Ablation studies further demonstrate the effectiveness of each module, while robustness experiments indicate resilience to elevation noise, misalignment, reflectance distortion, and vegetation-induced height errors. The mean-based dnDSM formulation proves more stable than variance-based alternatives during sliding-window inference, facilitating cross-region transfer without reliance on fixed elevation scales. These findings position DDDMNet as a promising candidate for scalable, on-device urban change monitoring.
However, several challenges remain unresolved. The performance of DDDMNet still depends on the fidelity of surface reconstruction, and the current evaluation settings primarily reflect dense, seasonally homogeneous urban areas. Additionally, the dnDSM branch is intrinsically sensitive to vertical changes and may fail to capture façade-level or material-only modifications. Addressing these issues will be crucial for moving toward long-term, high-frequency change detection in realistic urban environments.
Future work will extend the framework along three directions.
First, at the sensing and data level, we will incorporate additional modalities such as LiDAR and very-high-resolution SAR to improve responsiveness to façade-level and material-related changes, and conduct cross-season evaluations using explicit phenological datasets (e.g., SEN12MS-CR, UAV-based leaf-on/leaf-off surveys) to validate robustness under illumination and vegetation-state shifts.
Second, at the scene level, we will explicitly evaluate DDDMNet in more complex or non-typical urban environments such as low-rise, irregular, or vegetation-heavy settlements, using datasets including IrReg-CD, WHU-LeafON, and AI4InformalSettlement. Such evaluations are expected to assess the generalizability of mean-normalized dnDSM and NDVI-based masking under scenarios where geometric priors become less discriminative.
Third, at the deployment level, we will explore model compression, quantization-aware training, and controlled DSM degradation experiments to evaluate resilience against surface-model quality fluctuations and further reduce inference latency and memory usage. These controlled robustness studies will complement the perturbation analysis and support deployment in edge-based or real-time 4D digital-twin systems across heterogeneous regions.
In summary, the results demonstrate that integrating normalized elevation priors and spectral features within a compact, modular architecture offers an accurate and deployable solution for high-precision urban building change detection, while also providing a foundation for extending 3D-aware monitoring across diverse spatial and temporal contexts.
