Abstract
Rational location planning of express delivery stations (EDS) is crucial for enhancing the quality and efficiency of urban logistics. The spatial heterogeneity of logistics demand across urban areas highlights the importance of adopting a scientific approach to EDS location planning. To tackle the issue of strategy misalignment caused by heterogeneous demand scenarios, this study proposes a continuous location method for EDS based on multi-agent deep reinforcement learning. The method formulates the location problem as a continuous maximum coverage model and trains multiple agents with diverse policies to enable adaptive decision-making in complex urban environments. A direction-controlled continuous movement mechanism is introduced to facilitate an efficient search and high-precision location planning. Additionally, a perception system based on local observation is designed to rapidly capture heterogeneous environmental features, while a local–global reward feedback mechanism is established to balance localized optimization with overall system benefits. Case studies conducted in Fuzhou, Fujian Province and Shenzhen, Guangdong Province, China, demonstrate that the proposed method significantly outperforms traditional heuristic methods and the single-agent deep reinforcement learning method in terms of both coverage rate and computational efficiency, achieving an increase in population coverage of 9.63 and 15.99 percentage points, respectively. Furthermore, by analyzing the relationship between the number of stations and coverage effectiveness, this study identifies optimal station configuration thresholds for different urban areas. The findings provide a scientific basis for investment decision-making and location planning in EDS construction.
1. Introduction
With the rapid development of e-commerce, online shopping has become the dominant mode of consumption. In China, for instance, the e-commerce transaction volume surged from 6.1 trillion CNY in 2011 to 43.8 trillion CNY in 2022, representing an average annual growth rate of 17.9% []. The explosive growth of transaction volume has brought unprecedented delivery pressure to the logistics system. The surge in order quantity and the diversification of last-mile delivery demands have not only spurred the rapid development of emerging logistics technologies such as parcel lockers and drone delivery, but also put forward higher requirements for express delivery stations (EDS)—the core nodes of urban logistics networks.
As core infrastructure of this evolving logistics ecosystem, the location and layout of EDS significantly influence the operational efficiency and service quality of logistics systems. In practice, logistics services exhibit pronounced spatial heterogeneity in terms of population density, delivery volume, and spatial structure [], resulting in a markedly uneven distribution of EDS demand across different regions []. This spatial heterogeneity places heightened demands on the service coverage and spatial allocation of EDS, underscoring the necessity for scientifically rigorous location planning methods.
Currently, the EDS location problem can be formulated as either a discrete or continuous location model []. While discrete models limit facility placement to a finite set of predetermined candidate points, continuous models allow facilities to be positioned anywhere within the study area, offering greater spatial flexibility. Given that continuous models can more accurately capture spatially heterogeneous demand patterns and achieve superior service coverage, this study adopts a continuous modeling framework for EDS location planning.
For solving location problems, three main approaches exist: mathematical programming [], heuristic methods, and reinforcement learning (RL). Mathematical programming guarantees optimal solutions but faces scalability challenges due to exponential computational complexity in large-scale problems. Heuristic methods offer computational efficiency but rely on manually designed search strategies, limiting their adaptability to heterogeneous spatial scenarios []. Reinforcement learning, in contrast, autonomously learns optimal policies through environmental interactions, demonstrating superior adaptability without requiring explicit problem formulations [,]. Given the complexity of continuous EDS location problems and the need to accurately address spatially heterogeneous demand, this study employs RL for its robust adaptive problem-solving capabilities.
Existing RL-based location planning methods predominantly employ single-agent architectures []. However, single-agent reinforcement learning (SARL) struggles with spatially heterogeneous scenarios and lacks the policy expressiveness and convergence efficiency required for distributed, collaborative decision-making in urban EDS networks [,]. Therefore, a multi-agent method is essential.
To address the challenges of spatial heterogeneity and computational complexity in EDS location problems, this study models the problem as a continuous maximum cover-age location problem (CMCLP) and proposes a multi-agent reinforcement learning (MARL) method for its solution. The method deploys multiple agents with different policies for distributed decision-making, effectively expanding the diversity of location policies and enhancing adaptability to different demand scenarios. Through collaborative decision-making among multiple agents, the algorithm’s operational efficiency is significantly enhanced. Empirical experiments show that the proposed method exhibits superior performance compared to SARL methods and heuristic methods in CMCLP for EDS, efficiently generating high-quality spatial layout solutions for EDS networks. Furthermore, we quantify the marginal effect relationship between EDS investment and service coverage, providing references for the construction quantity and location planning of EDS.
The major contributions of this paper are as follows:
(1) We propose a MARL-based continuous location (MARL-CL) method which trains multiple agents to master different location policies and collaboratively accomplish facility location tasks with heterogeneous demand distribution scenarios. By decomposing the decision sequences into multiple agents, the approach significantly simplifies decision complexity while enhancing the efficiency and quality of location decisions.
(2) An agent spatial movement scheme for the CMCLP of EDS is designed. The scheme controls the continuous movement of EDS in space toward predetermined directions while progressively halving the movement step size during the process. The strategy ensures efficient and comprehensive exploration of a continuous space while achieving high-precision planning for EDS location.
(3) We design an agent environmental perception and reward feedback mechanism for heterogeneous demand distribution scenarios. Agents perceive and focus on surrounding environmental information through local observations to improve training efficiency. A reward model combining local and global components is designed to encourage the multi-agent system to balance local optimization with global location benefits, helping to avoid local optimal solutions while continuously optimizing the global location scheme.
2. Literature Review
This section reviews the EDS location problem by assessing its two core components: problem modeling and solution methods. We analyze the evolution from discrete to continuous models and the characteristics of current methods, including mathematical programming, heuristic methods and RL.
Currently, the EDS location problem is commonly modeled using discrete location models, such as the set covering model [] or the maximum coverage location model []. These well-established approaches discretize continuous geographical space into a finite set of candidate points for facility location decisions. This discretization strategy has proven effective in many applications, offering computational tractability and ease of implementation. Nevertheless, in scenarios involving highly heterogeneous demand distributions or complex geographical constraints, the spatial resolution of the candidate set may affect solution accuracy [,].
Recognizing the trade-off between computational efficiency and spatial precision, researchers have developed continuous formulations such as the CMCLP []. This alternative modeling approach allows facility locations to be determined anywhere within continuous space, offering enhanced spatial flexibility for representing real-world geographical and environmental constraints while potentially requiring more sophisticated solution techniques.
Regarding the solution methods to location problems, mathematical programming methods solve for global optimal solutions through precise mathematical techniques []. For instance, Feng et al. proposed a mixed-integer linear programming model to solve container terminal location problems []; Liu et al. combined multi-criteria decision-making and multiple centrality assessment methods to construct a multi-objective integer programming model for determining the optimal number, locations, and service coverage of EDS []; Kumar and Mishra employed neuromorphic mixed-integer linear programming models to address EDS layout problems under uncertain environments []. However, when dealing with large-scale location problems, the solution time of mathematical programming methods increases exponentially, presenting computational complexity challenges. So, such methods are generally suitable for small-scale problems [,].
Heuristic methods utilize problem characteristics and empirical information to guide the search process toward rapidly approximating superior solutions, significantly enhancing solution efficiency and becoming the mainstream approach for solving EDS location problems. Recent research has demonstrated a trend toward hybrid strategy integration. Ottaviani et al. combined mixed-integer linear programming with greedy algorithm to propose an efficient integrated framework for parcel locker location problems []; Kahalimoghadam et al. integrated the global search capability of genetic algorithm with the high-quality local solutions of the Teitz-Bart algorithm []; Ceschia and Schaerf incorporated multi-neighborhood search and spatial reduction strategies into simulated annealing []; Andaryan et al. enhanced the optimization effectiveness of logistics hub location models with stochastic demand by embedding local improvement mechanisms within tabu search [].
Regarding the influencing factors of EDS location problems, some research has placed greater emphasis on modeling and handling practical constraints. For instance, Cui et al. constructed a distribution center location model considering uncertain demand and node capacity scalability which is solved by particle swarm optimization []; Zhou et al. employed scatter search methods with customer satisfaction as the core evaluation metric to optimize the location and allocation schemes for parcel lockers []. Heuristic methods demonstrate strong global exploration capabilities, though the quality of solutions in complex geographical and constrained environments can show considerable variation, with tendencies toward local optima. Additionally, algorithm parameter settings notably influence performance, and there may be limited systematic support for complex heterogeneous scenarios [].
In recent years, RL has been gradually been introduced for the solution of urban facility location problems due to its advantages in sequential decision-making and adaptive spatial optimization [,]. RL constructs interaction mechanisms between agents and environments, using reward signals to drive policy optimization, which can effectively handle uncertainty and complexity in a large solution space []. Each candidate location is modeled as a node in the state space, and agents gradually improve the overall performance of location policies by learning spatial relationships between nodes, service allocation patterns, and coverage overlap situations [,]. RL shows promising adaptability and solution space exploration capabilities when dealing with complex urban systems [].
Some studies demonstrate that through continuous interaction between agents and environments, facility location problems involving practical factors such as diverse demand distribution and regional characteristic differences can be effectively addressed, showing superior adaptability [] and convergence efficiency [] compared to traditional methods. For example, Wang et al. used attention mechanism encoders to capture interaction relationships between demand points and facility points, and employed decoders to output probability distributions for facility selection, generating feasible solutions through greedy strategies []. Su et al. proposed a knowledge-guided graph neural network RL method that effectively learns urban network topological structures, significantly improving the generation efficiency of large-scale urban facility layout schemes []. Zheng et al. developed a graph neural network-based RL model that can generate spatial planning solutions adapted to different geographical environments and demand patterns []. Zhang et al. constructed an emergency shelter location model, IAM-PPO, using RL methods to determine optimal shelter location solutions [].
Furthermore, end-to-end RL methods have shown significant advantages in spatial planning problems. Zhong et al. proposed the ReCovNet model that integrates multi-source information including geographical, coverage, and traffic data, and achieved integrated modeling from raw data to location decisions []. Heinbach et al. proved that RL can optimize facility layouts using only regional layout images and reward signals, showing strong representation learning capabilities []. Liang et al. introduced SpoNet, which combines location problem characteristics with deep learning models to improve the efficiency and quality of urban spatial decision analysis []. This research provides new approaches and methodological support for solving spatial continuous optimization problems in EDS location.
However, the single-agent architecture remains inadequate in addressing spatially heterogeneous demand distribution challenges, struggling to cope with complex heterogeneous scenarios. The policy expression capacity and convergence speed fail to meet the practical demands of distributed and collaborative decision-making in modern urban EDS networks layout [,]. Therefore, further expansion towards multi-agent and distributed decision-making is imperative.
In summary, current modeling approaches for the EDS location problem can be categorized into discrete and continuous models, while solution methods include mathematical programming, heuristic methods, and RL. Given the requirements for high spatial precision in complex urban environments and the need for adaptive algorithms capable of handling heterogeneous scenarios, this study adopts a continuous modeling framework combined with RL. However, current RL applications predominantly rely on single-agent architectures, which face limitations in effectively addressing spatial heterogeneity and enabling collaborative decision-making. To overcome these limitations, this study proposes a MARL framework for continuous EDS location planning, designed to effectively optimize station layouts in spatially heterogeneous urban scenarios.
3. Methodology
This study employs a continuous location model to formulate the EDS location problem, enabling precise responses to heterogeneous demand distributions. A MARL framework is constructed, where multiple EDS agents are trained to learn diverse location policies and a collaborative mechanism is designed to address combinatorial location problems in heterogeneous scenarios. Each EDS agent is built using an actor-critic architecture, with the Proximal Policy Optimization (PPO) algorithm [] employed to ensure stable policy updates, thereby guaranteeing steady iterative optimization of the multi-agent system and generating high-quality EDS location planning solutions.
3.1. Problem Modeling
This study focuses on residential delivery services (B2C e-commerce), where EDS primarily serve individual consumers. To explore the optimal location scheme with the utmost precision, the continuous maximum coverage model (CMCM) is employed to formulate the EDS location problem. The objective is to determine EDS locations in continuous space to maximize the population coverage within their service area.
Specifically, in the continuous space, the set is composed of residential points:
where represents the coordinates of the residential point , represents its population. The set is composed of EDS:
where represents the coordinates of DES , and represents its service radius. If the distance between the station and the residential point is less than or equal to , then station is considered capable of serving residential point .
The object function of the CMCM can be formulated as:
where represents the set of the coordinates of EDS. This optimization model aims to determine the spatial coordinates of the EDS, such that the population of residential points covered by the stations’ service area is maximized.
3.2. MARL Framework for EDS Location
Based on the CMCM for EDS, this study proposes a MARL framework, as shown in Figure 1. For each EDS, there is an agent that controls its movement within the continuous space to accomplish the location task. Each agent consists of an actor network that outputs the movement action of the agent to control the displacement of the station and a critic network that evaluates the state of the agent by estimating its state value.
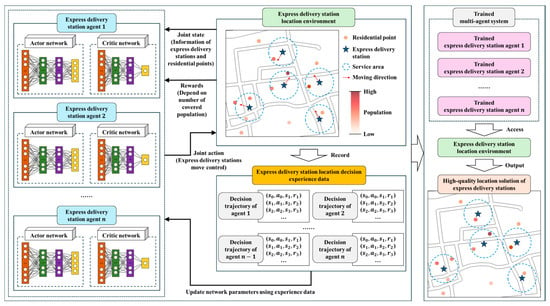
Figure 1.
MARL framework for EDS.
Each EDS agent obtains the state of its own station, neighboring stations, and residential points from the environment. By controlling the movement of the station, the agent interacts with the location environment, updates the state information, and obtains a reward based on the population covered by the station’s service area. The greater the population covered within the station’s service area, the higher the reward value the agent receives. By collecting the trajectory (experience data) from the sequential decisions made by all agents while controlling the movement of their stations in the environment, and conducting multiple rounds of learning, the parameters of actor and critic networks are updated. Through this process, each agent gradually improves its actor network to learn effective station placement policy and its critic network to develop a reasonable value assessment system for station locations. Thus, through multi-agent collaboration, it generates a high-quality EDS location planning solution.
3.2.1. Agents’ Perception Strategy
For the heterogeneous demand distribution scenario in continuous space, we design an environmental perception strategy for each EDS agent. Specifically, as shown in Figure 2, the state space of agent is designed as:
where represents the coordinate of the agent, represents the set of distances between the agent and nearest residential points, represents the set of distances between the agent and nearest agents, represents the set of population values at the nearest residential points to the agent, where populations at residential points within EDS service coverage are set to zero.
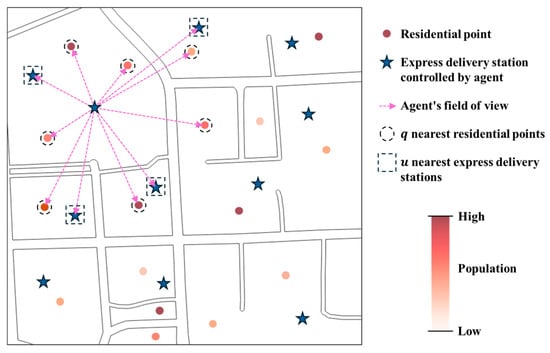
Figure 2.
Observation field of EDS agents.
This design ensures that agents focus on perceiving their surrounding environment and make decisions based on this information. So, it avoids the problem of excessively large state space dimensions caused by observing global complex heterogeneous environmental information. Such large dimensions would make it difficult for neural networks to quickly capture key features, leading to difficulties in training location decision neural networks and challenges in addressing heterogeneous demand distribution scenarios.
3.2.2. Agents’ Spatial Movement Scheme
For the continuous spatial location problem of EDS, an agent spatial movement scheme is designed to control the continuous movement and location of stations. Specifically, for each agent, the action space is represented as:
where , , , individually represent moving in the northwest, northeast, southwest, and southeast directions, respectively. During the movement control of the EDS, the step size at each current time step is set to half of that in the previous time step. In this way, the movable range of stations is gradually reduced during the process of controlling EDS movement, thereby achieving high-precision positioning of stations.
This design ensures that EDS can obtain high-precision continuous spatial location results using only a small number of location decision steps. Meanwhile, it theoretically guarantees that EDS can access any point in continuous space, ensuring that the searchable range during the location planning solution process can cover the entire solution space.
3.2.3. Agents’ Reward Feedback Mechanism
To coordinate the location planning of EDS and obtain high-quality location schemes, we design an agent reward feedback mechanism. Specifically, the reward model is defined as:
where represents the local reward which is determined by the population covered by the service area of the station agent, and represents the global reward calculated as the average of the rewards of all agents. If an agent’s local reward is 0, it does not participate in the distribution of global rewards. This can effectively suppress agents’ free-riding behavior of not contributing.
When multiple station agents’ service areas cover the same residential point, the reward for covering that point is assigned to the agent which is closest to it. The coefficients and represent weight parameters that balance the agent’s emphasis between the local reward and the global reward.
This reward mechanism encourages each agent to improve its own location performance while also promoting global optimization, which not only ensures efficient search for high-quality solutions but also avoids premature convergence to local optima.
3.3. MARL-CL Method Flow for EDS Location
For EDS location problem, we propose a station location method based on the MARL framework. The method employs MARL to train multiple agents in learning high-quality location policies, to achieve continuous maximum coverage planning for EDS. As shown in Figure 3, the specific computational procedure is as follows:
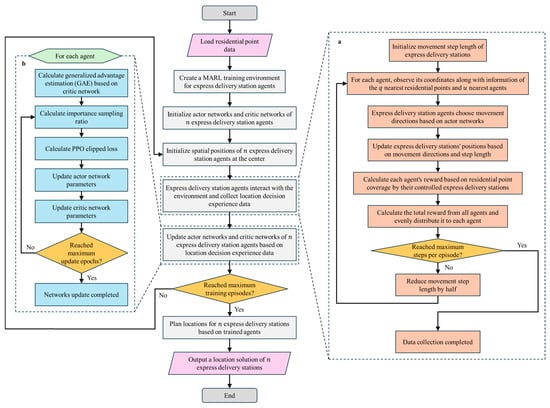
Figure 3.
Flowchart of EDS location planning method based on MARL framework. a Multiple agents interact with the environment to acquire location decision experience data, b Update the network parameters of multiple agents based on the location decision experience data.
(1) Initialization setup
Read residential point data and obtain demand information to construct the MARL training environment for EDS location. Set the number of EDS to be planned and their service radius . Construct agents with actor-critic network architecture, equal in number to the stations to be planned, to control EDS movement, and initialize the neural network parameters. Each agent can be represented as , where represents the agent’s actor network, represents the actor network parameters, represents the agent’s critic network, and represents the critic network parameters. Set the maximum training episodes , the maximum steps for each episode and the maximum update epochs for network parameters based on a batch of experience data.
(2) Multi-agent training
First, the spatial positions of station agents are initialized at the central location of the region. Then agents interact with the environment to obtain location decision experience data, as described in Figure 3a. Finally, update the network parameters of the multi-agent by learning experience data, as described in Figure 3b. After completing the above steps, if the maximum number of training episodes is reached, the trained multi-agent is output; otherwise, the above steps are repeated to continue training the multi-agent.
Specifically, for Figure 3a: first, the movement step size of EDS agent is initialized to one-quarter of the study area’s side length. Next, obtain the observed state information of all agents as shown in Equation (4). Then, the observed state information of each agent is input into the corresponding agent’s actor network to output each agent’s action that guides movement direction of the EDS, as shown in Equation (5). Thus, update spatial positions of all stations according to the movement directions output by the agents and the movement step size . Finally, calculate the coverage of all stations’ service areas over residential points based on the spatial positions of EDS and their service radius . The rewards obtained by all agents in this interaction are calculated according to Equation (6). Therefore, each agent can obtain an interaction data tuple , where represents the current state, represents the action output based on the current state, represents the next state, and represents the reward value obtained in this decision.
Based on above process, if the number of interactions has not reached the maximum steps , the movement step size is halved, and above steps are repeated starting from the state information acquisition step. Else, the data collection process is terminated, and each agent outputs decision trajectory data composed of multiple interaction data tuples, which collectively constitute the location decision experience data.
For Figure 3b: for each agent, first, calculate the generalized advantage estimation (GAE) that is used to evaluate the advantage of taking a specific action in a given state relative to the expected return under the current policy. The estimated value of the advantage at is calculated by Equation (7):
where represents the process of inputting state information into the critic network and outputting state value. is a hyperparameter with a value range of , which controls the importance given to future rewards. is also a hyperparameter with a value range of controlling the balance between bias and variance. Thus, for the decision trajectory data of each agent from to , the corresponding sequence of advantage values can be calculated.
Second, the importance sampling ratio is calculated, which is used to evaluate the degree of change in the probability that an agent takes a specific action under the updated actor network compared to that under the old actor network . It provides guidance for the agent’s actor network to conduct multiple network updates based on the decision trajectory data from the old actor network interacting with the environment. The calculation formula is as follows:
where represents the set of states at different times in the decision trajectory data of the agent, and represents the sequence of importance sampling ratios corresponding to the decision trajectory data.
Finally, the loss value of the agent’s actor network is calculated based on the PPO loss function, as shown in Equation (9):
where is a hyperparameter that limits the update magnitude of the neural network, usually taking a value of 0.2. The loss value of the agent’s critic network is calculated as Equation (10):
where, based on the loss values and , the parameters of the agent’s actor network and critic network can be updated, respectively. PPO’s clipping mechanism constrains policy update magnitudes to ensure stable optimization of multi-agent location policies.
Based on above process, if it reaches the maximum update epochs , the network parameter updates are stopped, and else, above steps are repeated starting from the importance sampling ratio calculation step.
(3) EDS location planning
The trained multiple agents are used to access the EDS location environment. Through controlling the movement of stations in continuous space, a location solution for EDS is finally output.
4. Experiments and Results
To validate the effectiveness of the proposed method, two cities in China—Fuzhou City in Fujian Province and Shenzhen City in Guangdong Province—are selected as experimental areas. These cities represent distinct urban development patterns and spatial characteristics, providing diverse testing scenarios for the method. The EDS location problem is modeled based on the CMCM to determine the locations of new EDS that maximize the population coverage of residential points.
We compare the proposed method MARL-CL with a SARL method and widely adopted heuristic methods, including Differential Evolution (DE), Genetic Algorithm (GA), Simulated Annealing (SA), and Particle Swarm Optimization (PSO). The comparison with SARL is designed to validate the advantages of the multi-agent approach over the single-agent approach, while the comparison with heuristic methods demonstrates the effectiveness of the proposed method against established optimization techniques. The solution quality and computational performance of each method are analyzed and compared. Furthermore, we quantify the marginal effect relationship between EDS investment and service coverage in different study areas based on the proposed method.
In the experiments, the settings for the MARL-CL method proposed in this paper are as follows: the actor-critic networks for each agent adopt fully connected neural networks with 3 layers, hidden layer dimensions of 64, and ReLU activation functions. The learning rates are set to and respectively for the actor network and the critic network, and the hyperparameters , , . During the training process, the maximum number of training episodes is set as 10,000, the maximum number of steps per episode is set as 10, and the maximum number of update epochs is set as 5. The multi-agent network achieving the highest location planning score during training is selected as the final output. The weights respectively for local rewards and global rewards during training are both set to 0.5 to balance and accommodate both local and global rewards.
The settings for the SARL method under comparison are as follows: a single agent consisting of an actor-critic network using fully connected neural networks, with the PPO algorithm employed to update both the actor and critic networks is configured to control the movement and location of all EDS. The observed information includes the status information of all EDS and residential points globally. The action and reward settings are the same as the MARL-CL method, and the parameters values are set referencing the MARL-CL method. The spatial locations of EDS are planned by controlling the movement of all stations to maximize the population coverage of residential points within their service ranges.
For a series of heuristic methods under comparison, we treat the two-dimensional coordinates of the planned EDS as decision variables to determine the coordinate positions of these EDS in continuous space, thereby maximizing the population of residential points covered within the service ranges of the EDS.
The experimental platform parameters are as follows: CPU is Intel(R) Core(TM) i5-13600KF, 3.50 GHz; GPU is NVIDIA GeForce RTX 4060 Ti; Memory is 32 GB. The implementation is programmed using Python 3.11 with Visual Studio Code as the development environment.
4.1. Method Performance Comparison Experiment
In this section, we carry out the experiments using Fuzhou’s main urban area and Shenzhen’s Futian District as examples. The experiments aim to plan the spatial locations of 30 new EDS (Fuzhou City: 600 m service radius, Shenzhen City: 500 m service radius) to maximize the population of residential points covered by the service areas of the EDS. Where the service radius is determined based on the general service range of EDS. Considering the high population density in Shenzhen, the service radius is set smaller than that of EDS in Fuzhou to ensure service quality.
4.1.1. Fuzhou City Experiment
Fuzhou, the provincial capital of Fujian Province, is a medium-sized city with a permanent population of 8.50 million and a total area of 11,968.53 km2. For this case study, mobile signaling data from 2023 were collected for Fuzhou’s main urban area to quantify population activity intensity and estimate the population at residential POI points. These population-attributed residential POI points served as delivery demand points for the EDS location experiments. All data were obtained from publicly available online sources and commercial data providers.
Statistical analysis and calculations show that the experimental area in Fuzhou’s main urban area contains 2184 residential points with a total population of approximately 1631,873. The maximum population at a single residential point is about 6571, with an average of 747.19 and a median of 597.65, as illustrated in Figure 4.
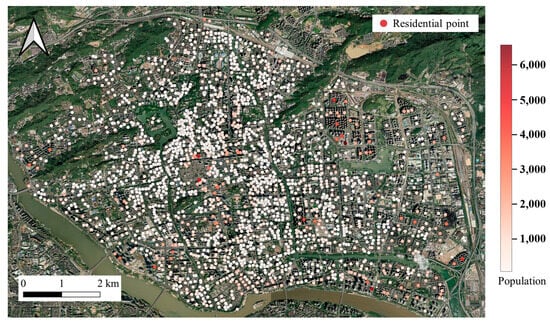
Figure 4.
Distribution of residential points in Fuzhou’s main urban area.
Based on the experimental results presented in Figure 5, Table 1 and Figure 6a, the MARL-CL method demonstrates the best comprehensive performance for ESD location in Fuzhou’s main urban area. In terms of coverage effectiveness (Table 1 and Figure 6a), the MARL-CL achieves outstanding performance, covering 1351 residential points with a coverage rate of 61.86%, and serving a population of approximately 1,030,149 people with a population coverage rate of 63.13%, which significantly outperforms all other methods. The DE ranks second, with its residential point coverage rate and population coverage rate being 10.76% and 9.63% lower than the MARL-CL, respectively. The PSO and SA show similar performance, which are in the middle range. In contrast, the GA and SARL exhibit relatively weaker coverage performance, with the SARL achieving only 38.01% population coverage, which is 25.12 percentage points lower than the MARL-CL.
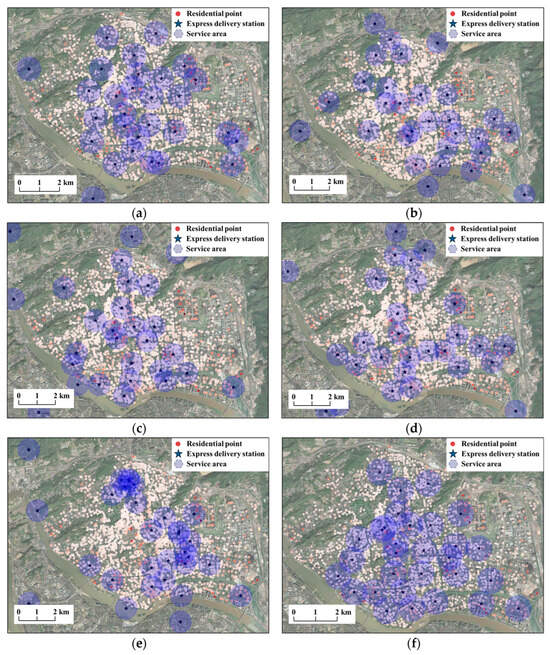
Figure 5.
Continuous maximum coverage location planning results for 30 new EDS (600 m service radius) in Fuzhou’s main urban area based on different methods. (a) DE, (b) GA, (c) SA, (d) PSO, (e) SARL, (f) MARL-CL (our method).

Table 1.
Statistical results of continuous maximum coverage location planning for 30 new EDS (600 m service radius) in Fuzhou’s main urban area based on different methods.
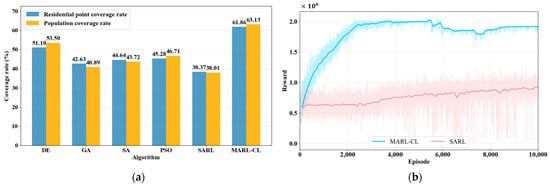
Figure 6.
Performance comparison of continuous maximum coverage location methods for EDS in Fuzhou’s main urban area. (a) Performance statistics of heuristic methods and deep RL methods, (b) Reward curves of deep RL methods over training episodes.
From the perspective of spatial distribution characteristics (Figure 5), the MARL-CL exhibits the most uniform and reasonable EDS distribution, with service areas covering most residential clusters and effectively balancing the coverage needs of high-density areas with the rationality of overall spatial layout. In contrast, although the DE achieves good coverage performance, it suffers from spatial layout deficiencies. Its stations are overly concentrated in densely populated core areas, leading to highly overlapping service regions with redundant resource allocation and large service gaps in urban peripheral areas. The GA and SARL show even more prominent spatial distribution problems, both displaying severe clustering characteristics. The GA presents a localized clustering pattern with large service areas lacking continuous coverage. The SARL performs worse, exhibiting extremely uneven station distribution that forms several isolated service clusters with extensive uncovered areas between clusters, and this fragmented distribution severely impacts overall service effectiveness. The PSO and SA demonstrate relatively balanced spatial distribution with more dispersed station layouts, avoiding excessive concentration issues. However, both methods show insufficient coverage capability in urban fringe areas where the service area density decreases significantly, forming relatively weak service areas. These comparative results reflect the limitations of traditional methods when handling complex heterogeneous demand distribution scenarios.
In terms of load balancing performance (Table 1), the MARL-CL demonstrates distinctive advantages. The MARL-CL achieves a minimum coverage population of approximately 27,368, effectively avoiding situations where EDS provide no service, while all other methods show minimum coverage populations of 0, indicating problems with uneven load distribution among EDS. Additionally, the MARL-CL’s median coverage population of 40,745.50 and average coverage population of 42,843.61 are relatively close in value, further confirming its superior performance in load balancing. Moreover, regarding the maximum coverage capacity of individual stations, the differences among methods are minimal, suggesting their similar coverage capabilities in high-density areas. However, the MARL-CL maintains high maximum coverage while avoiding the extreme situation of zero minimum coverage, demonstrating better overall optimization capability.
Figure 6b shows the performance of the MARL-CL and SARL during the training process. The training convergence curve demonstrates that the MARL-CL shows rapid reward value increases in the early training phase and stabilizes at approximately 2,000,000 after around 4000 training episodes. This proves that the multi-agent collaboration mechanism enables the method to quickly find stable and high-quality solutions during the learning process. The SARL exhibits a relatively gradual growth trend in reward values with significant oscillations throughout the entire training process. After 10,000 training rounds, the average reward value per 100 episodes reaches approximately 800,000–900,000, with a maximum reward value of about 1,200,000. It is evident that the MARL-CL significantly outperforms the SARL in terms of solution quality. It is also superior to the SARL in terms of solution efficiency, and requires only a small amount of training to obtain a high-quality EDS location scheme.
4.1.2. Shenzhen City Experiment
Shenzhen, situated in the Pearl River Delta of Guangdong Province, is one of China’s most economically vibrant megacities, with a permanent population of 17.99 million and a total area of 1997.47 km2. Similarly, for Shenzhen’s Futian District, we collected mobile signaling data and residential POI data from 2023 to construct the population-attributed residential POI points. These points served as delivery demand points for the EDS location experiments.
Statistical analysis and calculations show that the experimental area in Shenzhen’s Futian District contains 3155 residential points with a total population of approximately 1,744,606. The maximum population at a single residential point is about 11,777, with an average of 552.97 and a median of 395.73, as illustrated in Figure 7.
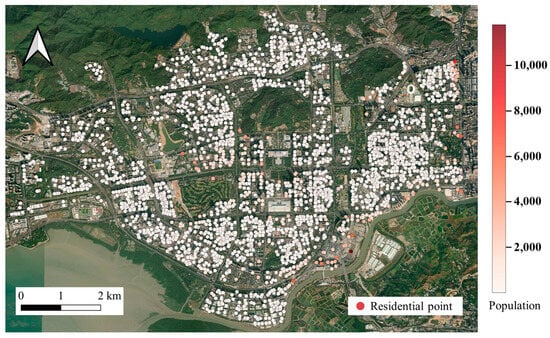
Figure 7.
Distribution of residential points in Shenzhen’s Futian District.
Based on Figure 8, Table 2 and Figure 9a, MARL-CL demonstrates excellent performance in Futian District. For coverage effectiveness, MARL-CL covers 1421 residential points (45.04% coverage rate), comparable to the best existing methods (0.89 percentage point difference). As shown in Figure 8f, the station layout presents comprehensive spatial distribution, maintaining appropriate density in major residential areas while extending toward urban fringes. For population coverage, MARL-CL covers approximately 1,195,400 people (68.52% coverage rate), representing a 15.99 percentage point improvement over the best existing method, successfully serving high-density population areas.
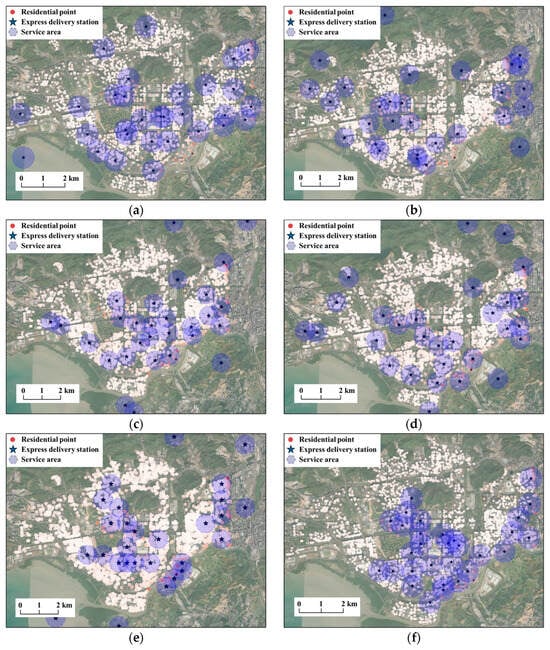
Figure 8.
Continuous maximum coverage location planning results for 30 new EDS (500 m service radius) in Shenzhen’s Futian District based on different methods. (a) DE, (b) GA, (c) SA, (d) PSO, (e) SARL, (f) MARL-CL (our method).
Table 2.
Statistical results of continuous maximum coverage location planning for 30 new EDS (500 m service radius) in Shenzhen’s Futian District based on different methods.
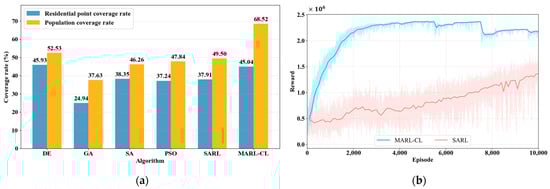
Figure 9.
Performance comparison of continuous maximum coverage location methods for EDS in Shenzhen’s Futian District. (a) Performance statistics of heuristic methods and deep RL methods, (b) Reward curves of deep RL methods over training episodes.
Among traditional heuristic methods, DE (Figure 8a) performs best, covering 1449 residential points (45.93% residential point coverage rate, 52.53% population coverage rate) with relatively uniform distribution. PSO (Figure 8d) and SA (Figure 8c) show similar performance and similar multi-center patterns of station distribution. GA (Figure 8b) performs worst, covering only 787 residential points with excessive concentration and serious service gaps.
The SARL (Figure 8e) covers 1196 residential points with a residential point coverage rate of 37.91% and a population coverage rate of 49.50%. The maximum coverage population of a single station reaches about 74,719, indicating relatively high service efficiency. However, its spatial distribution shows relatively scattered characteristics across multiple areas, and the overall continuity is insufficient, resulting in numerous service gaps.
Regarding load balancing (Table 2), MARL-CL achieves a minimum service population of 18,384, while all other methods show zero minimum values, indicating unserved stations. MARL-CL’s average service population (51,405.64) closely matches its median (52,514.82), with a difference of only 1109.18, demonstrating highly uniform load distribution. In contrast, traditional methods show larger disparities (e.g., DE: 7779.61 difference; PSO: 2279.08 difference), reflecting imbalanced service loads and demonstrating MARL-CL’s dual advantages in spatial optimization and load balancing.
From the training convergence curve in Figure 9b, the MARL-CL demonstrates excellent learning performance showing rapid reward value increases in the early training phase and reaches stability at approximately 4000 training episodes, achieving a reward level of about 2,300,000. This rapid and stable convergence characteristic indicates that the multi-agent collaboration mechanism can effectively explore the solution space and optimize location policies in the urban spatial environment of Futian District.
The SARL’s performance in Shenzhen’s Futian District shows improvement compared to its performance in Fuzhou’s main urban area, with enhanced training speed. After 10,000 training episodes, the average reward value per 100 episodes reaches approximately 1,200,000–1,300,000, with a maximum reward value of about 1,700,000. This improvement may be related to the presence of relatively distinct high-density population clusters in Futian District. However, throughout the entire training process, compared to the MARL-CL, the SARL’s reward value growth remains relatively slow. Despite the performance improvement, there is still a significant gap between the SARL and the MARL-CL, reflecting the limitations of single-agent approaches when dealing with complex spatial optimization problems.
4.2. Analysis of Method Performance Comparison Experiment
The experimental results in Fuzhou’s main urban area and Shenzhen’s Futian District reveal the profound impact of urban spatial structure differences on method performance. From the basic data, it can be observed that although Shenzhen’s Futian District has only about 110,000 more people than Fuzhou’s main urban area (a 6.9% increase), it contains 971 more residential points (a 44.5% increase), forming a more subdivided spatial structure. Specifically, Fuzhou’s main urban area presents a relatively balanced population distribution pattern, with an average population of 747.19 per residential point, a median of 597.65 (approximately 80% of the average), and a maximum of about 6571 (approximately 8.8 times the average). In contrast, Shenzhen’s Futian District exhibits significant spatial heterogeneity where the average population per residential point is 552.97, but with the maximum of about 11,777 (approximately 21.3 times the average), and the median of 395.73 (approximately 71.6% of the average). This reflects a complex distribution pattern characterized by both high-density core points and numerous small-scale scattered residential points.
Under different urban structural contexts, the MARL-CL method shows good adaptability to variations in urban morphology. The MARL-CL method demonstrated optimal overall coverage effectiveness in both the relatively balanced environment of Fuzhou’s main urban area and the highly heterogeneous environment of Shenzhen’s Futian District. This result clearly demonstrates that the method can intelligently adjust optimization policies according to urban population distribution characteristics, prioritizing the identification and service of high-density population points in heterogeneous scenarios, thereby achieving a policy shift from increasing spatial coverage breadth to enhancing population service efficiency.
From the perspective of single-station service efficiency, the adaptability is even more evident. Each station serves more people in Shenzhen than in Fuzhou, representing improved efficiency. This reflects the method’s capability for intelligent optimization by leveraging the heterogeneous characteristics of urban population distribution. The significant population density gradient differences in Shenzhen provided the method with clearer optimization objectives, enabling it to achieve superior resource allocation efficiency through precise identification and prioritized service for high-density population points.
The analysis of load balancing shows that the MARL-CL achieves zero idle stations in both different urban structures but exhibits different distribution characteristics. The lower minimum service population in the Shenzhen experiment reflects the impact of reduced service radius, but the higher average service population indicates that the method successfully leveraged urban spatial heterogeneity to achieve superior resource allocation. These cross-urban structure experimental results demonstrate that the MARL-CL possesses the capability for policy adaptation based on urban population distribution characteristics. It maintains excellent performance in both relatively balanced and highly heterogeneous urban scenarios, which supports continuous maximum coverage location planning for EDS in different types of cities.
4.3. Station Quantity Requirements Experiment and Analysis
The method performance comparison experiments above validate the effectiveness and performance advantages of the proposed method. Building on this foundation, this study further explores the number of EDS required for full express delivery service coverage in urban areas. In real-world urban express delivery network planning, the number of stations that can cover the entire target area is directly related to investment scale and operational costs. Therefore, this study analyzes the sensitivity of method performance to changes in resource investment by varying the number of stations, providing cost–benefit analysis references for investment decisions and location planning of EDS. Experiments are conducted for both Fuzhou’s main urban area and Shenzhen’s Futian District, with results shown in Figure 10.
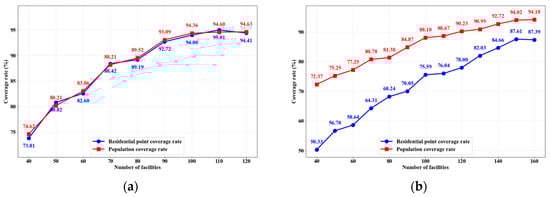
Figure 10.
Relationship between express delivery service coverage rate and number of EDS based on the proposed MARL-CL method. (a) Fuzhou’s main urban area, (b) Shenzhen’s Futian District.
From the experimental results in Figure 10, it can be observed that the two urban areas exhibit significant spatial heterogeneity differences in marginal effect characteristics and optimal allocation strategies. Regarding the evolution pattern of marginal effects, Fuzhou’s main urban area presents typical characteristics of rapid decline (Figure 10a). The residential point coverage rate demonstrates the highest return on investment during the initial stage of 40–60 stations, with an increase of 8.79 percentage points. Subsequently, marginal effects rapidly diminish: the 60–80 station stage drops to 6.59 percentage points, the 80–100 station stage further decreases to 4.81 percentage points, the 100–110 station stage nearly stagnates (with only a 1.01 percentage points increase), and slight negative growth even occurs during the 110–120 station stage. Population coverage rate follows the same declining pattern, dropping sharply to minimal growth of only 0.27 percentage points during the 100–120 station stage.
As shown in Figure 10b, Shenzhen’s Futian District exhibits a more complex “dual-stage growth” pattern in residential point coverage rate. During the 40–100 station stage, coverage grows from 50.33 to 75.59 percentage points, with significant growth fluctuations but an overall rapid growth trend. In the 100–160 station stage, coverage increases from 75.59 to 87.39 percentage points, where the 100-110 station stage nearly stagnates (only a 0.45 percentage points increase), followed by renewed accelerated growth during the 120–140 station stage (a 4.03 percentage points increase in the 120–130 station stage), and finally stabilizes. This reflects a complete pattern of initial accelerated growth, stagnation, re-acceleration, and then stabilization. In contrast, population coverage rate growth is smoother, continuously increasing from 72.37 to 94.02 percentage points during the 40–150 station stage, with smaller fluctuations in growth magnitude across different stages, and leveling off during the 150–160 station stage.
From the perspective of optimal allocation thresholds, there are significant differences in economic efficiency balance points between the two urban areas. Fuzhou’s main urban area has an optimal practical range of 80–100 stations. With 80 stations, the coverage rate achieves approximately 89%, and increases to about 94% with 100 stations while marginal returns decline sharply with poor investment efficiency when beyond 100 stations. Shenzhen’s Futian District has a noticeably delayed optimal allocation threshold, falling within the 130–150 station range. With 130 stations, the residential point coverage rate reaches 82.03% and population coverage rate reaches 90.95%, basically meeting primary service demands. When increasing the number of stations to 150, the residential point coverage rate increases to 87.61% and population coverage rate reaches 94.02%, achieving a relatively ideal service level while marginal benefits are extremely limited beyond 150 stations.
The above differences reflect the impact of different spatial characteristics and urban morphologies on express delivery service configuration in the two cities. Fuzhou’s main urban area demonstrates a relatively uniform urban layout and simpler spatial structure characteristics, enabling station construction to quickly generate economies of scale, but also leading to rapid decay of marginal returns. Shenzhen’s Futian District, as an area with relatively prominent population clustering characteristics, presents a complex spatial structure and uneven demand distribution characteristics. Although initial investment returns are relatively low, it forms stronger network effects as station density increases, requiring greater station investment to achieve more service coverage. Overall, Fuzhou’s main urban area is suitable for a 100-station configuration strategy, while Shenzhen’s Futian District is suitable for a 150-station configuration strategy. This indicates that the MARL-CL method can effectively adapt to different cities’ spatial heterogeneous scenarios, but the morphological characteristics of the cities themselves significantly influence the determination of optimal configuration schemes.
5. Discussion
This study proposes the MARL-CL method, which introduces a multi-agent framework to address the CMCLP for urban EDS, combining deep RL with continuous spatial optimization. The fundamental advantage of MARL-CL over traditional single-agent approaches lies in its distributed optimization architecture. Rather than requiring a single agent to learn optimal placements for all facilities simultaneously—which necessitates managing lengthy decision sequences—the MARL framework decomposes this into parallel tasks where each agent optimizes only its own location. This substantial reduction in sequence length dramatically accelerates learning through clearer credit assignment and more efficient exploration. More critically, the distributed approach enables emergent policy diversity: different agents naturally develop specialized policies suited to different spatial contexts, with some optimizing for dense urban cores while others extend coverage to peripheral areas. This specialization, clearly visible in Shenzhen’s heterogeneous Futian District, allows the system to adapt to spatial heterogeneity without explicit programming—a capability that single unified policies fundamentally lack.
Furthermore, the superior load balancing achieved by MARL-CL emerges as an implicit coordination property rather than through explicit constraints. The local–global reward mechanism creates a competitive-cooperative dynamic where agents compete for coverage but are penalized for redundancy. Through repeated interaction, agents learn complementary positioning that maximizes collective coverage while minimizing overlap, explaining why MARL-CL consistently avoids zero-service stations that plague baseline methods. This self-organizing behavior, combined with the continuous formulation’s spatial flexibility, enables adaptive network configurations that match population distribution patterns—demonstrating advantages that become more pronounced in spatially complex environments where traditional optimization methods struggle.
While this study validates MARL-CL in two Chinese cities with distinct characteristics, several contextual factors may influence performance in other settings. Cities with different urban morphologies, varying sizes, and different temporal contexts may require parameter adjustments. However, the MARL framework’s learning-based and interaction-driven nature and emergent adaptability suggest broad applicability across diverse urban contexts.
Despite these contributions, this study has several limitations. The current framework does not adequately account for the heterogeneous environmental characteristics of different urban zones, including functional district variations (e.g., residential, commercial, industrial areas) and diverse geographical contexts. The reliance primarily on population and basic POI data overlooks important contextual factors such as economic activity patterns, land use constraints, and area-specific accessibility considerations. Future research should address these limitations by integrating multiple urban data sources, including comprehensive POI datasets spanning various categories, socioeconomic indicators, land use classifications, and transportation network characteristics. Such enriched environmental representation would enable more context-aware and spatially refined EDS location planning that adapts to the specific characteristics and constraints of different urban zones. Additionally, cross-national validation and consideration of seasonal factors represent promising directions for future research.
6. Conclusions
The rational layout and location planning for EDS is key to improving the service efficiency and quality of urban logistics systems. This study adopts the CMCM to formulate the EDS location problem and proposes a MARL-CL method for EDS. By training multiple agents to master different location policies, the method combines these policies to complete EDS location tasks in heterogeneous demand distribution scenarios. The study designs a multi-agent system’s movement mechanism, environmental perception, and reward feedback system. Through direction-based continuous variable-step movement, efficient search and high-precision location planning in continuous space are achieved. By focusing on observations of the surrounding environment, heterogeneous environmental characteristics are efficiently captured. Through a reward system combining local and global components, both local optimization and global benefits are balanced. Experiments are conducted in Fuzhou’s main urban area and Shenzhen’s Futian District, comparing the proposed method with commonly used excellent heuristic methods and SARL method. The results validate the method’s excellent adaptive capability and high solution performance when facing heterogeneous demand distribution scenarios and analyze the effects of urban environmental characteristics on EDS location. Based on the proposed method, this study also explores the marginal effect relationship between station investment and service coverage, providing cost–benefit references for investment decisions and location planning in EDS construction.
Author Contributions
Conceptualization, Yijie Lyu and Baoju Liu; methodology, Yijie Lyu and Baoju Liu; validation, Yijie Lyu and Yalun Li; formal analysis, Yijie Lyu, Yalun Li and Baoju Liu; investigation, Yijie Lyu and Yalun Li; resources, Zhongan Tang; data curation, Yijie Lyu and Yalun Li; writing—original draft preparation, Yijie Lyu, Yalun Li and Baoju Liu; writing—review and editing, Yijie Lyu, Zhongan Tang, Baoju Liu, Min Deng and Guohua Wu; visualization, Yijie Lyu and Yalun Li; supervision, Zhongan Tang, Baoju Liu, Min Deng and Guohua Wu; project administration, Baoju Liu; funding acquisition, Zhongan Tang. All authors have read and agreed to the published version of the manuscript.
Funding
This project was supported by the National Natural Science Foundation of China under Grant 42471506; the Provincial Natural Science Foundation of Hunan under Grant 2025JJ40034; the Changsha Distinguished Young Science and Technology Talent Program kq2506011; Funds of Open Projects of Hunan Geospatial Information Engineering and Technology Research Center HNGIET2024004.
Data Availability Statement
The data supporting the conclusions of this article will be made available by the authors upon request.
Acknowledgments
We thank the editor and anonymous reviewers for their constructive comments and suggestions.
Conflicts of Interest
The authors declare no conflicts of interest.
Abbreviations
The following abbreviations are used in this manuscript:
| EDS | express delivery stations |
| CMCLP | continuous maximum coverage location problem |
| RL | reinforcement learning |
| MARL | multi-agent reinforcement learning |
| SARL | single-agent reinforcement learning |
| MARL-CL | MARL-based continuous location |
| CMCM | continuous maximum coverage model |
| GAE | generalized advantage estimation |
References
- Ministry of Commerce of the People’s Republic of China. China E-Commerce Report 2022. Available online: https://dzsws.mofcom.gov.cn/zthd/ndbg/art/2023/art_21d89f715e43476eae4c420a9d787d41.html (accessed on 31 October 2025).
- Kazançoğlu, Y.; Özbiltekin, M.; Özkan-Özen, Y.D. Sustainability benchmarking for logistics center location decision: An example from an emerging country. Manag. Environ. Qual. 2020, 31, 1239–1260. [Google Scholar] [CrossRef]
- Zhao, X. Based on gravity method of logistics distribution center location strategy research. In Proceedings of the International Conference on Logistics Engineering, Management and Computer Science, Shenyang, China, 24–26 May 2014; Atlantis Press: Paris, France, 2014; pp. 586–589. [Google Scholar] [CrossRef]
- Pourmohammadreza, N.; Jokar, M.R.A.; Van Woensel, T. Last-mile logistics with alternative delivery locations: A systematic literature review. Results Eng. 2025, 25, 104085. [Google Scholar] [CrossRef]
- Blanco, V.; Gázquez, R.; Saldanha-da-Gama, F. Multi-type maximal covering location problems: Hybridizing discrete and continuous problems. Eur. J. Oper. Res. 2023, 307, 1040–1054. [Google Scholar] [CrossRef]
- Sutrisno, H.; Yang, C.L. A two-echelon location routing problem with mobile satellites for last-mile delivery: Mathematical formulation and clustering-based heuristic method. Ann. Oper. Res. 2024, 332, 429–454. [Google Scholar] [CrossRef]
- Su, H.; Zheng, Y.; Ding, J.; Jin, D.; Li, Y. Large-scale urban facility location selection with knowledge-informed reinforcement learning. In Proceedings of the 32nd ACM International Conference on Advanced Geographic Information Systems (SIGSPATIAL ‘24), Atlanta, GA, USA, 29 October–1 November 2024; ACM: Atlanta, GA, USA, 2024; pp. 1–10. [Google Scholar] [CrossRef]
- Liang, H.; Wang, S.; Li, H.; Pan, J.; Li, X.; Su, C.; Liu, B. AIAM: Adaptive interactive attention model for solving p-Median problem via deep reinforcement learning. Int. J. Appl. Earth Obs. Geoinf. 2025, 138, 104454. [Google Scholar] [CrossRef]
- Teusch, J.; Saavedra, B.N.; Scherr, Y.O.; Müller, J.P. Strategic planning of geo-fenced micro-mobility facilities using reinforcement learning. Transp. Res. Part E Logist. Transp. Rev. 2025, 194, 103872. [Google Scholar] [CrossRef]
- Zhang, D.; Meng, H.; Wang, M.; Xu, X.; Yan, J.; Li, X. A multi-objective optimization method for shelter site selection based on deep reinforcement learning. Trans. GIS 2024, 28, 2722–2741. [Google Scholar] [CrossRef]
- Zhong, Y.; Wang, S.; Liang, H.; Wang, Z.; Zhang, X.; Chen, X.; Su, C. ReCovNet: Reinforcement learning with covering information for solving maximal coverage billboards location problem. Int. J. Appl. Earth Obs. Geoinf. 2024, 128, 103710. [Google Scholar] [CrossRef]
- Toregas, C.; Swain, R.; ReVelle, C.; Bergman, L. The location of emergency service facilities. Oper. Res. 1971, 19, 1363–1373. [Google Scholar] [CrossRef]
- Church, R.; ReVelle, C. The maximal covering location problem. Pap. Reg. Sci. Assoc. 1974, 32, 101–118. [Google Scholar] [CrossRef]
- Francis, R.L.; Lowe, T.J.; Tamir, A.; Emir-Farinas, H. Aggregation decomposition and aggregation guidelines for a class of minimax and covering location models. Geogr. Anal. 2004, 36, 332–349. [Google Scholar] [CrossRef]
- Emir-Farinas, H.; Francis, R.L. Demand point aggregation for planar covering location models. Ann. Oper. Res. 2005, 136, 175–192. [Google Scholar] [CrossRef]
- Blanco, V.; Gázquez, R. Continuous maximal covering location problems with interconnected facilities. Comput. Oper. Res. 2021, 132, 105310. [Google Scholar] [CrossRef]
- Beresnev, V. Branch-and-bound algorithm for a competitive facility location problem. Comput. Oper. Res. 2013, 40, 2062–2070. [Google Scholar] [CrossRef]
- Feng, X.; Chen, Y.; Zhang, D. A dynamic programming-based computational intelligence method for optimal pickup and delivery in inter-terminal logistics. Comput. Ind. Eng. 2025, 206, 111150. [Google Scholar] [CrossRef]
- Liu, C.; Zhou, J.; Gan, J.; Wu, Y.; Huang, Y.; Shao, J.; Ouyang, L. Optimizing the ground intra-city express delivery network: An integrated multiple centrality assessment, multi-criteria decision-making, and multi-objective integer programming model. J. Intell. Transp. Syst. 2024, 28, 525–543. [Google Scholar] [CrossRef]
- Kumar, A.; Mishra, S. A low carbon multi-modal logistics network optimization: A novel neutrosophic mixed integer linear programming approach. J. Environ. Manag. 2025, 387, 125924. [Google Scholar] [CrossRef]
- Andersen, E.D.; Andersen, K.D. The Mosek interior point optimizer for linear programming: An implementation of the homogeneous algorithm. In High Performance Optimization; Frenk, H., Roos, K., Terlaky, T., Zhang, S., Eds.; Springer: Berlin, Germany, 2000; pp. 197–232. [Google Scholar] [CrossRef]
- Kizhakkan, A.R.; Rathore, A.K.; Awasthi, A. Review of electric vehicle charging station location planning. In Proceedings of the IEEE Transportation Electrification Conference (ITEC-India), Bengaluru, India, 17–19 December 2019; IEEE: Bengaluru, India, 2019; pp. 1–5. [Google Scholar] [CrossRef]
- Ottaviani, F.M.; Zenezini, G.; De Marco, A.; Carlin, A. Locating Automated Parcel Lockers (APL) with known customers’ demand: A mixed approach proposal. Eur. J. Transp. Infrastruct. Res. 2023, 23, 24–45. [Google Scholar] [CrossRef]
- Kahalimoghadam, M.; Thompson, R.G.; Rajabifard, A. Determining the number and location of micro-consolidation centres as a solution to growing e-commerce demand. J. Transp. Geogr. 2024, 117, 103875. [Google Scholar] [CrossRef]
- Ceschia, S.; Schaerf, A. Multi-neighborhood simulated annealing for the capacitated facility location problem with customer incompatibilities. Comput. Ind. Eng. 2024, 188, 109858. [Google Scholar] [CrossRef]
- Andaryan, A.Z.; Mousighichi, K.; Ghaffarinasab, N. A heuristic approach to the stochastic capacitated single allocation hub location problem with Bernoulli demands. Eur. J. Oper. Res. 2024, 312, 954–968. [Google Scholar] [CrossRef]
- Cui, H.; Chen, X.; Guo, M.; Jiao, Y.; Cao, J.; Qiu, J. A distribution center location optimization model based on minimizing operating costs under uncertain demand with logistics node capacity scalability. Phys. A Stat. Mech. Appl. 2023, 610, 128392. [Google Scholar] [CrossRef]
- Zhou, L.; Li, C.; Hu, C.; Du, J. Parcel locker location problem with selectable volume sizes and heterogeneous customers in the last mile delivery. Transp. Lett. 2024, 16, 1140–1154. [Google Scholar] [CrossRef]
- Silva, A.; Aloise, D.; Coelho, L.C.; Rocha, C. Heuristics for the dynamic facility location problem with modular capacities. Eur. J. Oper. Res. 2021, 290, 435–452. [Google Scholar] [CrossRef]
- Zheng, Y.; Lin, Y.; Zhao, L.; Wu, T.; Jin, D.; Li, Y. Spatial planning of urban communities via deep reinforcement learning. Nat. Comput. Sci. 2023, 3, 748–762. [Google Scholar] [CrossRef]
- Cao, K.; Zhou, C.; Church, R.; Li, X.; Li, W. Revisiting spatial optimization in the era of geospatial big data and GeoAI. Int. J. Appl. Earth Obs. Geoinf. 2024, 129, 103832. [Google Scholar] [CrossRef]
- Zhang, D.; Wang, M.; Mango, J.; Li, X.; Xu, X. A survey on applications of reinforcement learning in spatial resource allocation. Comput. Urban Sci. 2024, 4, 14. [Google Scholar] [CrossRef]
- Wang, S.; Liang, H.; Zhong, Y.; Zhang, X.; Su, C. DeepMCLP: Solving the MCLP with Deep Reinforcement Learning for Urban Spatial Computing. In Proceedings of the Spatial Data Science Symposium 2023, New York, NY, USA, 5–6 September 2023. [Google Scholar] [CrossRef]
- Gopi, S.P.; Magarini, M. Reinforcement learning aided UAV base station location optimization for rate maximization. Electronics 2021, 10, 2953. [Google Scholar] [CrossRef]
- Yang, Z.; Wen, P. Data-driven reinforcement learning-based optimization of shared warehouse storage locations. Comput. Ind. Eng. 2025, 206, 111195. [Google Scholar] [CrossRef]
- Volodymyr, M.; Kavukcuoglu, K.; Silver, D.; Rusu, A.A.; Veness, J.; Bellemare, M.G.; Graves, A.; Riedmiller, M.; Fidjeland, A.K.; Ostrovski, G.; et al. Human-level control through deep reinforcement learning. Nature 2015, 518, 529–533. [Google Scholar] [CrossRef]
- Li, X.; Liang, X.; Wang, X.; Wang, R.; Shu, L.; Xu, W. Deep reinforcement learning for optimal rescue path planning in uncertain and complex urban pluvial flood scenarios. Appl. Soft Comput. 2023, 144, 110543. [Google Scholar] [CrossRef]
- Heinbach, B.; Burggräf, P.; Wagner, J. Deep reinforcement learning for layout planning—An MDP-based approach for the facility layout problem. Manuf. Lett. 2023, 38, 40–43. [Google Scholar] [CrossRef]
- Liang, H.; Wang, S.; Li, H.; Zhou, L.; Chen, H.; Zhang, X.; Chen, X. Sponet: Solve spatial optimization problem using deep reinforcement learning for urban spatial decision analysis. Int. J. Digit. Earth 2024, 17, 2299211. [Google Scholar] [CrossRef]
- Meng, S.; Kan, Z. Deep reinforcement learning-based effective coverage control with connectivity constraints. IEEE Control Syst. Lett. 2021, 6, 283–288. [Google Scholar] [CrossRef]
- Wu, T.; Zhou, P.; Liu, K.; Yuan, Y.; Wang, X.; Huang, H.; Wu, D.O. Multiagent deep reinforcement learning for urban traffic light control in vehicular networks. IEEE Trans. Veh. Technol. 2020, 69, 8243–8256. [Google Scholar] [CrossRef]
- Schulman, J.; Wolski, F.; Dhariwal, P.; Radford, A.; Klimov, O. Proximal Policy Optimization Algorithms. arXiv 2017, arXiv:1707.06347. [Google Scholar] [CrossRef]
Disclaimer/Publisher’s Note: The statements, opinions and data contained in all publications are solely those of the individual author(s) and contributor(s) and not of MDPI and/or the editor(s). MDPI and/or the editor(s) disclaim responsibility for any injury to people or property resulting from any ideas, methods, instructions or products referred to in the content. |
© 2025 by the authors. Published by MDPI on behalf of the International Society for Photogrammetry and Remote Sensing. Licensee MDPI, Basel, Switzerland. This article is an open access article distributed under the terms and conditions of the Creative Commons Attribution (CC BY) license (https://creativecommons.org/licenses/by/4.0/).