Next Issue
Volume 4, December
Previous Issue
Volume 4, June


Earth, Volume 4, Issue 3 (September 2023) – 16 articles

Cover Story (view full-size image): 
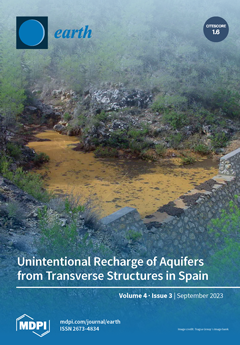
A new inventory of transverse structures (small dams and dykes) for flow lamination and water retention through river basins has recently been conducted for the Spanish territory by the MITERD Ministry, with 27,680 units. Adopting this inventory as a starting point, through GIS-based algebra operations using thematic layers, such as lithology, permeability, elevation, transverse structures’ wetted area, etc., two analytical formulas to compute their infiltration of water were tested. The resulting volume of unintentional recharge from these constructions ranges between 812.5 and 1234.8 Mm3/year, what exceeds by more than four times the volume infiltrated from intentional managed aquifer recharge (MAR) systems (between 150 and 280 Mm3/year) in Spain. These figures are, therefore, relevant. View this paper
  • Issues are regarded as officially published after their release is announced to the table of contents alert mailing list.
  • You may sign up for e-mail alerts to receive table of contents of newly released issues.
  • PDF is the official format for papers published in both, html and pdf forms. To view the papers in pdf format, click on the "PDF Full-text" link, and use the free Adobe Reader to open them.
Order results
Result details
Select all
Export citation of selected articles as:
24 pages, 6467 KiB  
Article
Predicting Future Land Use Utilizing Economic and Land Surface Parameters with ANN and Markov Chain Models
by Ankush Rani, Saurabh Kumar Gupta, Suraj Kumar Singh, Gowhar Meraj, Pankaj Kumar, Shruti Kanga, Bojan Đurin and Dragana Dogančić
Earth 2023, 4(3), 728-751; https://doi.org/10.3390/earth4030039 - 15 Sep 2023
Cited by 5 | Viewed by 2128
Abstract
The main aim of this study is to comprehensively analyze the dynamics of land use and land cover (LULC) changes in the Bathinda region of Punjab, India, encompassing historical, current, and future trends. To forecast future LULC, the Cellular Automaton–Markov Chain (CA) based [...] Read more.
The main aim of this study is to comprehensively analyze the dynamics of land use and land cover (LULC) changes in the Bathinda region of Punjab, India, encompassing historical, current, and future trends. To forecast future LULC, the Cellular Automaton–Markov Chain (CA) based on artificial neural network (ANN) concepts was used using cartographic variables such as environmental, economic, and cultural. For segmenting LULC, the study used a combination of ML models, such as support vector machine (SVM) and Maximum Likelihood Classifier (MLC). The study is empirical in nature, and it employs quantitative analyses to shed light on LULC variations through time. The result indicates that the barren land is expected to shrink from 55.2 km2 in 1990 to 5.6 km2 in 2050, signifying better land management or increasing human activity. Vegetative expanses, on the other hand, are expected to rise from 81.3 km2 in 1990 to 205.6 km2 in 2050, reflecting a balance between urbanization and ecological conservation. Agricultural fields are expected to increase from 2597.4 km2 in 1990 to 2859.6 km2 in 2020 before stabilizing at 2898.4 km2 in 2050. Water landscapes are expected to shrink from 13.4 km2 in 1990 to 5.6 km2 in 2050, providing possible issues for water resources. Wetland regions are expected to decrease, thus complicating irrigation and groundwater reservoir sustainability. These findings are confirmed by strong statistical indices, with this study’s high kappa coefficients of Kno (0.97), Kstandard (0.95), and Klocation (0.97) indicating a reasonable level of accuracy in CA prediction. From the result of the F1 score, a significant issue was found in MLC for segmenting vegetation, and the issue was resolved in SVM classification. The findings of this study can be used to inform land use policy and plans for sustainable development in the region and beyond. Full article
Show Figures

Figure 1

14 pages, 4249 KiB  
Article
Global Sensitivity of Penman–Monteith Reference Evapotranspiration to Climatic Variables in Mato Grosso, Brazil
by Marlus Sabino and Adilson Pacheco de Souza
Earth 2023, 4(3), 714-727; https://doi.org/10.3390/earth4030038 - 13 Sep 2023
Cited by 2 | Viewed by 942
Abstract
Understanding how climatic variables impact the reference evapotranspiration (ETo) is essential for water resource management, especially considering potential fluctuations due to climate change. Therefore, we used the Sobol’ method to analyze the spatiotemporal variations of Penman–Monteith ETo sensitivity to the climatic variables: downward [...] Read more.
Understanding how climatic variables impact the reference evapotranspiration (ETo) is essential for water resource management, especially considering potential fluctuations due to climate change. Therefore, we used the Sobol’ method to analyze the spatiotemporal variations of Penman–Monteith ETo sensitivity to the climatic variables: downward solar radiation, relative humidity, maximum and minimum air temperature, and wind speed. The Sobol’ indices variances were estimated by Monte Carlo integration, with sample limits set to the 2.5th and 97.5th percentiles of the daily data of 33 automatic weather stations located in the state of Mato Grosso, Brazil. The results of the Sobol’ analysis indicate considerable spatiotemporal variations in the sensitivity of ETo to climatic variables and their interactions. The dominant climatic variable responsible for ETo fluctuations in Mato Grosso is incident solar radiation (53% to 93% of annual total sensitivity—Stot), which has a more significant impact in humid environments (70% to 90% of Stot), as observed in the areas of the Amazon biome in the state. Air relative humidity and wind speed have higher sensitivity indices during the dry season in the Cerrado biome (savanna) areas in Mato Grosso (20% and 30% of the Stot, respectively). Our findings show that changes in solar radiation, relative humidity, and wind speed are the main driving forces that impact the reference evapotranspiration. Full article
Show Figures

Figure 1

16 pages, 8604 KiB  
Article
Landslide Susceptibility Mapping Using Multi-Criteria Decision-Making (MCDM), Statistical, and Machine Learning Models in the Aube Department, France
by Abdessamad Jari, Achraf Khaddari, Soufiane Hajaj, El Mostafa Bachaoui, Sabine Mohammedi, Amine Jellouli, Hassan Mosaid, Abderrazak El Harti and Ahmed Barakat
Earth 2023, 4(3), 698-713; https://doi.org/10.3390/earth4030037 - 9 Sep 2023
Cited by 3 | Viewed by 1603
Abstract
Landslides are among the most relevant and potentially damaging natural risks, causing material and human losses. The department of Aube in France is well known for several major landslide occurrences. This study focuses on the assessment of Landslide Susceptibility (LS) using the Frequency [...] Read more.
Landslides are among the most relevant and potentially damaging natural risks, causing material and human losses. The department of Aube in France is well known for several major landslide occurrences. This study focuses on the assessment of Landslide Susceptibility (LS) using the Frequency Ratio (FR) as a statistical method, the Analytic Hierarchy Process (AHP) as a Multi-Criteria Decision-Making (MCDM) method, and Random Forest (RF) and k-Nearest Neighbor (kNN) as machine learning methods in the Aube department, northeast of France. Subsequently, the thematic layers of eight landslide causative factors, including distance to hydrography, density of quarries, elevation, slope, lithology, distance to roads, distance to faults, and rainfall, were generated in the geographic information system (GIS) environment. The thematic layers were integrated and processed to map landslide susceptibility in the study area. On the other hand, an inventory of landslides was carried out based on the database created by the French Geological Survey (BRGM), where 157 landslide occurrences were selected, and then RF and kNN models were trained to generate landslide maps (LSMs) of the study area. The generated maps were assessed by using the Area Under the Receiver Operating Characteristic Curve (ROC AUC). Subsequently, the accuracy assessment of the FR model revealed more accurate results (AUC = 66.0%) than AHP, outperforming the latter by 6%, while machine learning models results showed that RF gave better results than kNN (<7.3%) with AUC = 95%. Following the analysis of LS mapping results, lithology, distance to the hydrographic network, distance to roads, and elevation were the four main factors controlling landslide susceptibility in the study area. Future mitigation and protection activities within the Aube department can benefit from the present study mapping results, implicating an optimized land management for decision-makers. Full article
Show Figures

Figure 1

7 pages, 251 KiB  
Opinion
Edaphosphere: A Perspective of Soil Inside the Biosphere
by Brian Herreño, Federico De la Colina and María José Delgado-Iniesta
Earth 2023, 4(3), 691-697; https://doi.org/10.3390/earth4030036 - 8 Sep 2023
Cited by 1 | Viewed by 1369
Abstract
The integration of soil into ecology in the current climate crisis is essential for correct environmental management. Soil is a part of ecosystems; above all, it is a component of the biosphere. It is necessary to establish a definition of soil that integrates [...] Read more.
The integration of soil into ecology in the current climate crisis is essential for correct environmental management. Soil is a part of ecosystems; above all, it is a component of the biosphere. It is necessary to establish a definition of soil that integrates biota and biodiversity without losing sight of the historical development of edaphology, the science that studies soil. In this opinion article, we proposes a definition for all soils grouped together in the edaphosphere, which is, in fact, a subsystem of the biosphere. In addition, we highlight the importance of the definition of soil provided by Vasily Dokuchaev, the founder of edaphology, with respect to the integration of soil into the biosphere and the differences between the concepts of pedosphere and edaphosphere. Full article
Show Figures

Figure 1

15 pages, 1649 KiB  
Article
Mapping Is Caring: Fostering Forest Preservation through Young Orang Rimba Initiatives
by Anang Widhi Nirwansyah, Bianca Inez-Pedro, Abdel Mandili, Suwarno and Elly Hasan Sadeli
Earth 2023, 4(3), 676-690; https://doi.org/10.3390/earth4030035 - 7 Sep 2023
Viewed by 1072
Abstract
The UN Convention on the Rights of the Child, Article 12, states that young people should be able to participate in issues that affect them. In this study, the indigenous Orang Rimba community examines the natural resources of their area through mapping so [...] Read more.
The UN Convention on the Rights of the Child, Article 12, states that young people should be able to participate in issues that affect them. In this study, the indigenous Orang Rimba community examines the natural resources of their area through mapping so that the community can be more aware of environmental changes and at the same time their culture can be preserved. This research employs participatory resource mapping (PRM) to gather information about how young Orang Rimba view the forest in relation to customs. The study includes workshops on using GPS and GIS as well as resource mapping activities in the forest ecosystem. Through the participatory resource mapping, the study successfully maps 12 sacred places, 6 animal sites, and 14 medicinal plants in a short survey. The young Orang Rimba were also capable of addressing current environmental issues, including deforestation events, and simultaneously protecting the forest through local cultural practices. The study recommends involving indigenous communities in natural resource protection and awareness through mapping activities from a young age. Full article
Show Figures

Graphical abstract

21 pages, 12928 KiB  
Article
Geospatial Multi-Criteria Evaluation Using AHP–GIS to Delineate Groundwater Potential Zones in Zakho Basin, Kurdistan Region, Iraq
by Wassfi H. Sulaiman and Yaseen T. Mustafa
Earth 2023, 4(3), 655-675; https://doi.org/10.3390/earth4030034 - 1 Sep 2023
Cited by 1 | Viewed by 1302
Abstract
Groundwater availability in the Zakho Basin faces significant challenges due to political issues, border stream control, climate change, urbanization, land use changes, and poor administration, leading to declining groundwater quantity and quality. To address these issues, this study utilized the Analytic Hierarchy Process [...] Read more.
Groundwater availability in the Zakho Basin faces significant challenges due to political issues, border stream control, climate change, urbanization, land use changes, and poor administration, leading to declining groundwater quantity and quality. To address these issues, this study utilized the Analytic Hierarchy Process (AHP) and geospatial techniques to identify potential groundwater sites in Zakho. The study assigned weights normalized through the AHP eigenvector and created a final index using the weighted overlay method and specific criteria such as slope, flow accumulation, drainage density, lineament density, geology, well data, rainfall, and soil type. Validation through the receiver operating characteristic (ROC) curve (AUC = 0.849) and coefficient of determination (R2 = 0.81) demonstrated the model’s accuracy. The results showed that 17% of the area had the highest potential as a reliable groundwater source, 46% represented high-to-moderate potential zones, and 37% had low potential. Flat areas between rivers and high mountains displayed the greatest potential for groundwater development. Identifying these potential sites can aid farmers, regional planners, and local governments in making precise decisions about installing hand pumps and tube wells for a regular water supply. Additionally, the findings contribute to the development of a sustainable groundwater management plan, focusing on improving water usage and protecting water-related ecosystems in the region. Identification of the optimum influencing factors, arrangement of the factors in a hierarchy, and creation of a GWPI map will allow further planning for groundwater preservation and sustainability. This project can be conducted in other areas facing droughts. Full article
Show Figures

Figure 1

29 pages, 9226 KiB  
Article
Interpretation of Fluoride Groundwater Contamination in Tamnar Area, Raigarh, Chhattisgarh, India
by Mirza Kaleem Beg, Navneet Kumar, S. K. Srivastava and E. J. M. Carranza
Earth 2023, 4(3), 626-654; https://doi.org/10.3390/earth4030033 - 22 Aug 2023
Cited by 1 | Viewed by 1620
Abstract
A high concentration of fluoride (F) in drinking water is harmful and is a serious concern worldwide due to its toxicity and accumulation in the human body. There are various sources of fluoride (F) and divergent pathways to enter [...] Read more.
A high concentration of fluoride (F) in drinking water is harmful and is a serious concern worldwide due to its toxicity and accumulation in the human body. There are various sources of fluoride (F) and divergent pathways to enter into groundwater sources. High F incidence in groundwater was reported in Raigarh district of Central India in a sedimentary (Gondwana) aquifer system. The present study investigates the hydrogeochemistry of groundwater in the Tamnar area of Raigarh district to understand the plausible cause(s) of high F concentration, especially the source(s) and underlying geochemical processes. Groundwater samples, representing pre-monsoon (N = 83), monsoon (N = 20), and post-monsoon (N = 81) seasons, and rock samples (N = 4) were collected and analyzed. The study revealed that (i) groundwater with high F concentration occurs in the Barakar Formation, which has a litho-assemblage of feldspathic sandstones, shales, and coal, (ii) high F concentration is mainly associated with Na-Ca-HCO3, Na-Ca-Mg-HCO3, and Na-Mg-Ca-HCO3 types of groundwater, (iii) the F concentration increases as the ratio of Na+ and Ca2+ increases (Na+: Ca2+, concentration in meq/l), (iv) F has significant positive correlation with Na+ and SiO2, and significant negative correlation with Ca2+, Mg2+, HCO3, and TH, and (v) high F concentration in groundwater is found in deeper wells. Micas and clay minerals, occurring in the feldspathic sandstones and intercalated shale/clay/coal beds, possibly form an additional source for releasing F in groundwater. Feldspar dissolution coupled with anion (OH or F) and cation (Ca2+ for Na+) exchange are probably the dominant geochemical processes taking place in the study area. The higher residence time and temperature of groundwater in deeper aquifers also play a role in enhancing the dissolution of fluorine-bearing minerals. Systematic hydrogeochemical investigations are recommended in the surrounding area having a similar geologic setting in view of the potential health risk to a large population. Full article
Show Figures

Figure 1

20 pages, 26957 KiB  
Article
Spatio-Temporal Evolution of Rainfall over the Period 1981–2020 and Management of Surface Water Resources in the Nakanbe–Wayen Watershed in Burkina Faso
by Wennepinguere Virginie Marie Yameogo, You Lucette Akpa, Jean Homian Danumah, Farid Traore, Boalidioa Tankoano, Zezouma Sanon, Oumar Kabore and Mipro Hien
Earth 2023, 4(3), 606-625; https://doi.org/10.3390/earth4030032 - 18 Aug 2023
Viewed by 862
Abstract
Spatio-temporal analysis of rainfall trends in a watershed is an effective tool for sustainable water resources management, as it allows for an understanding of the impacts of these changes at the watershed scale. The objective of the present study is to analyze the [...] Read more.
Spatio-temporal analysis of rainfall trends in a watershed is an effective tool for sustainable water resources management, as it allows for an understanding of the impacts of these changes at the watershed scale. The objective of the present study is to analyze the impacts of climate change on the availability of surface water resources in the Nakanbe–Wayen watershed over the period from 1981 to 2020. The analysis was conducted on in situ rainfall data collected from 14 meteorological stations distributed throughout the watershed and completed with CHIRPS data. Ten precipitation indices, recommended by the ETCCDI (Expert Team on Climate Change Detection and Indices), were calculated using the RClimDex package. The results show changes in the distribution of annual precipitation and an increasing trend in annual precipitation. At the same time, a trend towards an increase in the occurrence and intensity of extreme events was also observed over the last 4 decades. In light of these analyses, it should be emphasized that the increase in precipitation observed in the Nakanbe–Wayen watershed is induced by the increase in the occurrence and intensity of events, as a trend towards an increase in persistent drought periods (CDD) is observed. This indicates that the watershed is suffering from water scarcity. Water stress and water-related hazards have a major impact on communities and ecosystems. In these conditions of vulnerability, the development of risk-management strategies related to water resources is necessary, especially at the local scale. This should be formulated in light of observed and projected climate extremes in order to propose an appropriate and anticipated management strategy for climate risks related to water resources at the watershed scale. Full article
Show Figures

Figure 1

22 pages, 13445 KiB  
Article
Unintentional Recharge of Aquifers from Small Dams and Dykes in Spain: A GIS-Based Approach to Determine a Fractional Volume
by Enrique Fernández Escalante, José David Henao Casas, Carlos Moreno de Guerra Per, María Dolores Maza Vera and Carles Moreno Valverde
Earth 2023, 4(3), 584-605; https://doi.org/10.3390/earth4030031 - 14 Aug 2023
Viewed by 1408
Abstract
Conducting an accurate hydrological water balance at the regional and country-wide scales is paramount to assessing available water resources and adequately allocating them. One of the main components of these balances is the anthropogenic recharge of groundwater either intentionally, through managed aquifer recharge [...] Read more.
Conducting an accurate hydrological water balance at the regional and country-wide scales is paramount to assessing available water resources and adequately allocating them. One of the main components of these balances is the anthropogenic recharge of groundwater either intentionally, through managed aquifer recharge (MAR), or unintentionally, where infiltration from dams and dykes can play a significant role. In Spain, proper management of water resources is critical due to the arid to semiarid conditions prevalent in most of the territory and the relevance of water resources for maintaining a robust agricultural sector. Previous work estimated country-wide recharge from MAR at 150 to 280 Mm3/year. Recently, water authorities pointed out that, according to hydrological water balances, the total unintentional recharge volume from water courses may exceed 500 Mm3/year. The present research aims to present a new inventory of transverse structures (also referred to as small dams and dykes) in Spain and use it to estimate country-wide unintentional recharge. The inventory, compiled by the Spanish Ministry for the Ecological Transition and the Demographic Challenge, has 27,680 structures and includes construction and impoundment characteristics, which allow for estimating the wet perimeter and the infiltration area. To this end, structural data from the inventory were crossed through map algebra in a GIS environment with thematic layers, such as lithology, permeability, the digital elevation model, the transverse structures’ wetted area, the average groundwater levels, and a clogging correction factor. Two analytical formulas to compute infiltration from small dams and dykes were tested. The resulting volume of unintentional recharge from transverse structures ranges between 812.5 and 2716.6 Mm3/year. The comparison against regional and national water balances suggests that the lowest value of the range (i.e., 812.5 Mm3/year) is probably the most realistic. Anthropogenic recharge from MAR and transverse structures is likely in the range of 1012.5–1514.8 Mm3/year. This rough figure can help close the hydrological balance at the national and river basin levels and contribute to calibrating regional models. Furthermore, they provide an order of magnitude for anthropogenic recharge at a national scale, which is difficult to obtain. Full article
Show Figures

Figure 1

14 pages, 2190 KiB  
Article
A Comparative Study for Provision of Environmental Flows in the Tapi River
by Jaini Umrigar, Darshan J. Mehta, Tommaso Caloiero, Hazi Md. Azamathulla and Vijendra Kumar
Earth 2023, 4(3), 570-583; https://doi.org/10.3390/earth4030030 - 12 Aug 2023
Cited by 2 | Viewed by 1313
Abstract
Environmental flows are defined as the flow required into a stream to maintain the river’s ecosystem. The notion of Environmental Flow Allocation (EFA) ensures that a sufficient amount of water is delivered to the stream to maintain ecological integrity. The objective of this [...] Read more.
Environmental flows are defined as the flow required into a stream to maintain the river’s ecosystem. The notion of Environmental Flow Allocation (EFA) ensures that a sufficient amount of water is delivered to the stream to maintain ecological integrity. The objective of this study is to examine environmental flows and determine the best acceptable strategy for providing flows into the river in the Lower Tapi Basin. To achieve this objective, daily discharge data from three sites, Ukai (period 1975–2020), Motinaroli (period 1990–2021), and Ghala (period 1995–2005) were collected and analyzed using the Tennant, Tessman, variable monthly flow (VMF), and Smakhtin methodologies. A comparative analysis was carried out on all three sites using the four methodologies. The Tessman and VMF approaches have a strong connection with the computed environmental flow requirements (EFR), according to the results. The calculated EFR was found to be in the range of 30–35% of mean annual flows (MAF). The maximum EFR found at station Ghala is about 54.5% of MAF according to the Tessman method. Such research will help to prevent future degradation of the river by supplying flow in accordance with the EFR, and it will also be used by stakeholders and policymakers to allocate water to preserve the ecosystem. Full article
Show Figures

Figure 1

18 pages, 4426 KiB  
Article
Global Climate Classification and Comparison to Mid-Holocene and Last Glacial Maximum Climates, with Added Aridity Information and a Hypertropical Class
by Brice B. Hanberry
Earth 2023, 4(3), 552-569; https://doi.org/10.3390/earth4030029 - 27 Jul 2023
Viewed by 1889
Abstract
Climate classifications supply climate visualization with inference about general vegetation types. The Köppen classification system of thermal classes and an arid class is widely used, but options are available to strengthen climate change detection. For this study, I incorporated temperature and aridity information [...] Read more.
Climate classifications supply climate visualization with inference about general vegetation types. The Köppen classification system of thermal classes and an arid class is widely used, but options are available to strengthen climate change detection. For this study, I incorporated temperature and aridity information into all climate classes to isolate climate change, added a hypertropical class to better detect warming and drying in tropical zones, and developed a consistent ruleset of thermal classes with one temperature variable for streamlined application, yet maintained primary Köppen thermal classes. I compared climate currently to 6000 years ago (ka; Mid-Holocene) and 22 ka (Last Glacial Maximum) worldwide. Growing degree days > 0 °C was the most efficient variable for modeling thermal classes. Climate classes based on growing degree days matched 86% of Köppen thermal classes. Current climate shared 80% and 23% of class assignments with the Mid-Holocene and Last Glacial Maximum, respectively, with dry conditions shifting to the tropical and hypertropical classes under current climate. Contributing to our understanding of global environmental change, this classification demonstrated that the hypertropical class experienced the greatest change in area since 6 ka and the second greatest change in area since 22 ka, and the greatest increase in percentage arid classes during both intervals. The added hypertropical class with aridity information delivered sensitive detection of warming and drying for relevant climate classes under climate change. Full article
Show Figures

Figure 1

12 pages, 665 KiB  
Article
A Radiological Risk Assessment of 226Ra, 228Ra and 40K Isotopes in Tilapia Fish and its Granitic Environment in Singida Municipality, Tanzania
by Amin R. Kazoka, Jilisa Mwalilino and Paul Mtoni
Earth 2023, 4(3), 540-551; https://doi.org/10.3390/earth4030028 - 26 Jul 2023
Cited by 2 | Viewed by 1072
Abstract
Consumption of fish containing elevated levels of radionuclides can lead to undesirable health effects for consumers. People in the Singida Municipality harvest fish from lakes and ponds of granite rocks which are linked with hazardous radioisotopes that may be bio-concentrated by fishes they [...] Read more.
Consumption of fish containing elevated levels of radionuclides can lead to undesirable health effects for consumers. People in the Singida Municipality harvest fish from lakes and ponds of granite rocks which are linked with hazardous radioisotopes that may be bio-concentrated by fishes they consume. Currently, no study has ascertained the levels of radioisotopes in fish from these environments. This study was carried out to analyse the radioactivity levels of 226Ra, 228Ra and 40K isotopes in order to assess the radiological risk associated with Tilapia fish consumption and its environment in Singida Municipality. Some 51 samples, which included water (20), sediment (20), Nile tilapia (8) and Manyara tilapia (3), were randomly sampled and composited; then, they were analysed using a high-purity germanium (HPGe) detector, between May and June 2022. The results revealed that (i) the activity levels of 228Ra were below the detection limit for fish and water samples, while in sediment, the combined activity of 228Ra was within the acceptable international levels; (ii) the mean activity concentrations of 226Ra and 40K in all other samples were within the recommended levels; (iii) the activities of radionuclides in the samples analysed were high in sediments, followed by fish, and lastly water; (iv) the bioaccumulation results show that only 40K was bio-accumulated (with 1.26 in Nile tilapia), while other radionuclides (226Ra, 228Ra) were not bio-accumulated; (vi) the radionuclide transfer from water to fish was higher compared to the radionuclide transfer from sediment to fish; (vii) the human effective doses due to consumption of Nile tilapia and Manyara tilapia were 0.00973 and 0.005 mSv/y, respectively, which is below the 1 mSv/y international limit. These findings therefore show that the current levels of radioactivity in fish in the study area do not pose a significant radiological risk to fish consumers. However, more studies on other types of fish are recommended. Full article
Show Figures

Figure 1

18 pages, 4761 KiB  
Article
Statistical Connections between Large-Scale Climate Indices and Observed Mean and Extreme Temperatures in the US from 1948 to 2018
by Jason Giovannettone
Earth 2023, 4(3), 522-539; https://doi.org/10.3390/earth4030027 - 25 Jul 2023
Viewed by 837
Abstract
In order to better understand the extent to which global climate variability is linked to the frequency and intensity of heat waves and overall changes in temperature throughout the United States (US), correlations between long-term monthly mean, minimum, and maximum temperatures throughout the [...] Read more.
In order to better understand the extent to which global climate variability is linked to the frequency and intensity of heat waves and overall changes in temperature throughout the United States (US), correlations between long-term monthly mean, minimum, and maximum temperatures throughout the contiguous US on the one hand and low-frequency variability of multiple climate indices (CIs) on the other hand are analyzed for the period from 1948 to 2018. The Pearson’s correlation coefficient is used to assess correlation strength, while leave-one-out cross-validation and a bootstrapping technique (p-value) are used to address potential serial and spurious correlations and assess the significance of each correlation. Three parameters defined the sliding windows over which surface temperature and CI values were averaged: window size, lag time between the temperature and CI windows, and the beginning month of the temperature window. A 60-month sliding window size and 0 lag time resulted in the highest correlations overall; beginning months were optimized on an individual site basis. High (r ≥ 0.60) and significant (p-value ≤ 0.05) correlations were identified. The Western Hemisphere Warm Pool (WHWP) and El Niño/Southern Oscillation (ENSO) exhibited the strongest links to temperatures in the western US, tropical Atlantic sea surface temperatures to temperatures in the central US, the WHWP to temperatures throughout much of the eastern US, and atmospheric patterns over the northern Atlantic to temperatures in the Northeast and Southeast. The final results were compared to results from previous studies focused on precipitation and coastal sea levels. Regional consistency was found regarding links between the northern Atlantic and overall weather and coastal sea levels in the Northeast and Southeast as well as on weather in the upper Midwest. Though the MJO and WHWP revealed dominant links with precipitation and temperature, respectively, throughout the West, ENSO revealed consistent links to sea levels and surface temperatures along the West Coast. These results help to focus future research on specific mechanisms of large-scale climate variability linked to US regional climate variability and prediction potential. Full article
Show Figures

Figure 1

19 pages, 7955 KiB  
Article
Assessing Land Use/Land Cover Changes and Urban Heat Island Intensification: A Case Study of Kamrup Metropolitan District, Northeast India (2000–2032)
by Upasana Choudhury, Suraj Kumar Singh, Anand Kumar, Gowhar Meraj, Pankaj Kumar and Shruti Kanga
Earth 2023, 4(3), 503-521; https://doi.org/10.3390/earth4030026 - 10 Jul 2023
Cited by 13 | Viewed by 2477
Abstract
Amid global concerns regarding climate change and urbanization, understanding the interplay between land use/land cover (LULC) changes, the urban heat island (UHI) effect, and land surface temperatures (LST) is paramount. This study provides an in-depth exploration of these relationships in the context of [...] Read more.
Amid global concerns regarding climate change and urbanization, understanding the interplay between land use/land cover (LULC) changes, the urban heat island (UHI) effect, and land surface temperatures (LST) is paramount. This study provides an in-depth exploration of these relationships in the context of the Kamrup Metropolitan District, Northeast India, over a period of 22 years (2000–2022) and forecasts the potential implications up to 2032. Employing a high-accuracy supervised machine learning algorithm for LULC analysis, significant transformations are revealed, including the considerable growth in urban built-up areas and the corresponding decline in cultivated land. Concurrently, a progressive rise in LST is observed, underlining the escalating UHI effect. This association is further substantiated through correlation studies involving the normalized difference built-up index (NDBI) and the normalized difference vegetation index (NDVI). The study further leverages the cellular automata–artificial neural network (CA-ANN) model to project the potential scenario in 2032, indicating a predicted intensification in LST, especially in regions undergoing rapid urban expansion. The findings underscore the environmental implications of unchecked urban growth, such as rising temperatures and the intensification of UHI effects. Consequently, this research stresses the critical need for sustainable land management and urban planning strategies, as well as proactive measures to mitigate adverse environmental changes. The results serve as a vital resource for policymakers, urban planners, and environmental scientists working towards harmonizing urban growth with environmental sustainability in the face of escalating global climate change. Full article
Show Figures

Figure 1

42 pages, 5613 KiB  
Article
Spatial and Temporal Dynamics of Key Water Quality Parameters in a Thermal Stratified Lake Ecosystem: The Case Study of Lake Mead
by Godson Ebenezer Adjovu, Haroon Stephen and Sajjad Ahmad
Earth 2023, 4(3), 461-502; https://doi.org/10.3390/earth4030025 - 30 Jun 2023
Cited by 3 | Viewed by 1633
Abstract
Lake Mead located in the Arizona–Nevada region of the Mohave Dessert is a unique and complex water system whose flow follows that of a warm monomictic lake. Although monomictic lakes experience thermal stratification for almost the entire year with a period of complete [...] Read more.
Lake Mead located in the Arizona–Nevada region of the Mohave Dessert is a unique and complex water system whose flow follows that of a warm monomictic lake. Although monomictic lakes experience thermal stratification for almost the entire year with a period of complete mixing, the lake on occasion deviates from this phenomenon, undergoing incomplete turnovers categorized with light stratifications every other year. The prolonged drought and growing anthropogenic activities have the potential to considerably impact the quality of the lake. Lake Mead and by extension the Boulder Basin receive cooler flow from the Colorado River and flow with varying temperatures from the Las Vegas Wash (LVW), which impacts its stratification and complete turnovers. This study analyzes four key water quality parameters (WQPs), namely, total dissolved solids (TDS), total suspended solids (TSS), temperature, and dissolved oxygen (DO), using statistical and spatial analyses to understand their variations in light of the lake stratifications and turnovers to further maintain its overall quality and sustainability. The study also evaluates the impacts of hydrological variables including in and out flows, storage, evaporation, and water surface elevation on the WQPs. The results produced from the analysis show significant levels of TDS, TSS, and temperature from the LVW and Las Vegas Bay regions compared with the Boulder Basin. LVW is the main channel for conveying effluents from several wastewater treatment facilities into the lake. We observed an increase in the levels of TDS, TSS, and temperature water quality in the epilimnion compared with the other layers of the lake. The metalimnion and the hypolimnion layer, however, showed reduced DO due to depletion by algal blooms. We observed statistically significant differences in the WQPs throughout various months, but not in the case for season and year, an indication of relatively consistent variability throughout each season and year. We also observed a no clear trend of influence of outflows and inflows on TDS, temperature, and DO. TSS concentrations in the lake, however, remained constant, irrespective of the inflows and outflows, possibly due to the settling of the sediments and the reservoir capacity. Full article
Show Figures

Figure 1

16 pages, 4271 KiB  
Article
Optimizing Rice Irrigation Strategies to Maximize Water Productivity: A Simulation Study Using AquaCrop Model for the Yanyun Irrigation District, Yangzhou, China
by Monera Mostafa, Wan Luo, Jiarong Zou and Ali Salem
Earth 2023, 4(3), 445-460; https://doi.org/10.3390/earth4030024 - 28 Jun 2023
Viewed by 1119
Abstract
The AquaCrop model is used to predict rice yield in response to different irrigation management in the Yanyun irrigation area in Yangzhou, China, and the constraints to rice production were identified to maximize water productivity based on model simulations. The model was calibrated [...] Read more.
The AquaCrop model is used to predict rice yield in response to different irrigation management in the Yanyun irrigation area in Yangzhou, China, and the constraints to rice production were identified to maximize water productivity based on model simulations. The model was calibrated by comparing measured and predicted canopy cover (CC), yield, and soil water content during the growing season in 2018. The results showed that, for CC simulations, R2 was 0.99, RMSE was 3.6%, and NRMSE was 5.3%; for Biomass simulation, RMSE was 0.50 t/ha, and NRMSE was 5.3%. Different irrigation strategies were analyzed for a long-term simulation period from 1955 to 2014. The simulated rice yield increased rapidly as irrigation demand increased initially, and then gradually stabilized. The simulated rice yield fluctuated in the different years. The Pearson type-III model method was used to identify different hydrological years of wet, normal, and dry years. The analysis identified the wet year as 1991, normal year as 1981, and dry year as 1966. In the different rainfall years (1991, 1981, and 1966) water use efficiency (WUE), water productivity (WPet), and irrigation water productivity (IWP) were utilized to determine the irrigation strategy. The predicted highest WPet in the wet year was 1.77kg m−3, while the lowest WPet in the dry year was 1.13 kg m−3. The highest IWP was 19.78 kg m−3 in the wet year, and 9.32 kg m−3 in the normal year; while the lowest IWP in the dry year was 1.90 kg m−3. IWP was significantly higher in the rainy year, while WUE was significantly lower. On the other hand, WPet was more extensive in the wet year because the yield was higher, and the Evapotranspiration (ET) was smaller in comparison to the dry year. Full article
Show Figures

Figure 1

Previous Issue
Next Issue
Back to TopTop