
Spatio-Temporal Evolution of Rainfall over the Period 1981–2020 and Management of Surface Water Resources in the Nakanbe–Wayen Watershed in Burkina Faso

 ,
,  ,
,
Abstract
:1. Introduction
2. Materials and Methods
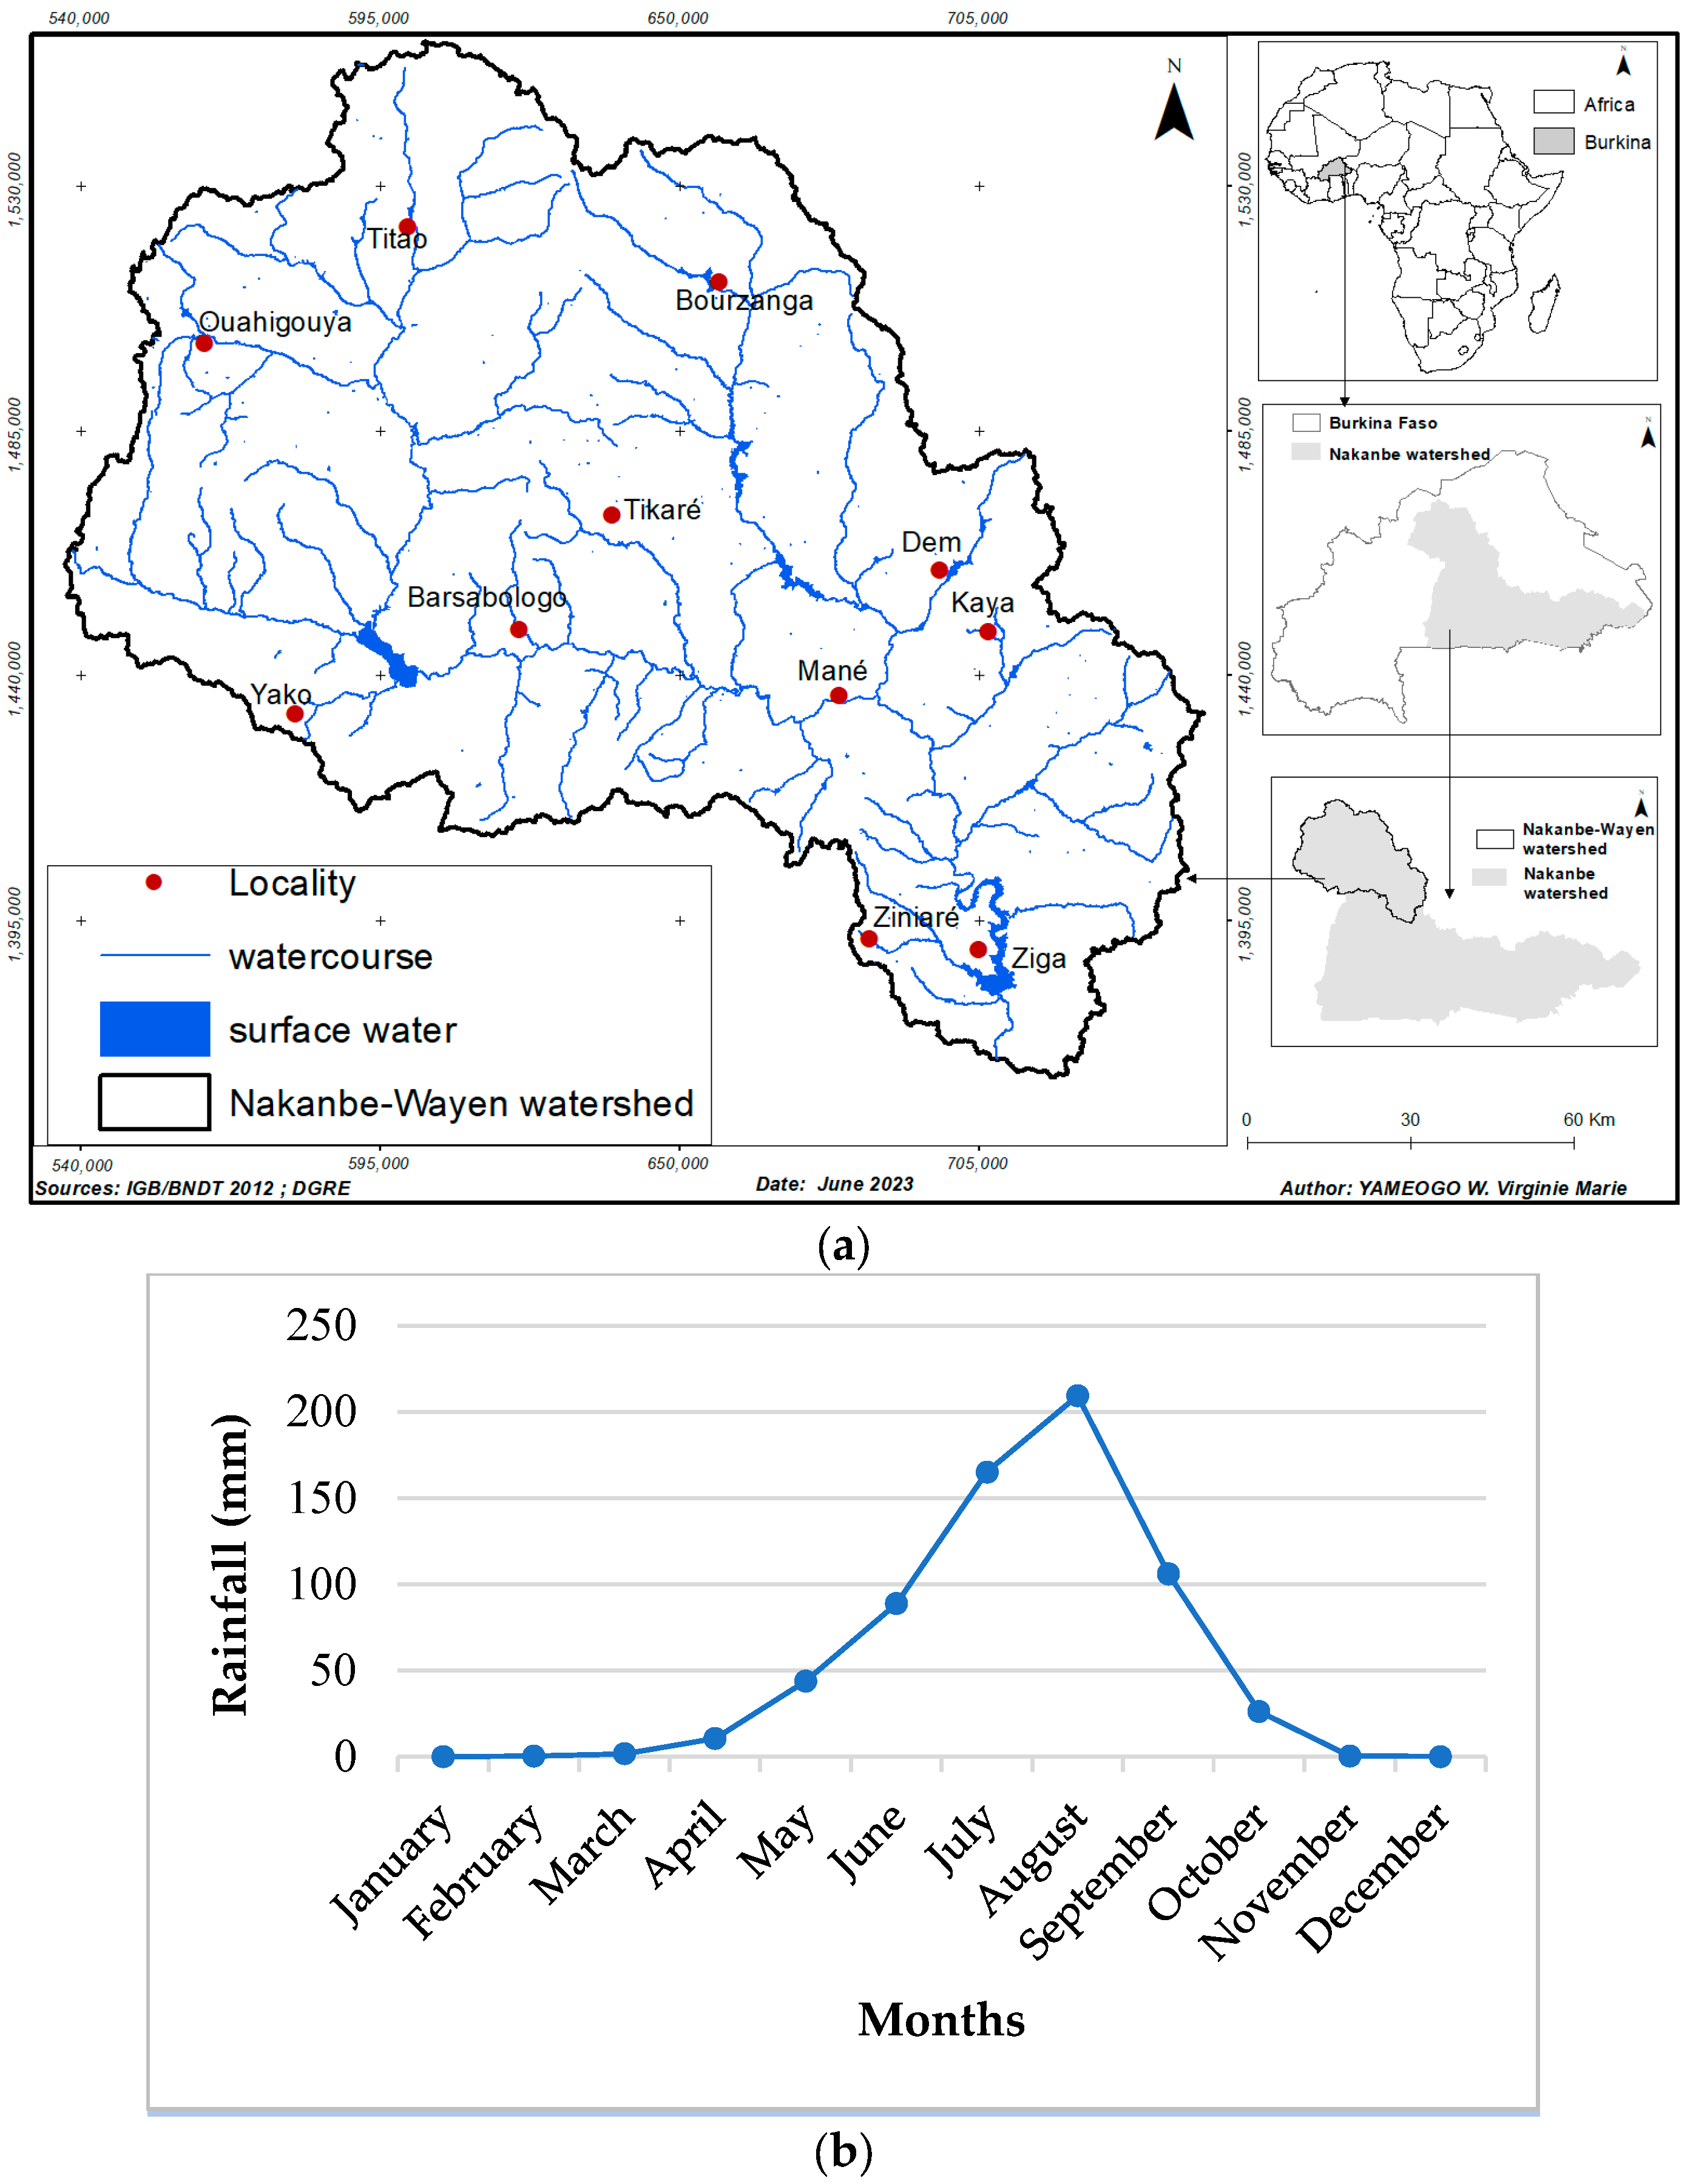
2.1. Study Area
2.2. Data Sources
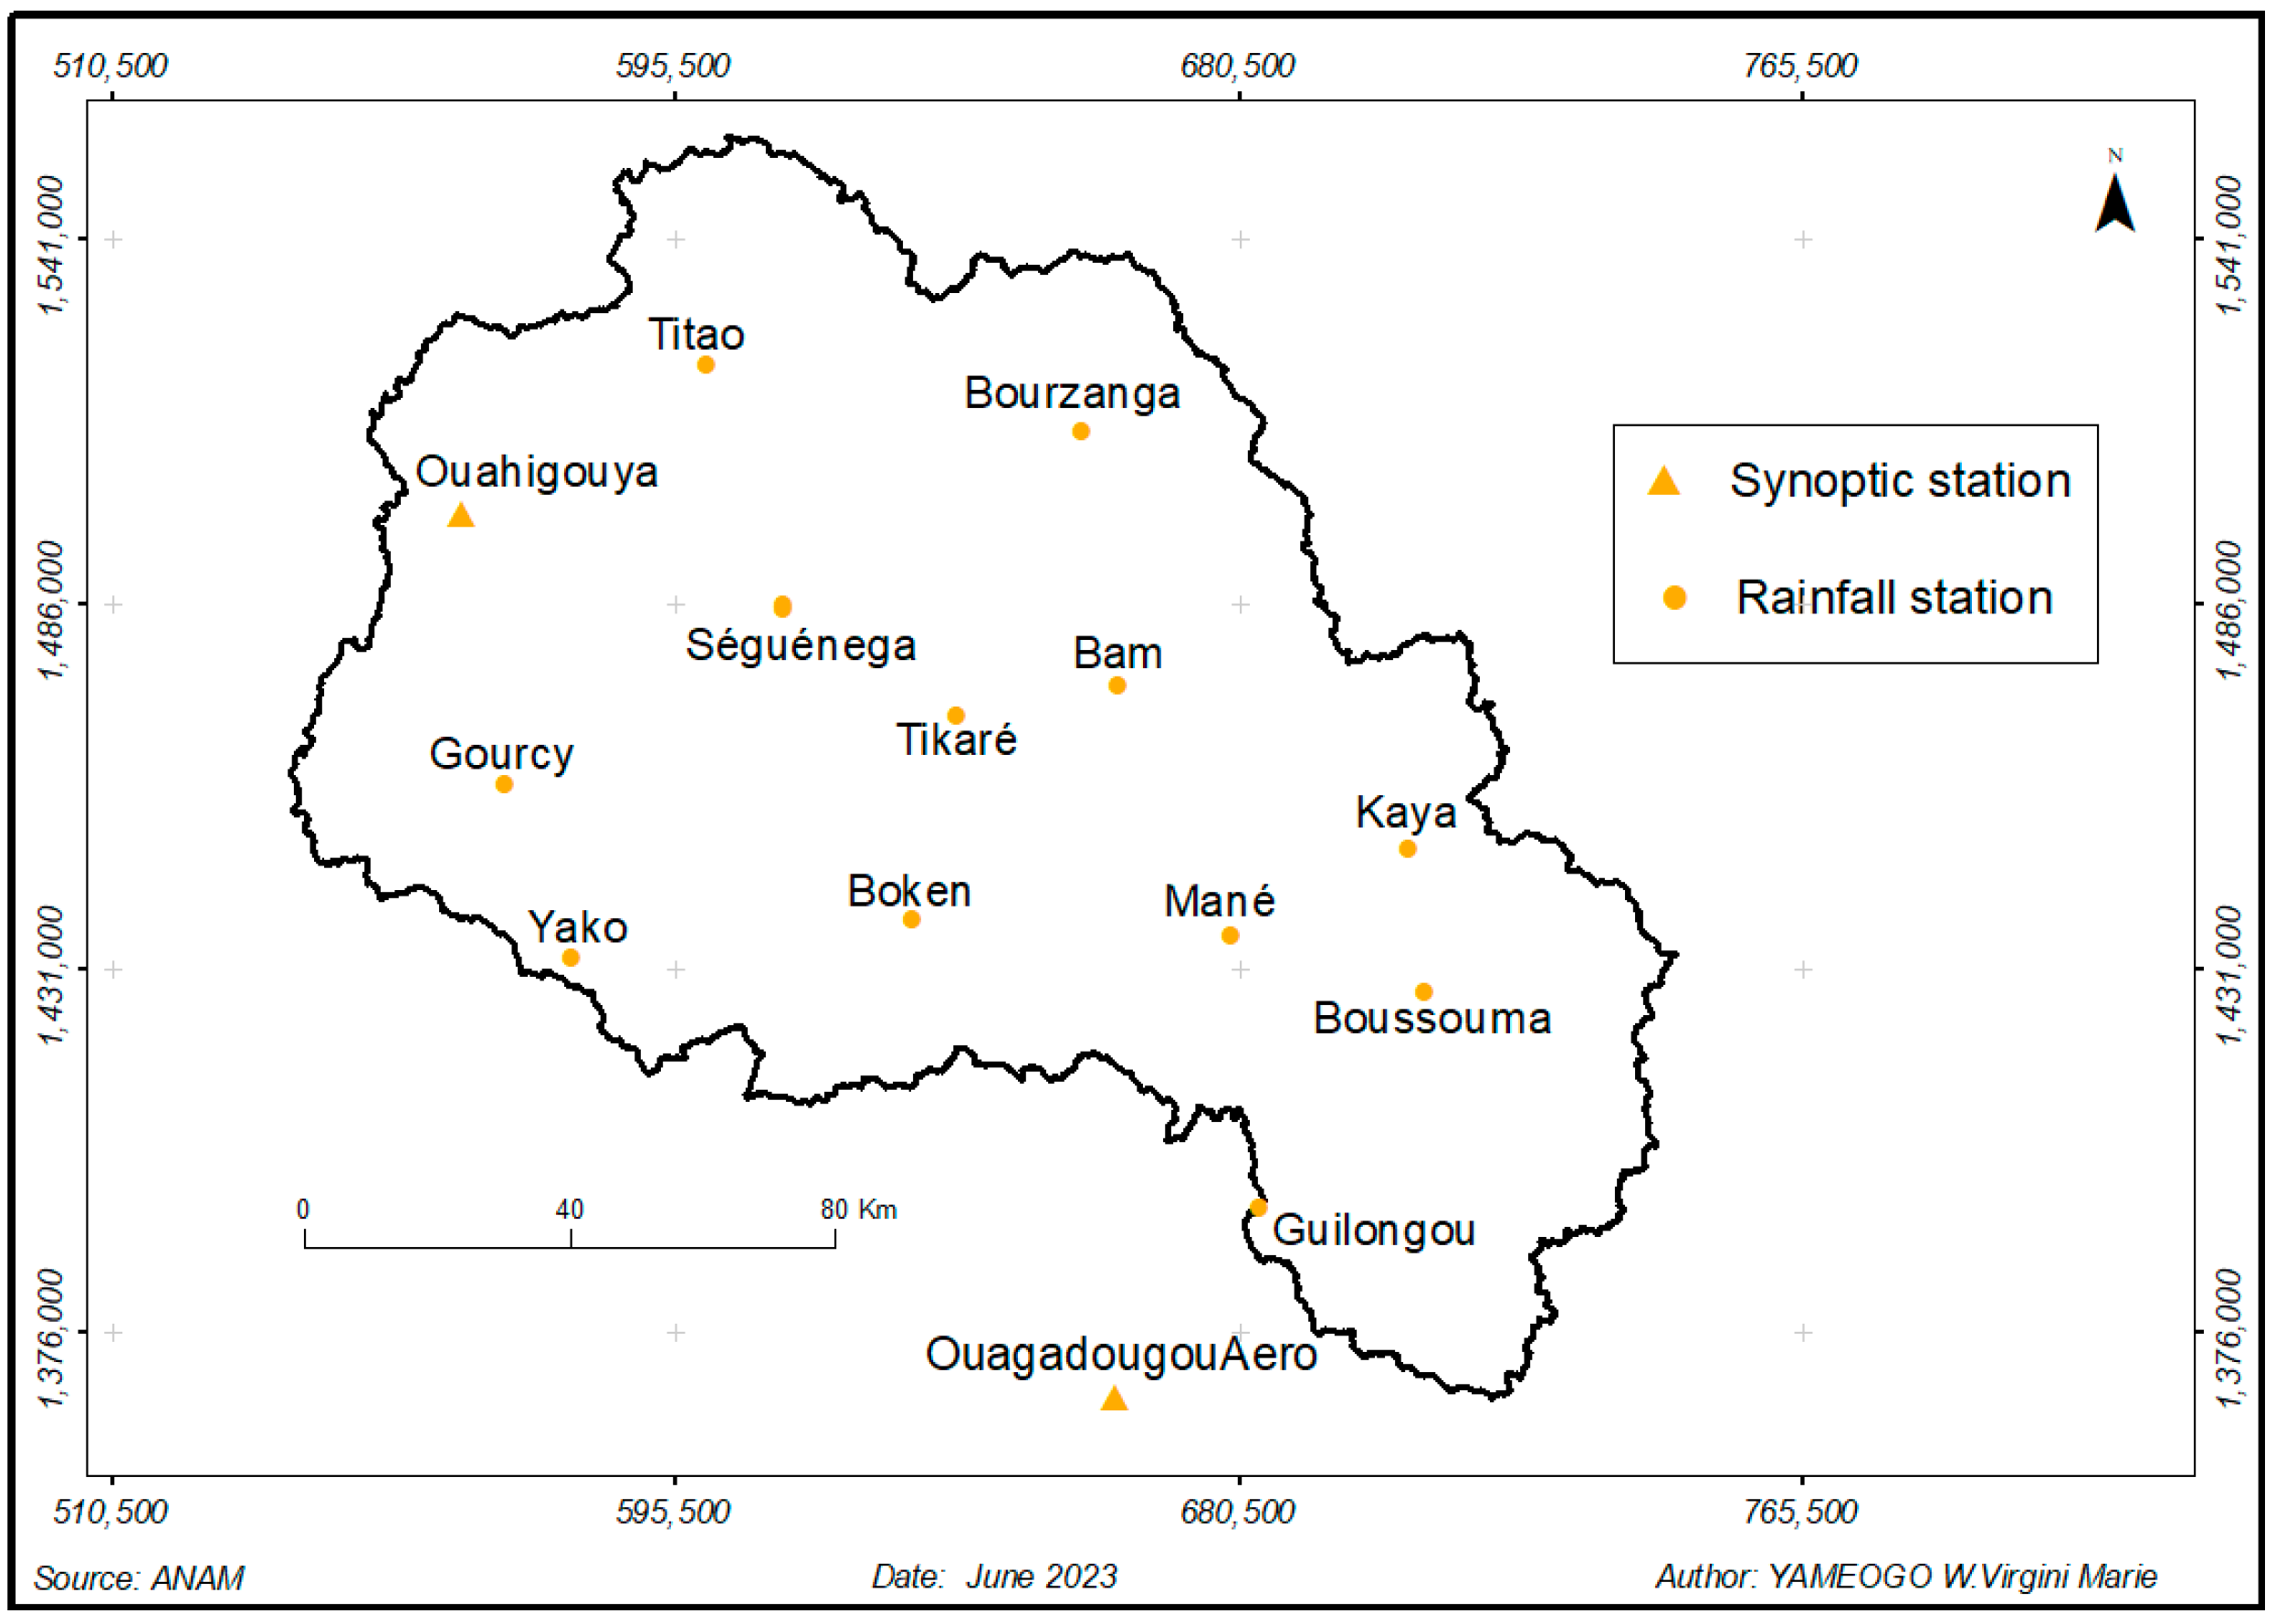
2.2.1. In Situ Data
2.2.2. Gridded Climate Data
2.3. Methods
2.3.1. Data Extraction and Dataset Validation
2.3.2. Quality Control and Homogenization
- Quality control
- Homogenization
2.3.3. Analysis of Climate Extremes Indices Using RClimDex
2.3.4. Trend Analysis
2.3.5. Spatial Interpolation
3. Results
3.1. Data Validation
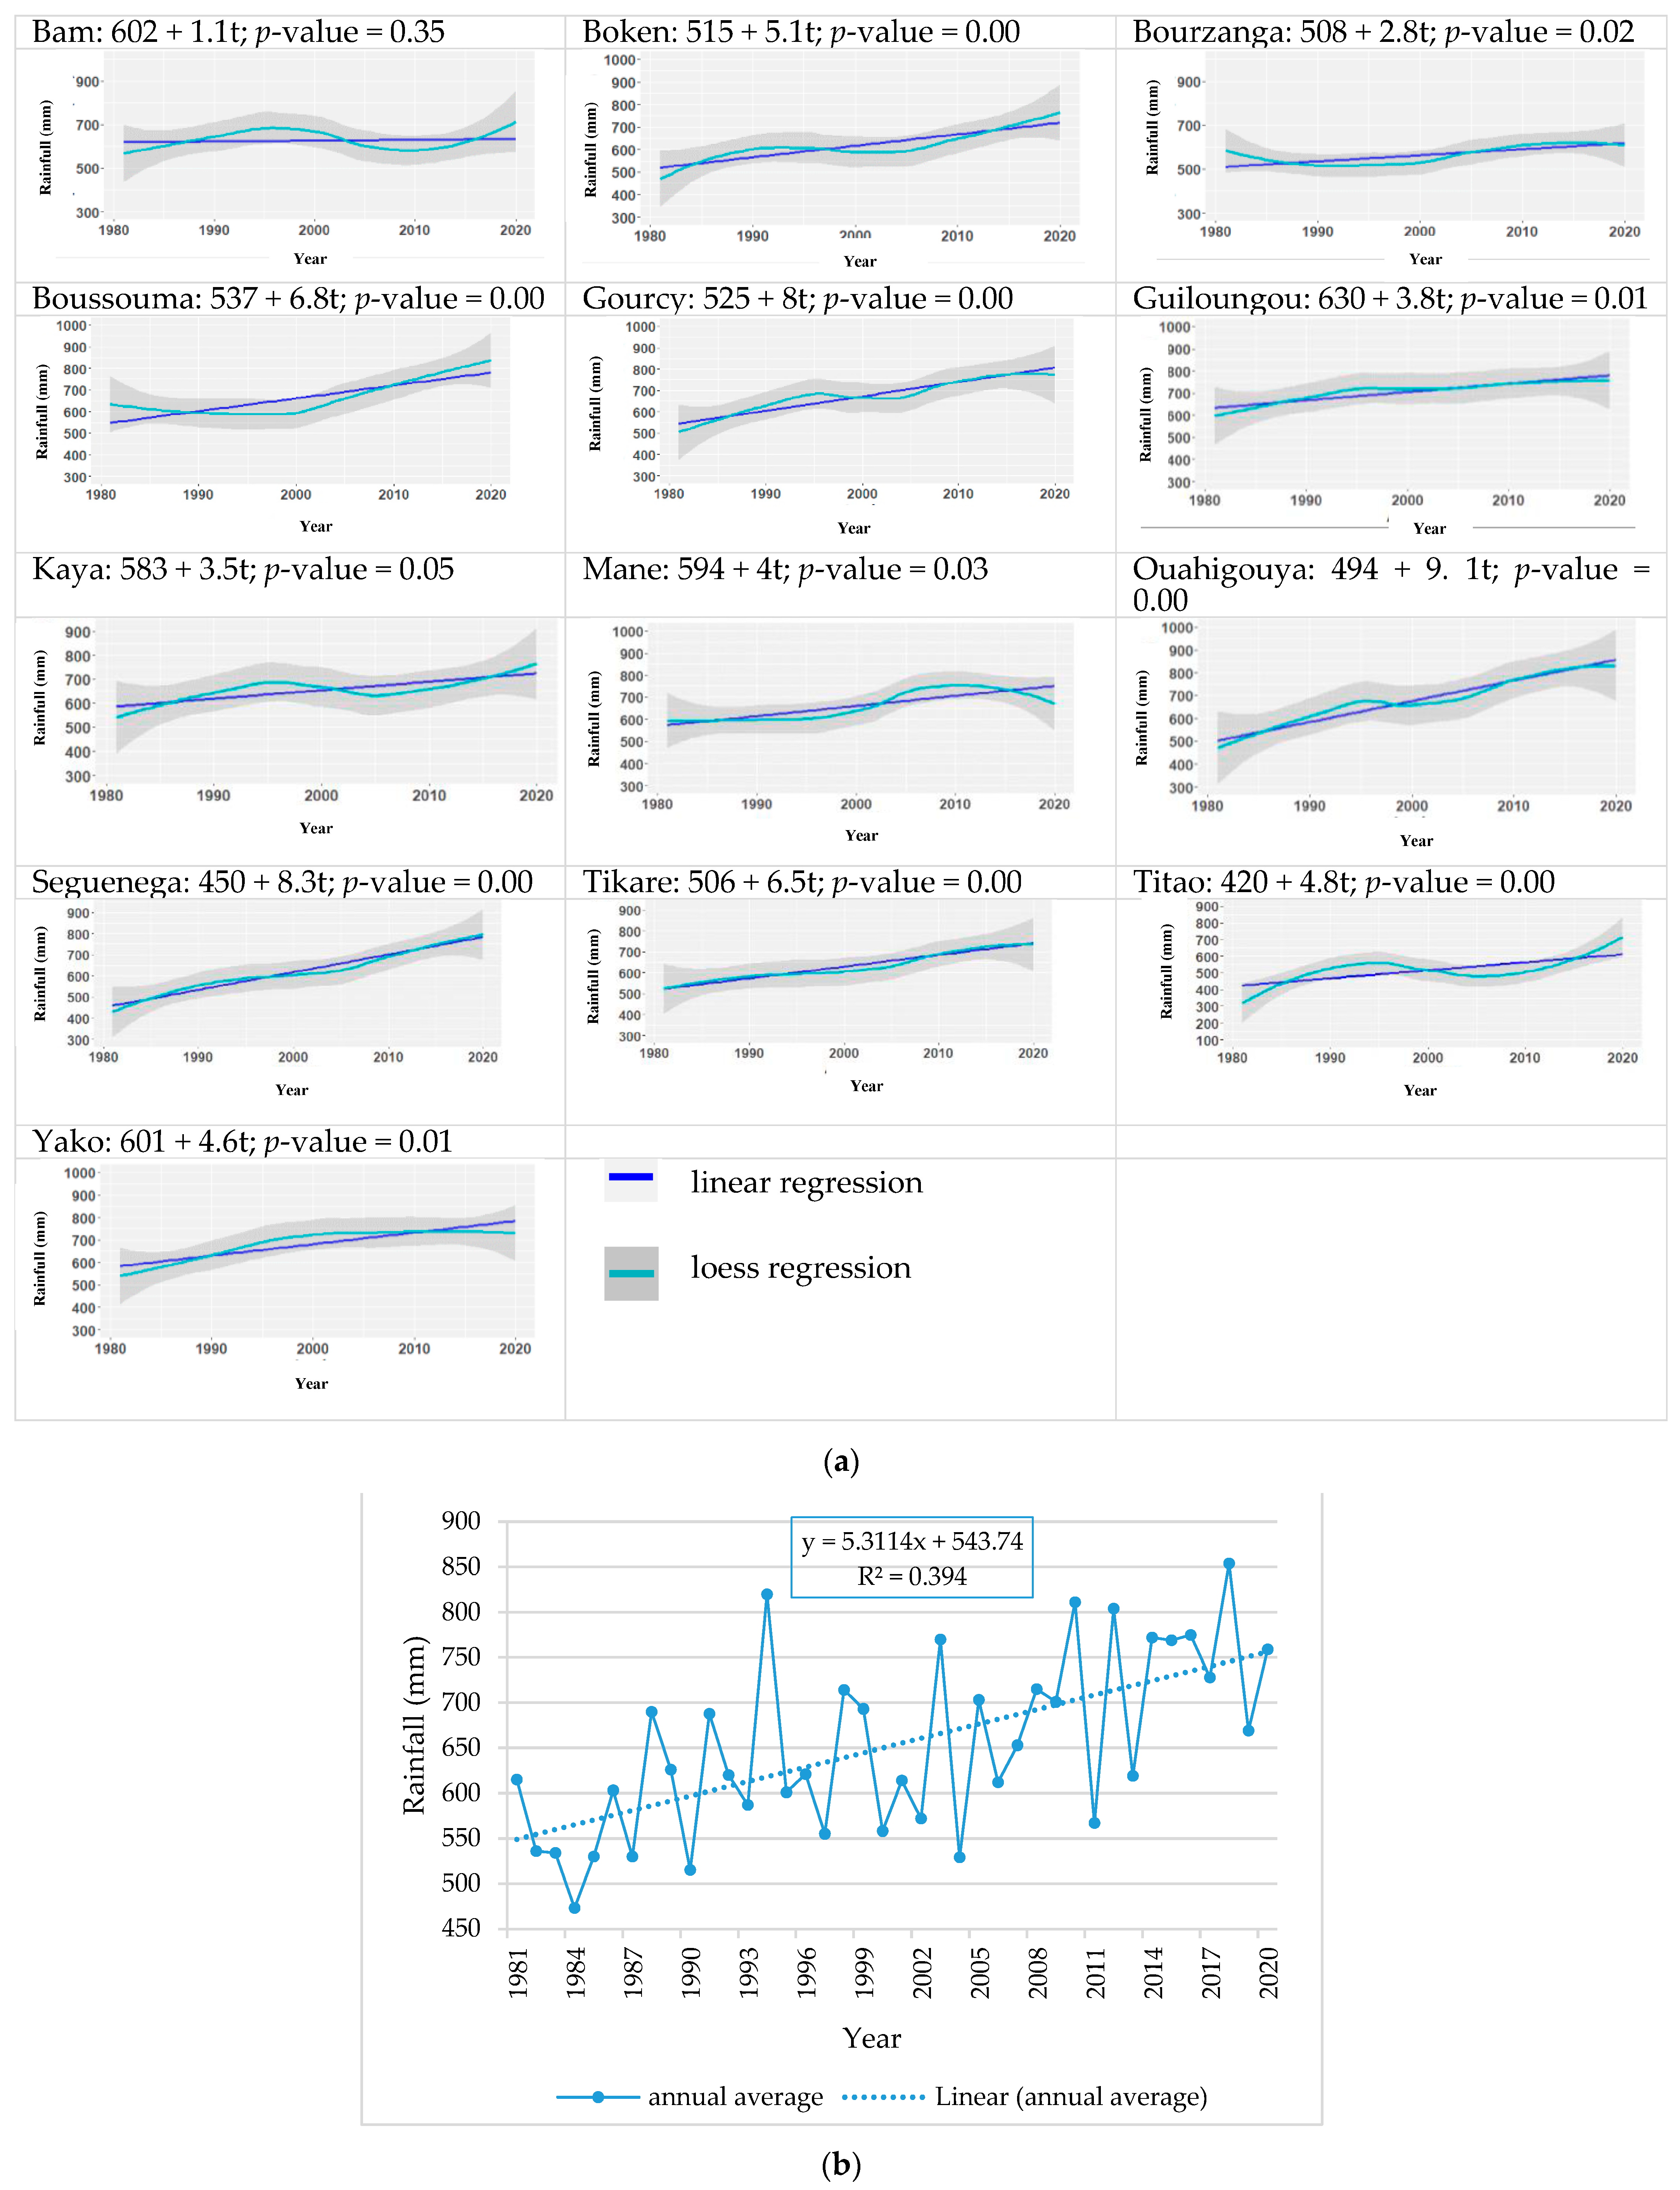
3.2. Average Annual Precipitation
3.3. Analysis Spatio-Temporal Evolution of Extreme Precipitation Trends
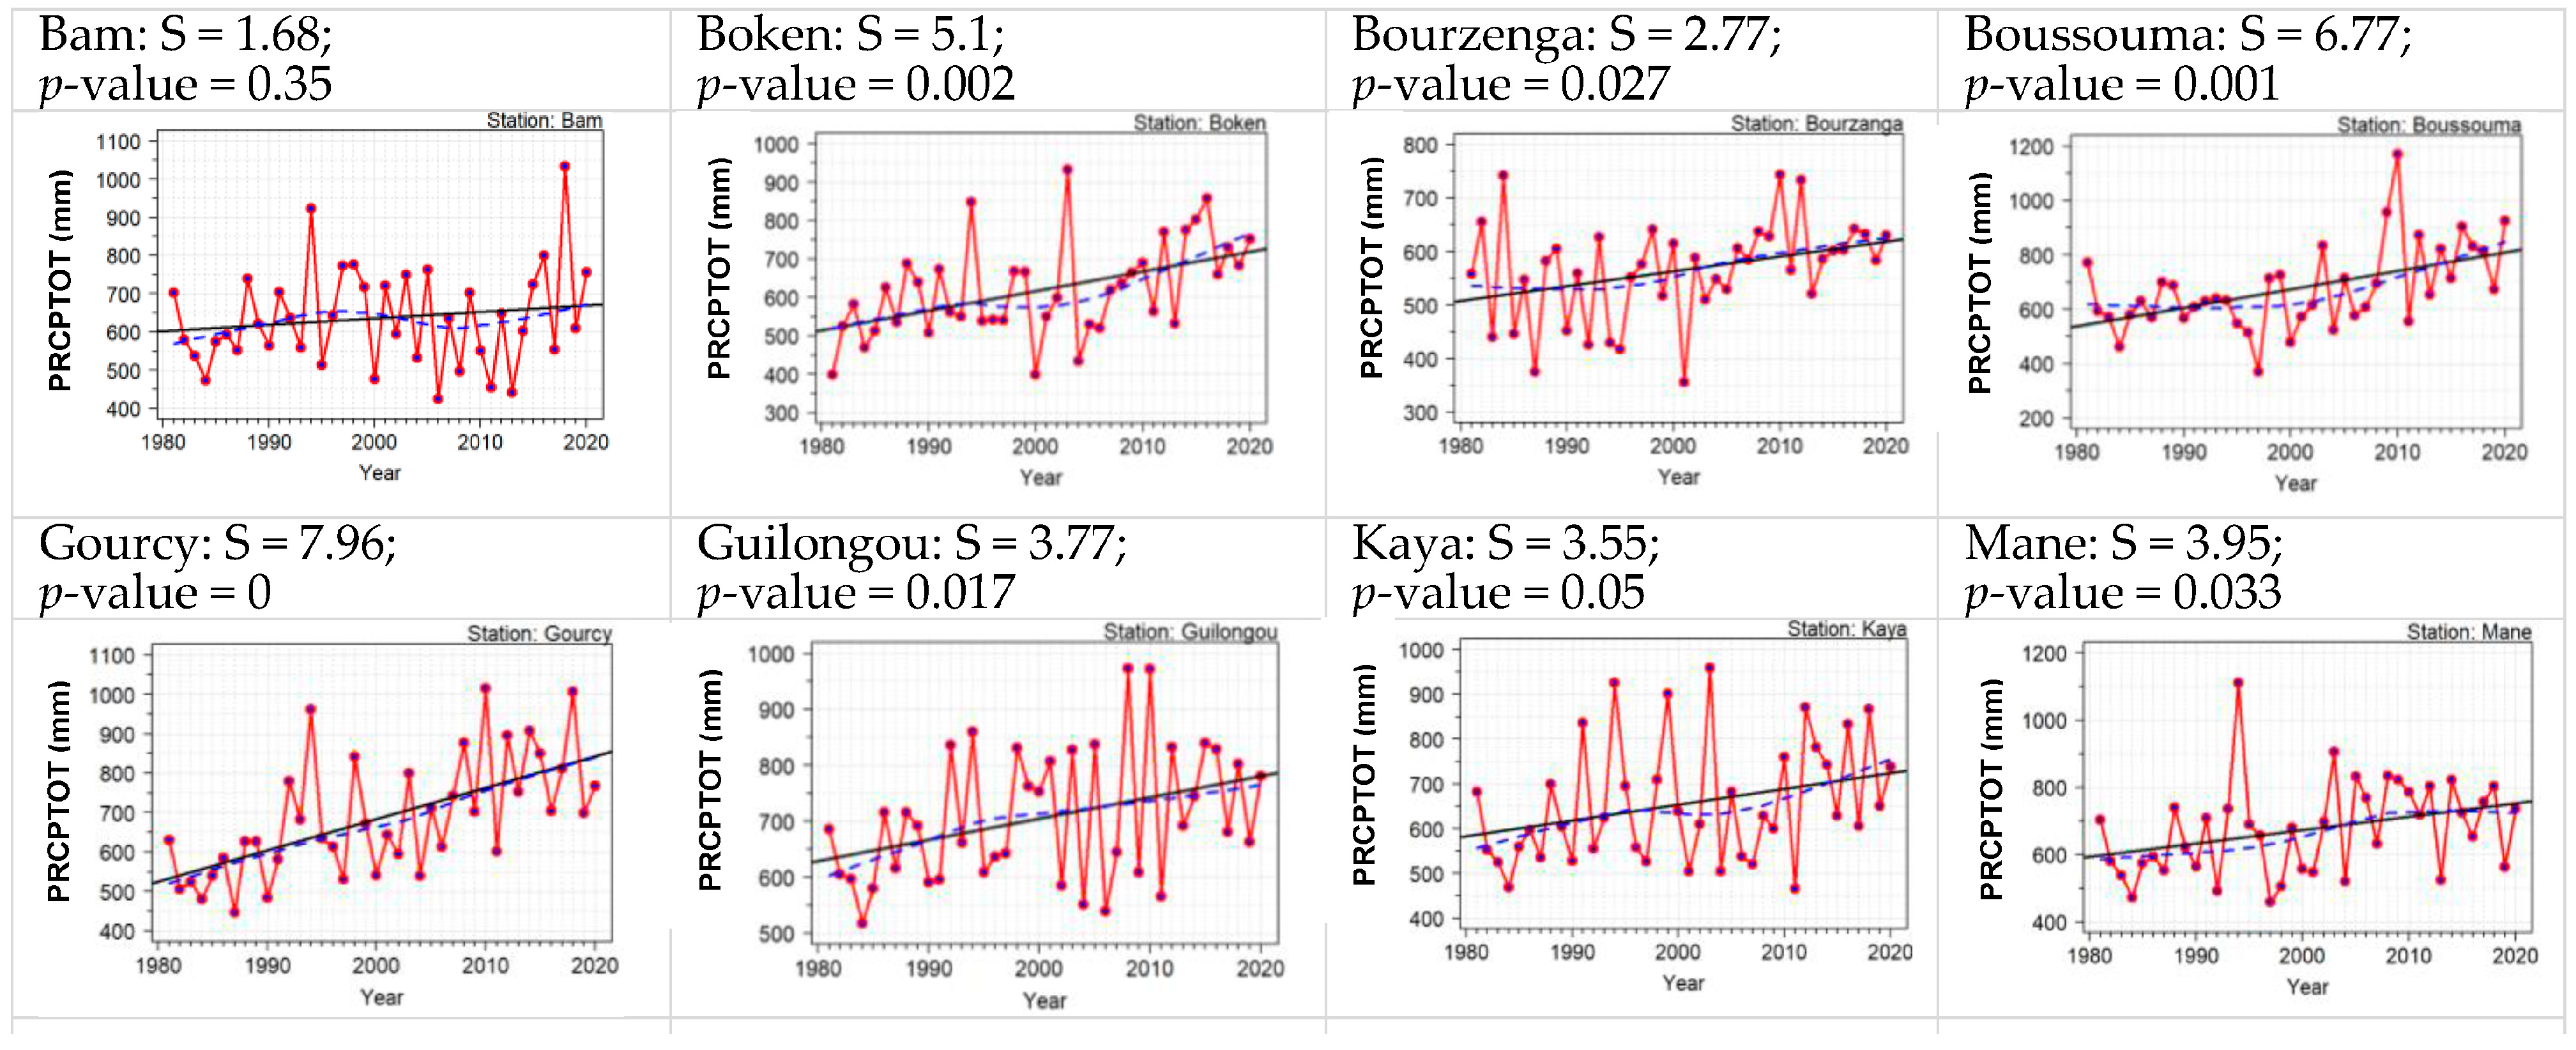
3.3.1. Temporal Trends
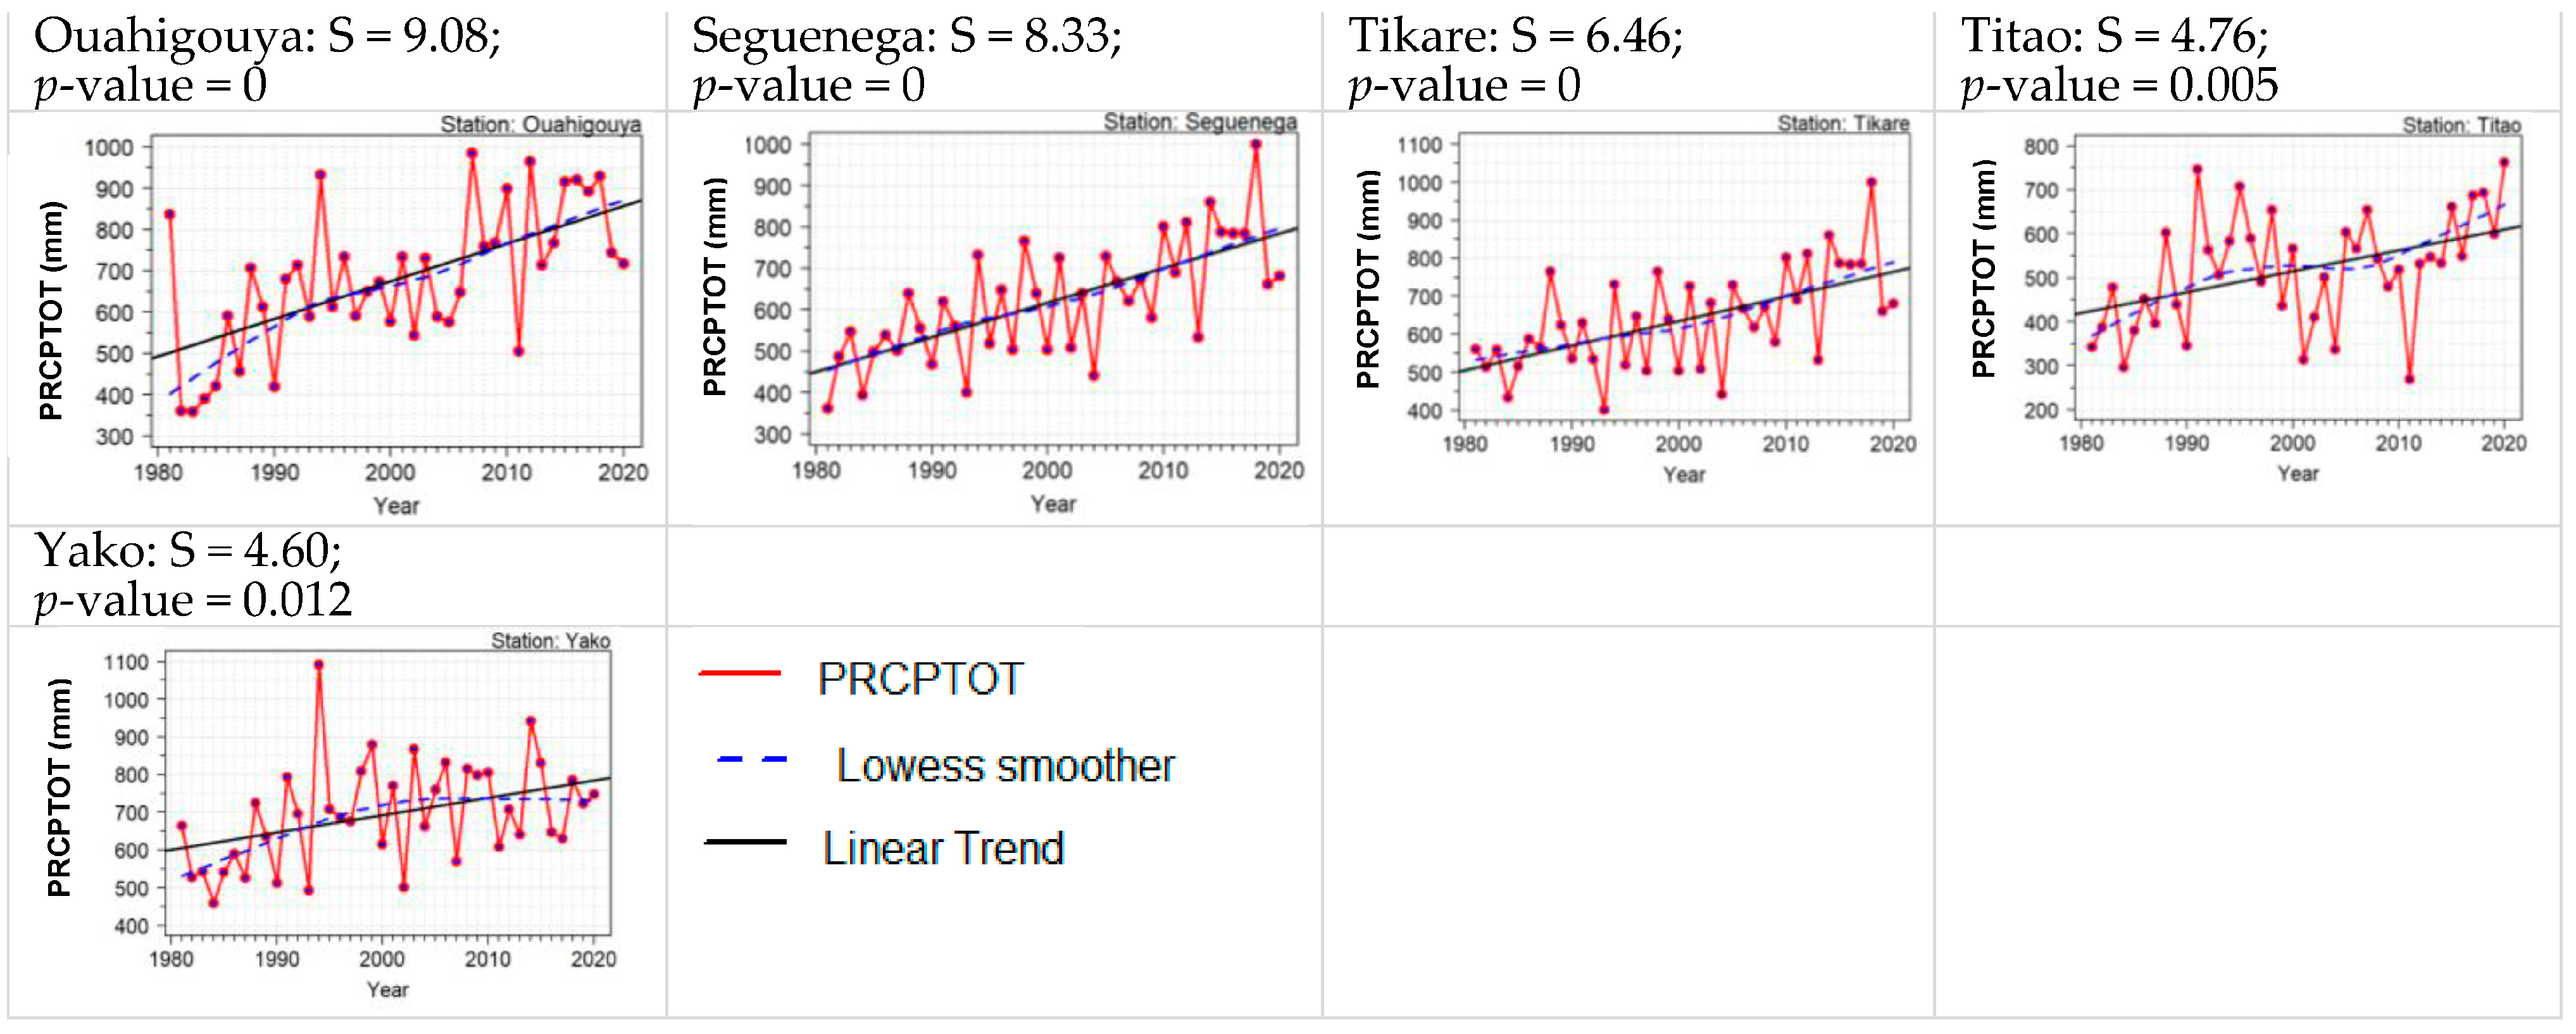
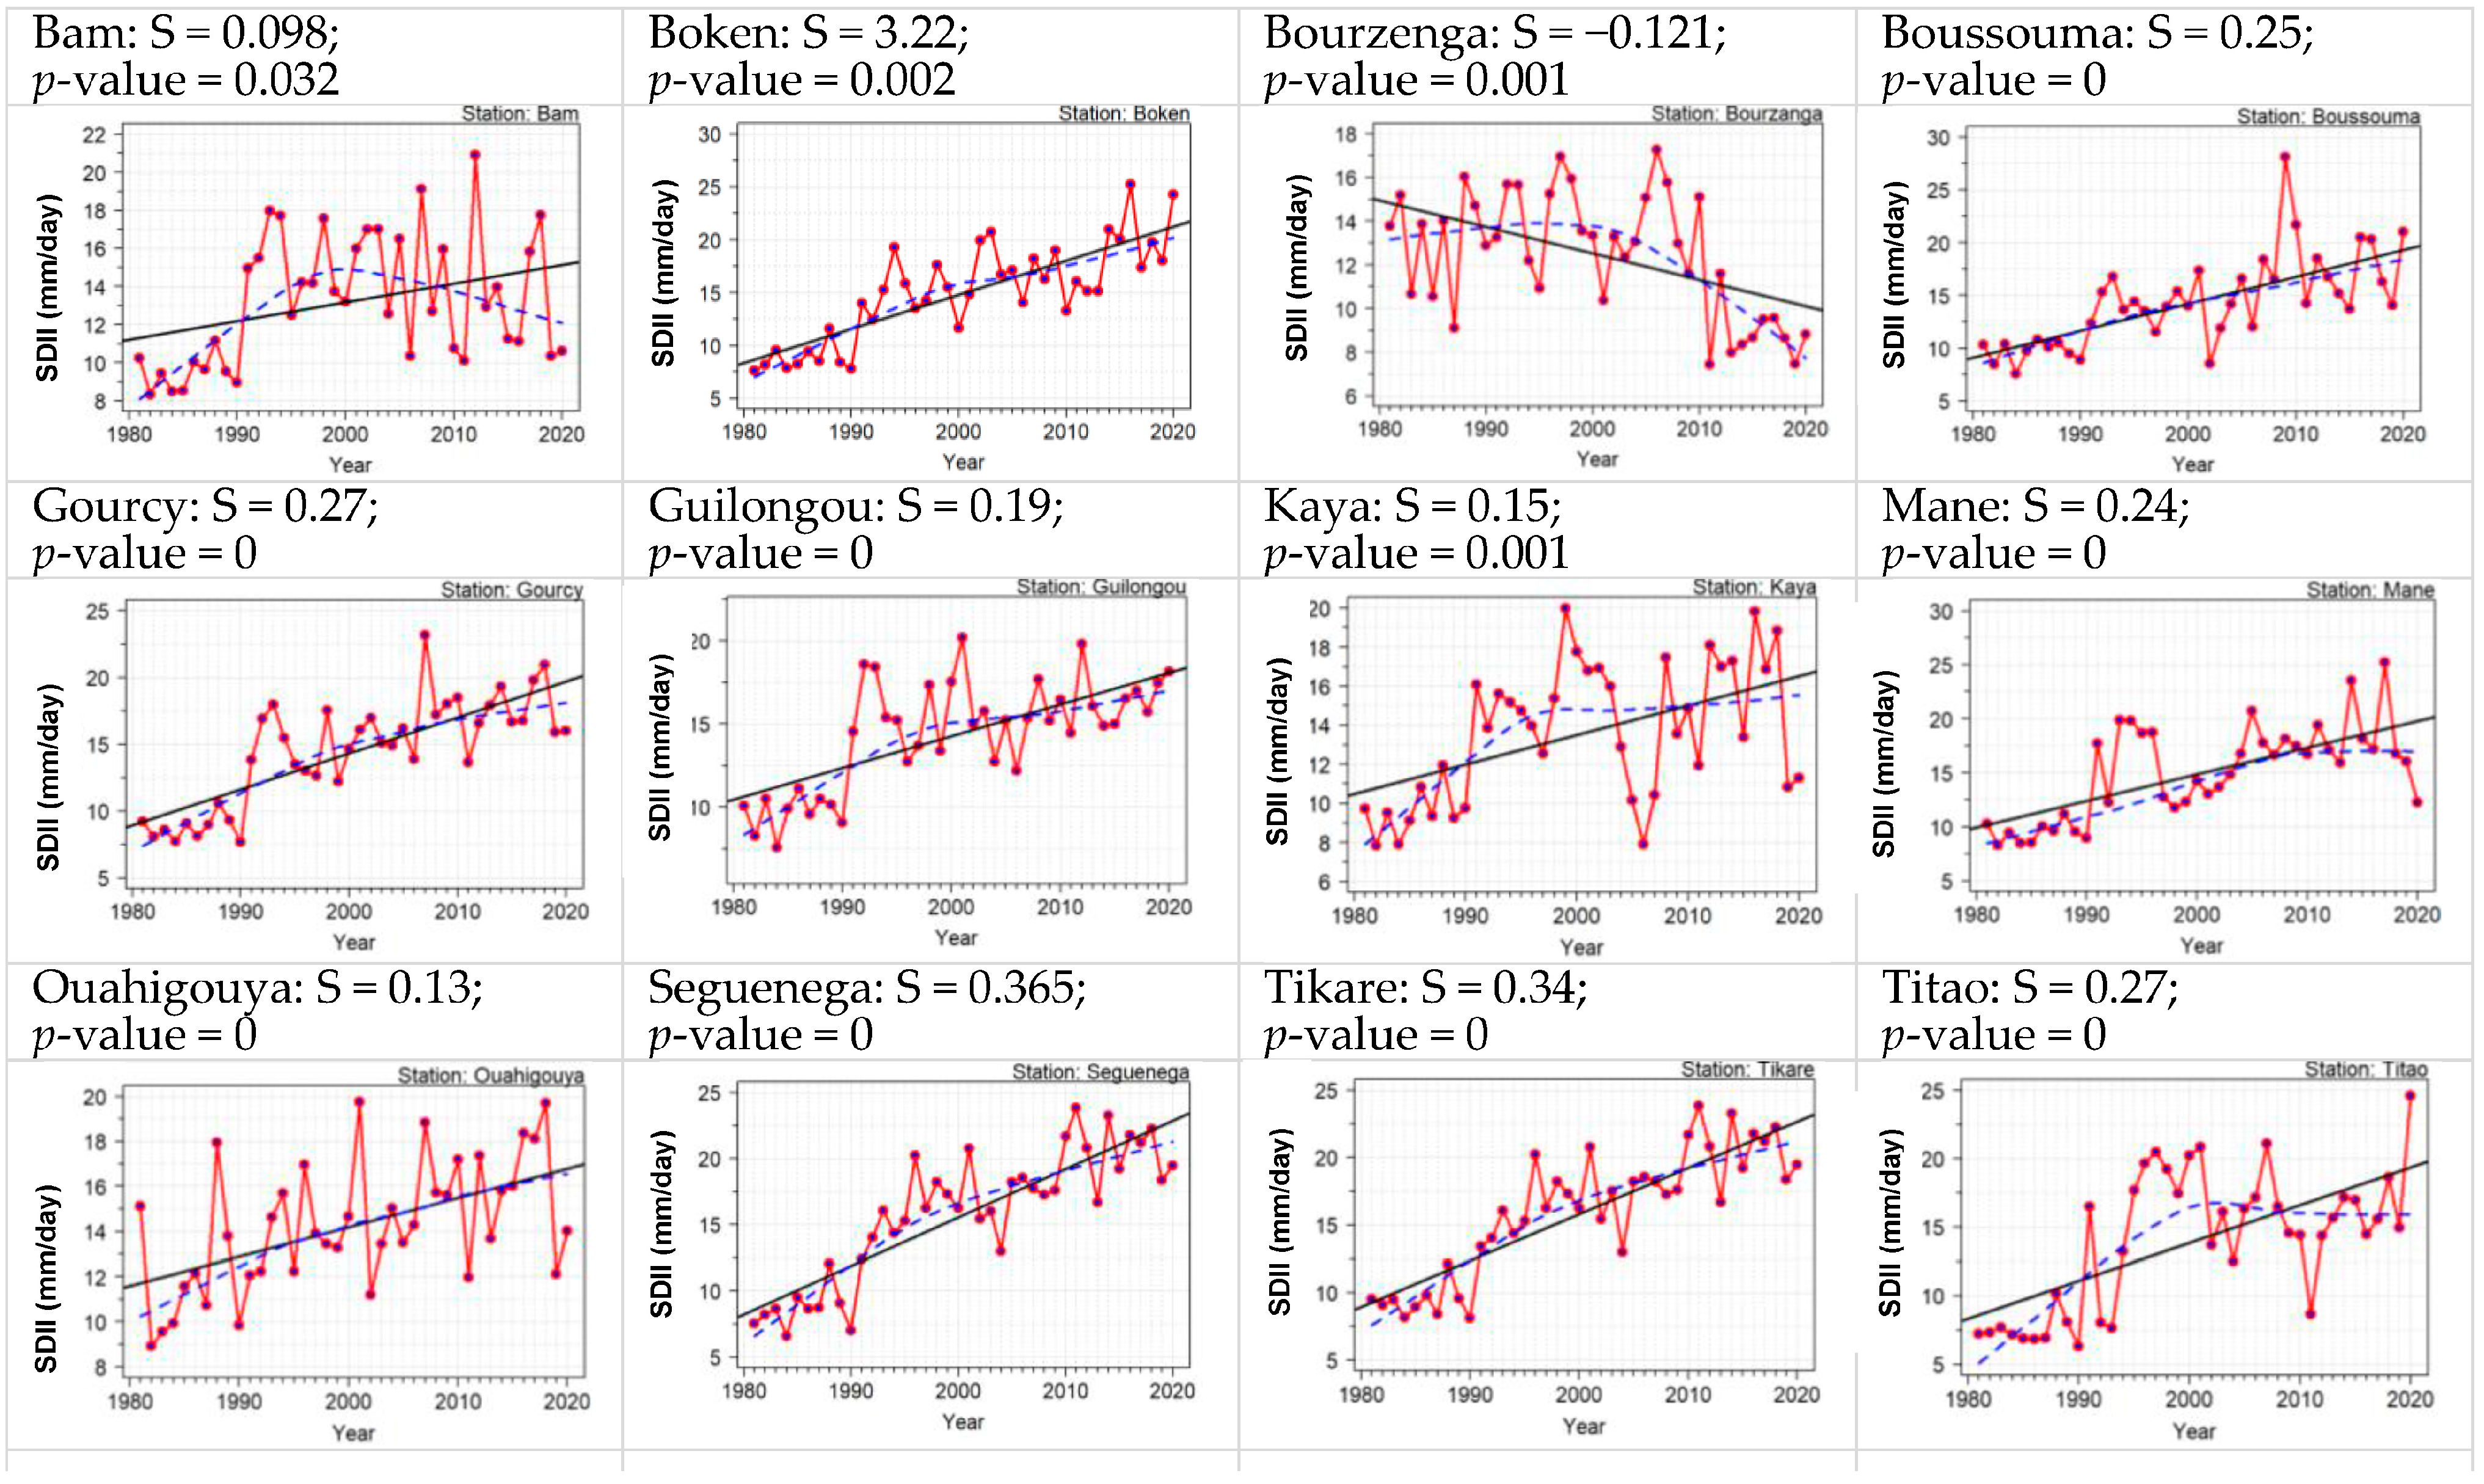
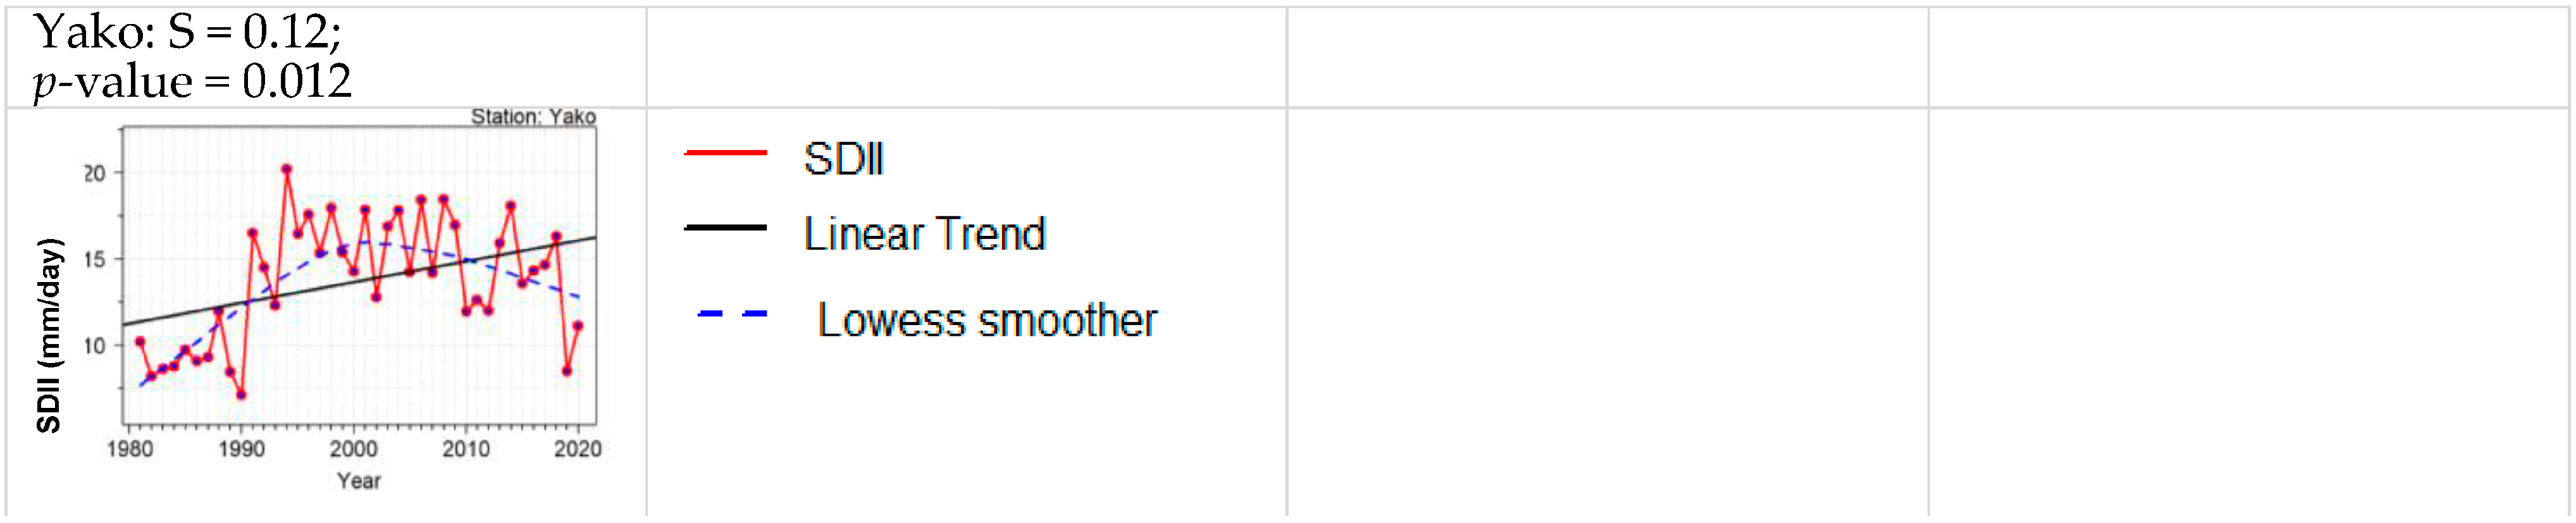
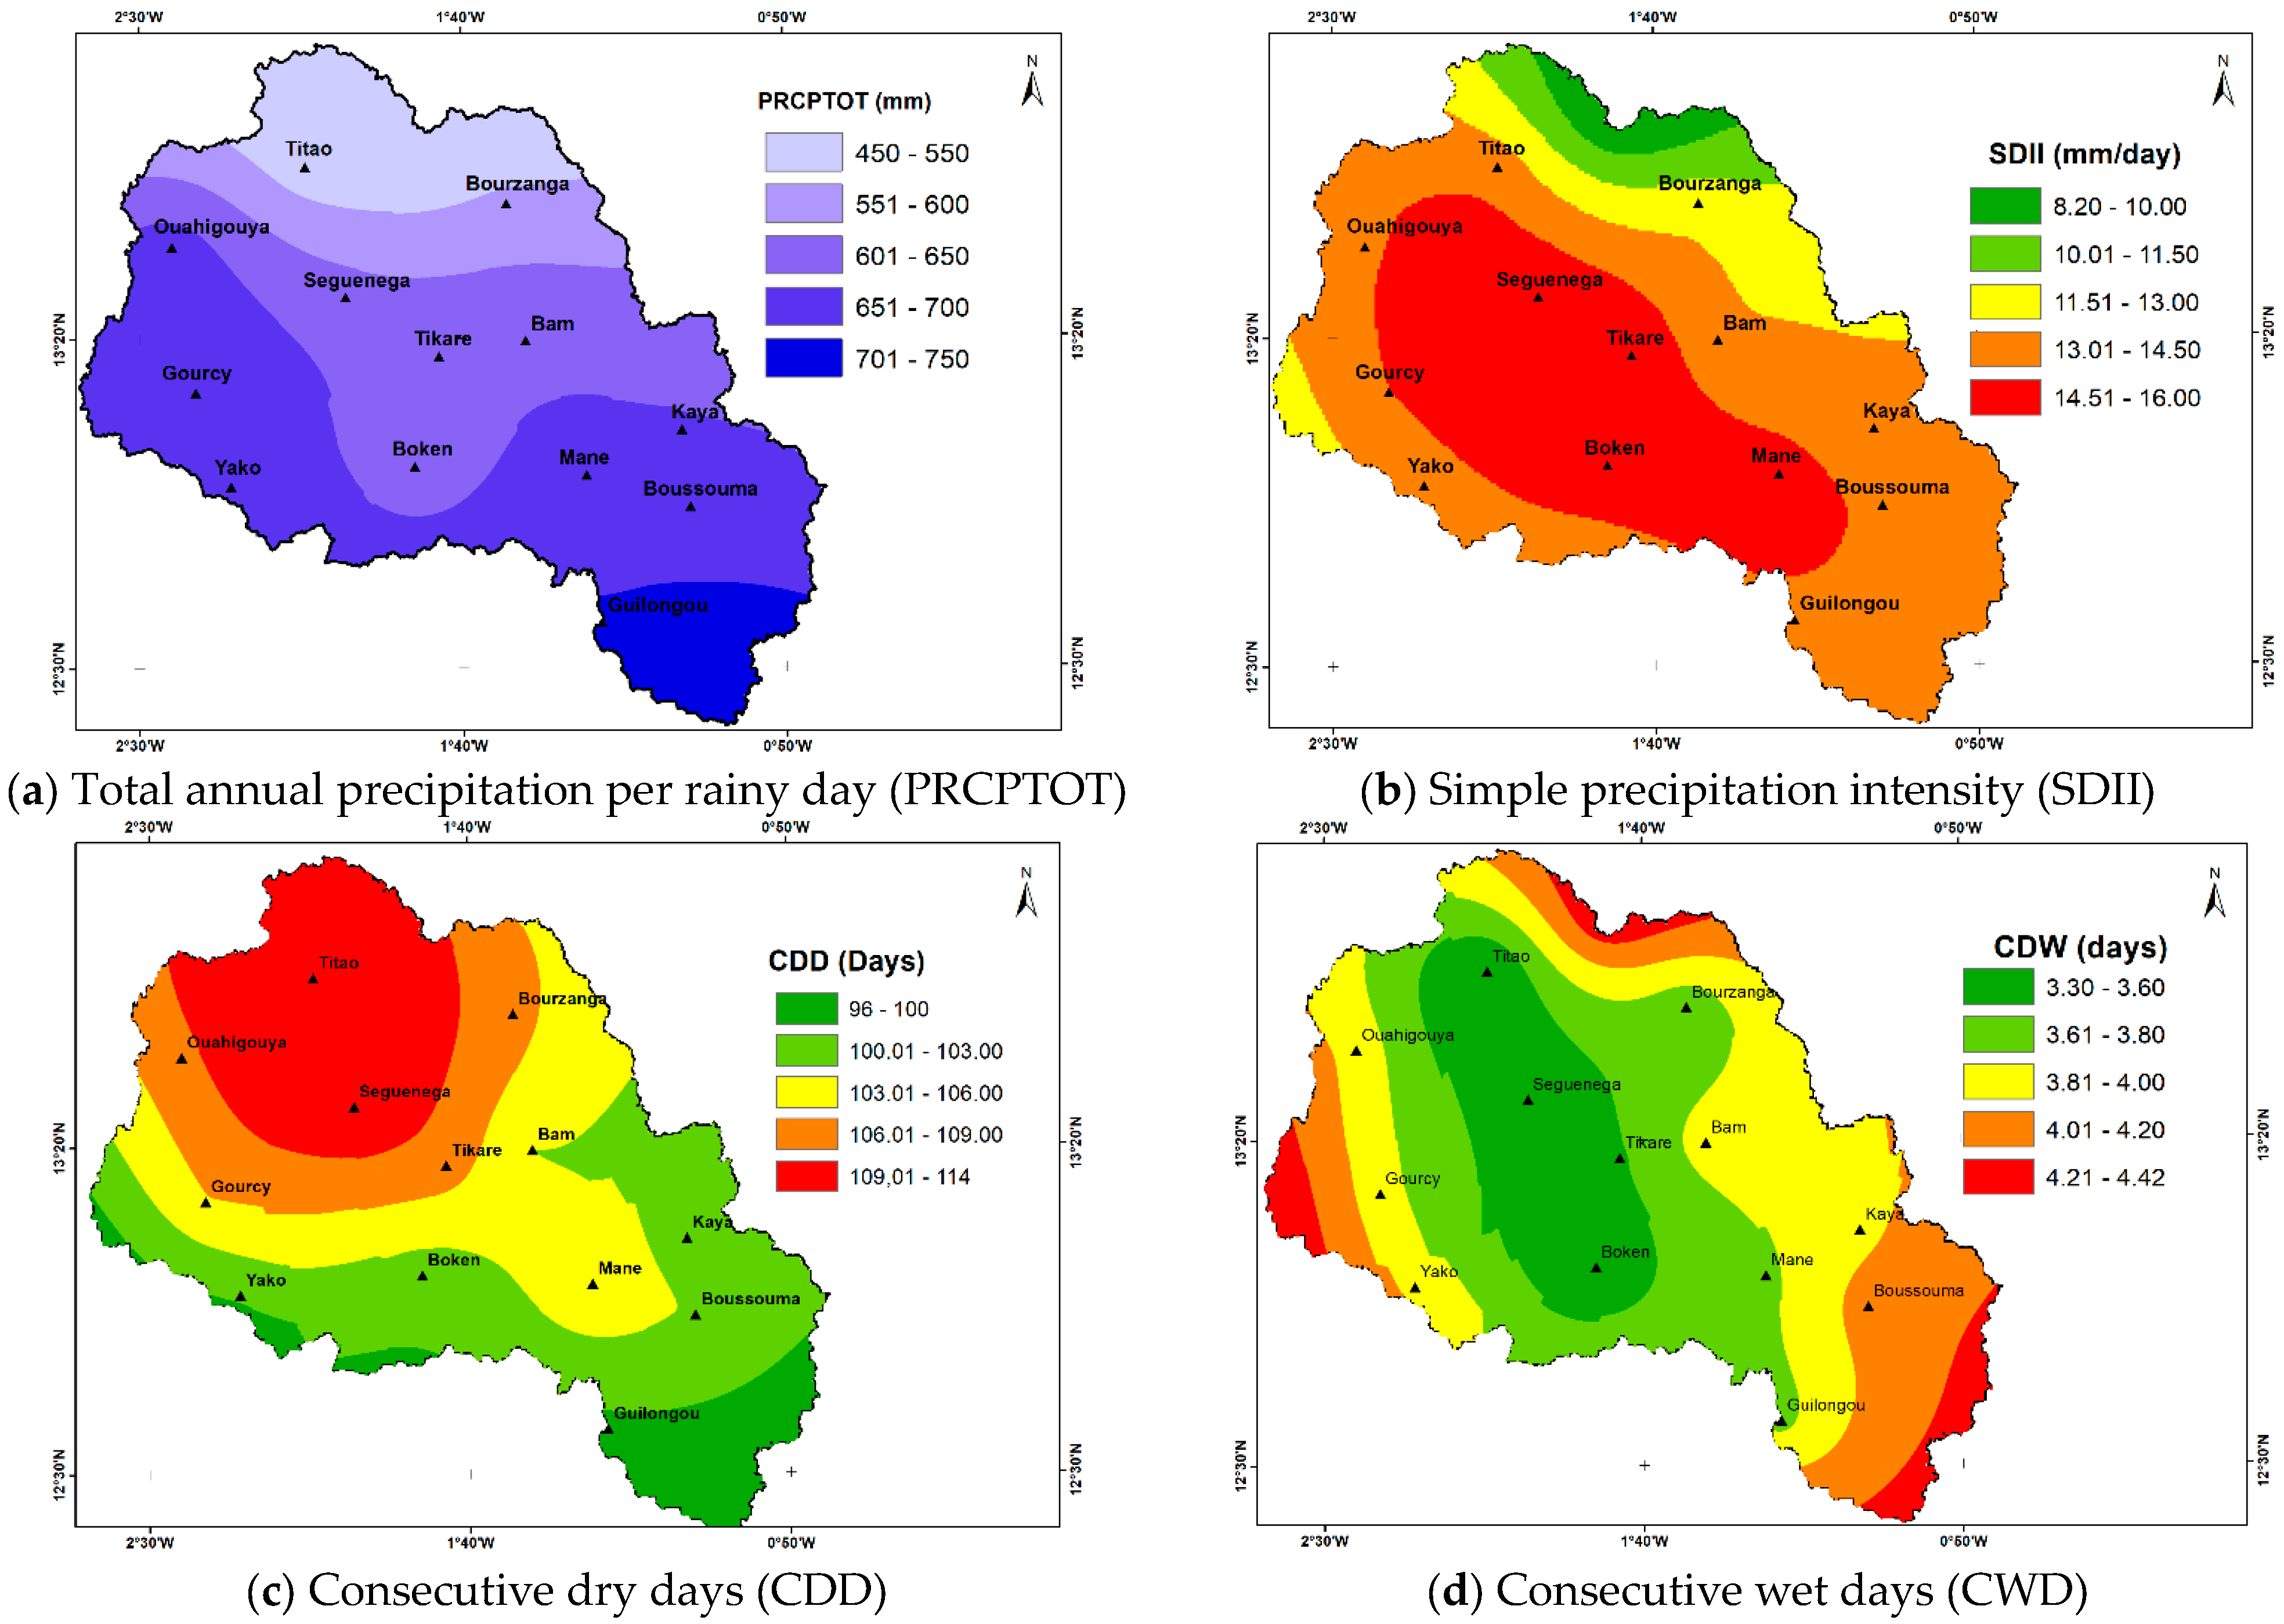
- Total Annual Precipitation per Rainy Day (PRCPTOT) and Simple Rainfall Intensity (SDII)
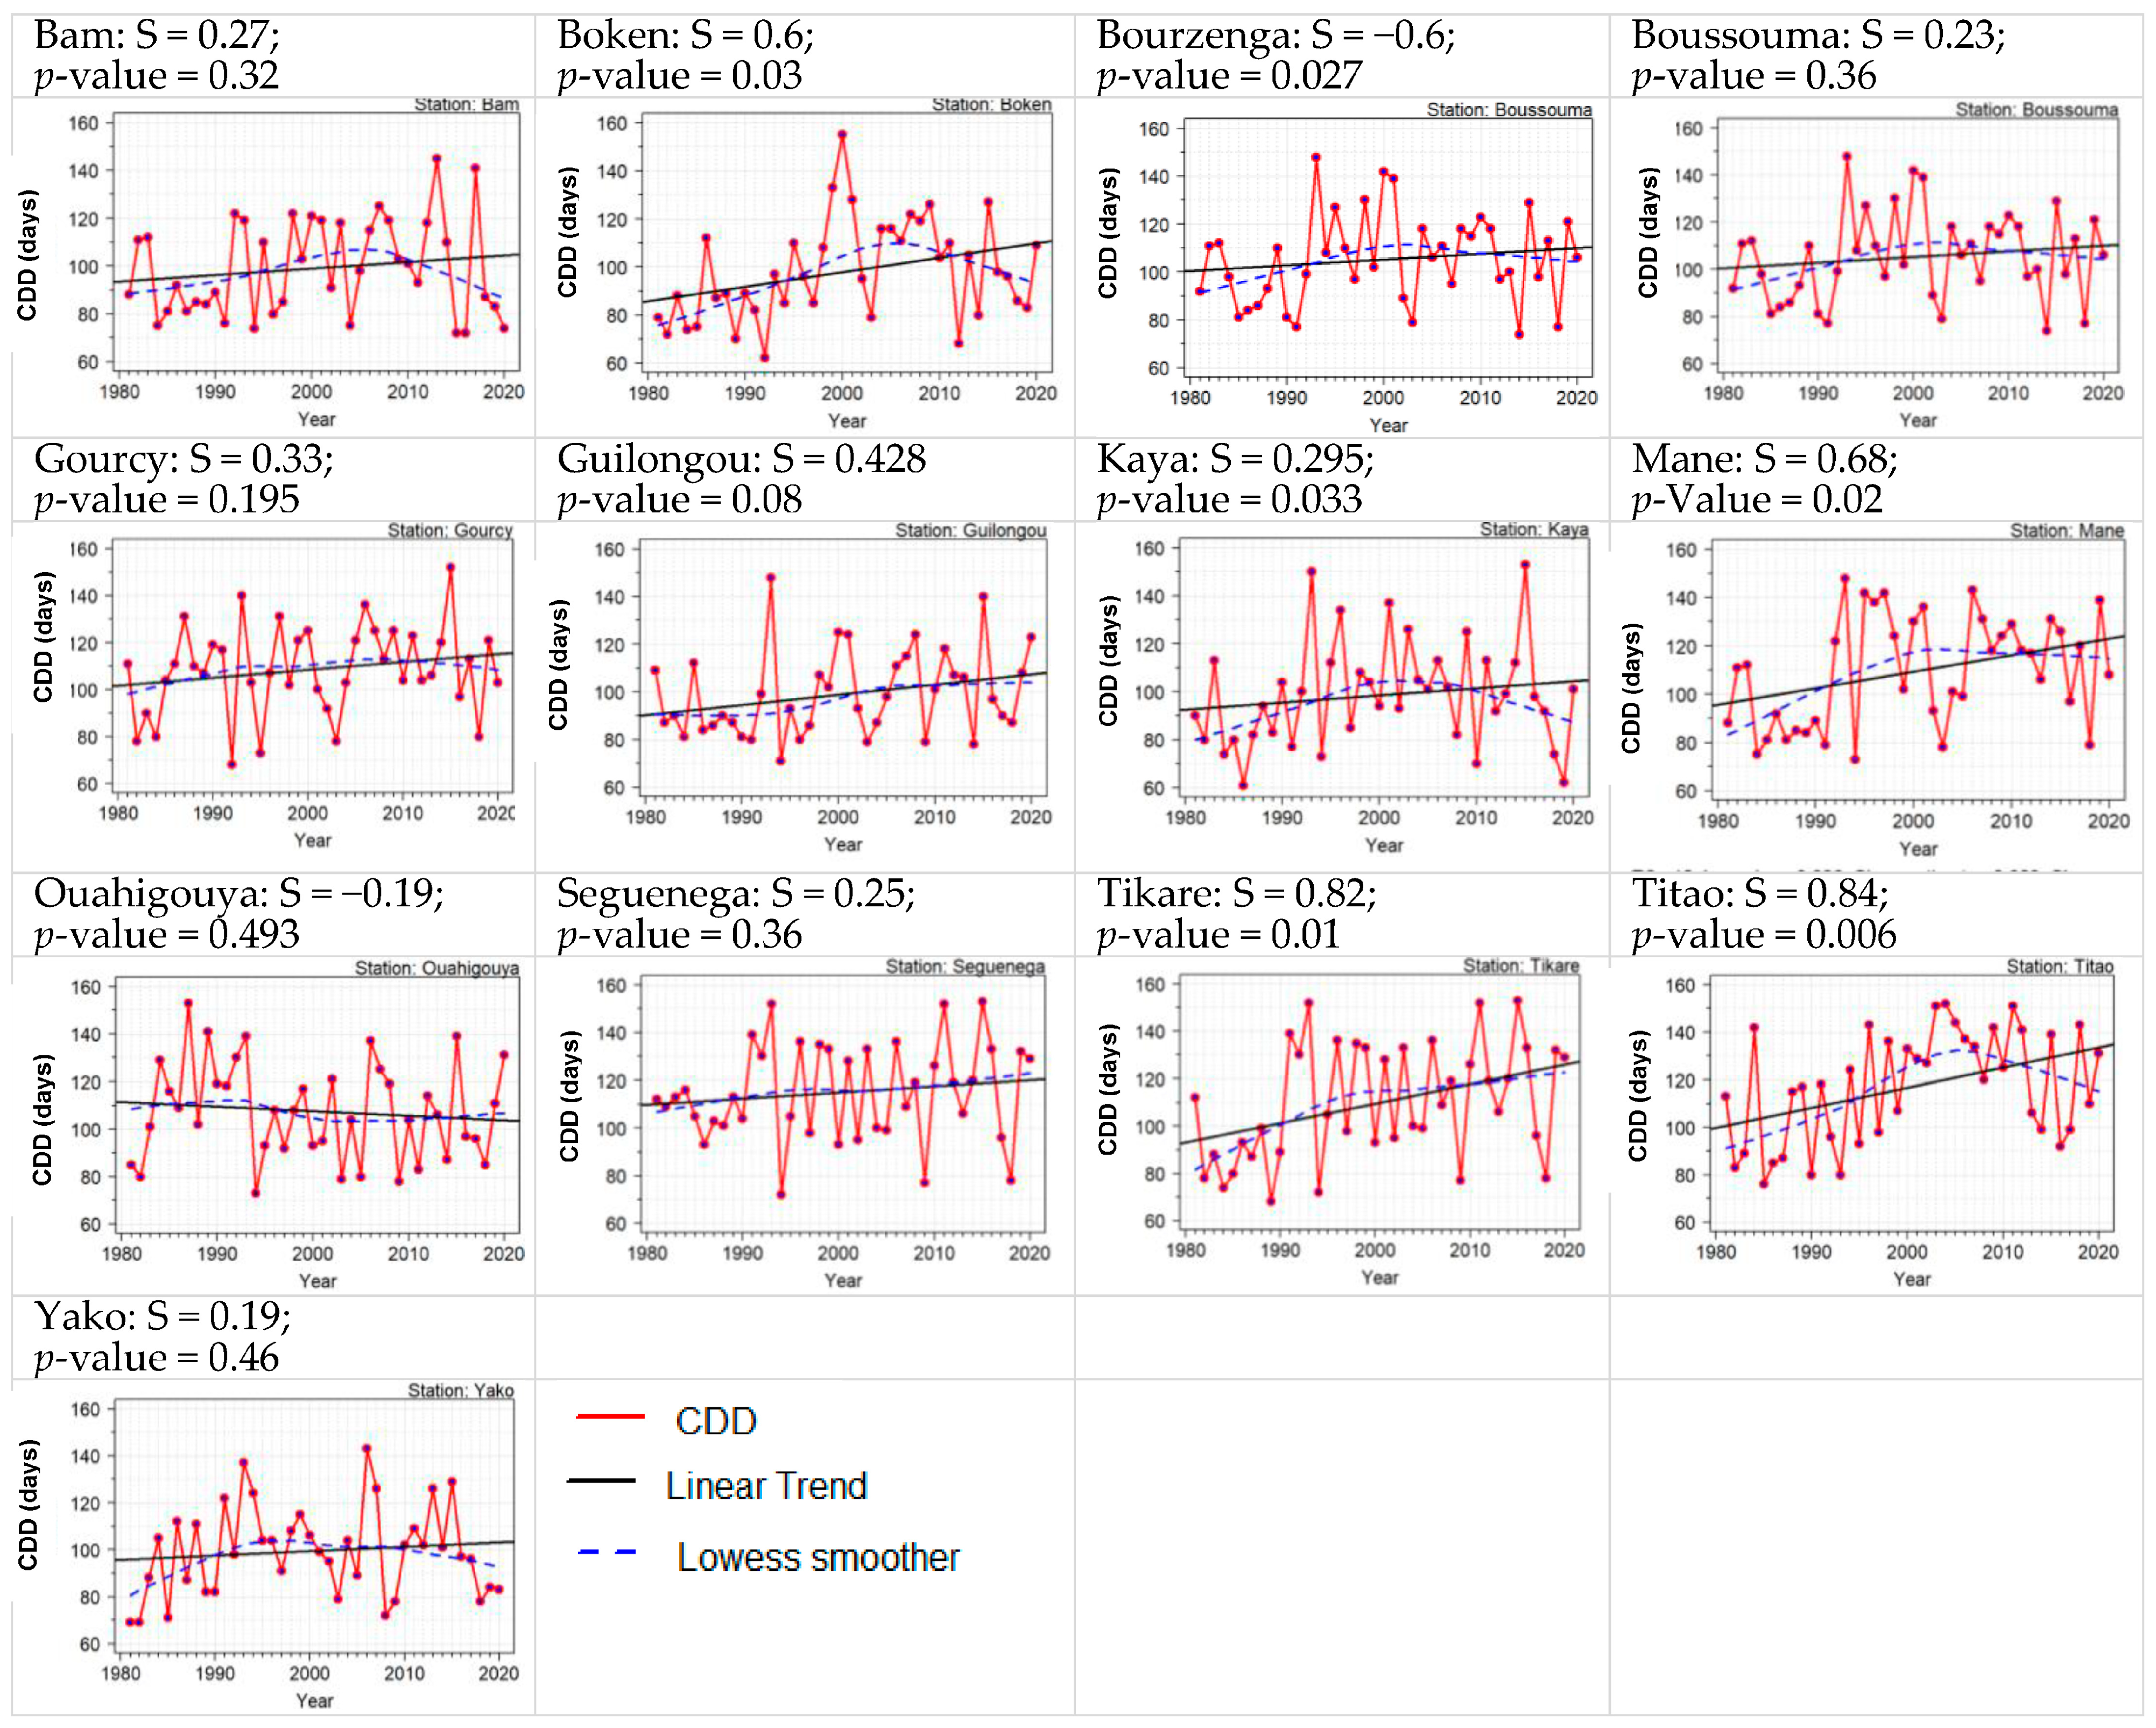
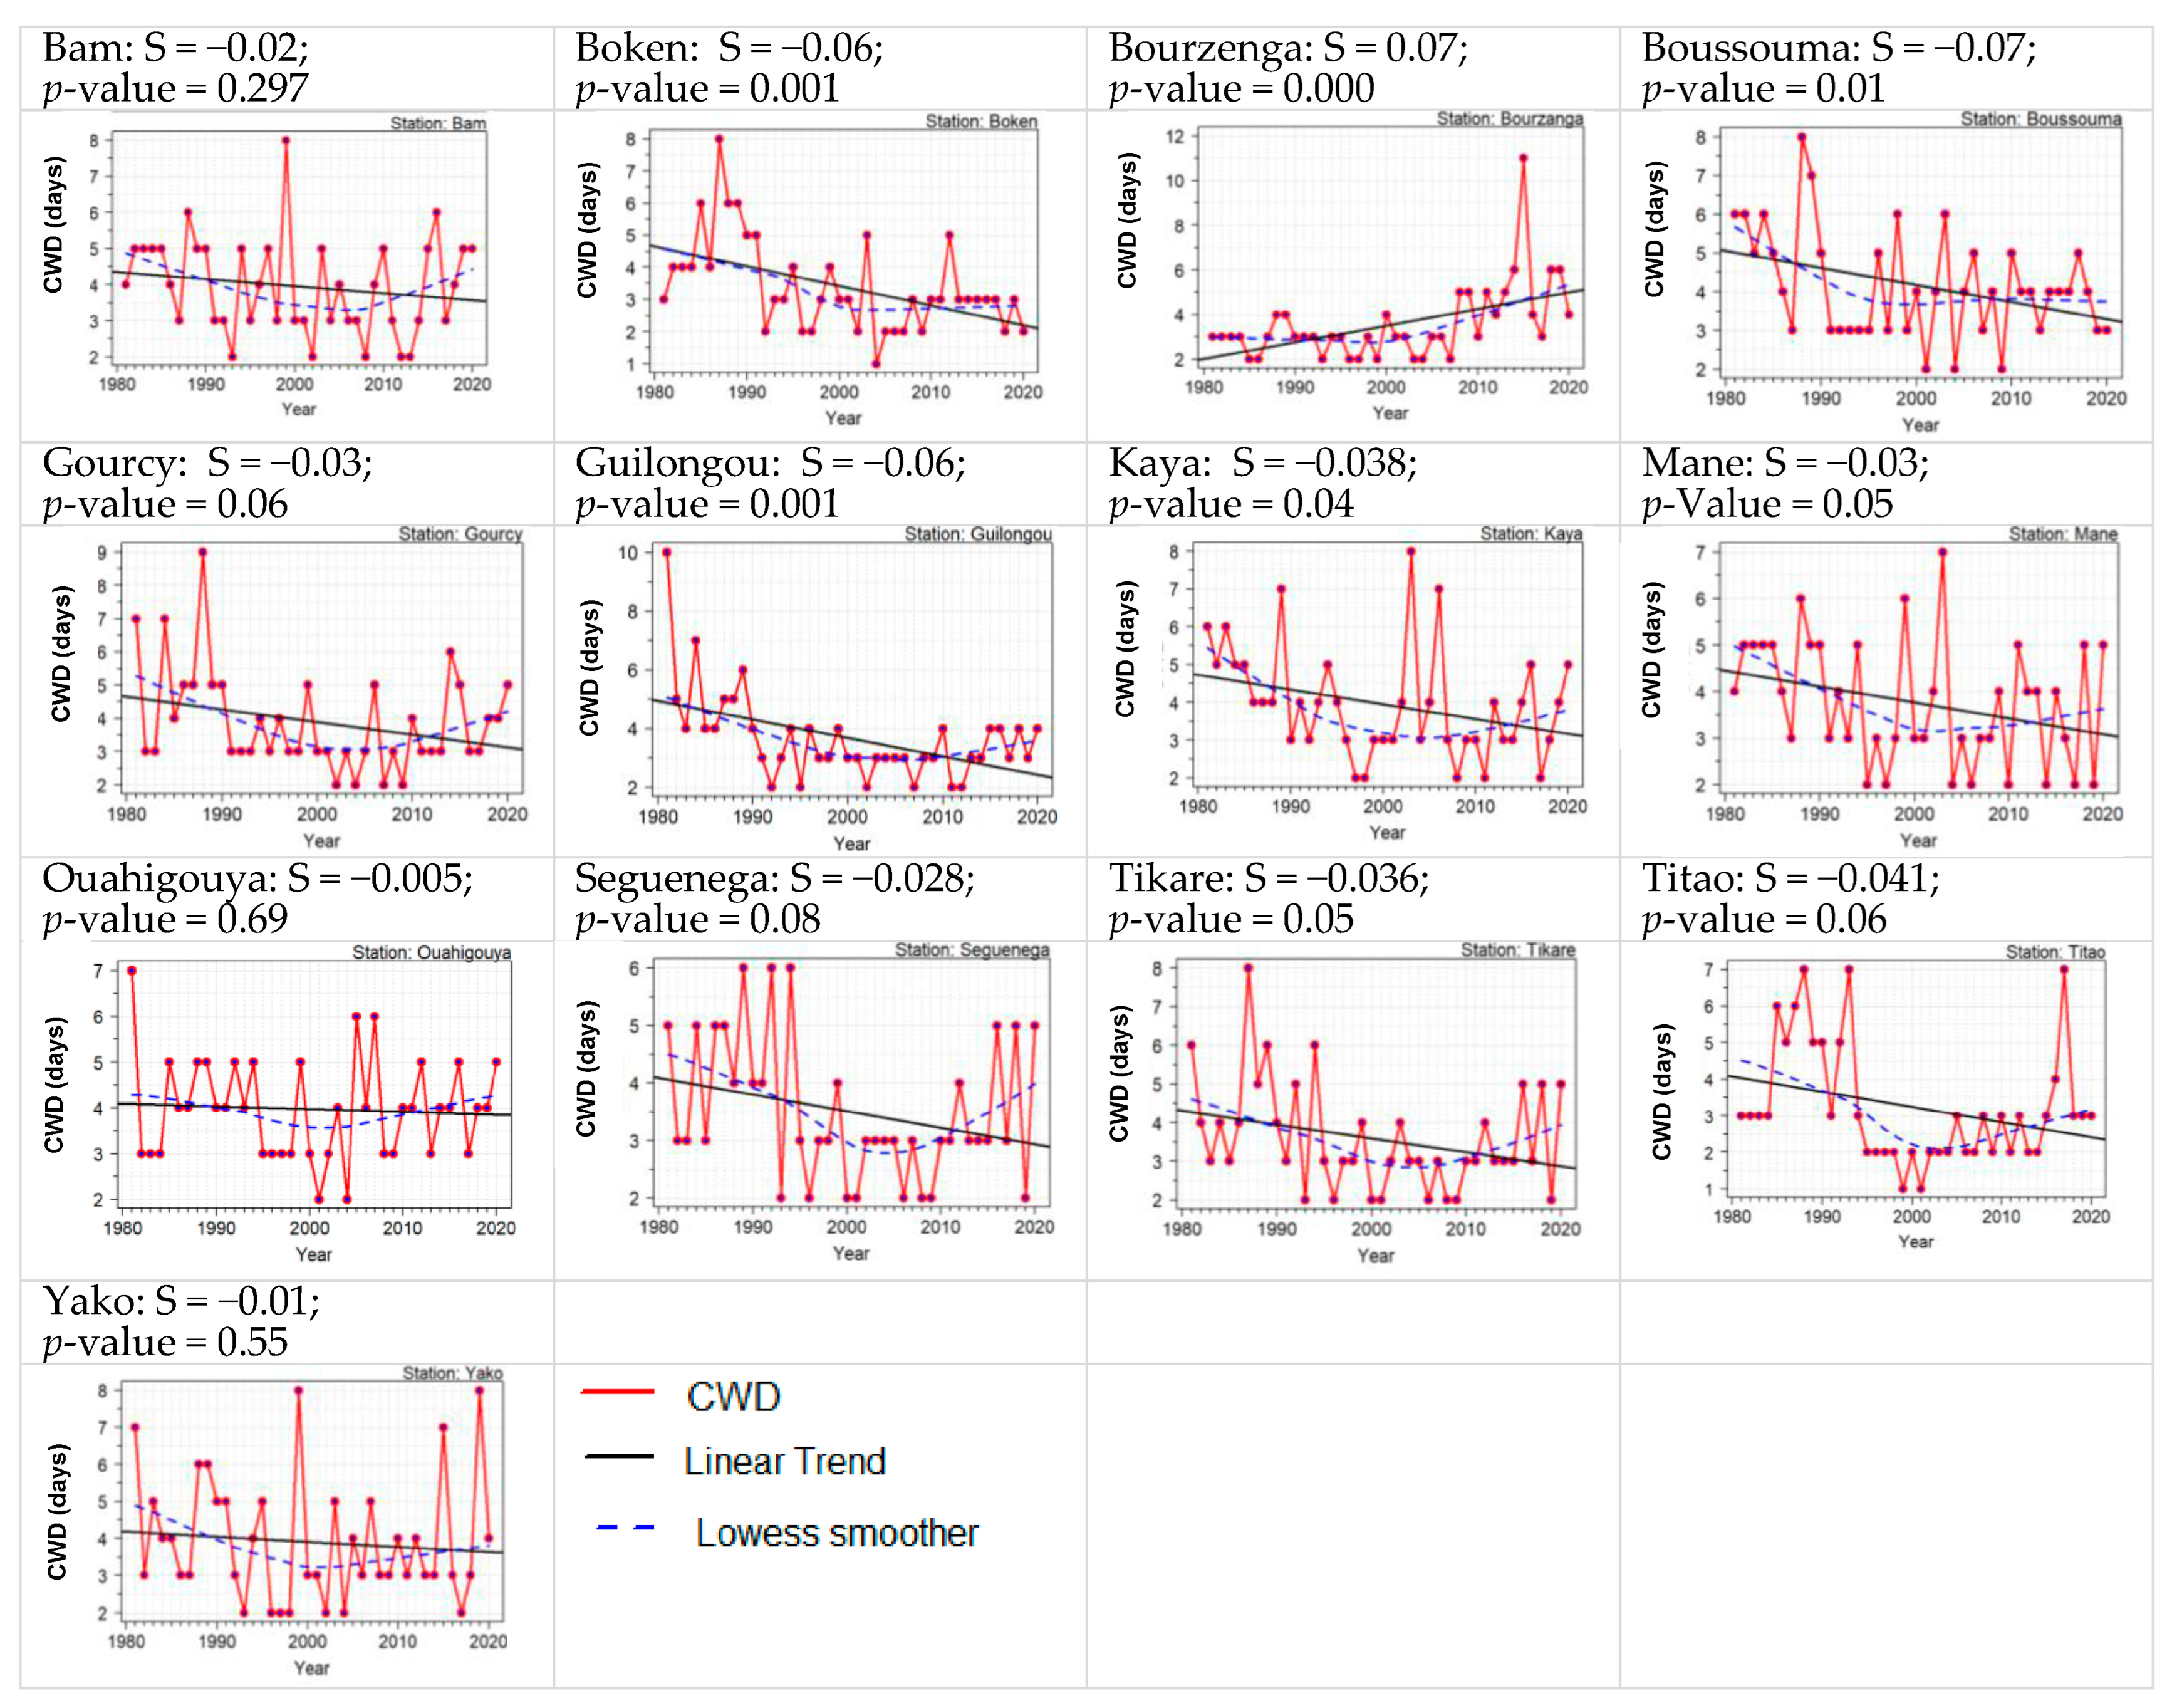
- Consecutive dry days (CDD) and consecutive wet days (CWD)
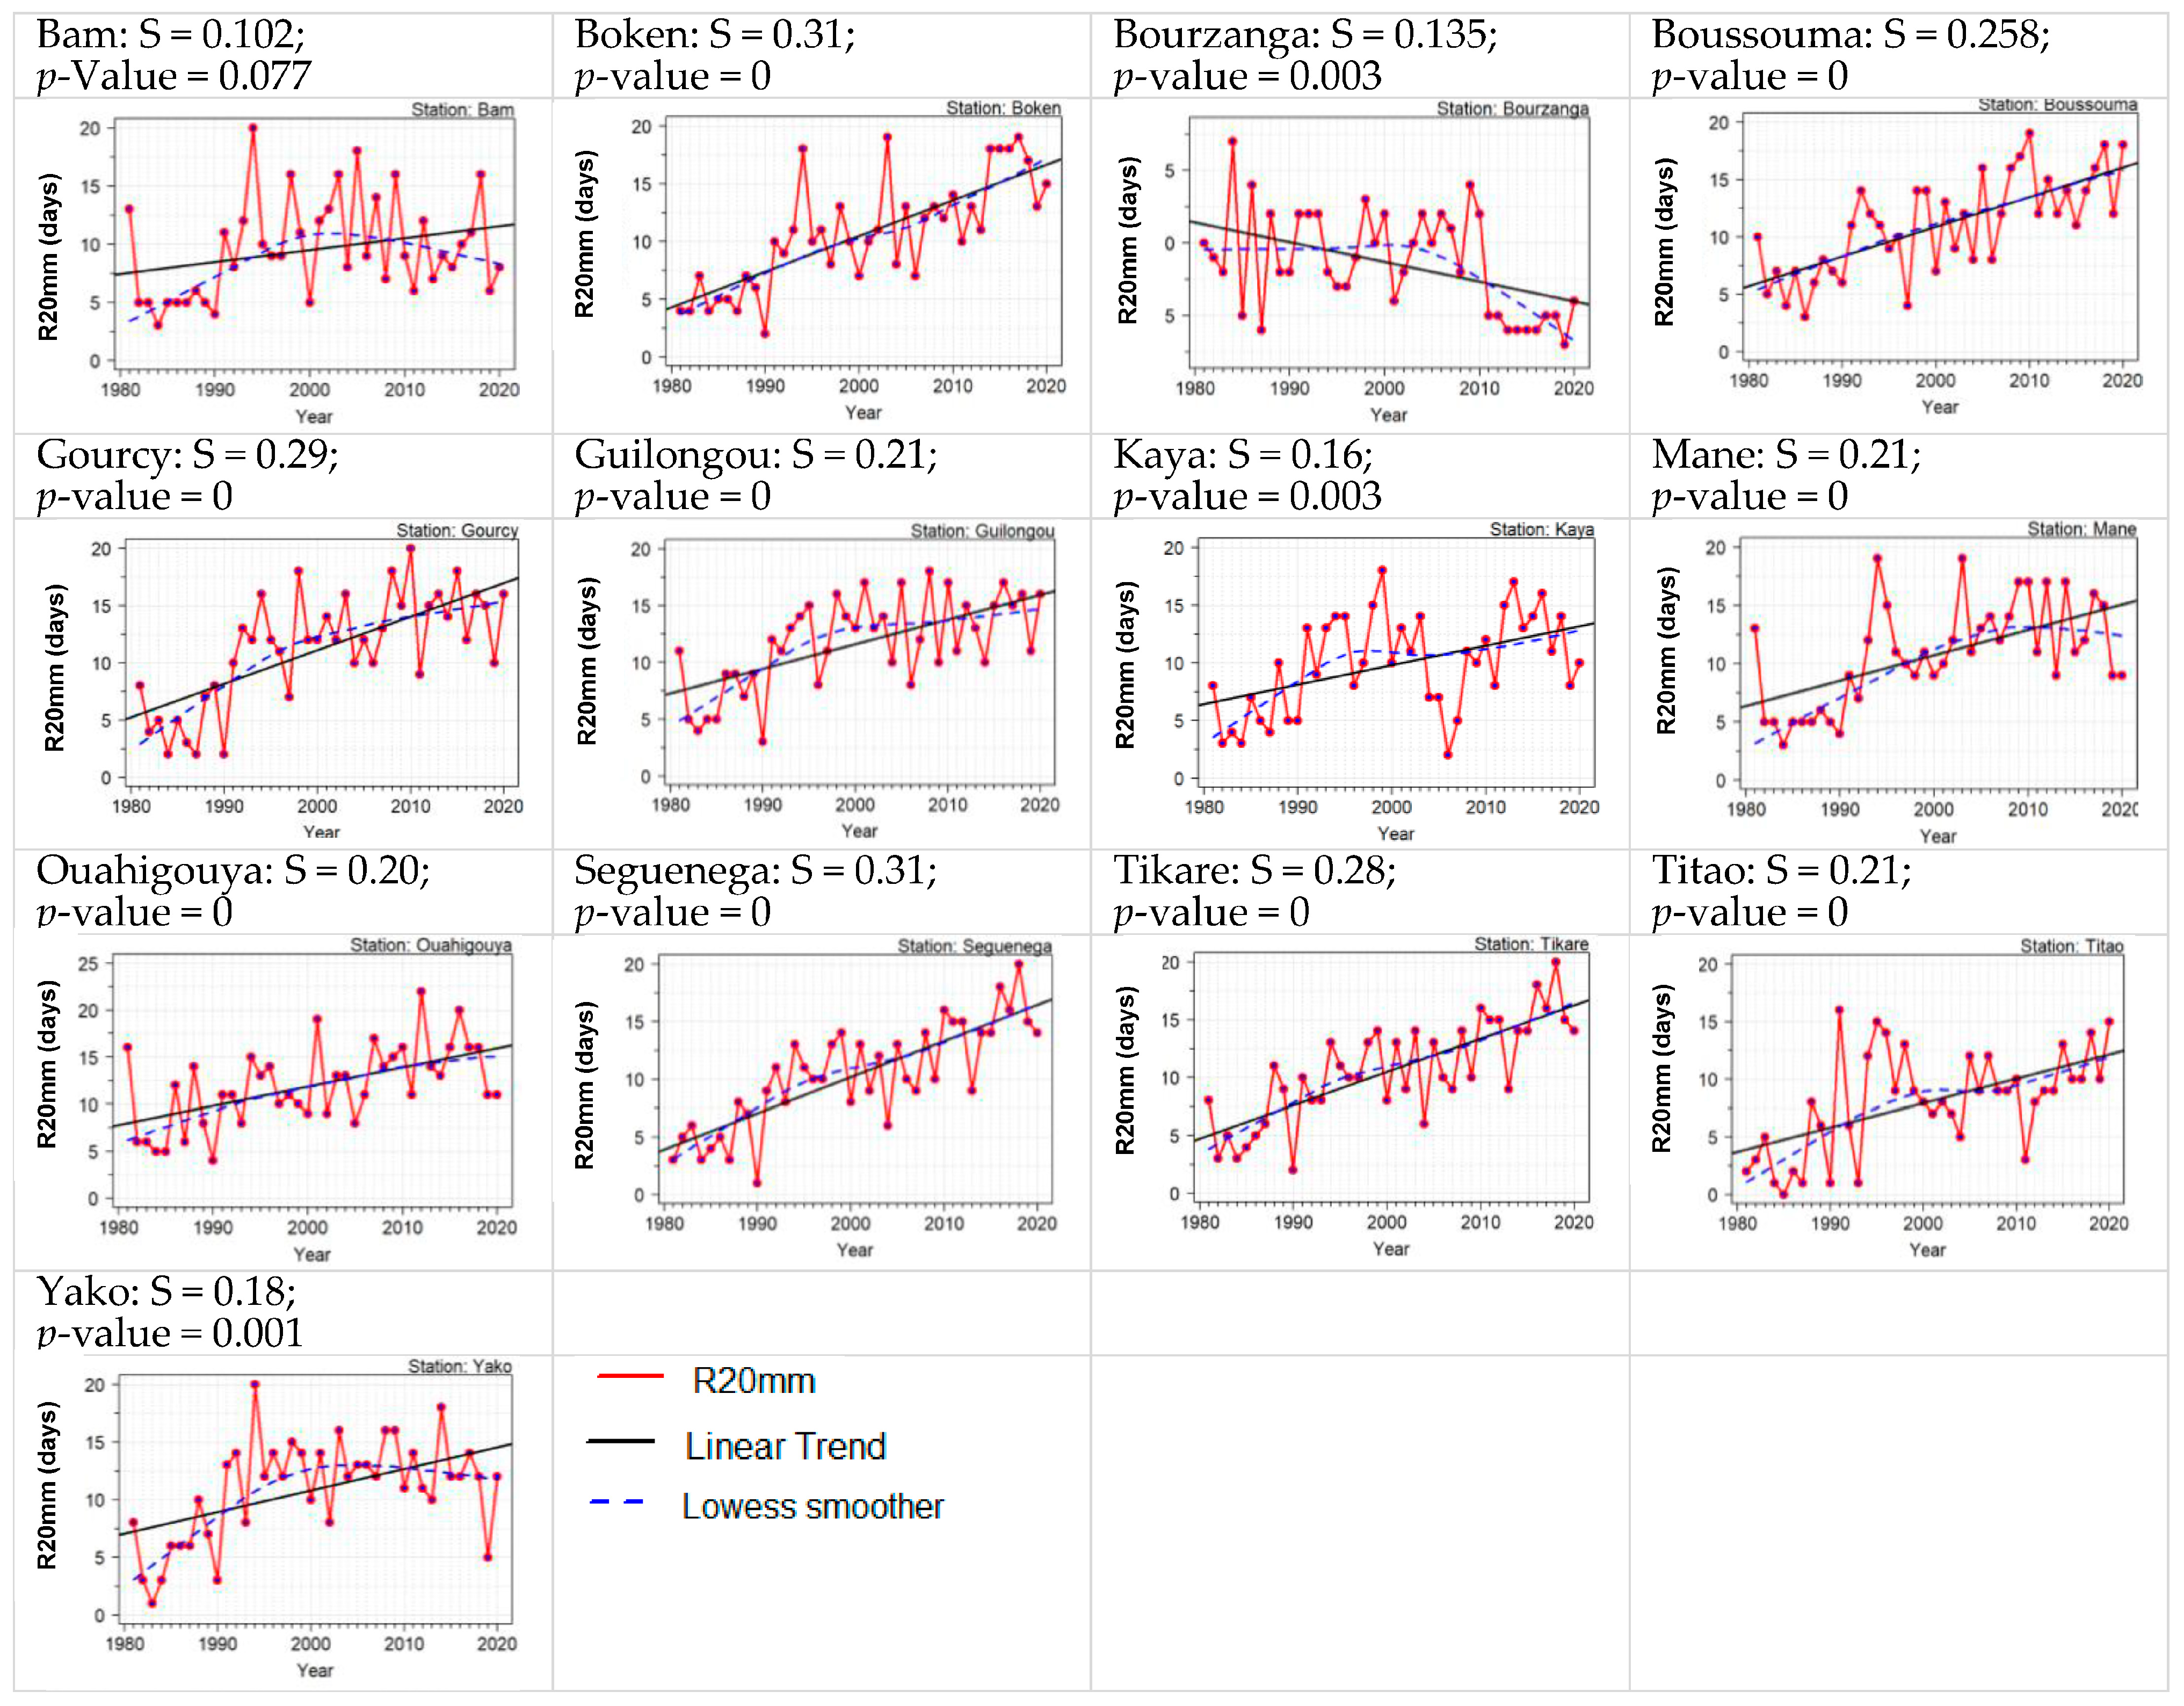
- Number of heavy (R20mm) to very heavy (R50mm) rainfall days.
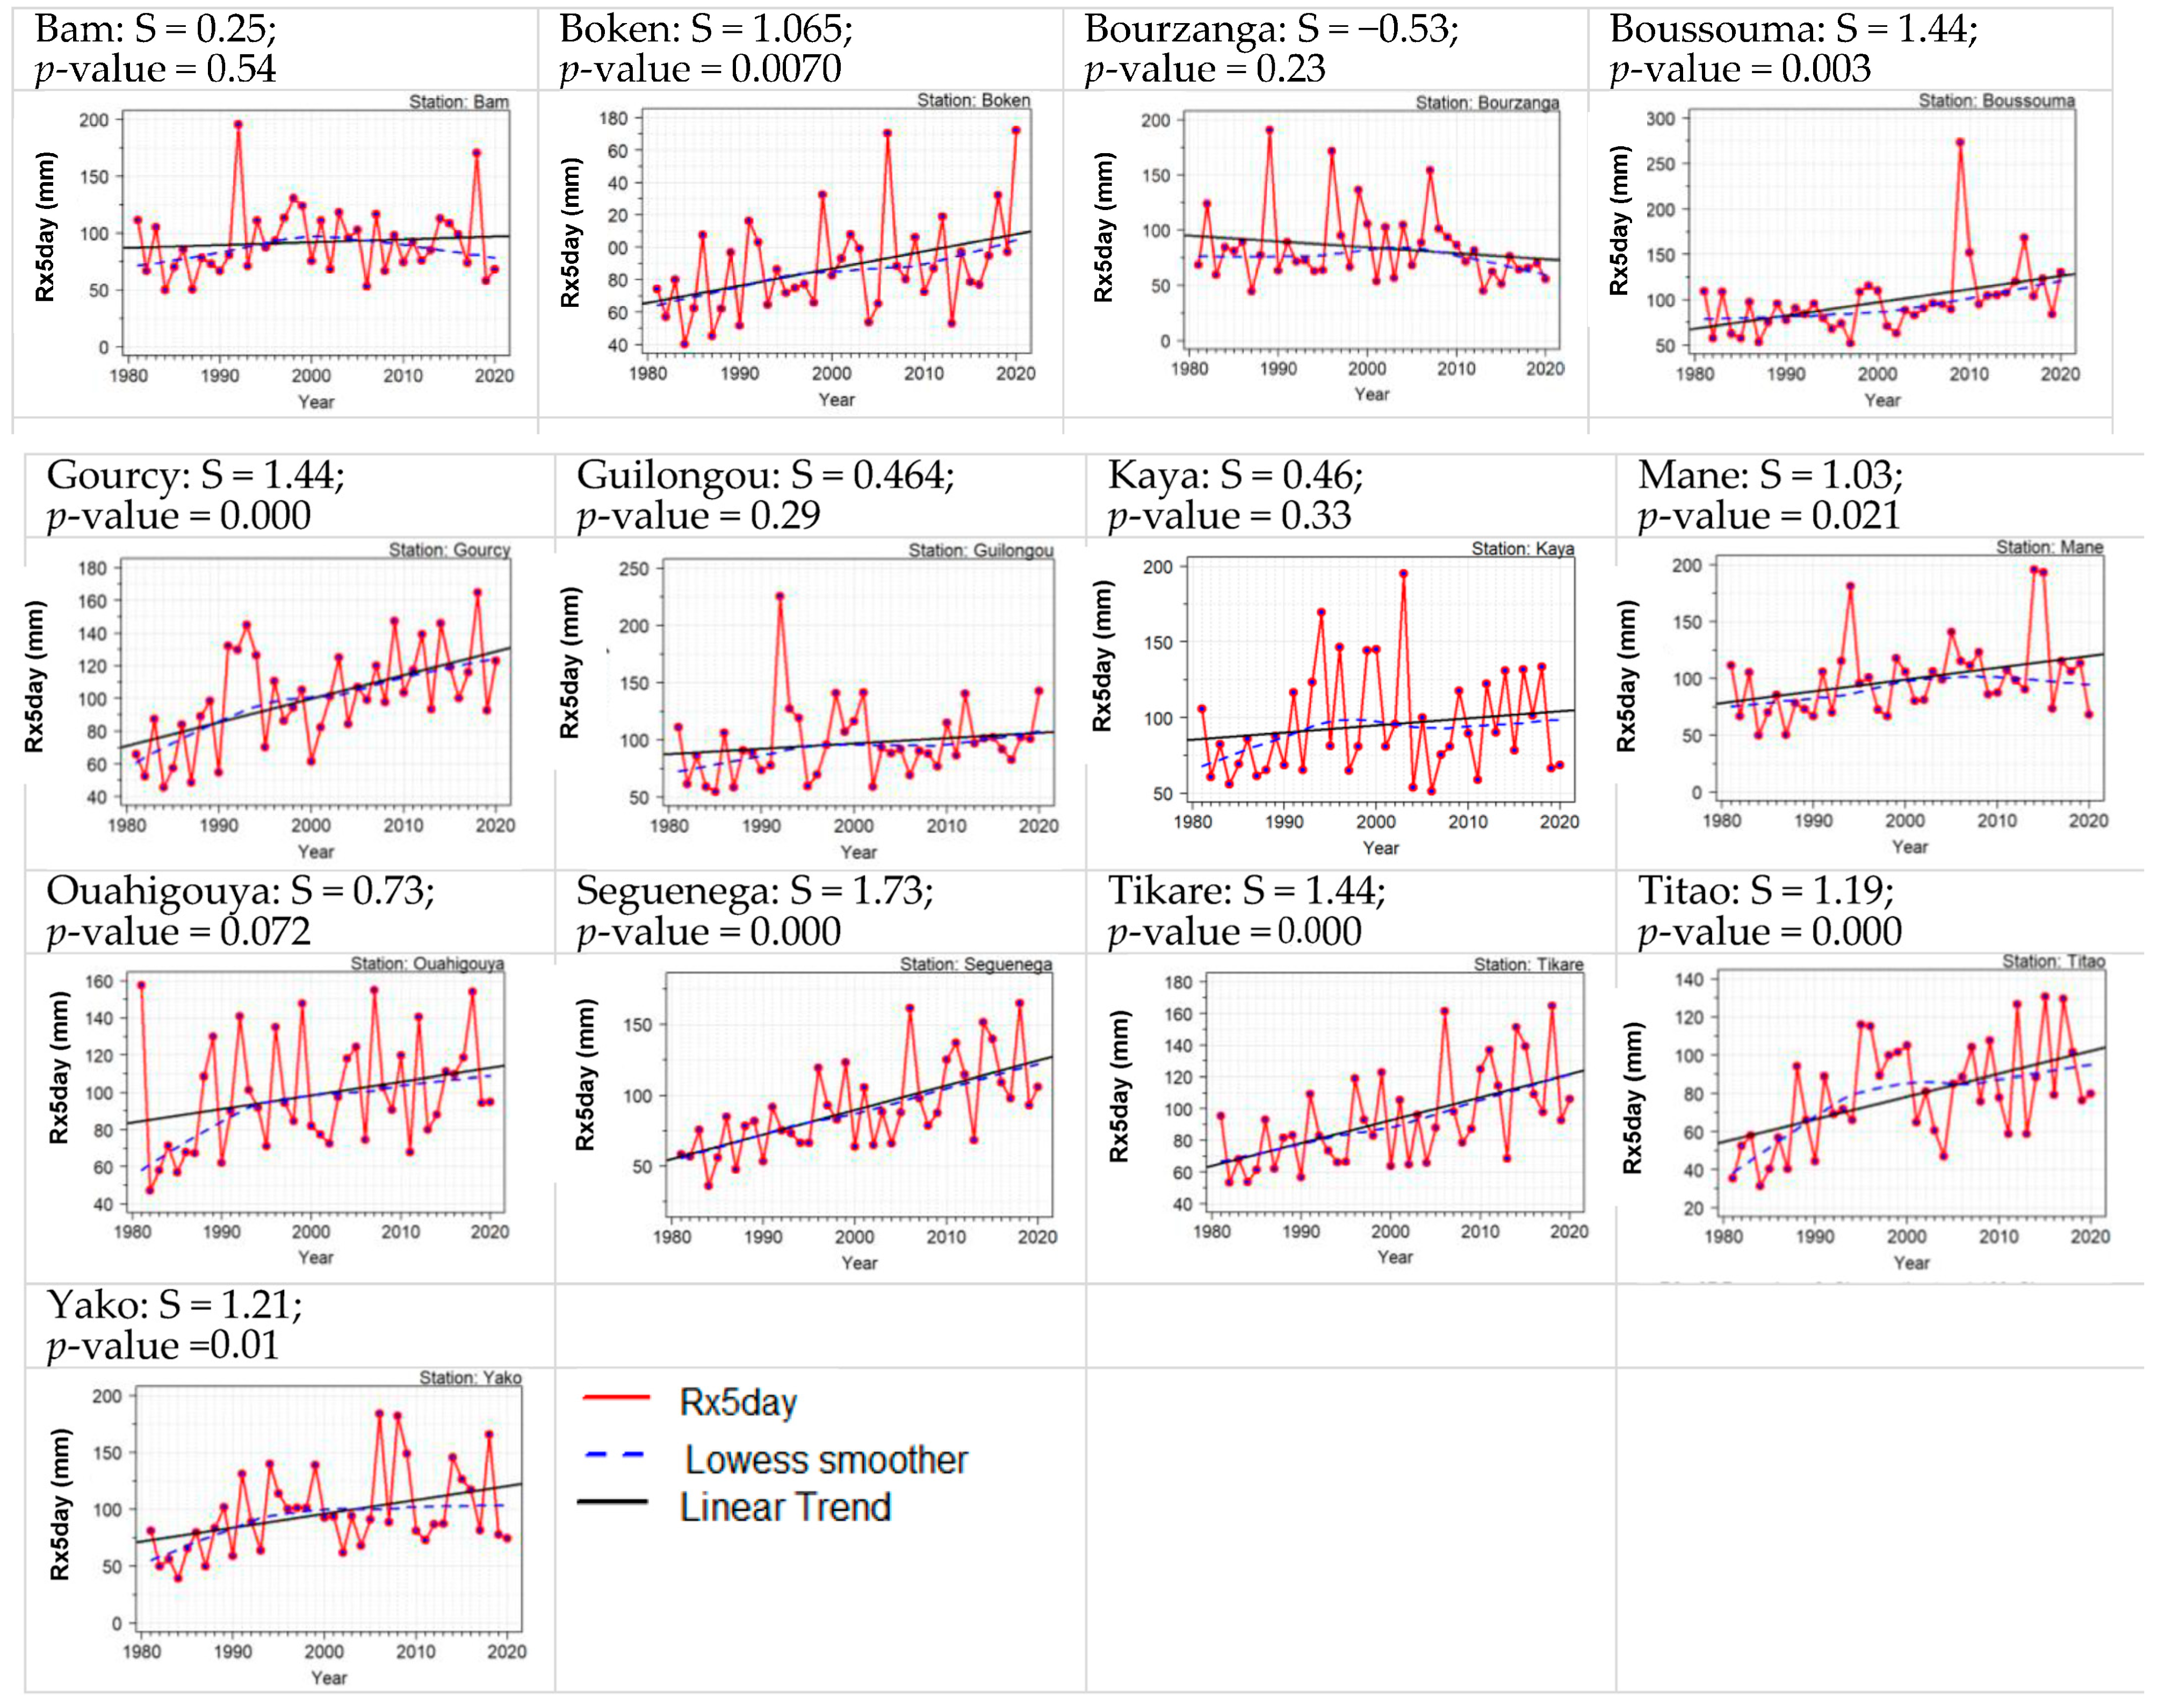
- Maximum 1-day (Rx1day) and 5-day (Rx5day) precipitation
- Very wet days (R95p) and extremely wet days (R99p)
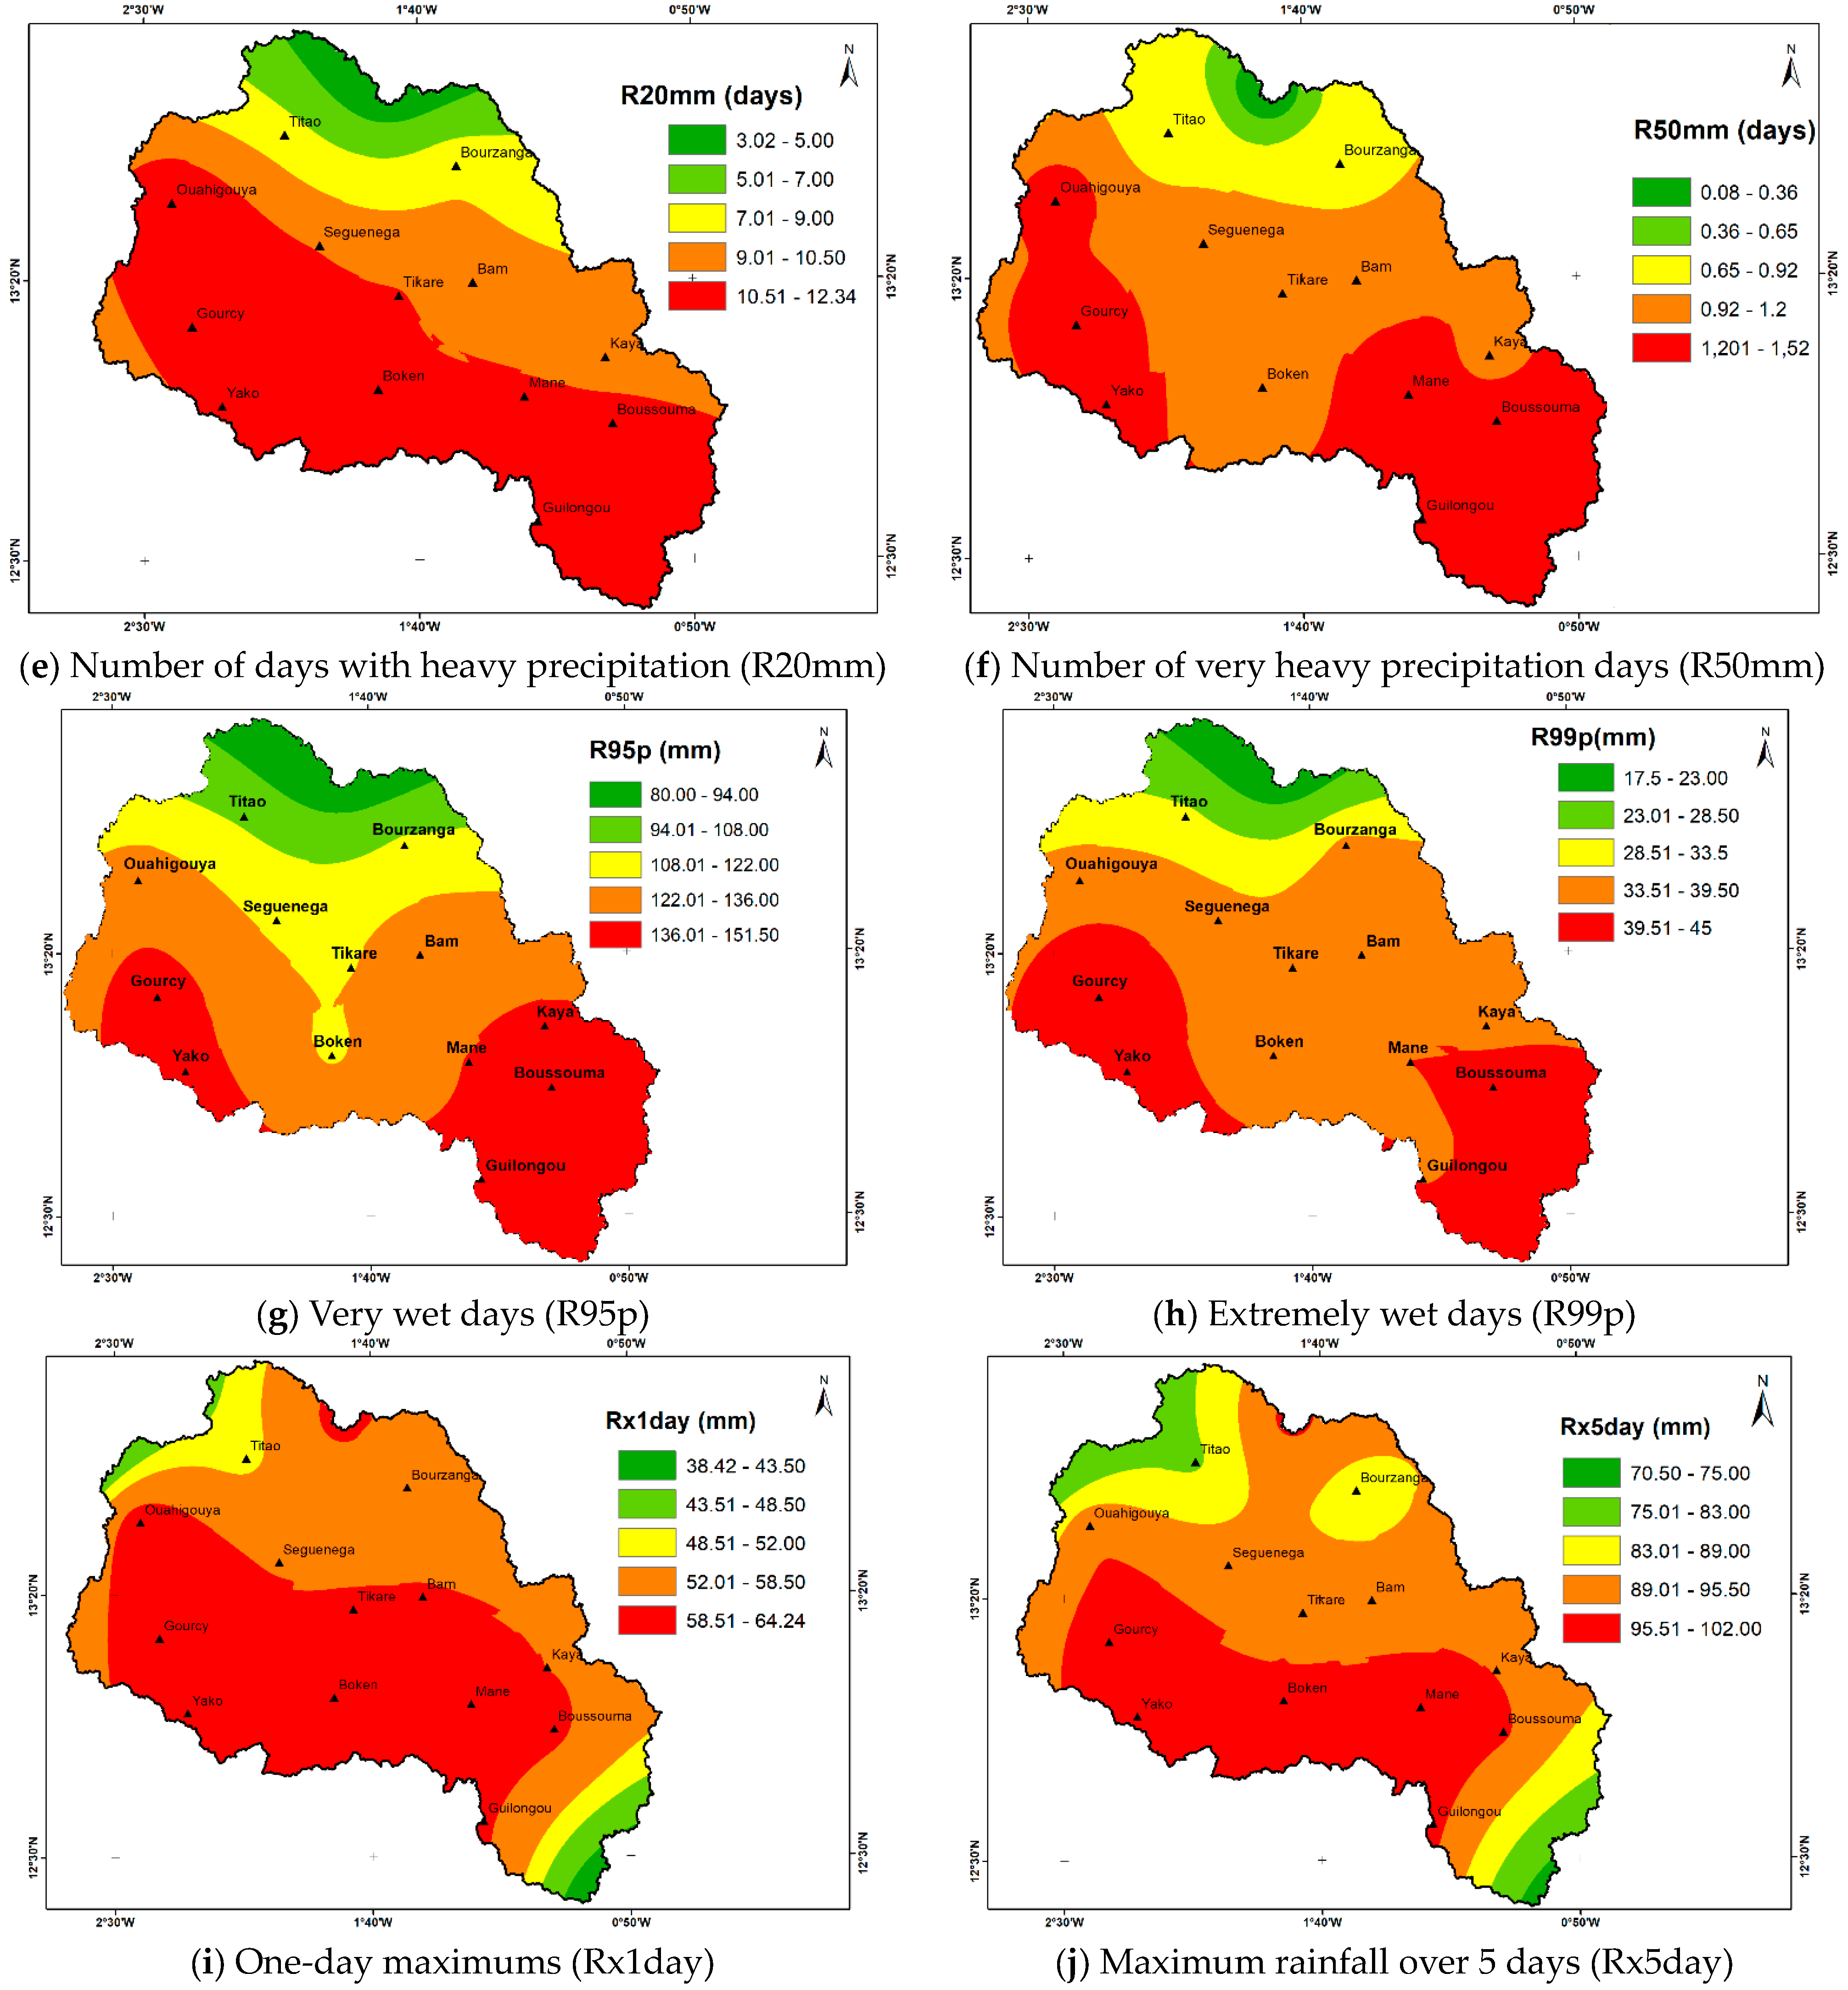
3.3.2. Spatial Distribution Trends
4. Discussion
5. Conclusions
Author Contributions
Funding
Data Availability Statement
Conflicts of Interest
References
- IPCC. Climate Change 2014: Impacts, Adaptation, and Vulnerability; Part A: Global and Sectoral Aspects; Contribution of Working Group II to the Fifth Assessment Report of the Intergovernmental Panel on Climate Change; Field, C.B., Barros, V.R., Dokken, D.J., Mach, K.J., Mastrandrea, M.D., Bilir, T.E., Chatterjee, M., Ebi, K.L., Estrada, Y.O., Genova, R.C., et al., Eds.; Cambridge University Press: Cambridge, UK; New York, NY, USA, 2014; 1132p. Available online: https://www.ipcc.ch/site/assets/uploads/2018/02/WGIIAR5-PartA_FINAL.pdf (accessed on 10 January 2023).
- IPCC. Summary for Policymakers. In Climate Change 2023: Synthesis Report: A Report of the Intergovernmental Panel on Climate Change; Contribution of Working Groups I, II and III to the Sixth Assessment Report of the Intergovernmental Panel on Climate Change; Lee, H., Romero, J., Eds.; IPCC: Geneva, Switzerland, 2023; 36p. [Google Scholar]
- Banerjee, A.; Chen, R.; EMeadows, M.; Singh, R.B.; Mal, S.; Sengupta, D. An Analysis of Long-Term Rainfall Trends and Variability in the Uttarakhand Himalaya Using Google Earth Engine. Remote Sens. 2020, 12, 709. [Google Scholar] [CrossRef]
- Mougin, É.; Hiernaux, P.; Kergoat, L.; Grippa, M.; De Rosnay, P.; Timouk, F.; Le Dantec, V.; Demarez, V.; Lavenu, F.; Arjounin, M. The AMMA-CATCH Gourma observatory site in Mali: Relating climatic variations to changes in vegetation, surface hydrology, fluxes and natural resources. J. Hydrol. 2009, 375, 14–33. [Google Scholar] [CrossRef]
- Lebel, T.; Cappelaere, B.; Galle, S.; Hanan, N.; Kergoat, L.; Levis, S.; Vieux, B.; Descroix, L.; Gosset, M.; Mougin, E. AMMA-CATCH studies in the Sahelian region of West-Africa: An overview. J. Hydrol. 2009, 375, 3–13. [Google Scholar] [CrossRef]
- Boubacar, I.; Karambiri, H.; Polcher, J.; Hamma, Y.; Ribstein, P. Changes in rainfall regime over Burkina Faso under the climate change conditions simulated by 5 regional climate models. Clim. Dyn. 2014, 42, 1363–1381. [Google Scholar]
- Frappart, F.; Hiernaux, P.; Guichard, F.; Mougin, E.; Kergoat, L.; Arjounin, M.; Lavenu, F.; Koité, M.; Paturel, J.-E.; Lebel, T. Rainfall regime across the Sahel band in the Gourma region, Mali. J. Hydrol. 2009, 375, 128–142. [Google Scholar] [CrossRef]
- Oguntunde, P.G.; Abiodun, B.J.; Lischeid, G. Impacts of climate change on hydro-meteorological drought over the Volta Basin, West Africa. Glob. Planet. Chang. 2017, 155, 121–132. [Google Scholar] [CrossRef]
- IPCC. Africa, Climate Change 2014—Impacts, Adaptation and Vulnerability: Part B: Regional Aspects: Working Group II Contribution to the IPCC Fifth Assessment Report: Volume 2: Regional Aspects; Intergovernmental Panel on Climate Change, Ed.; Cambridge University Press: Cambridge, UK, 2014; pp. 1199–1266.
- Patricola, C.; Cook, K. Sub-Saharan Northern African climate at the end of the twenty-first century: Forcing factors and climate change processes. Clim. Dyn. 2011, 37, 1165–1188. [Google Scholar] [CrossRef]
- Oguntunde, P.G.; Abiodun, B.J. The impact of climate change on the Niger River Basin hydroclimatology, West Africa. Clim. Dyn. 2013, 40, 81–94. [Google Scholar] [CrossRef]
- Osuch, M.; Romanowicz, R.; Lawrence, D.; Wong, W. Assessment of the influence of bias correction on meteorological drought projections for Poland. Hydrol. Earth Syst. Sci. Discuss. 2015, 12, 10331–10377. [Google Scholar]
- Pan, T.; Wu, S.; Liu, Y. Relative contributions of land use and climate change to water supply variations over yellow river source area in Tibetan plateau during the past three decades. PLoS ONE 2015, 10, e0123793. [Google Scholar] [CrossRef]
- Zhao, Z.; Liu, G.; Liu, Q.; Huang, C.; Li, H. Studies on the spatiotemporal variability of river water quality and its relationships with soil and precipitation: A case study of the Mun River Basin in Thailand. Int. J. Environ. Res. Public Health 2018, 15, 2466. [Google Scholar] [CrossRef]
- Gogoi, P.P.; Vinoj, V.; Swain, D.; Roberts, G.; Dash, J.; Tripathy, S. Land use and land cover change effect on surface temperature over Eastern India. Sci. Rep. 2019, 9, 8859. [Google Scholar] [CrossRef] [PubMed]
- SP/CNDD. Le Quatrième Rapport sur L’état de L’environnement au Burkina Faso (REEB IV); SP/CNDD: Ouagadougou, Burkina Faso, 2018.
- Shamir, E.; Megdal, S.B.; Carrillo, C.; Castro, C.L.; Chang, H.-I.; Chief, K.; Corkhill, F.E.; Eden, S.; Georgakakos, K.P.; Nelson, K.M. Climate change and water resources management in the Upper Santa Cruz River, Arizona. J. Hydrol. 2015, 521, 18–33. [Google Scholar] [CrossRef]
- Hartmann, H.; Snow, J.A.; Su, B.; Jiang, T. Seasonal predictions of precipitation in the Aksu-Tarim River basin for improved water resources management. Glob. Planet. Chang. 2016, 147, 86–96. [Google Scholar] [CrossRef]
- Shikangalah, R.N.; Mapani, B. Precipitation variations and shifts over time: Implication on Windhoek city water supply. Phys. Chem. Earth Parts A/B/C 2019, 112, 103–112. [Google Scholar] [CrossRef]
- Rivadeneira Vera, J.F.; Zambrano Mera, Y.E.; Pérez-Martín, M.Á. Adapting water resources systems to climate change in tropical areas: Ecuadorian coast. Sci. Total Environ. 2020, 703, 135554. [Google Scholar] [CrossRef]
- Kaboré, P.N.; Ouédraogo, A.; Sanon, P.Y.; Somé, L. Caractérisation de la vulnérabilité climatique dans la région du Centre-Nord du Burkina Faso entre 1961 et 2015. Climatologie 2017, 14, 82–95. [Google Scholar] [CrossRef]
- Bambara, D.; Compaoré, H.; Bilgo, A. Evolution des températures au Burkina Faso entre 1956 et 2015: Cas de Ouagadougou et de Ouahigouya. Physio-Géo 2018, 12, 23–41. [Google Scholar] [CrossRef]
- Gbohoui, Y.P.; Paturel, J.-E.; Fowe, T.; Mounirou, L.A.; Yonaba, R.; Karambiri, H.; Yacouba, H. Impacts of climate and environmental changes on water resources: A multi-scale study based on Nakanbé nested watersheds in West African Sahel. J. Hydrol. Reg. Stud. 2021, 35, 100828. [Google Scholar] [CrossRef]
- Tirogo, J.; Jost, A.; Biaou, A.; Valdes-Lao, D.; Koussoubé, Y.; Ribstein, P. Climate Variability and Groundwater Response: A Case Study in Burkina Faso (West Africa). Water 2016, 8, 171. [Google Scholar] [CrossRef]
- Karambiri, H.; García Galiano, S.; Giraldo, J.; Yacouba, H.; Ibrahim, B.; Barbier, B.; Polcher, J. Assessing the impact of climate variability and climate change on runoff in West Africa: The case of Senegal and Nakambe River basins. Atmos. Sci. Lett. 2011, 12, 109–115. [Google Scholar] [CrossRef]
- Ibrahim, B. Caractérisation des Saisons de Pluies au Burkina Faso dans un Contexte de Changement Climatique et Evaluation des Impacts Hydrologiques sur le Bassin du Nakanbé. Ph.D. Thesis, Université Pierre et Marie Curie-Paris VI, Paris, France, 2012. [Google Scholar]
- MECV. Programme d’action National d’adaptation à la Variabilité et aux Changements Climatiques PANA Burkina Faso; SP/CNDD: Ouagadougou, Burkina Faso, 2007.
- Moser, L.; Voigt, S.; Schoepfer, E.; Palmer, S. Multitemporal Wetland Monitoring in Sub-Saharan West-Africa Using Medium Resolution Optical Satellite Data. IEEE J. Sel. Top. Appl. Earth Obs. Remote Sens. 2014, 7, 3402–3415. [Google Scholar] [CrossRef]
- AEN. Évaluation des Options de Développement des Ressources en eau et Parti D’aménagement et de Gestion Retenu; AEN: Ouagadougou, Burkina Faso, 2018.
- DGRE. Synthèse du Suivi des Ressources en Eau; DGRE: Ouagadougou, Burkina Faso, 2018.
- Klein Tank, A.; Zwiers, F.; Zhang, X. Guidelines on Analysis of Extremes in a Changing Climate in Support of Informed Decisions for Adaptation; World Meteorological Organization: Geneva, Switzerland, 2009. [Google Scholar]
- Shalishe, A.; Bhowmick, A.; Elias, K. Meteorological Drought Monitoring Based on Satellite CHIRPS Product over Gamo Zone, Southern Ethiopia. Adv. Meteorol. 2022, 2022, 9323263. [Google Scholar] [CrossRef]
- Funk, C.; Peterson, P.; Landsfeld, M.; Pedreros, D.; Verdin, J.; Shukla, S.; Husak, G.; Rowland, J.; Harrison, L.; Hoell, A. The climate hazards infrared precipitation with stations—A new environmental record for monitoring extremes. Sci. Data 2015, 2, 150066. [Google Scholar] [CrossRef]
- Dembélé, M.; Zwart, S. Evaluation and comparison of satellite-based rainfall products in Burkina Faso, West Africa. Int. J. Remote Sens. 2016, 37, 3995–4014. [Google Scholar] [CrossRef]
- Funk, C.; Peterson, P.; Peterson, S.; Shukla, S.; Davenport, F.; Michaelsen, J.; Knapp, K.R.; Landsfeld, M.; Husak, G.; Harrison, L. A high-resolution 1983–2016 T max climate data record based on infrared temperatures and stations by the Climate Hazard Center. J. Clim. 2019, 32, 5639–5658. [Google Scholar] [CrossRef]
- Sacré, R.M.; Didi Mouhamed, L.; Kouakou, K.; Adeline, B.; Arona, D.; Houebagnon Saint, J.C.; Koffi Claude, A.K.; Talnan Jean, H.C.; Salomon, O.; Issiaka, S. Using the CHIRPS Dataset to Investigate Historical Changes in Precipitation Extremes in West Africa. Climate 2020, 8, 84. [Google Scholar] [CrossRef]
- Diatta, S.; Diedhiou, C.W.; Dione, D.M.; Sambou, S. Spatial Variation and Trend of Extreme Precipitation in West Africa and Teleconnections with Remote Indices. Atmosphere 2020, 11, 999. [Google Scholar] [CrossRef]
- Quenum, G.M.L.D.; Nkrumah, F.; Klutse, N.A.B.; Sylla, M.B. Spatiotemporal Changes in Temperature and Precipitation in West Africa. Part I: Analysis with the CMIP6 Historical Dataset. Water 2021, 13, 3506. [Google Scholar] [CrossRef]
- Toté, C.; Patricio, D.; Boogaard, H.; Van Der Wijngaart, R.; Tarnavsky, E.; Funk, C. Evaluation of satellite rainfall estimates for drought and flood monitoring in Mozambique. Remote Sens. 2015, 7, 1758–1776. [Google Scholar] [CrossRef]
- New, M.; Hewitson, B.; Stephenson, D.; Tsiga, A.; Kruger, A.; Manhique, A.; Gomez, B.; Coelho, S.; Masisi, D.; Kululanga, E.; et al. Evidence of trends in daily climate extremes over southern and west Africa. J. Geophys. Res. 2006, 111, 11. [Google Scholar] [CrossRef]
- Mahmood, R.; Jia, S. Spatial and temporal hydro-climatic trends in the transboundary Jhelum River basin. J. Water Clim. Chang. 2017, 8, 423–440. [Google Scholar] [CrossRef]
- Frich, P.; Alexander, L.V.; Della-Marta, P.; Gleason, B.; Haylock, M.; Tank, A.K.; Peterson, T. Observed coherent changes in climatic extremes during the second half of the twentieth century. Clim. Res. 2002, 19, 193–212. [Google Scholar] [CrossRef]
- Zhang, X.; Alexander, L.; Hegerl, G.C.; Jones, P.; Tank, A.K.; Peterson, T.C.; Trewin, B.; Zwiers, F.W. Indices for monitoring changes in extremes based on daily temperature and precipitation data. Wiley Interdiscip. Rev. Clim. Chang. 2011, 2, 851–870. [Google Scholar] [CrossRef]
- Mann, H.B. Nonparametric tests against trend. Econom. J. Econom. Soc. 1945, 13, 245–259. [Google Scholar] [CrossRef]
- Sen, P.K. Estimates of the Regression Coefficient Based on Kendall’s Tau. J. Am. Stat. Assoc. 1968, 63, 1379–1389. [Google Scholar] [CrossRef]
- Jaiswal, R.K.; Lohani, A.K.; Tiwari, H.L. Statistical Analysis for Change Detection and Trend Assessment in Climatological Parameters. Environ. Process. 2015, 2, 729–749. [Google Scholar] [CrossRef]
- Wang, Y.; Ma, J.; Xiao, X.; Wang, X.; Dai, S.; Zhao, B. Long-Term Dynamic of Poyang Lake Surface Water: A Mapping Work Based on the Google Earth Engine Cloud Platform. Remote Sens. 2019, 11, 313. [Google Scholar] [CrossRef]
- Siegel, A.F. Robust regression using repeated medians. Biometrika 1982, 69, 242–244. [Google Scholar] [CrossRef]
- Fickas, K.C.; Cohen, W.B.; Yang, Z. Landsat-based monitoring of annual wetland change in the Willamette Valley of Oregon, USA from 1972 to 2012. Wetl. Ecol. Manag. 2016, 24, 73–92. [Google Scholar] [CrossRef]
- Nitze, I.; Grosse, G.; Jones, B.M.; Arp, C.D.; Ulrich, M.; Fedorov, A.; Veremeeva, A. Landsat-based trend analysis of lake dynamics across northern permafrost regions. Remote Sens. 2017, 9, 640. [Google Scholar] [CrossRef]
- Song, X.; Song, S.; Sun, W.; Mu, X.; Wang, S.; Li, J.; Li, Y. Recent changes in extreme precipitation and drought over the Songhua River Basin, China, during 1960–2013. Atmos. Res. 2015, 157, 137–152. [Google Scholar] [CrossRef]
- Tsidu, G.M. Secular spring rainfall variability at local scale over Ethiopia: Trend and associated dynamics. Theor. Appl. Climatol. 2017, 130, 91–106. [Google Scholar] [CrossRef]
- Manzanas, R.; Amekudzi, L.; Preko, K.; Herrera, S.; Gutiérrez, J.M. Precipitation variability and trends in Ghana: An intercomparison of observational and reanalysis products. Clim. Chang. 2014, 124, 805–819. [Google Scholar] [CrossRef]
- Frazier, A.G.; Giambelluca, T.W. Spatial trend analysis of Hawaiian rainfall from 1920 to 2012. Int. J. Climatol. 2017, 37, 2522–2531. [Google Scholar] [CrossRef]
- Pedron, I.T.; Silva Dias, M.A.; de Paula Dias, S.; Carvalho, L.M.; Freitas, E.D. Trends and variability in extremes of precipitation in Curitiba–Southern Brazil. Int. J. Climatol. 2017, 37, 1250–1264. [Google Scholar] [CrossRef]
- Hallouz, F.; Meddi, M.; Mahe, G.; Karahacane, H.; Ali Rahmani, S. Tendance des précipitations et évolution des écoulements dans un cadre de changement climatique: Bassin versant de l’oued Mina en Algérie. Rev. Des Sci. L’eau J. Water Sci. 2019, 32, 83–114. [Google Scholar] [CrossRef]
- Aumond, P.; Can, A.; Mallet, V.; De Coensel, B.; Ribeiro, C.; Botteldooren, D.; Lavandier, C. Kriging-based spatial interpolation from measurements for sound level mapping in urban areas. J. Acoust. Soc. Am. 2018, 143, 2847–2857. [Google Scholar] [CrossRef]
- Li, J.; Heap, A.D. Spatial interpolation methods applied in the environmental sciences: A review. Environ. Model. Softw. 2014, 53, 173–189. [Google Scholar] [CrossRef]
- Guarnier, L.; Barroso, G.F. Spatial and temporal variability of rainfall towards watershed water resources management. Authorea Prepr. 2022. [Google Scholar]
- Apaydin, H.; Sonmez, F.K.; Yildirim, Y.E. Spatial interpolation techniques for climate data in the GAP region in Turkey. Clim. Res. 2004, 28, 31–40. [Google Scholar] [CrossRef]
- Lodoun, T.; Giannini, A.; Traoré, P.S.; Somé, L.; Sanon, M.; Vaksmann, M.; Rasolodimby, J.M. Changes in seasonal descriptors of precipitation in Burkina Faso associated with late 20th century drought and recovery in West Africa. Environ. Dev. 2013, 5, 96–108. [Google Scholar] [CrossRef]
- Hoerling, M.; Hurrell, J.; Eischeid, J.; Phillips, A. Detection and attribution of twentieth-century northern and southern African rainfall change. J. Clim. 2006, 19, 3989–4008. [Google Scholar] [CrossRef]
- Funk, C.C.; Rowland, J.; Eilerts, G.; Adoum, A.; White, L. A Climate Trend Analysis of Burkina Faso; US Geological Survey: Reston, VA, USA, 2012; pp. 2327–6932.
- Crawford, A.; Price-Kelly, H.; Terton, A.; Echeverría, D. Review of Current and Planned Adaptation Action in Burkina Faso; International Development Research Centre: Ottawa, ON, Canada, 2016. Available online: https://www.authorea.com/doi/full/10.1002/essoar.10503371.1 (accessed on 10 January 2023).
- Panthou, G.; Lebel, T.; Vischel, T.; Quantin, G.; Sane, Y.; Ba, A.; Ndiaye, O.; Diongue-Niang, A.; Diopkane, M. Rainfall intensification in tropical semi-arid regions: The Sahelian case. Environ. Res. Lett. 2018, 13, 064013. [Google Scholar] [CrossRef]
- Sanogo, S.; Fink, A.H.; Omotosho, J.A.; Ba, A.; Redl, R.; Ermert, V. Spatio-temporal characteristics of the recent rainfall recovery in West Africa. Int. J. Climatol. 2015, 35, 4589–4605. [Google Scholar] [CrossRef]
- Paeth, H.; Fink, A.H.; Pohle, S.; Keis, F.; Mächel, H.; Samimi, C. Meteorological characteristics and potential causes of the 2007 flood in sub-Saharan Africa. Int. J. Climatol. 2011, 31, 1908–1926. [Google Scholar] [CrossRef]
- Barry, A.; Caesar, J.; Klein Tank, A.; Aguilar, E.; McSweeney, C.; Cyrille, A.M.; Nikiema, M.; Narcisse, K.; Sima, F.; Stafford, G. West Africa climate extremes and climate change indices. Int. J. Climatol. 2018, 38, e921–e938. [Google Scholar] [CrossRef]
- IPCC. Summary for Policymakers. In Global Warming of 1.5 °C; An IPCC Special Report on the Impacts of Global Warming of 1.5 °C above Pre-Industrial Levels and Related Global Greenhouse Gas Emission Pathways, in the Context of Strengthening the Global Response to the Threat of Climate Change, Sustainable Development, and Efforts to Eradicate Poverty; Masson-Delmotte, V.P., Zhai, H.-O., Pörtner, D., Roberts, J., Skea, P.R., Shukla, A., Pirani, W., Moufouma-Okia, C., Péan, R., Pidcock, S., et al., Eds.; Cambridge University Press: Cambridge, UK; New York, NY, USA, 2018; pp. 3–24. [Google Scholar] [CrossRef]


| Station | Longitude (°) | Latitude (°) | Altitude (m) | Observation Available (%) | |
|---|---|---|---|---|---|
| 1 | Bam | −1.50199 | 13.32601 | 264 | 61.3 |
| 2 | Boken | −1.80365 | 13.00205 | 314 | 75 |
| 3 | Bourzanga | −1.55029 | 13.67331 | 329 | 72.3 |
| 4 | Boussouma | −1.07879 | 12.90471 | 323 | 69.4 |
| 5 | Gourcy | −2.35498 | 13.19673 | 332 | 72.7 |
| 6 | Guilongou | −1.30797 | 12.61320 | 315 | 69 |
| 7 | Kaya | −1.09970 | 13.10015 | 313 | 60 |
| 8 | Mane | −1.34636 | 12.98489 | 283 | 72.7 |
| 9 | Ouahigouya * | −2.41651 | 13.56530 | 329 | 100 |
| 10 | Seguenega | −1.96679 | 13.43784 | 307 | 72.7 |
| 11 | Tikare | −1.72670 | 13.28709 | 400 | 59 |
| 12 | Titao | −2.07208 | 13.76730 | 319 | 69.8 |
| 13 | Yako | −2.26418 | 12.95827 | 294 | 66.4 |
| 14 | Ouagadougou * | −1.51239 | 12.35641 | 303 | 100 |
| Statistical Indicator | Formula | Values Range | Perfect Score | Equation |
|---|---|---|---|---|
| Pearson correlation coefficient | −1 to 1 | 1 | (1) | |
| Mean error (ME) | −∞ to ∞ | 0 | (2) | |
| Bias | 0 to ∞ | 1 | (3) | |
| Root mean square error (RMSE) | 0 to ∞ | 0 | (4) | |
| Nash–Sutcliffe efficiency coefficient | −∞ to 1 | 1 | (5) | |
| Probability of detection | 0 to 1 | 1 | (6) | |
| False alarm ratio | 0 to 1 | 0 | (7) |
| Indices | Descriptive Name | Definition | Units |
|---|---|---|---|
| PRCPTOT | Annual total wet-day precipitation | Annual total rainfall from days ≥ 1 mm | mm |
| Rx1day | Max 1-day precipitation amount | Annual maximum 1-day precipitation | mm |
| Rx5day | Max-5-day precipitation amount | Annual maximum consecutive 5-day rainfall | mm |
| CDD | Consecutive dry days | Maximum number of consecutive days with rainfall < 1 mm | days |
| CWD | Consecutive wet days | Maximum number of consecutive days with rainfall ≥ 1 mm | days |
| R20mm | Number of heavy precipitation days | Annual counts of days when rainfall ≥ 20 mm | days |
| R50mm | Number of very heavy precipitation days | Annual counts of days when rainfall ≥ 50 mm | days |
| R95p | Very wet days | Annual total precipitation from the days with daily rainfall > 95th percentile | mm |
| R99p | Extremely wet days | Annual total precipitation on the days when daily rainfall > 99th percentile | mm |
| SDII | Simple daily intensity index | Annual total rainfall when (PRCP ≥ 1 mm) divided by the number of wet days | mm/day |
| Name | Ouagadougou | Ouahigouya |
|---|---|---|
| Pearson correlation coefficient (r) | 0.95 | 0.92 |
| BIAS | 1.05 | 1.03 |
| ME * | 3.37 | 1.53 |
| RMSE * | 27.1 | 32.66 |
| Nash–Sutcliffe efficiency NSE | 0.89 | 0.83 |
| POD | 0.97 | 0.96 |
| FAR | 0.13 | 0.12 |
| Station | Minimum (mm) | Maximum (mm) | Average (mm) | Standard Deviation (mm) | Coefficient of Variation (%) |
|---|---|---|---|---|---|
| Bam | 425.3 | 1033.14 | 636.58 | 130.06 | 20.43 |
| Bourzanga | 355.7 | 742.8 | 564.75 | 92.54 | 16.38 |
| Seguenega | 362.41 | 1000 | 621.41 | 140.72 | 22.64 |
| Titao | 268.2 | 762 | 517.99 | 127.55 | 24.62 |
| Boussouma | 370.9 | 1170.1 | 675.63 | 154.59 | 22.88 |
| Gourcy | 446.91 | 1016 | 688.2 | 149.44 | 21.71 |
| Guilongou | 517.98 | 972.7 | 707.15 | 117.72 | 16.66 |
| Kaya | 466.2 | 959.8 | 655.57 | 133.84 | 20.41 |
| Mane | 458.6 | 1110.1 | 674.87 | 136.98 | 20.29 |
| Ouahigouya | 358.2 | 983.4 | 679.95 | 172.1 | 25.31 |
| Tikare | 400.9 | 1000 | 638.79 | 129.91 | 20.33 |
| Yako | 459.34 | 1090.6 | 695.02 | 136.61 | 19.65 |
| Boken | 398.1 | 931.5 | 619.42 | 124.01 | 20.02 |
| Average | 640.03 | 20.02 |
| Index Station | PRCP TOT (mm/Year) | SDII (mm/Day/Year) | CDD (Days/Year) | CWD (Days/Year) | R20 mm (Days/Year) | R50 mm (Days/Year) | Rx1day (mm/Year) | Rx5day (mm/Year) | R95p (mm/Year) | R99p (mm/Year) |
|---|---|---|---|---|---|---|---|---|---|---|
| Bam | 1.68 | 0.10 * | 0.27 | −0.02 | 0.1 | 0.02 | 0.22 | 0.25 | 1.79 | 1.25 |
| Bourzanga | 2.77 * | −0.12 ** | −0.61 * | 0.07 ** | −0.14 ** | −0.03 | −0.43 | −0.53 | −3.04 * | −1.02 |
| Boussouma | 6.77 ** | 0.25 ** | 0.24 | −0.04 * | 0.26 ** | 0.05 * | 0.98 * | 1.45 ** | 5.86 ** | 2.30 * |
| Gourcy | 7.96 ** | 0.27 ** | 0.34 | −0.04 | 0.29 ** | 0.07 ** | 1.3 ** | 1.45 ** | 6.71 ** | 3.23 ** |
| Guilongou | 3.77 * | 0.19 ** | 0.43 | −0.06 ** | 0.22 ** | 0.06 ** | 0.37 | 0.46 | 4.48 ** | 1.31 |
| Kaya | 3.55 * | 0.15 ** | 0.3 | −0.04 * | 0.17 ** | 0.02 | 0.46 | 0.46 | 3.75 * | 0.42 |
| Mane | 3.95 ** | 0.24 ** | 0.68 * | −0.03 * | 0.22 ** | 0.04 * | 0.58 | 1.04 * | 3.43 * | 0.35 |
| Ouahigouya | 9.08 ** | 0.13 ** | −0.19 | −0.01 | 0.20 ** | 0.05 ** | 0.63 * | 0.73 | 3.97 ** | 0.75 |
| Seguenega | 8.33 ** | 0.37 ** | 0.26 | −0.03 | 0.31 ** | 0.05 ** | 1.08 ** | 1.73 ** | 5.77 ** | 2.15 * |
| Tikare | 6.46 ** | 0.34 ** | 0.82 * | −0.04 * | 0.29 ** | 0.04 ** | 0.82 ** | 1.44 ** | 5.46 ** | 1.93 * |
| Titao | 4.76 ** | 0.27 ** | 0.85 ** | −0.04 | 0.21 ** | 0.04 ** | 1.10 ** | 1.19 ** | 4.65 ** | 0.99 |
| Yako | 4.60 * | 0.12 ** | 0.19 | −0.01 * | 0.19 ** | 0.02 | 0.85 * | 1.22 * | 2.41 | 1.03 |
| Boken | 5.1 ** | 0.32 ** | 0.60 * | −0.06 ** | 0.04 | 0.05 ** | 1.08 ** | 1.07 * | 5.36 ** | 2.19 ** |
Disclaimer/Publisher’s Note: The statements, opinions and data contained in all publications are solely those of the individual author(s) and contributor(s) and not of MDPI and/or the editor(s). MDPI and/or the editor(s) disclaim responsibility for any injury to people or property resulting from any ideas, methods, instructions or products referred to in the content. |
© 2023 by the authors. Licensee MDPI, Basel, Switzerland. This article is an open access article distributed under the terms and conditions of the Creative Commons Attribution (CC BY) license (https://creativecommons.org/licenses/by/4.0/).
Share and Cite
Yameogo, W.V.M.; Akpa, Y.L.; Danumah, J.H.; Traore, F.; Tankoano, B.; Sanon, Z.; Kabore, O.; Hien, M. Spatio-Temporal Evolution of Rainfall over the Period 1981–2020 and Management of Surface Water Resources in the Nakanbe–Wayen Watershed in Burkina Faso. Earth 2023, 4, 606-625. https://doi.org/10.3390/earth4030032
Yameogo WVM, Akpa YL, Danumah JH, Traore F, Tankoano B, Sanon Z, Kabore O, Hien M. Spatio-Temporal Evolution of Rainfall over the Period 1981–2020 and Management of Surface Water Resources in the Nakanbe–Wayen Watershed in Burkina Faso. Earth. 2023; 4(3):606-625. https://doi.org/10.3390/earth4030032
Chicago/Turabian StyleYameogo, Wennepinguere Virginie Marie, You Lucette Akpa, Jean Homian Danumah, Farid Traore, Boalidioa Tankoano, Zezouma Sanon, Oumar Kabore, and Mipro Hien. 2023. "Spatio-Temporal Evolution of Rainfall over the Period 1981–2020 and Management of Surface Water Resources in the Nakanbe–Wayen Watershed in Burkina Faso" Earth 4, no. 3: 606-625. https://doi.org/10.3390/earth4030032
APA StyleYameogo, W. V. M., Akpa, Y. L., Danumah, J. H., Traore, F., Tankoano, B., Sanon, Z., Kabore, O., & Hien, M. (2023). Spatio-Temporal Evolution of Rainfall over the Period 1981–2020 and Management of Surface Water Resources in the Nakanbe–Wayen Watershed in Burkina Faso. Earth, 4(3), 606-625. https://doi.org/10.3390/earth4030032