
Interpretation of Fluoride Groundwater Contamination in Tamnar Area, Raigarh, Chhattisgarh, India


Abstract
1. Introduction
2. Materials and Methods
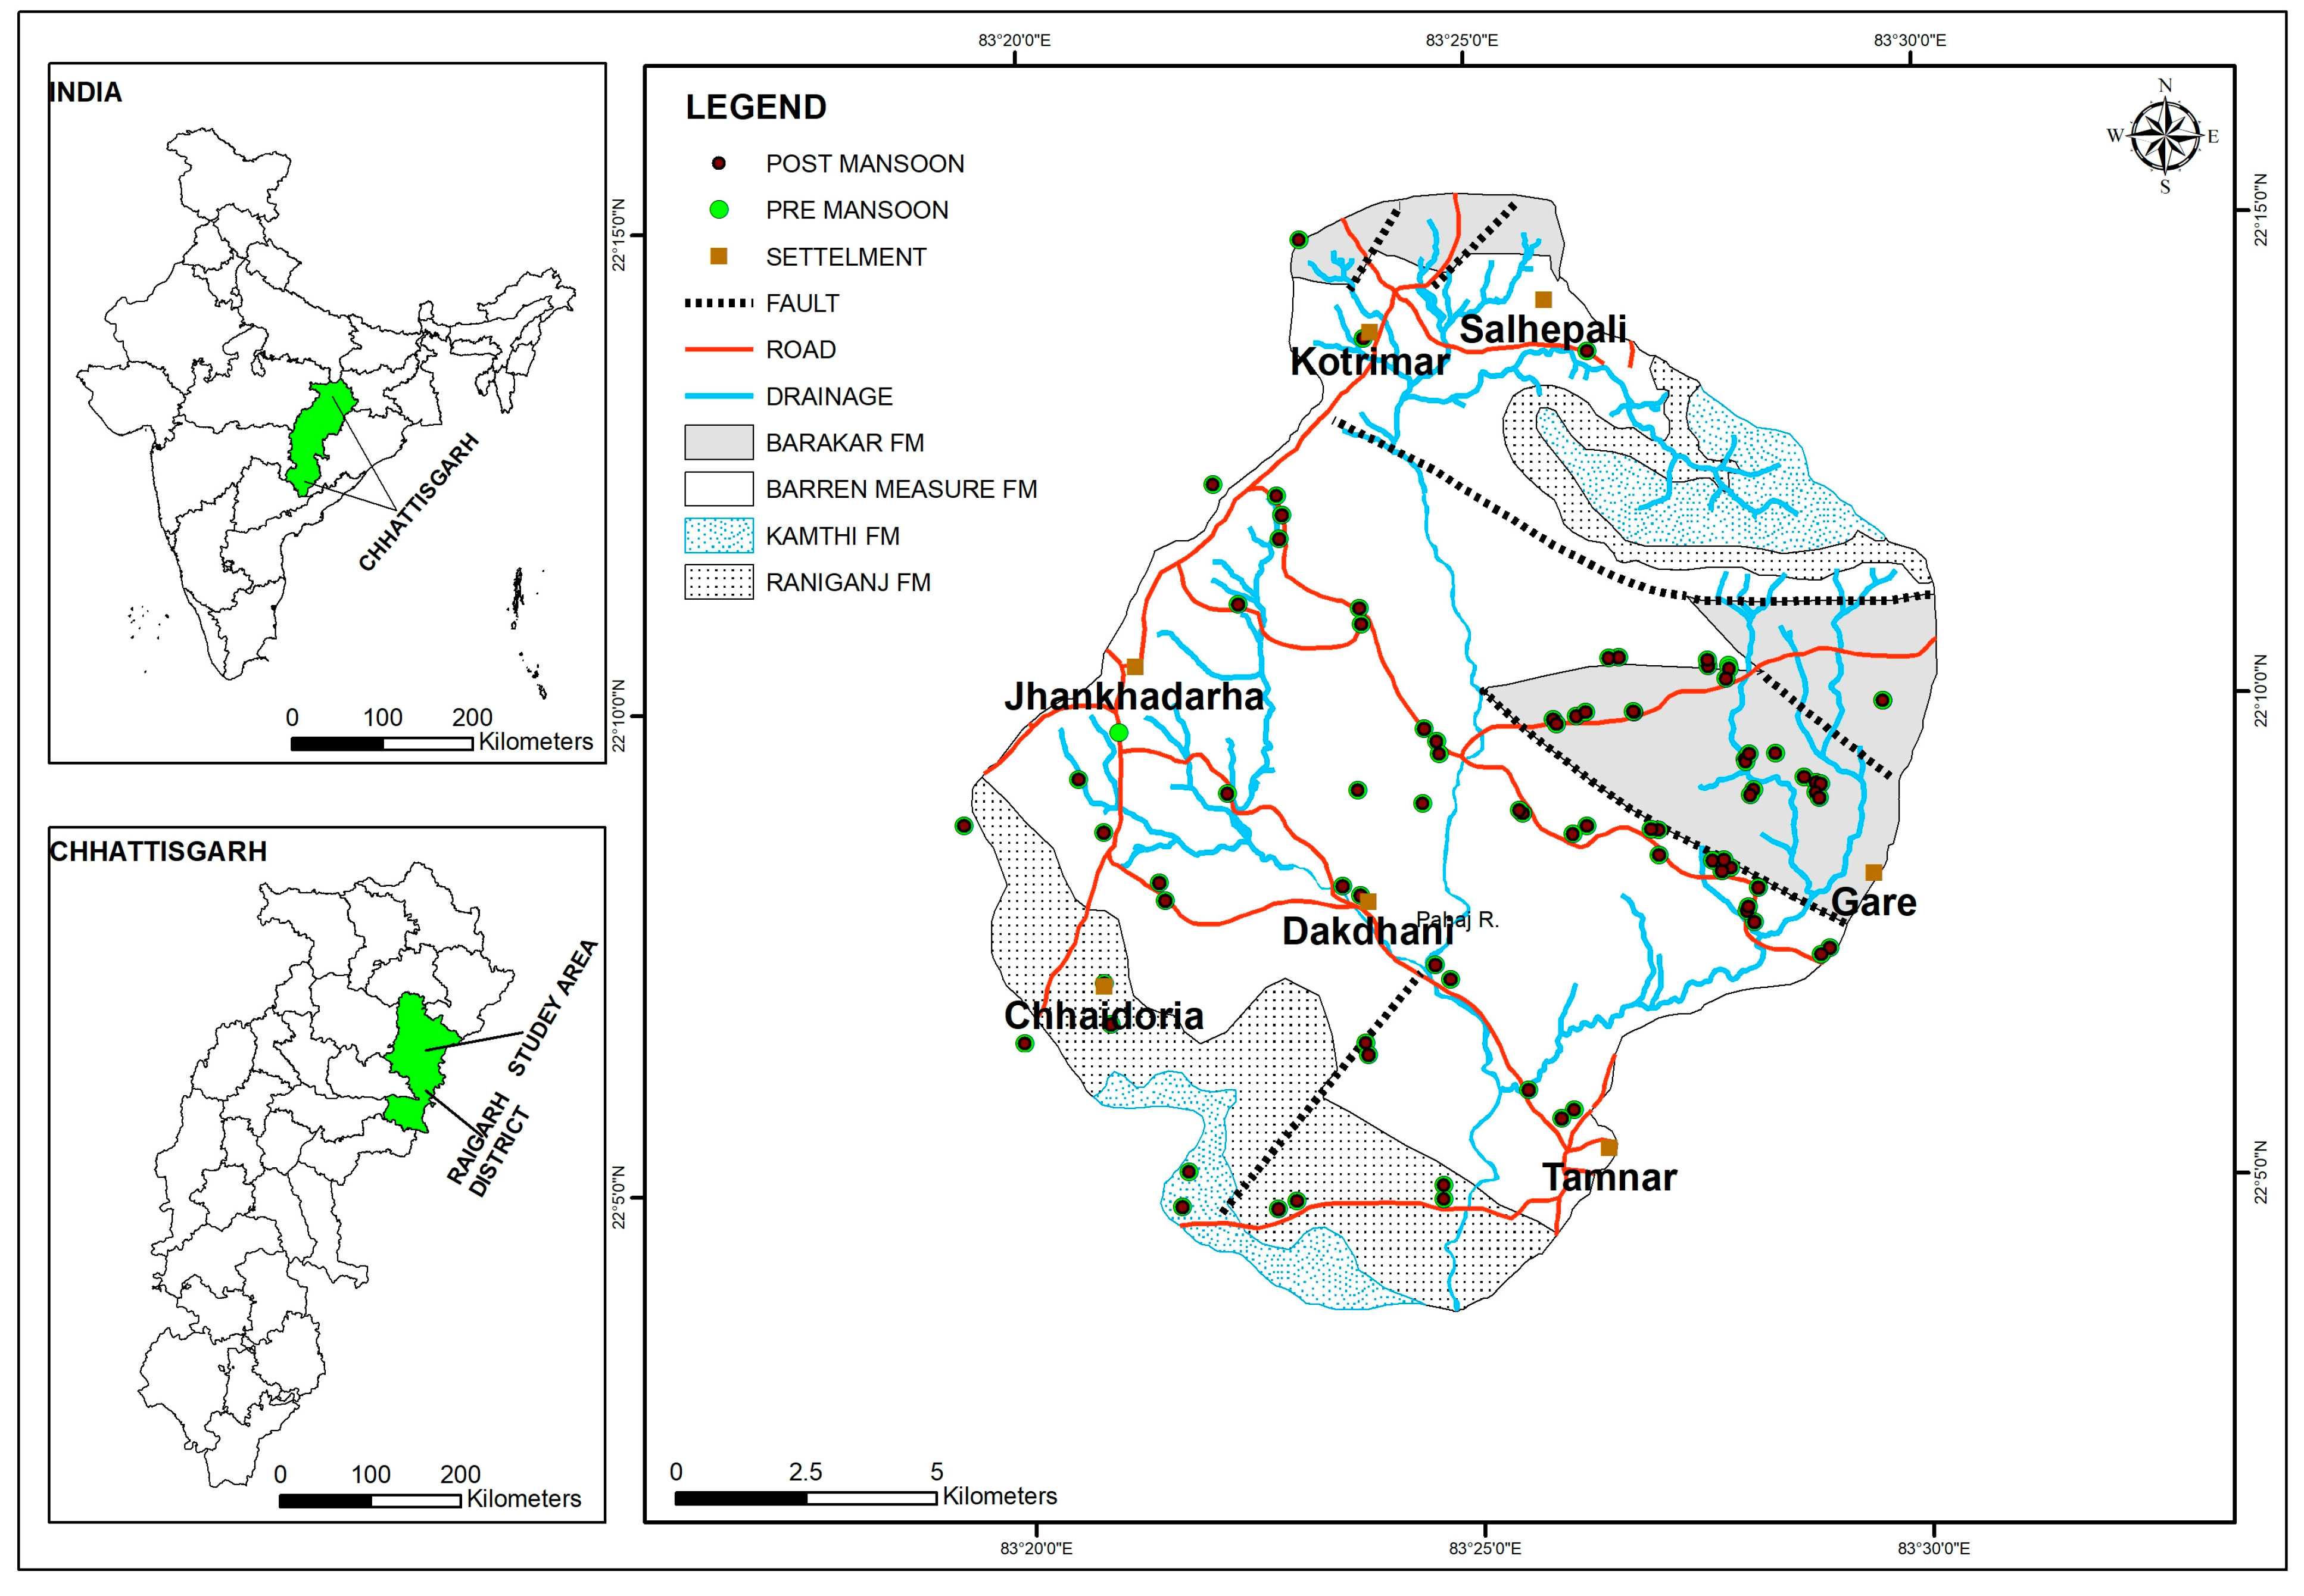
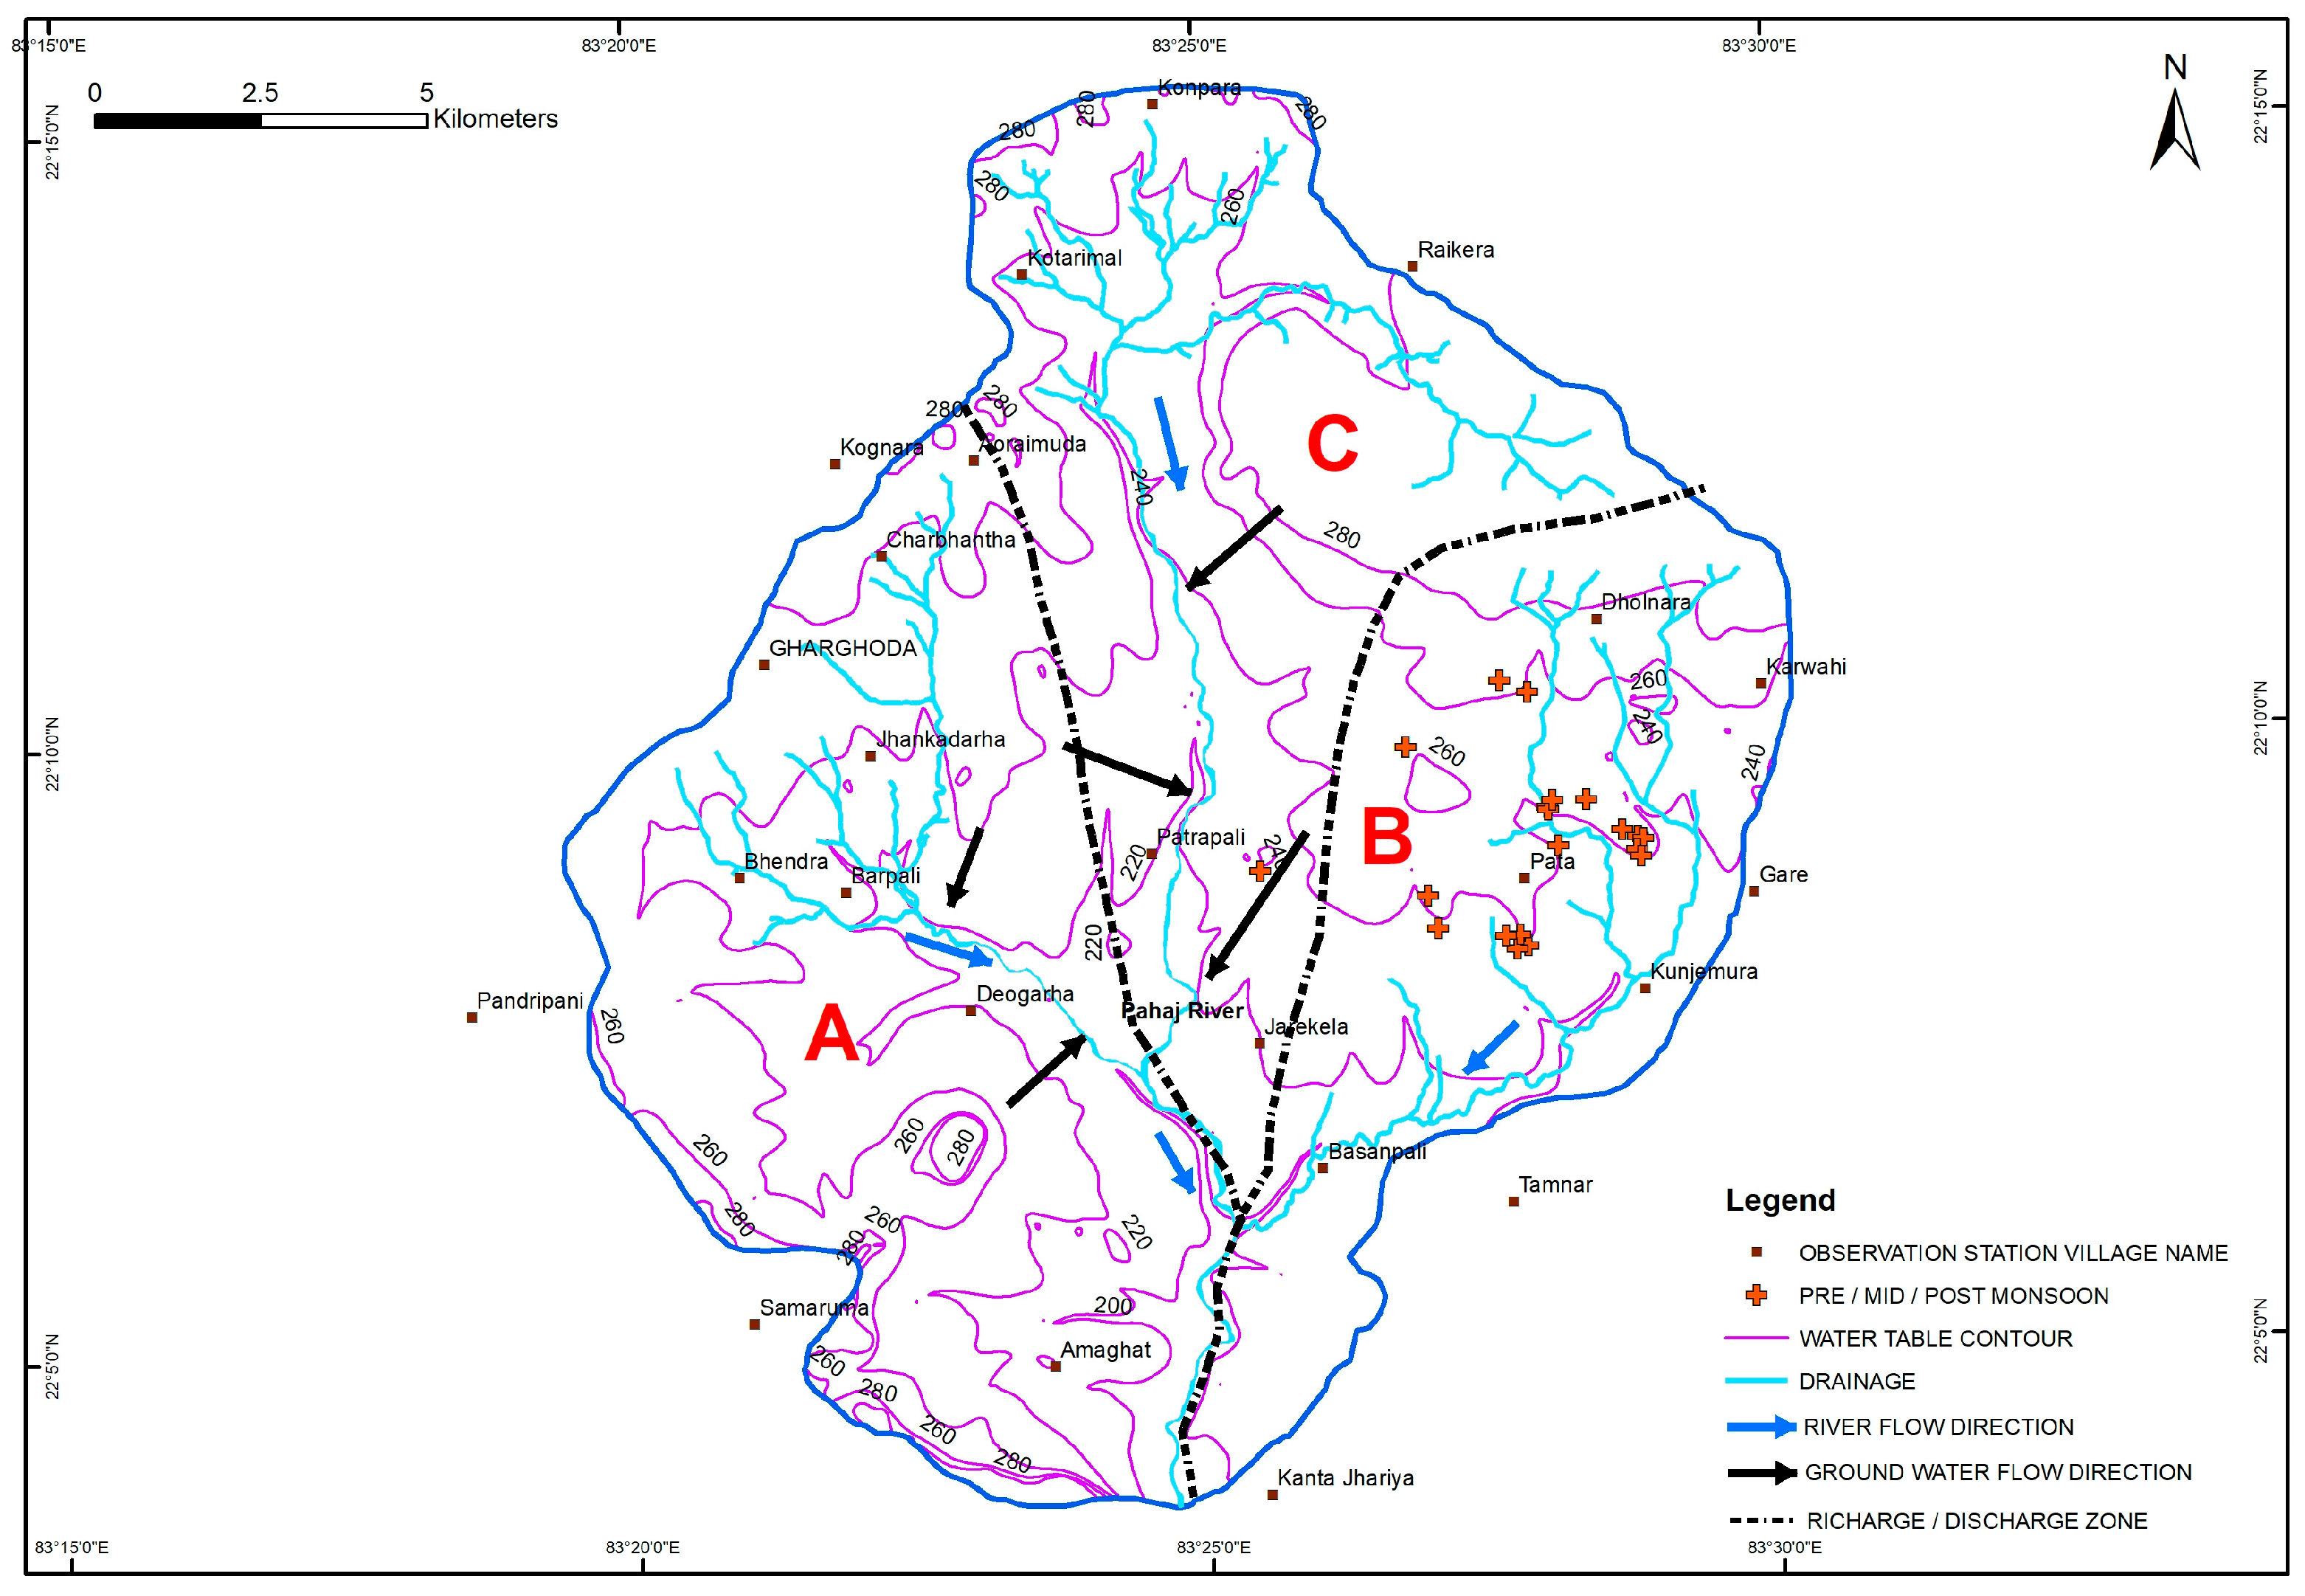
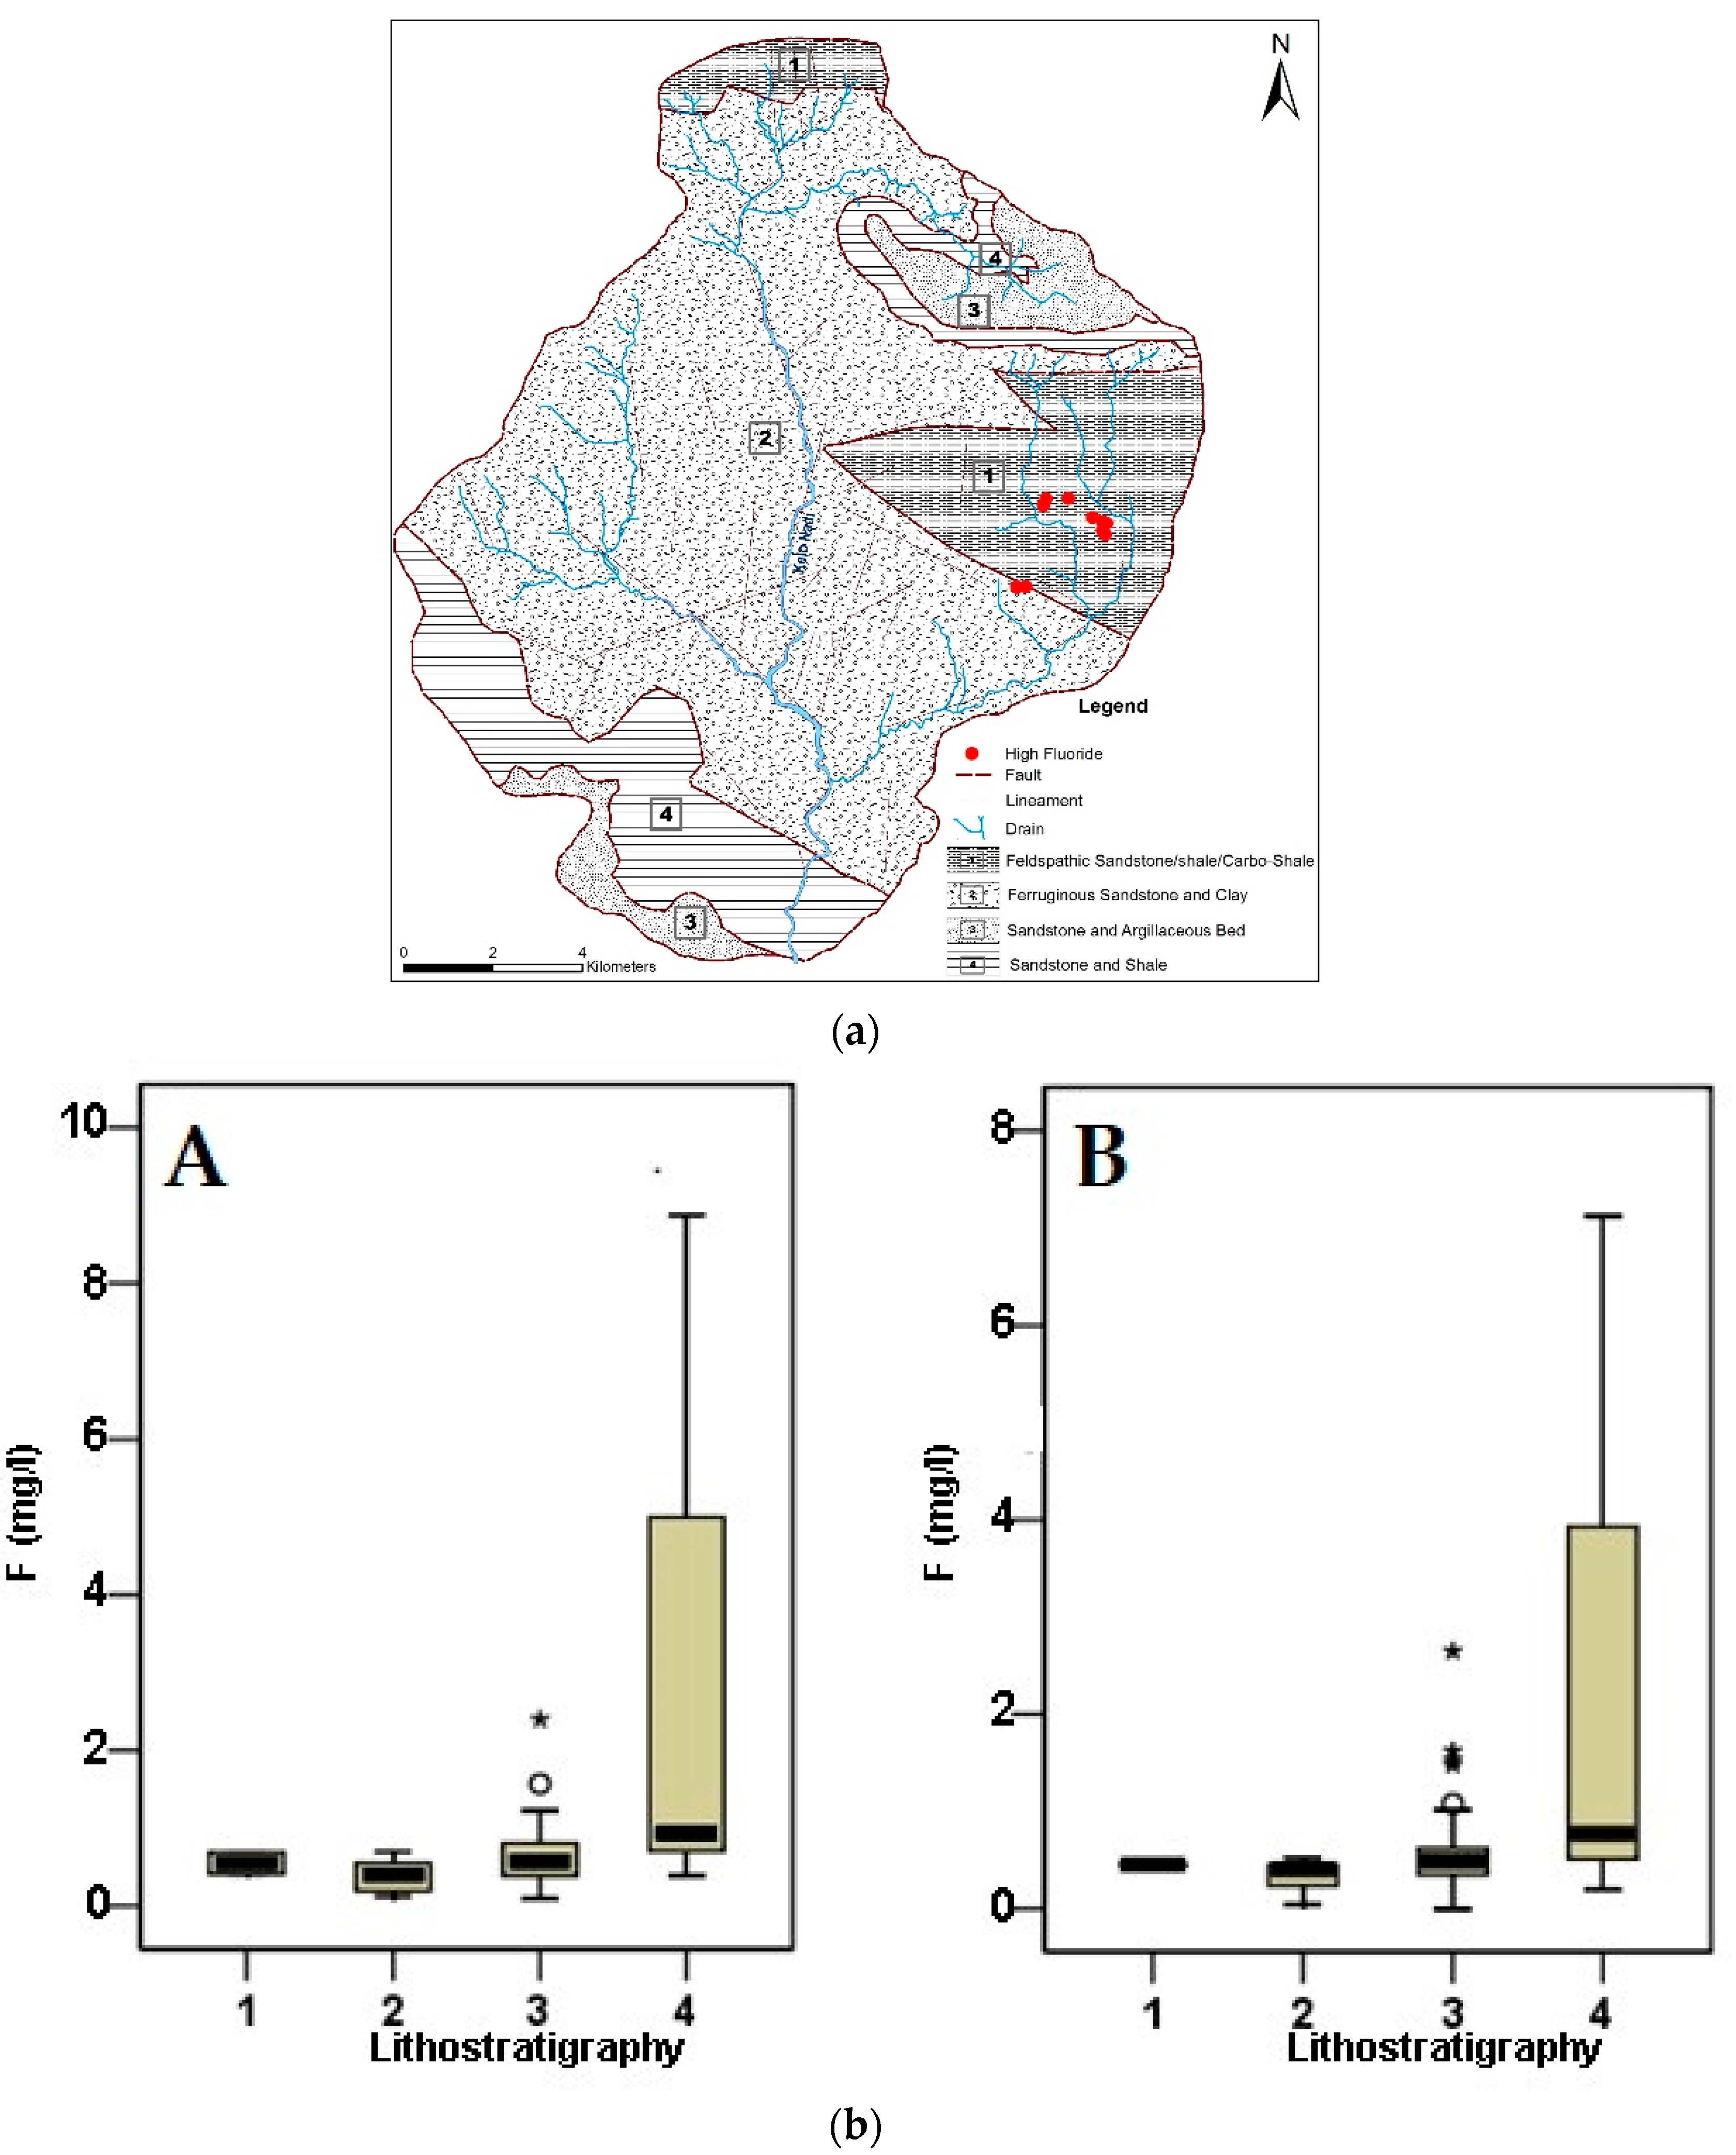
2.1. Study Area
2.2. Materials and Methods
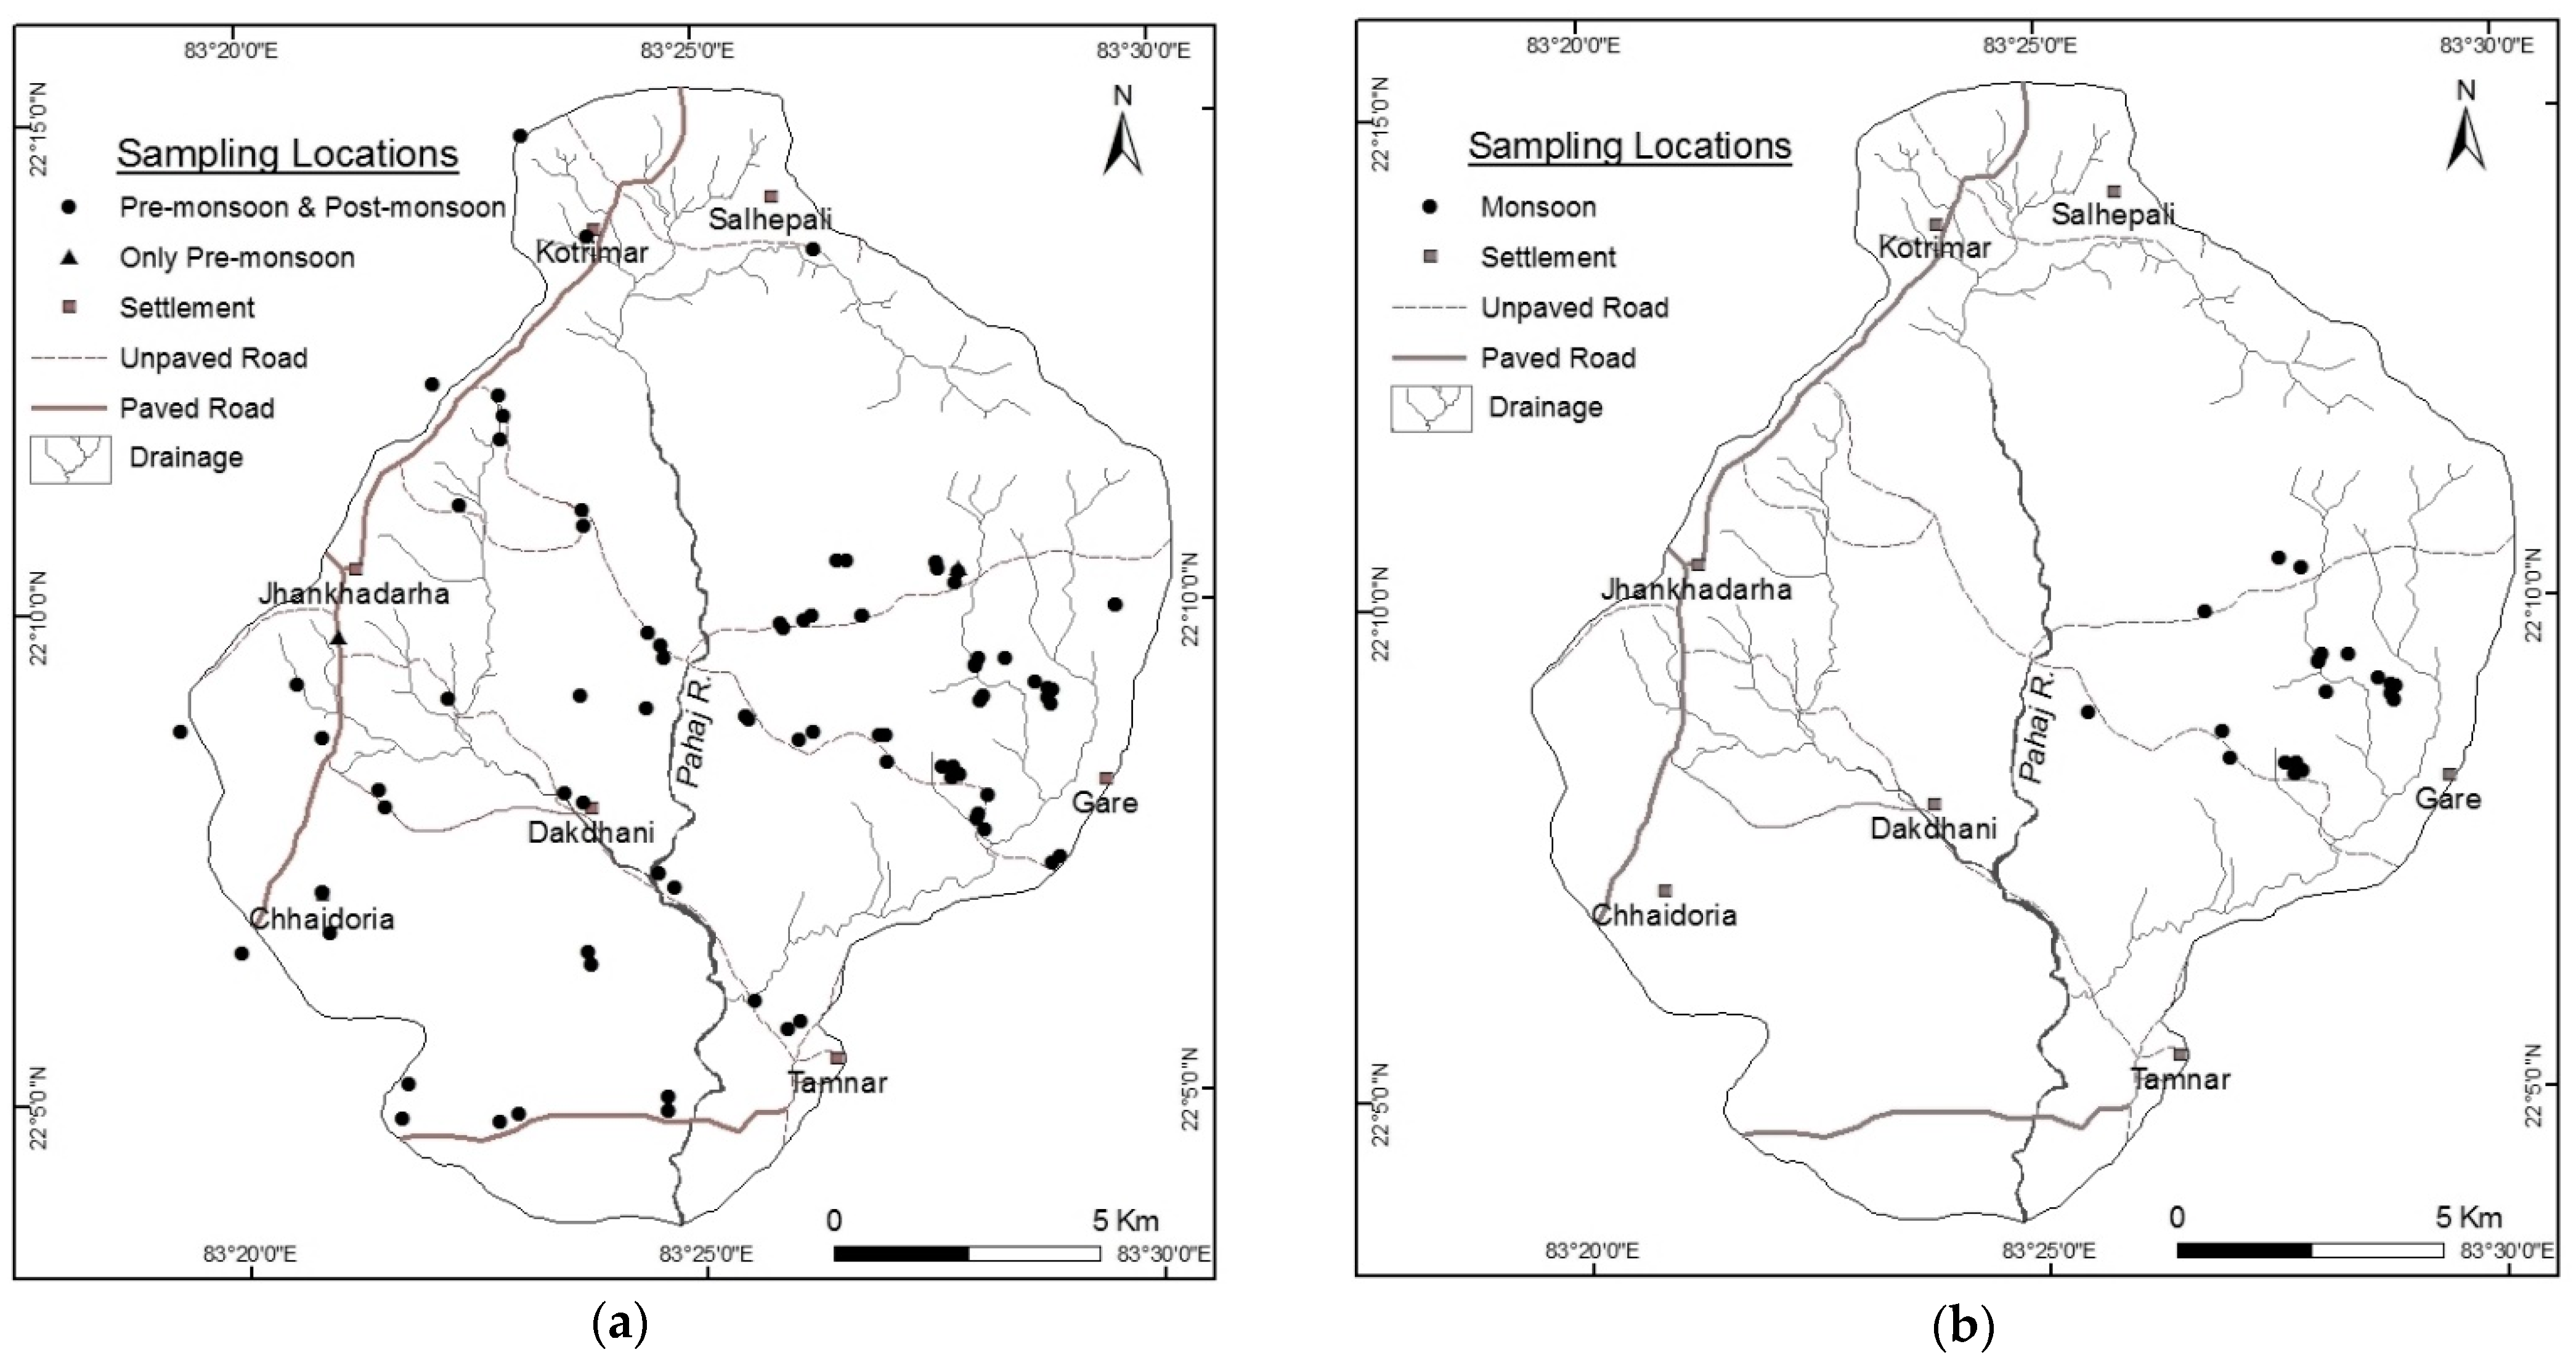
2.2.1. Groundwater Sampling and Analysis
2.2.2. Saturation Index (SI)
2.2.3. Spatial Distribution Map of Fluoride Concentration in Groundwater
2.2.4. Analysis of Geochemical Data
2.2.5. Relationship between Fluoride Concentration and Different Hydrochemical Parameters
3. Results
3.1. Analysis of Hydrochemical Properties of Groundwater
3.2. Analysis of Fluoride Concentration in Groundwater
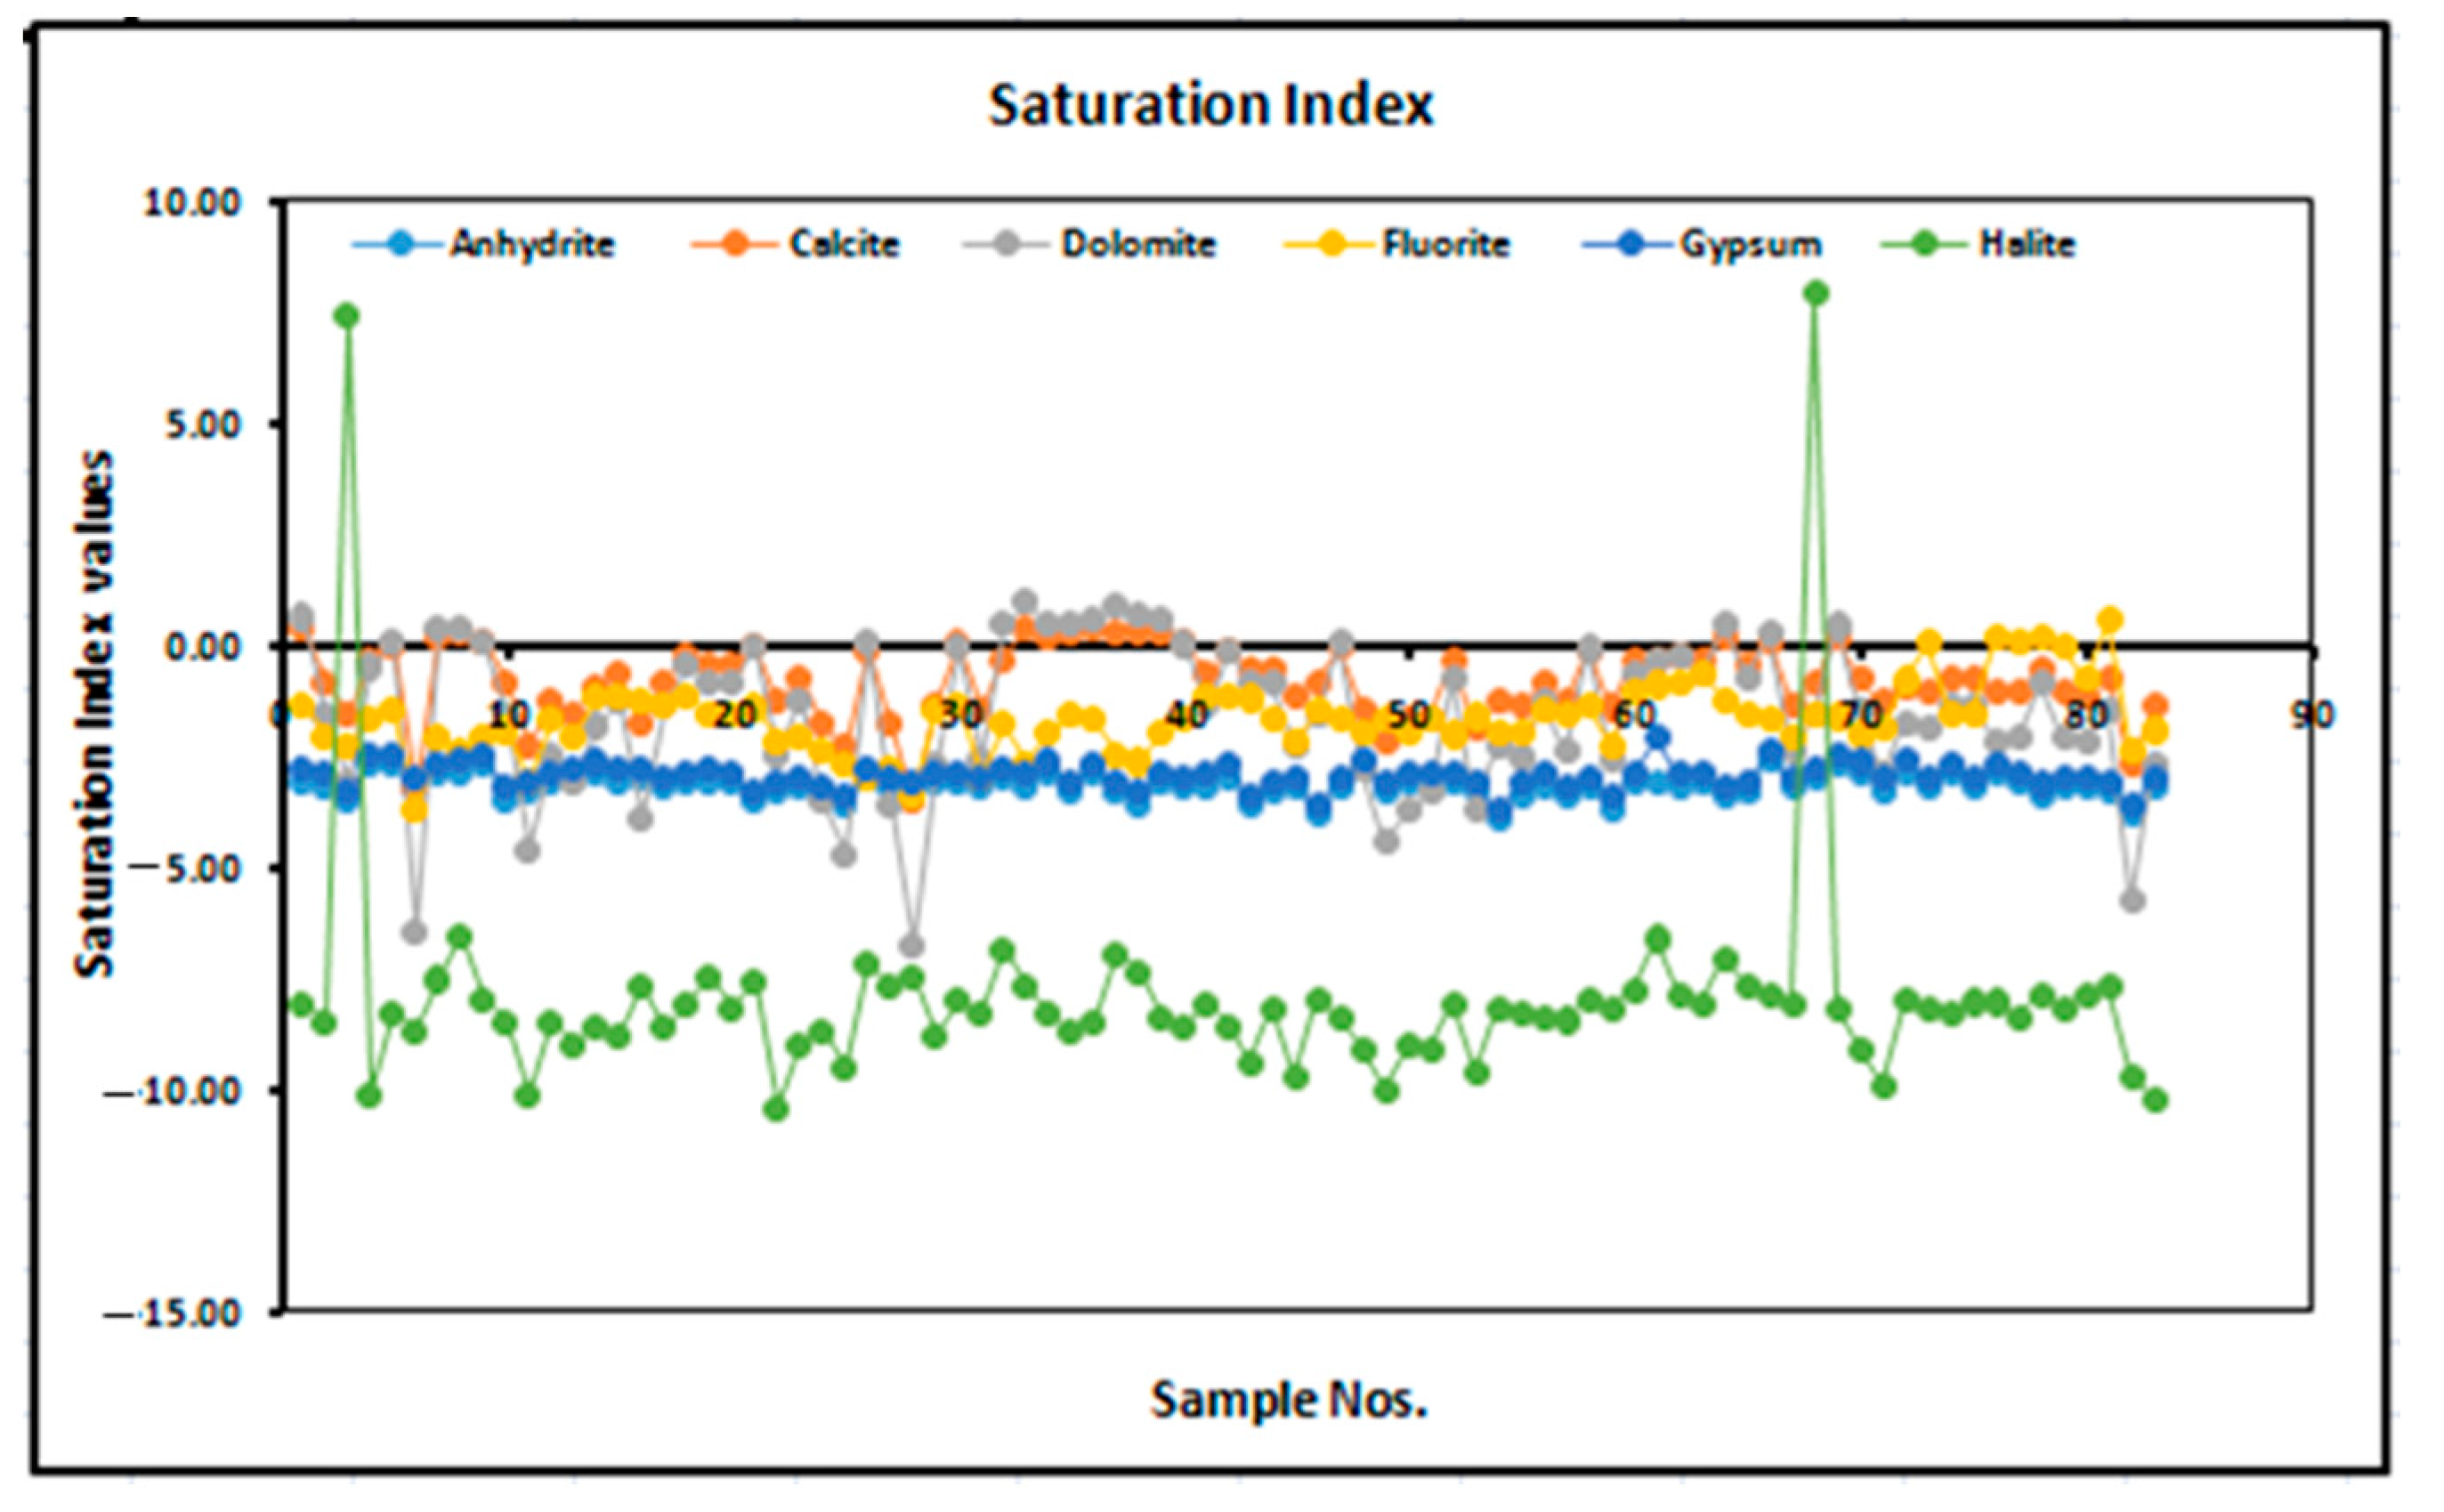
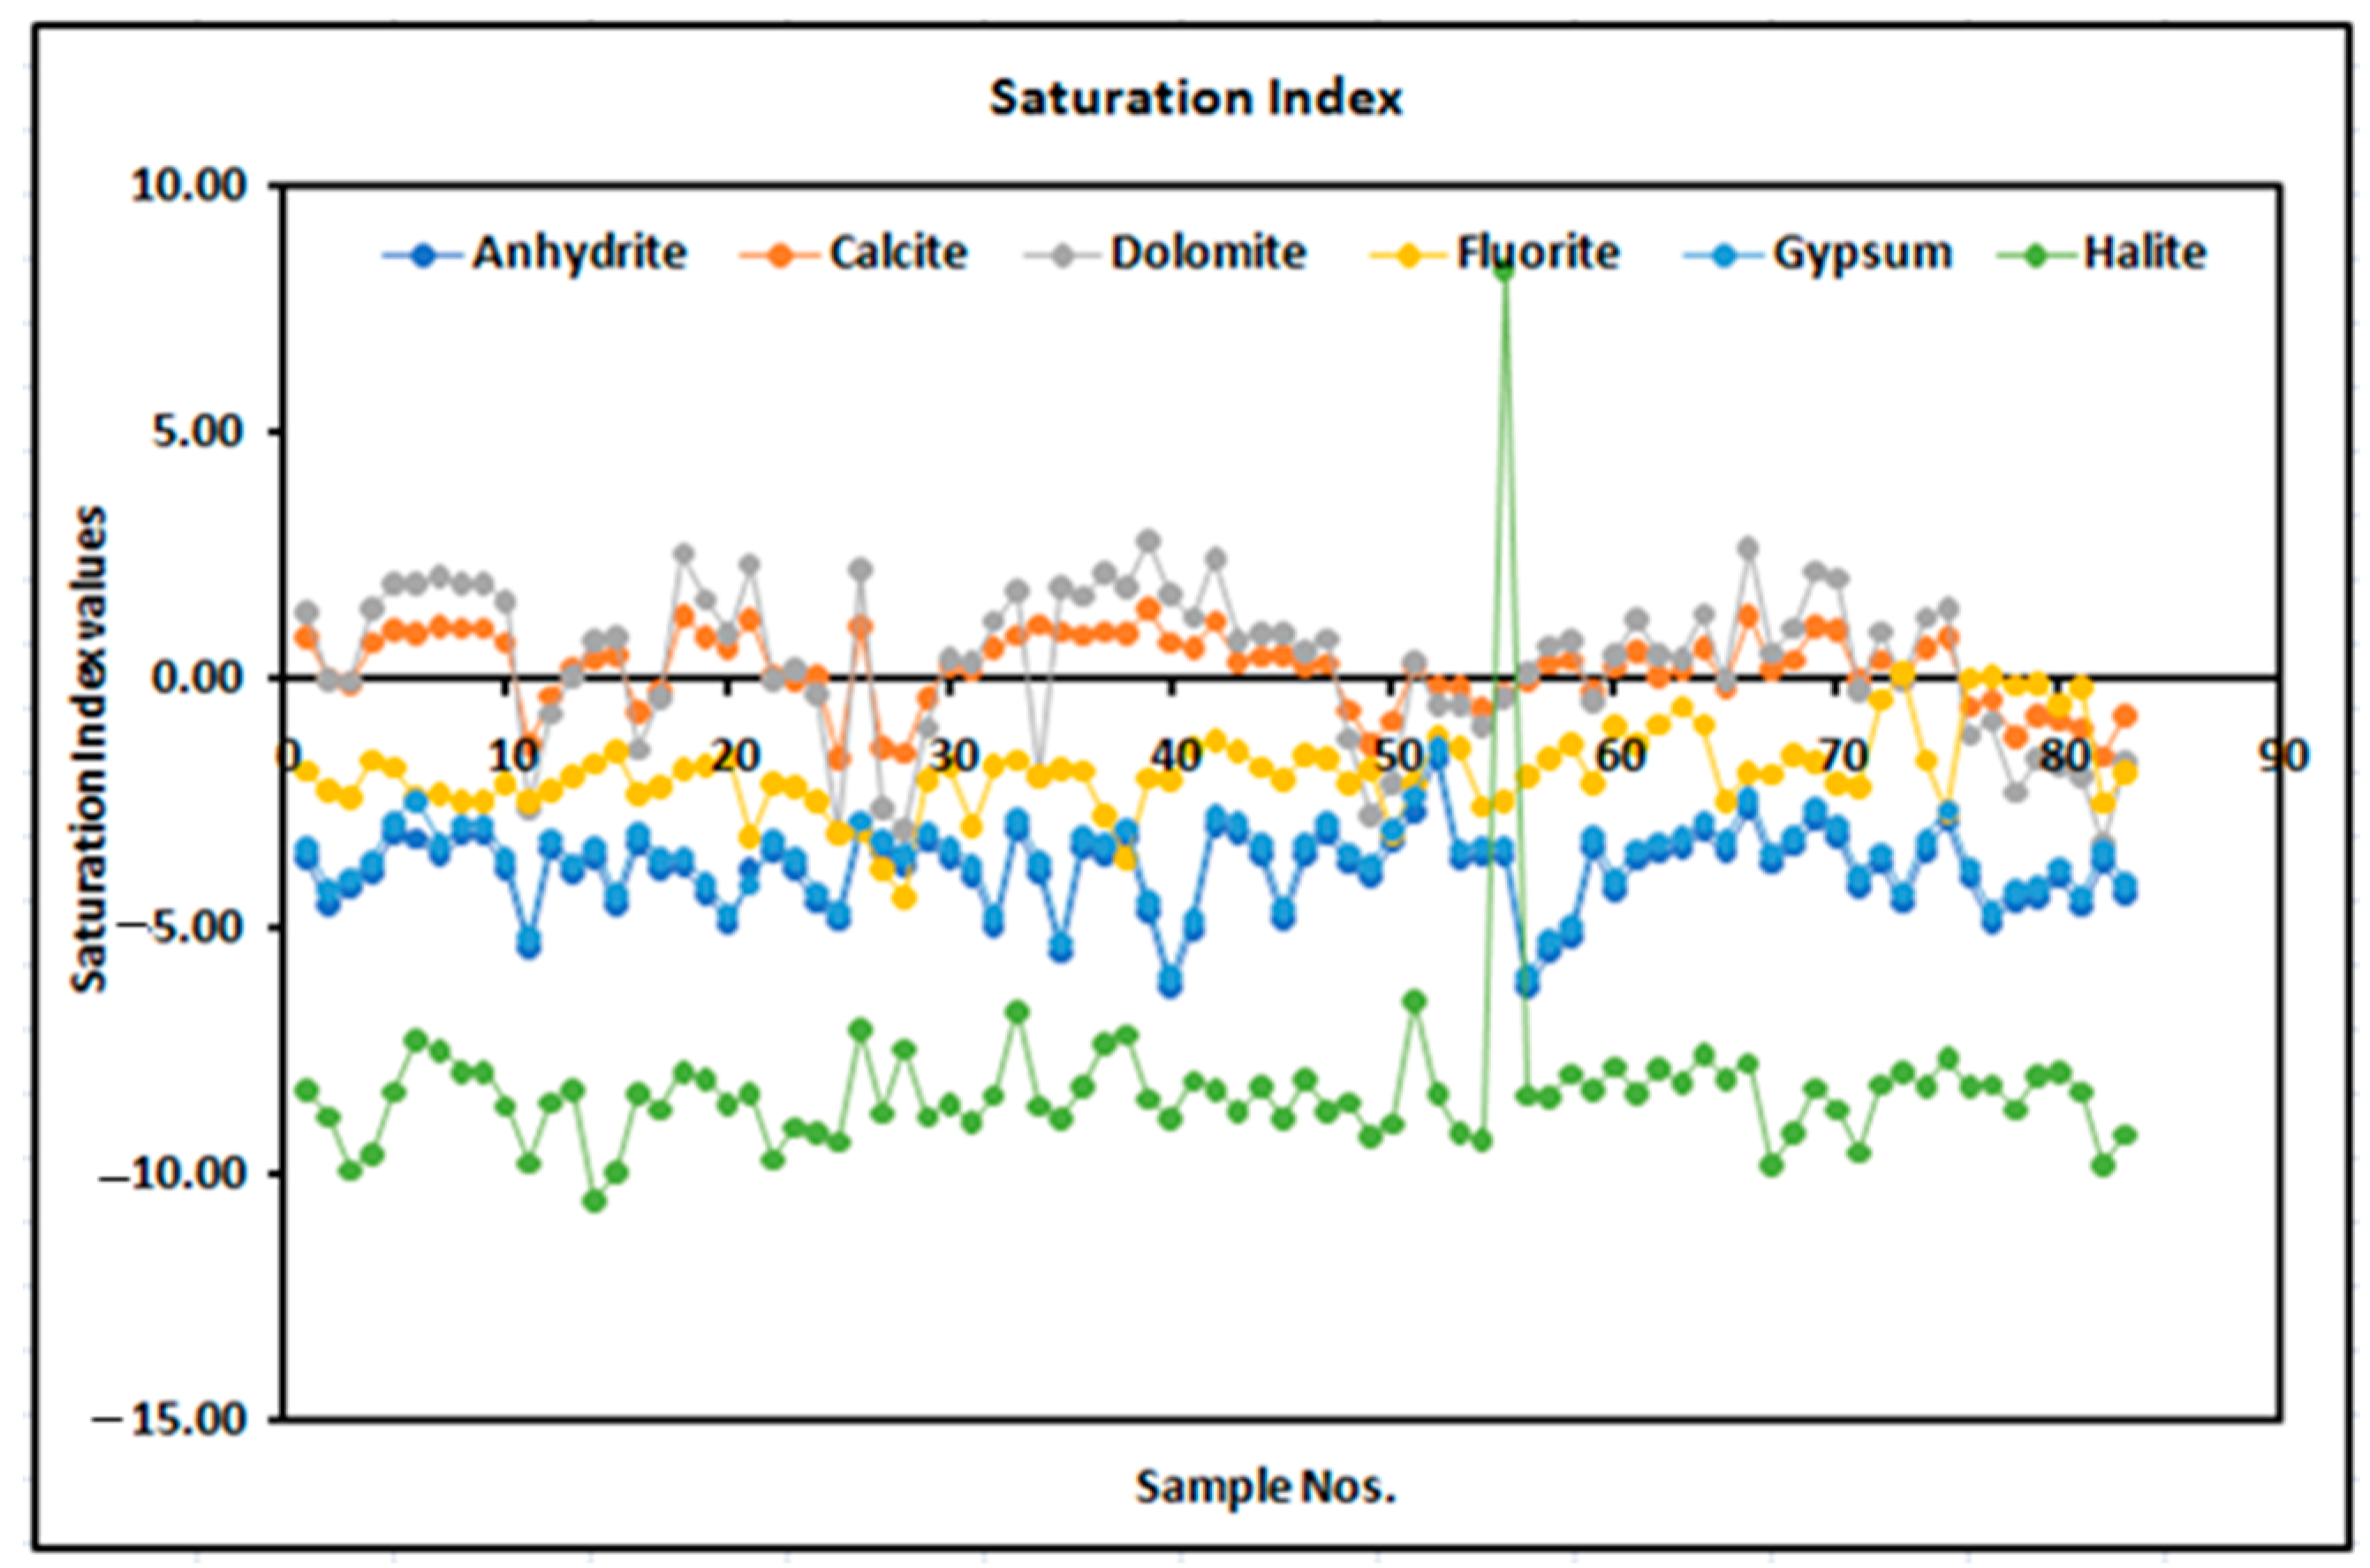
3.3. Saturation Index of Fluoride in Groundwater
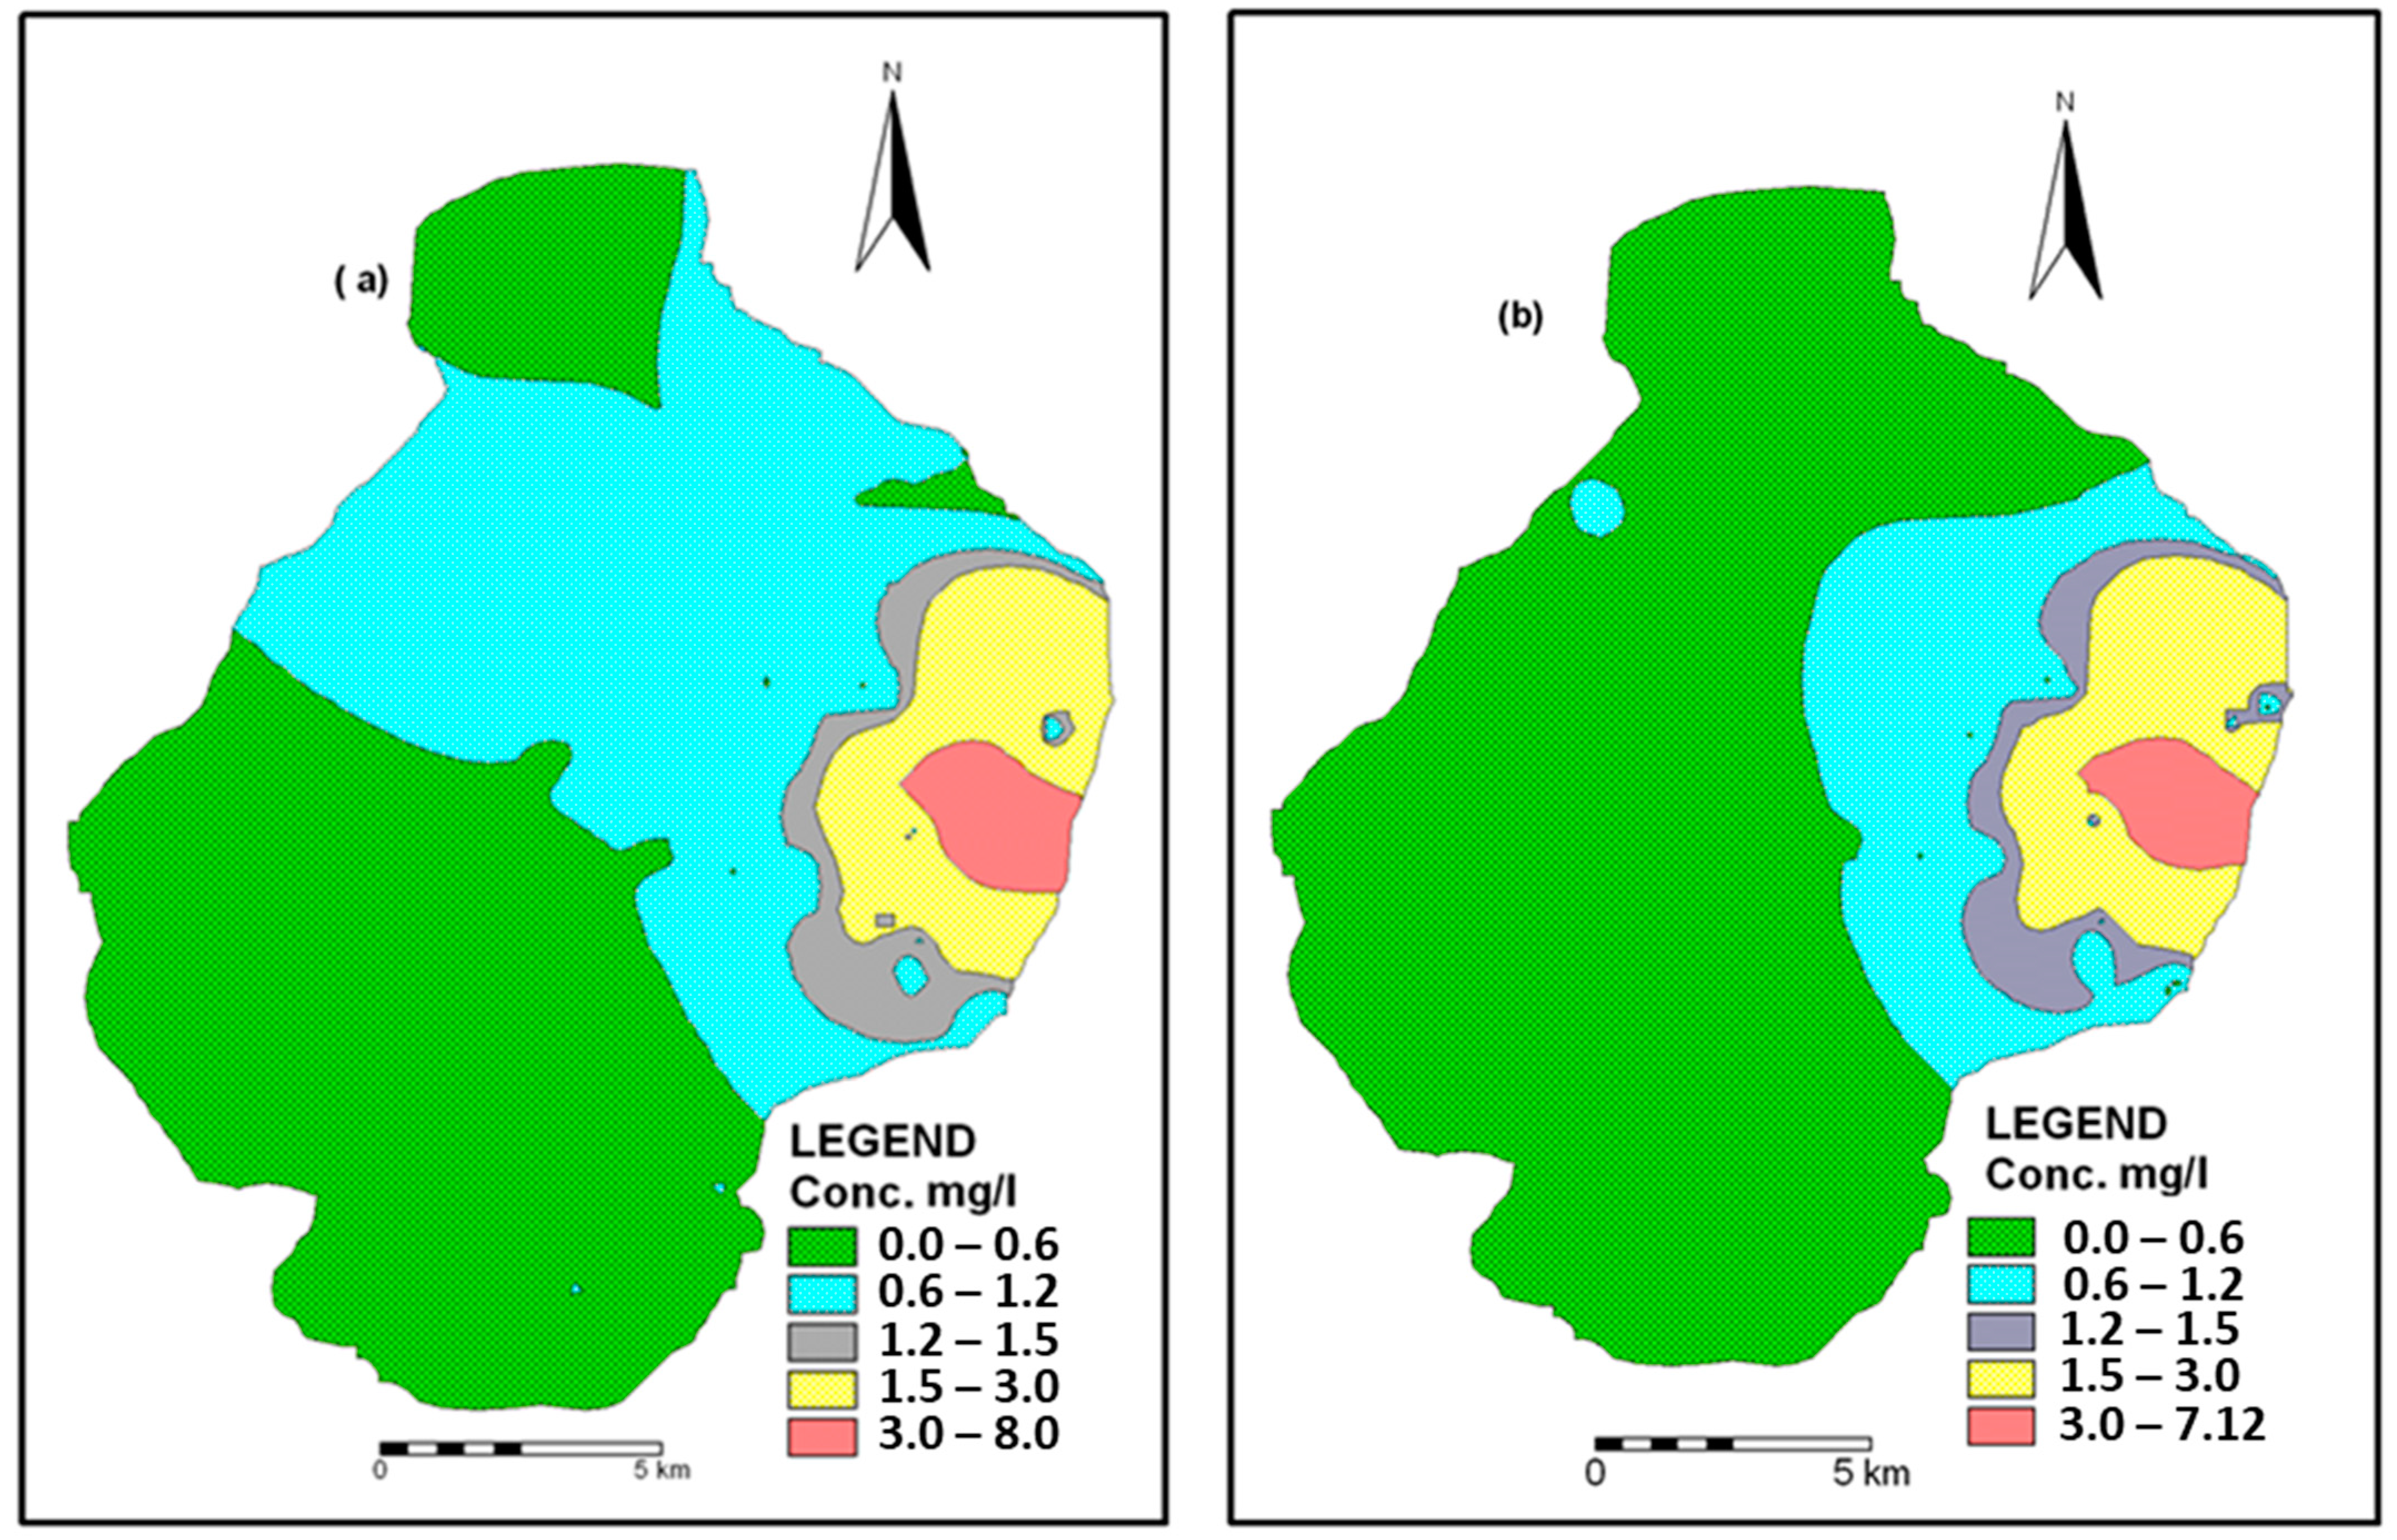
3.4. Spatio-Temporal Distribution of F− in Groundwater
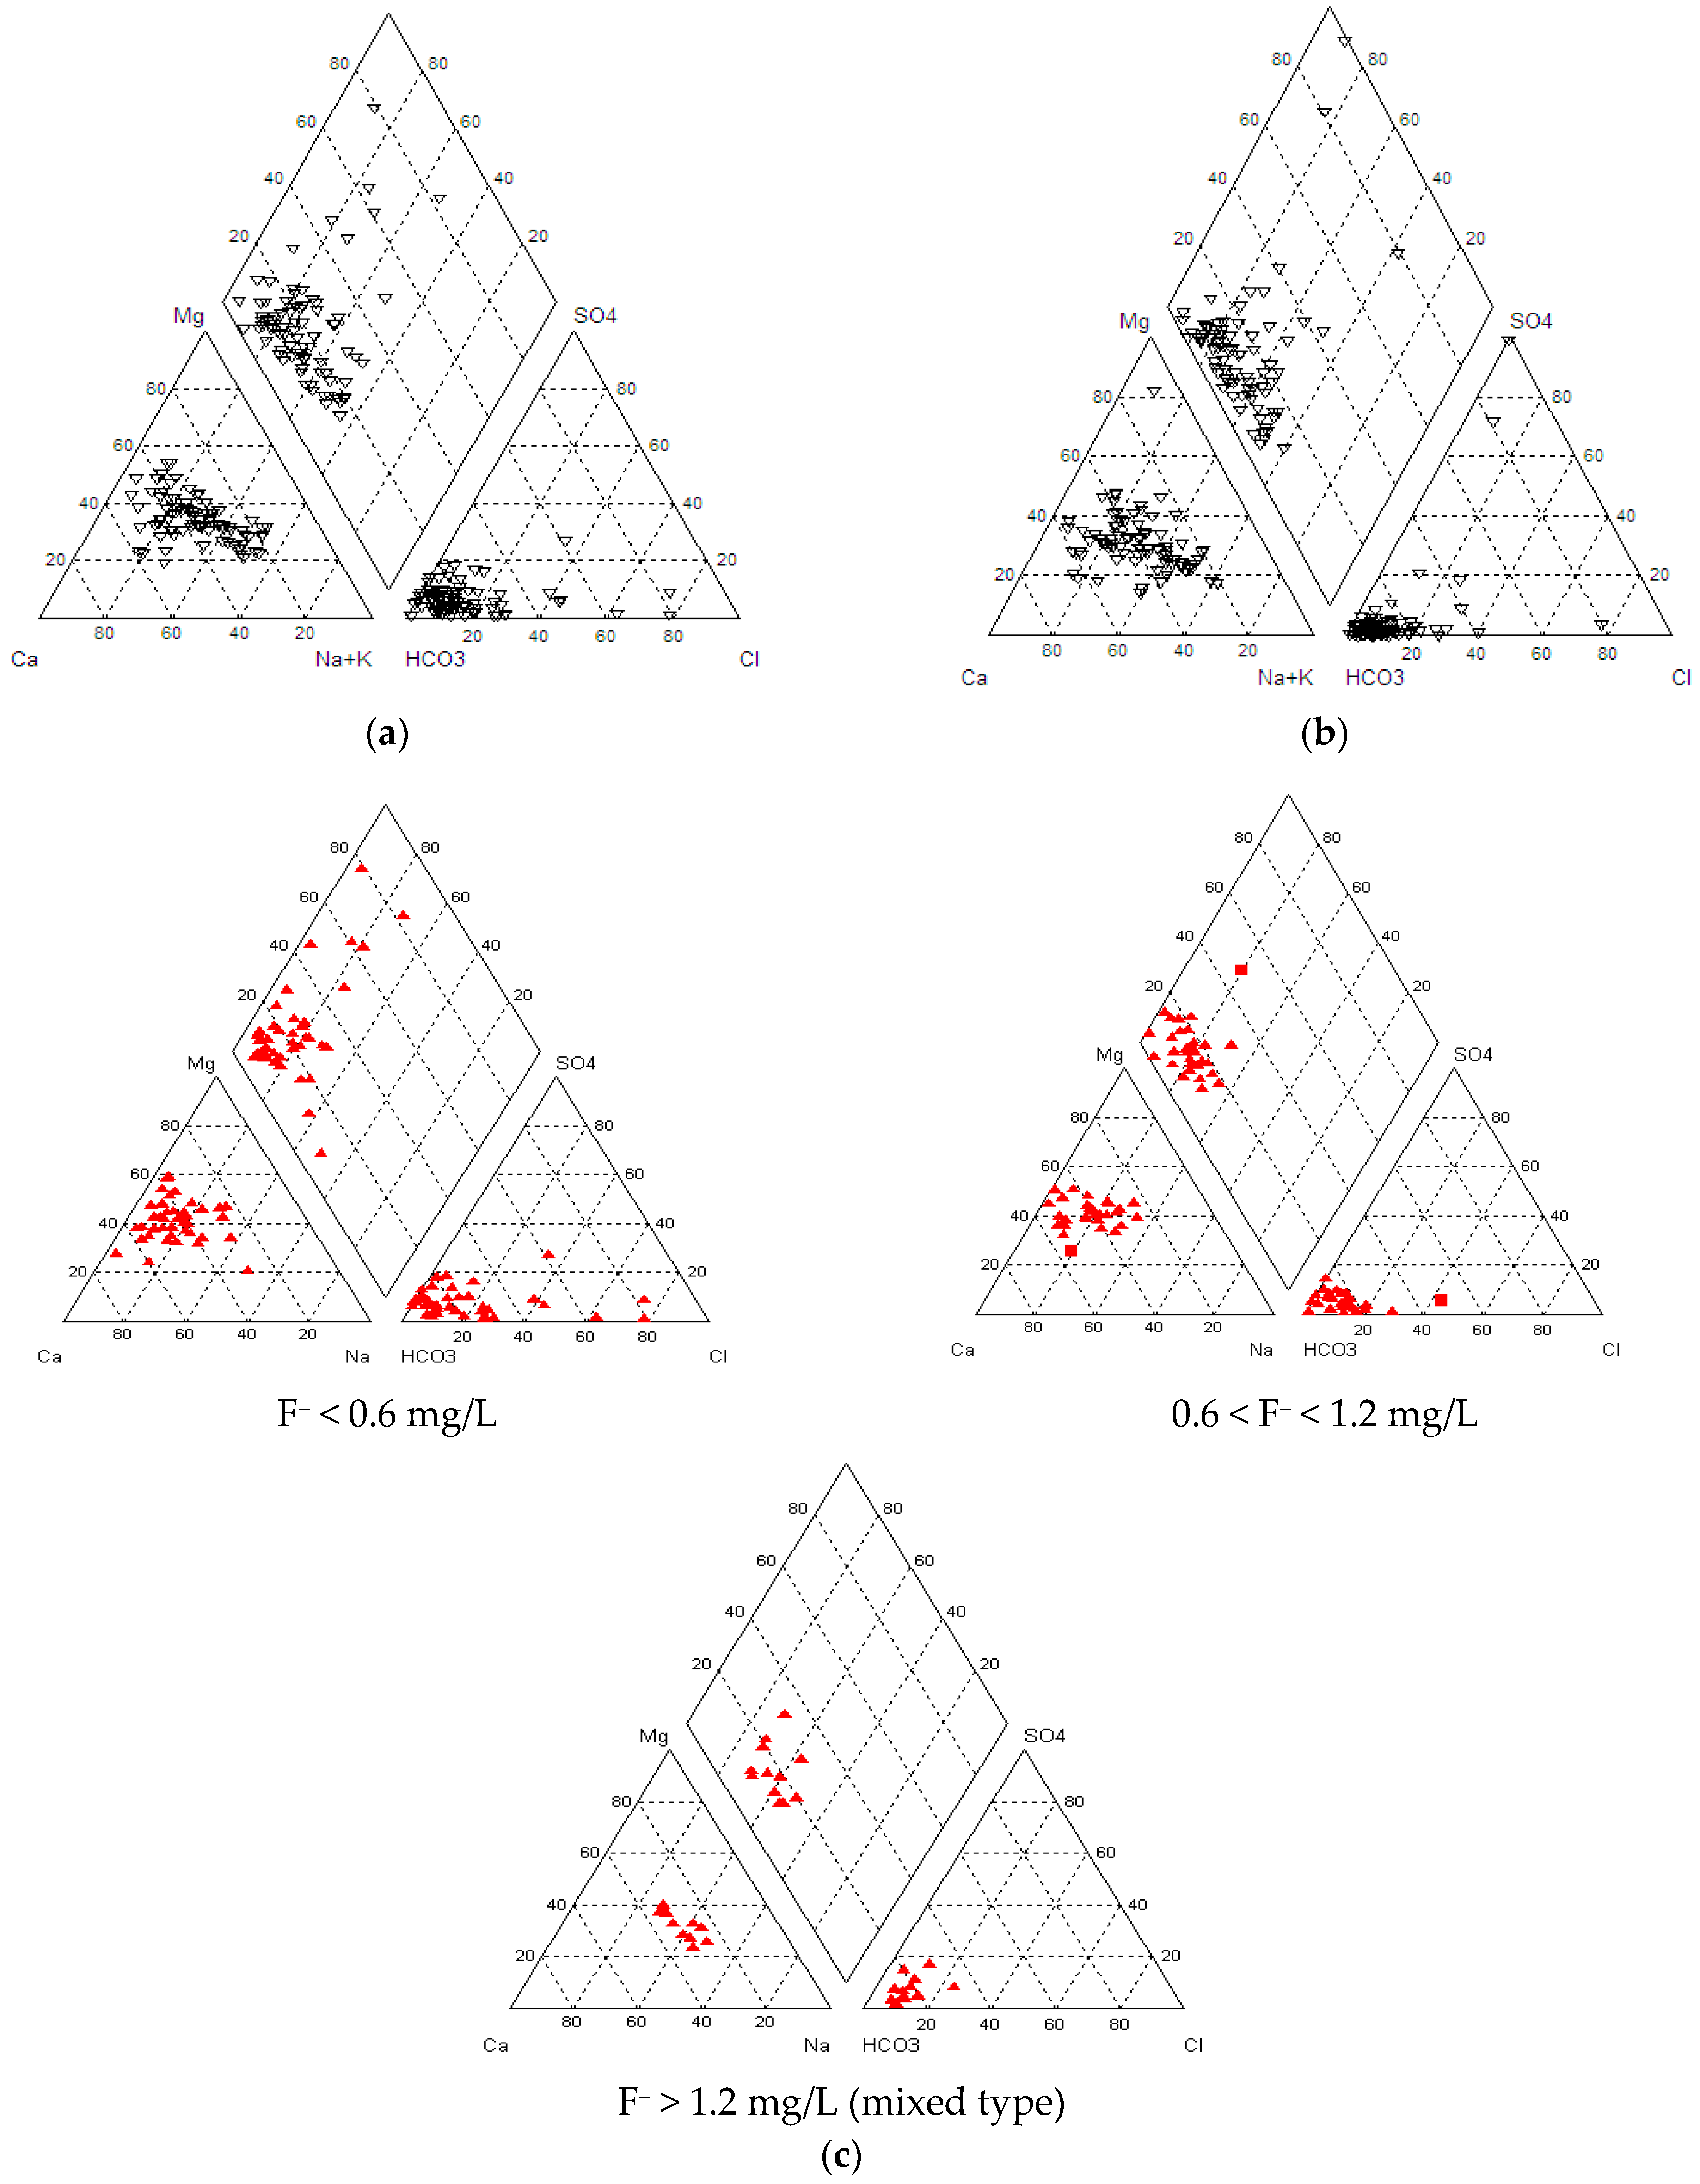
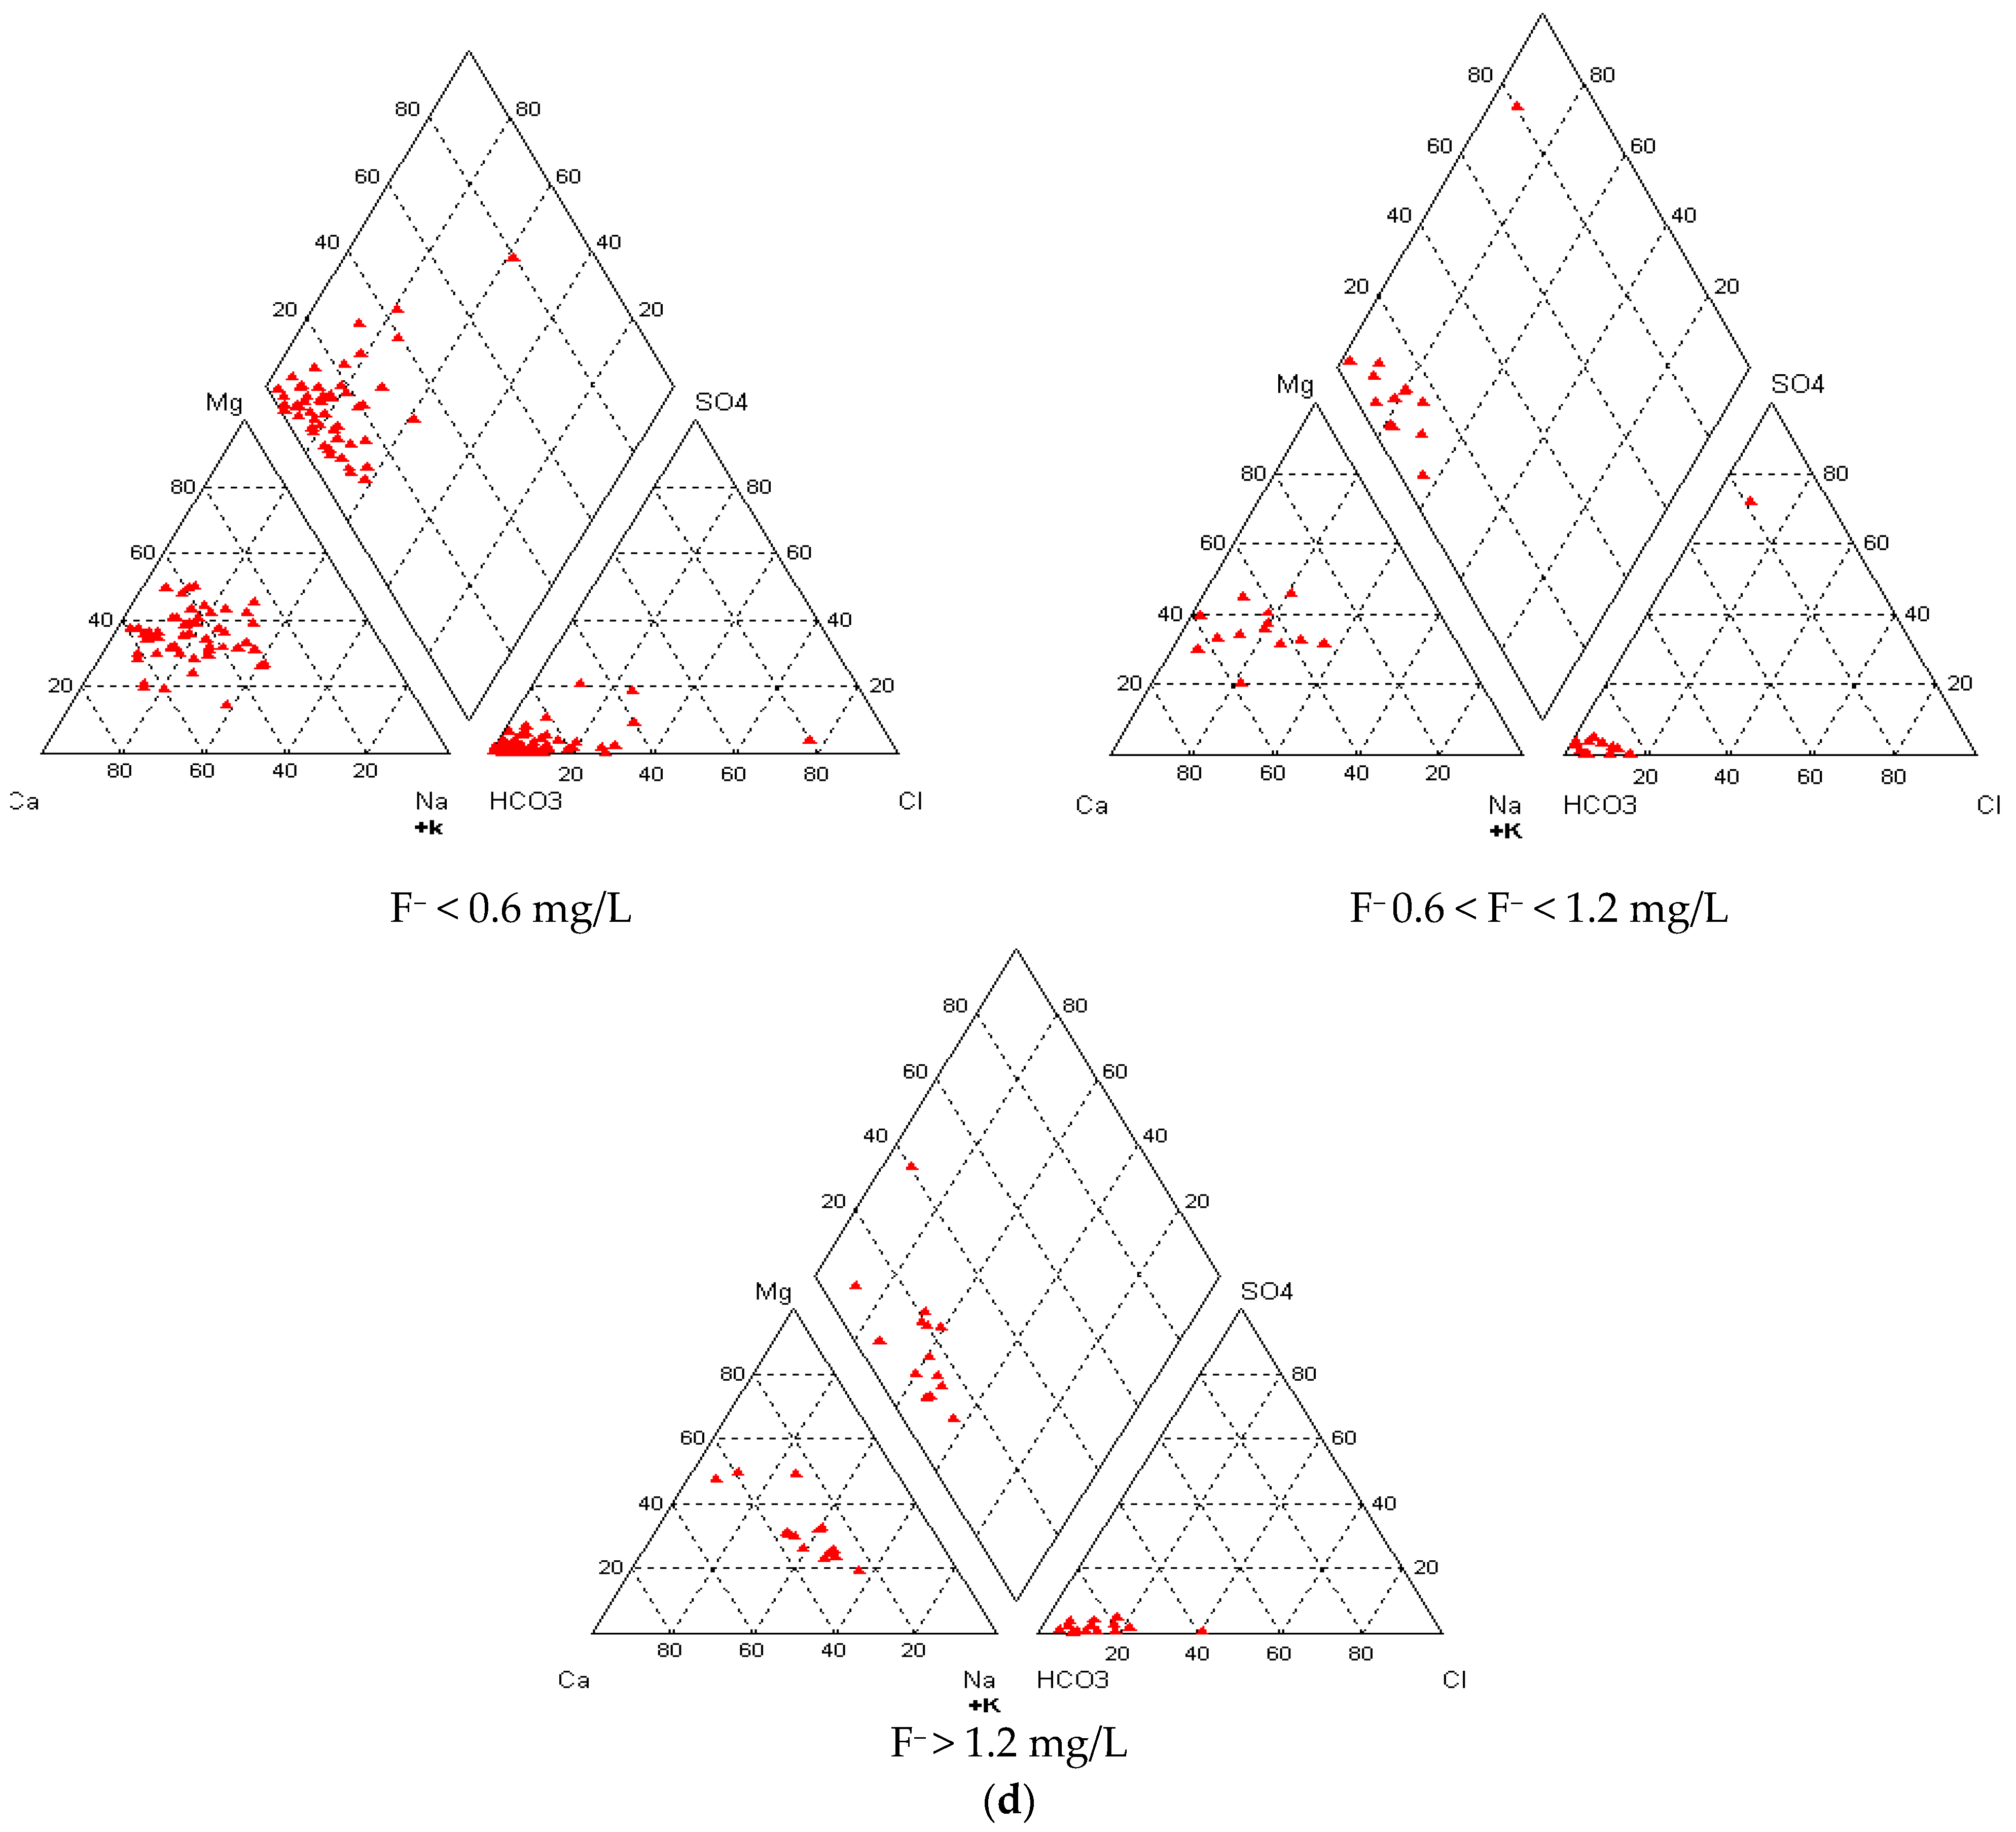
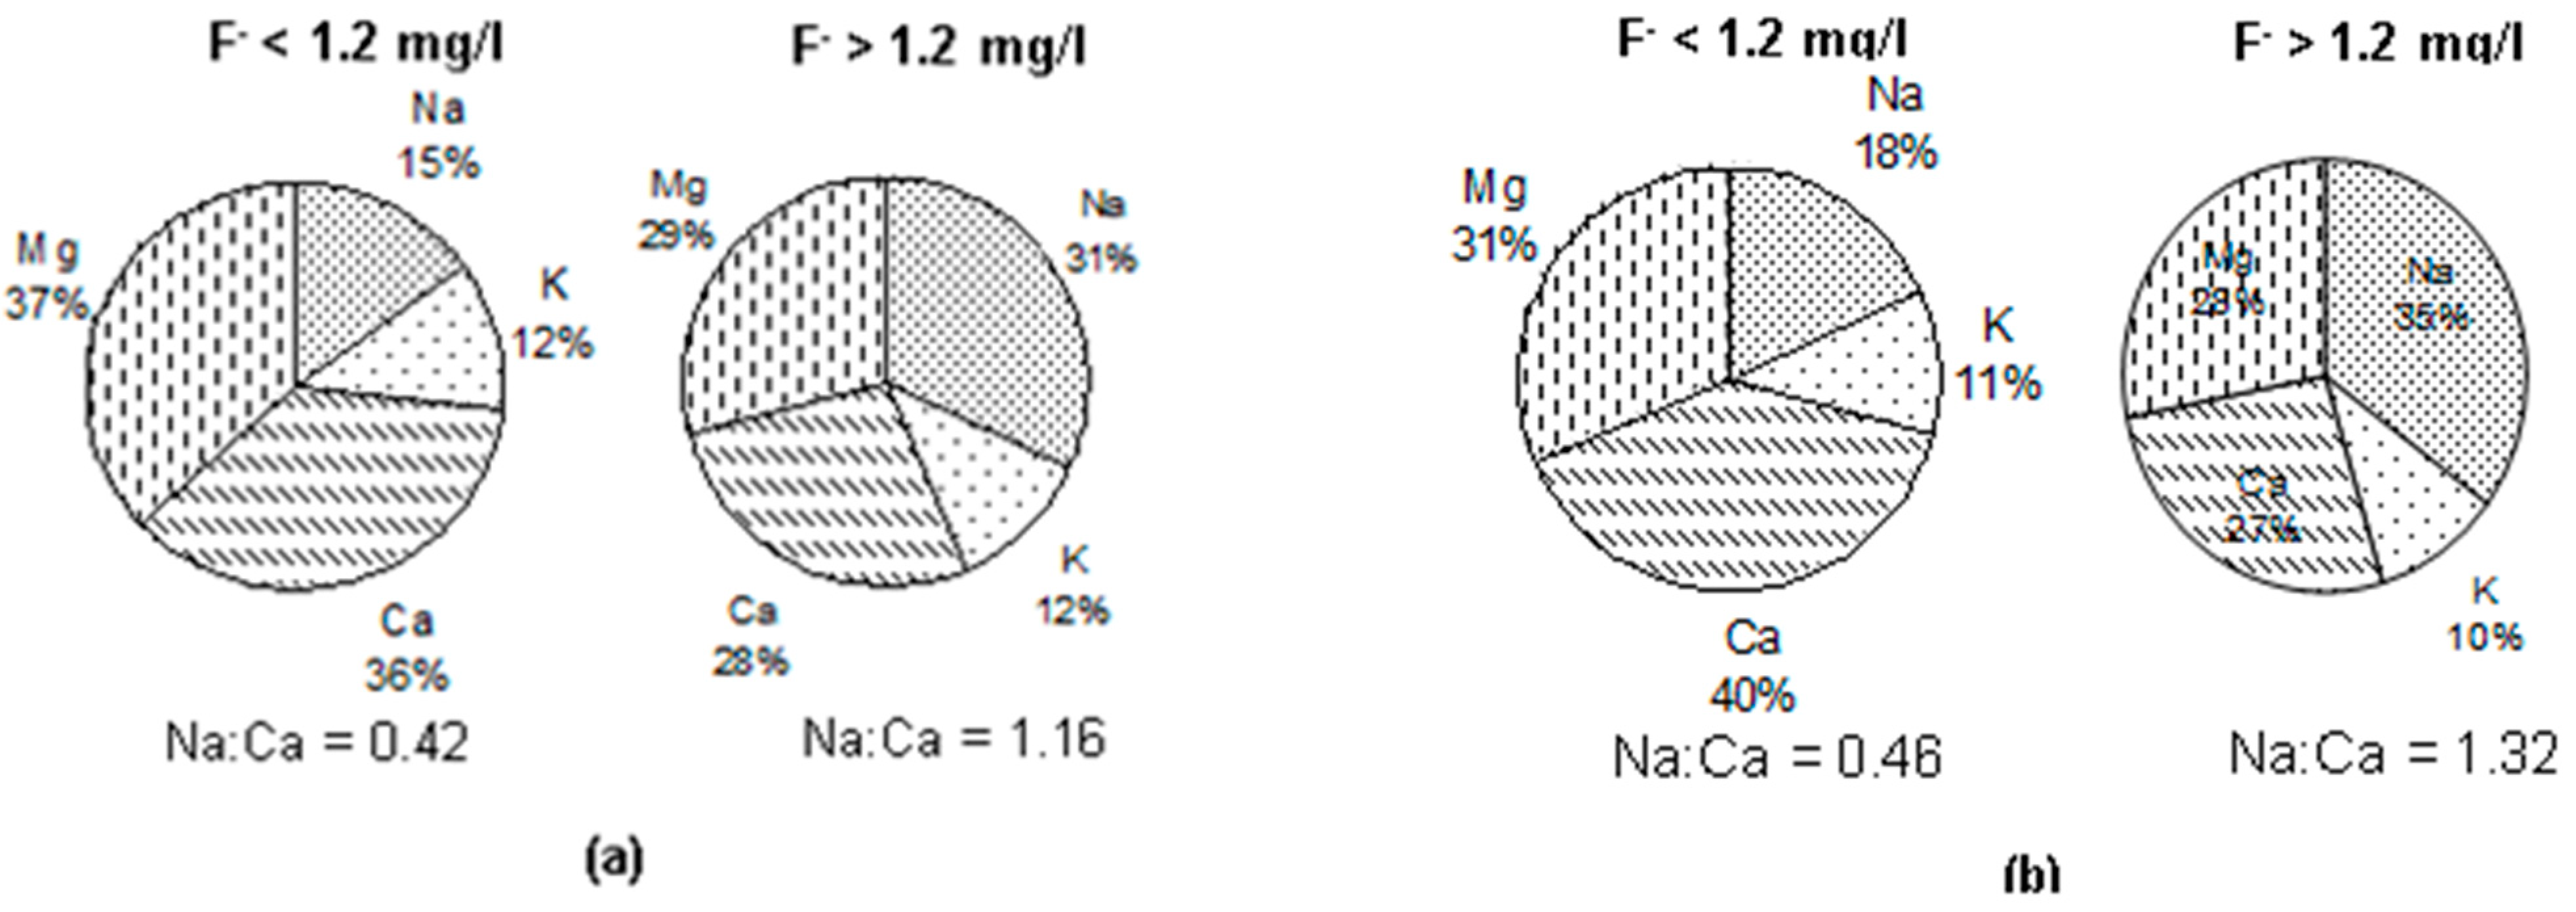
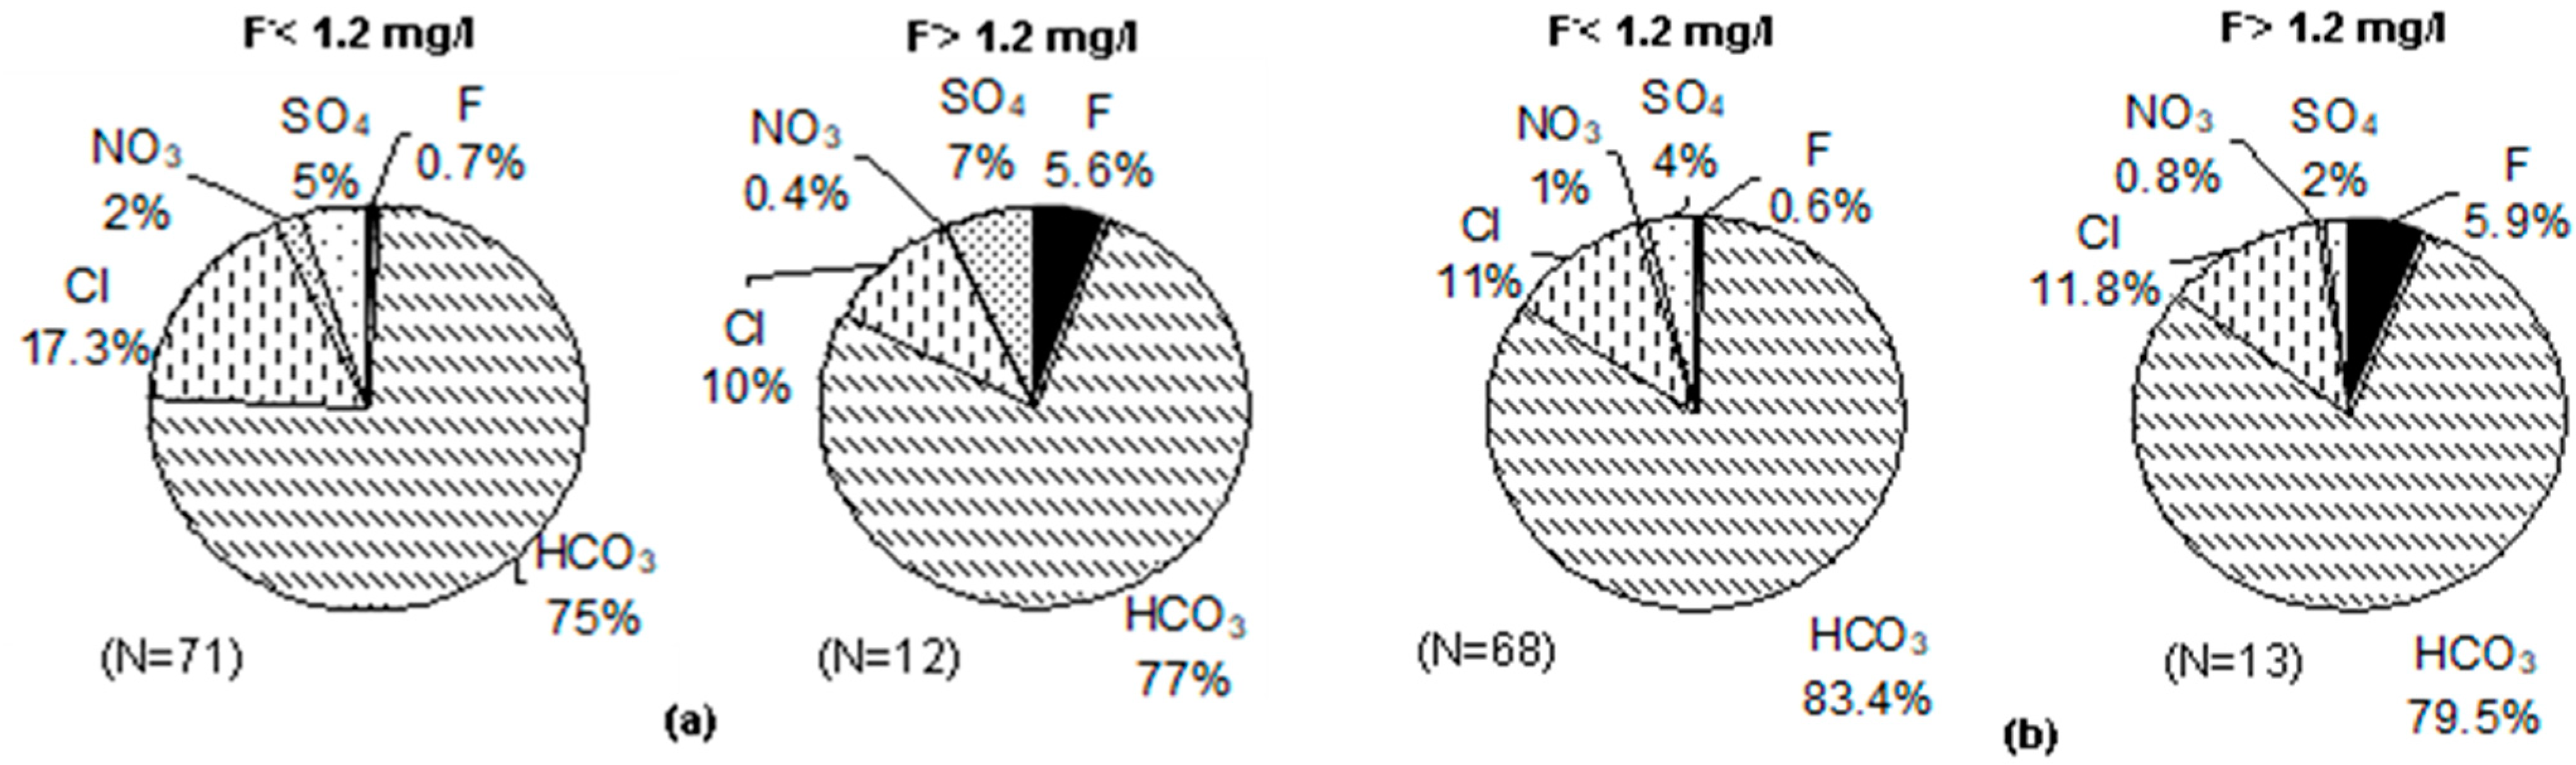
3.5. Groundwater Types vis-à-vis Fluoride in Groundwater
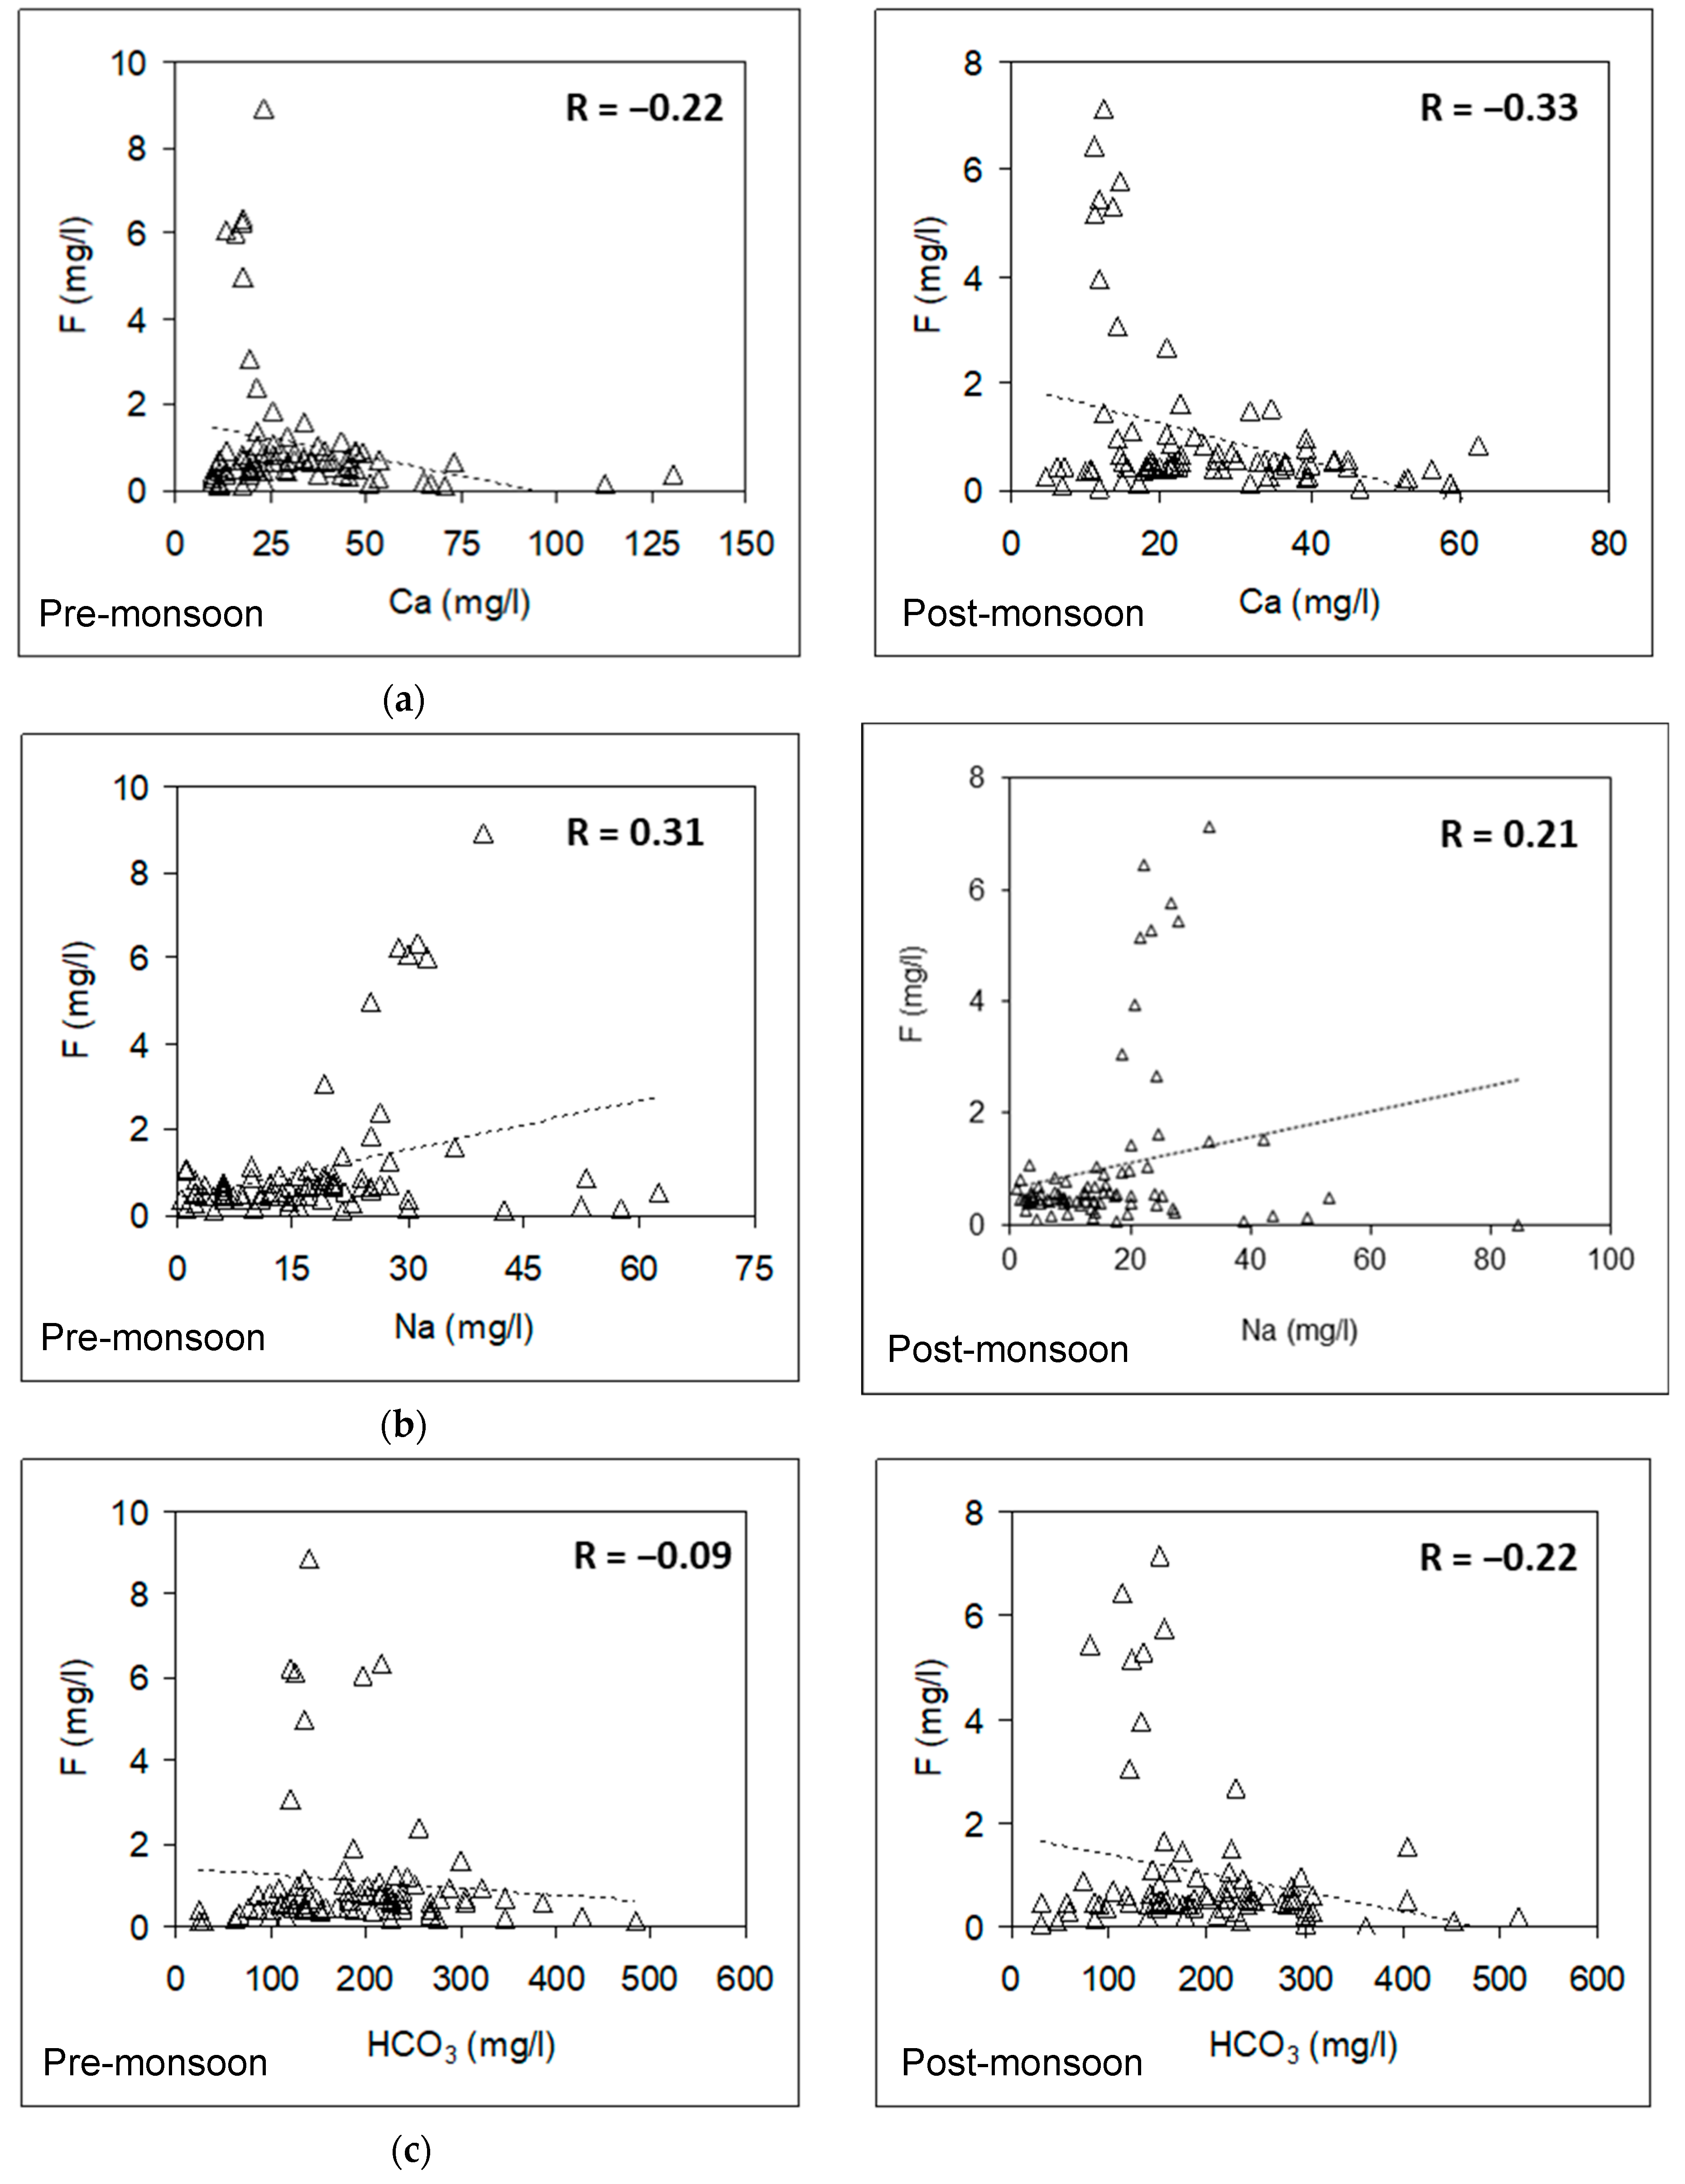
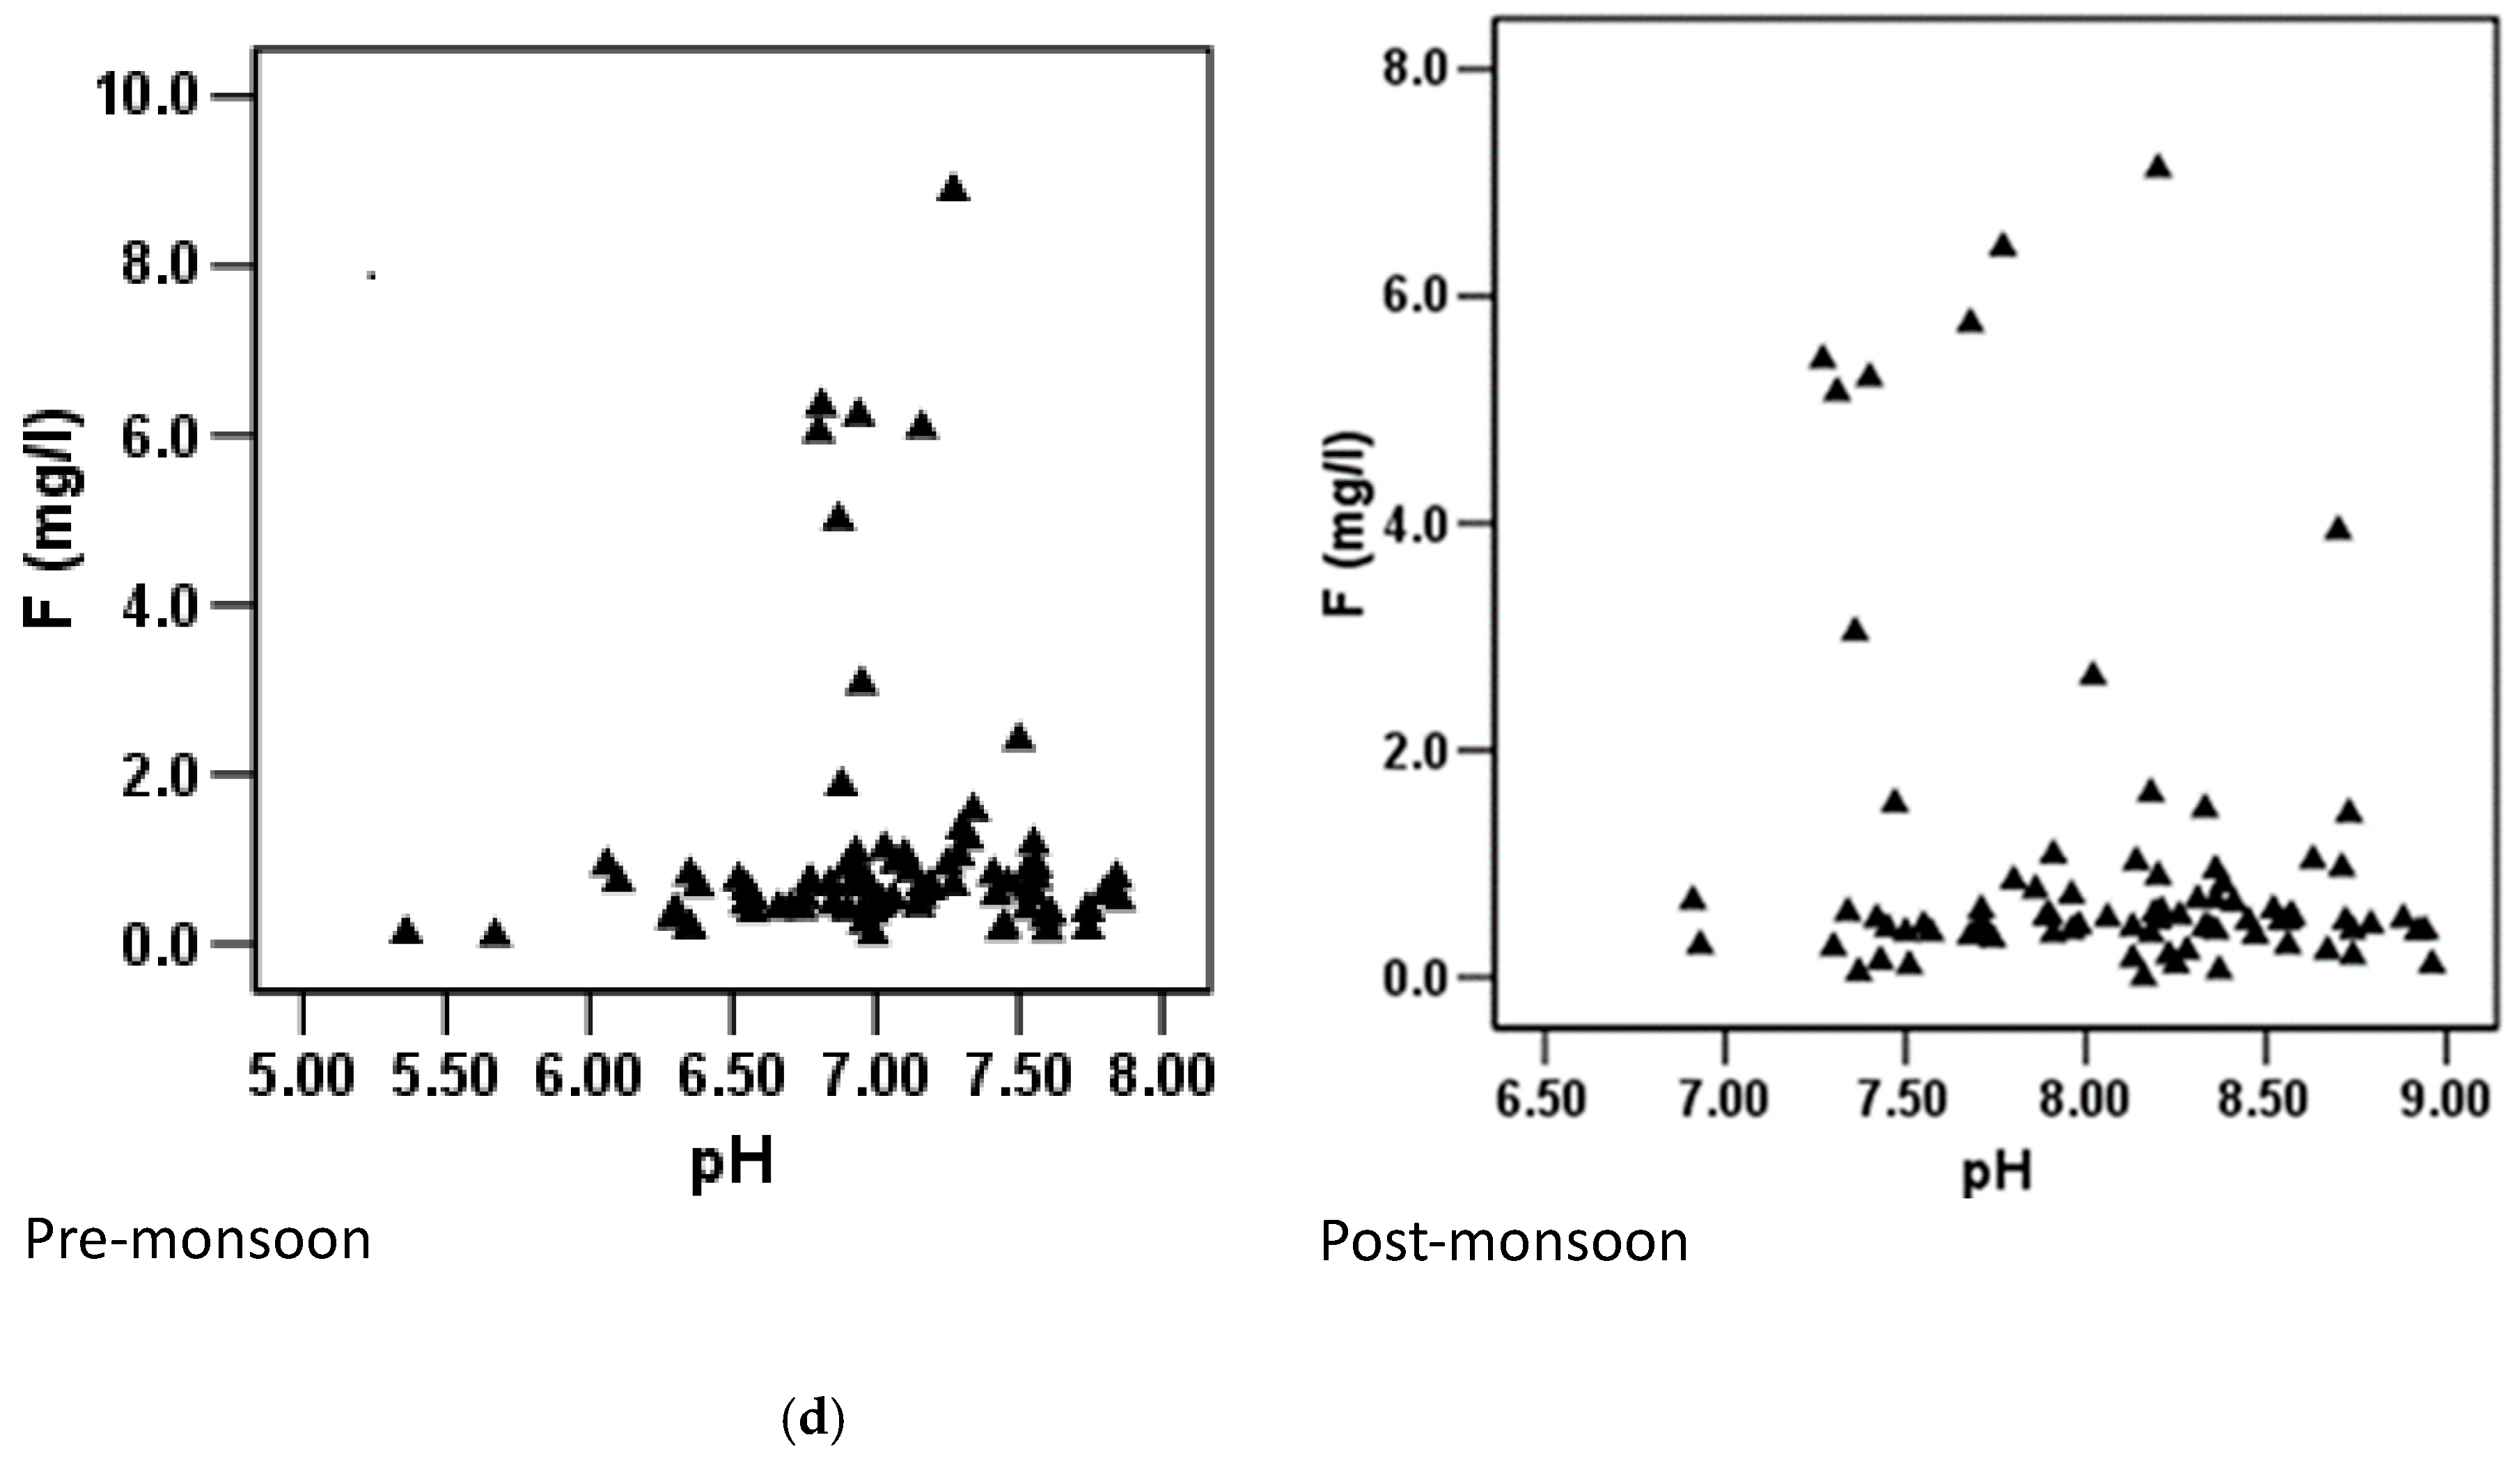
3.6. Relationship between Fluoride and Other Hydrochemical Parameters
3.6.1. Pre-Monsoon Period: Correlation between Fluoride Concentrations and Other Hydrochemical Parameters
3.6.2. Post-Monsoon Period: Correlation between Fluoride Concentrations and Other Hydrochemical Parameters
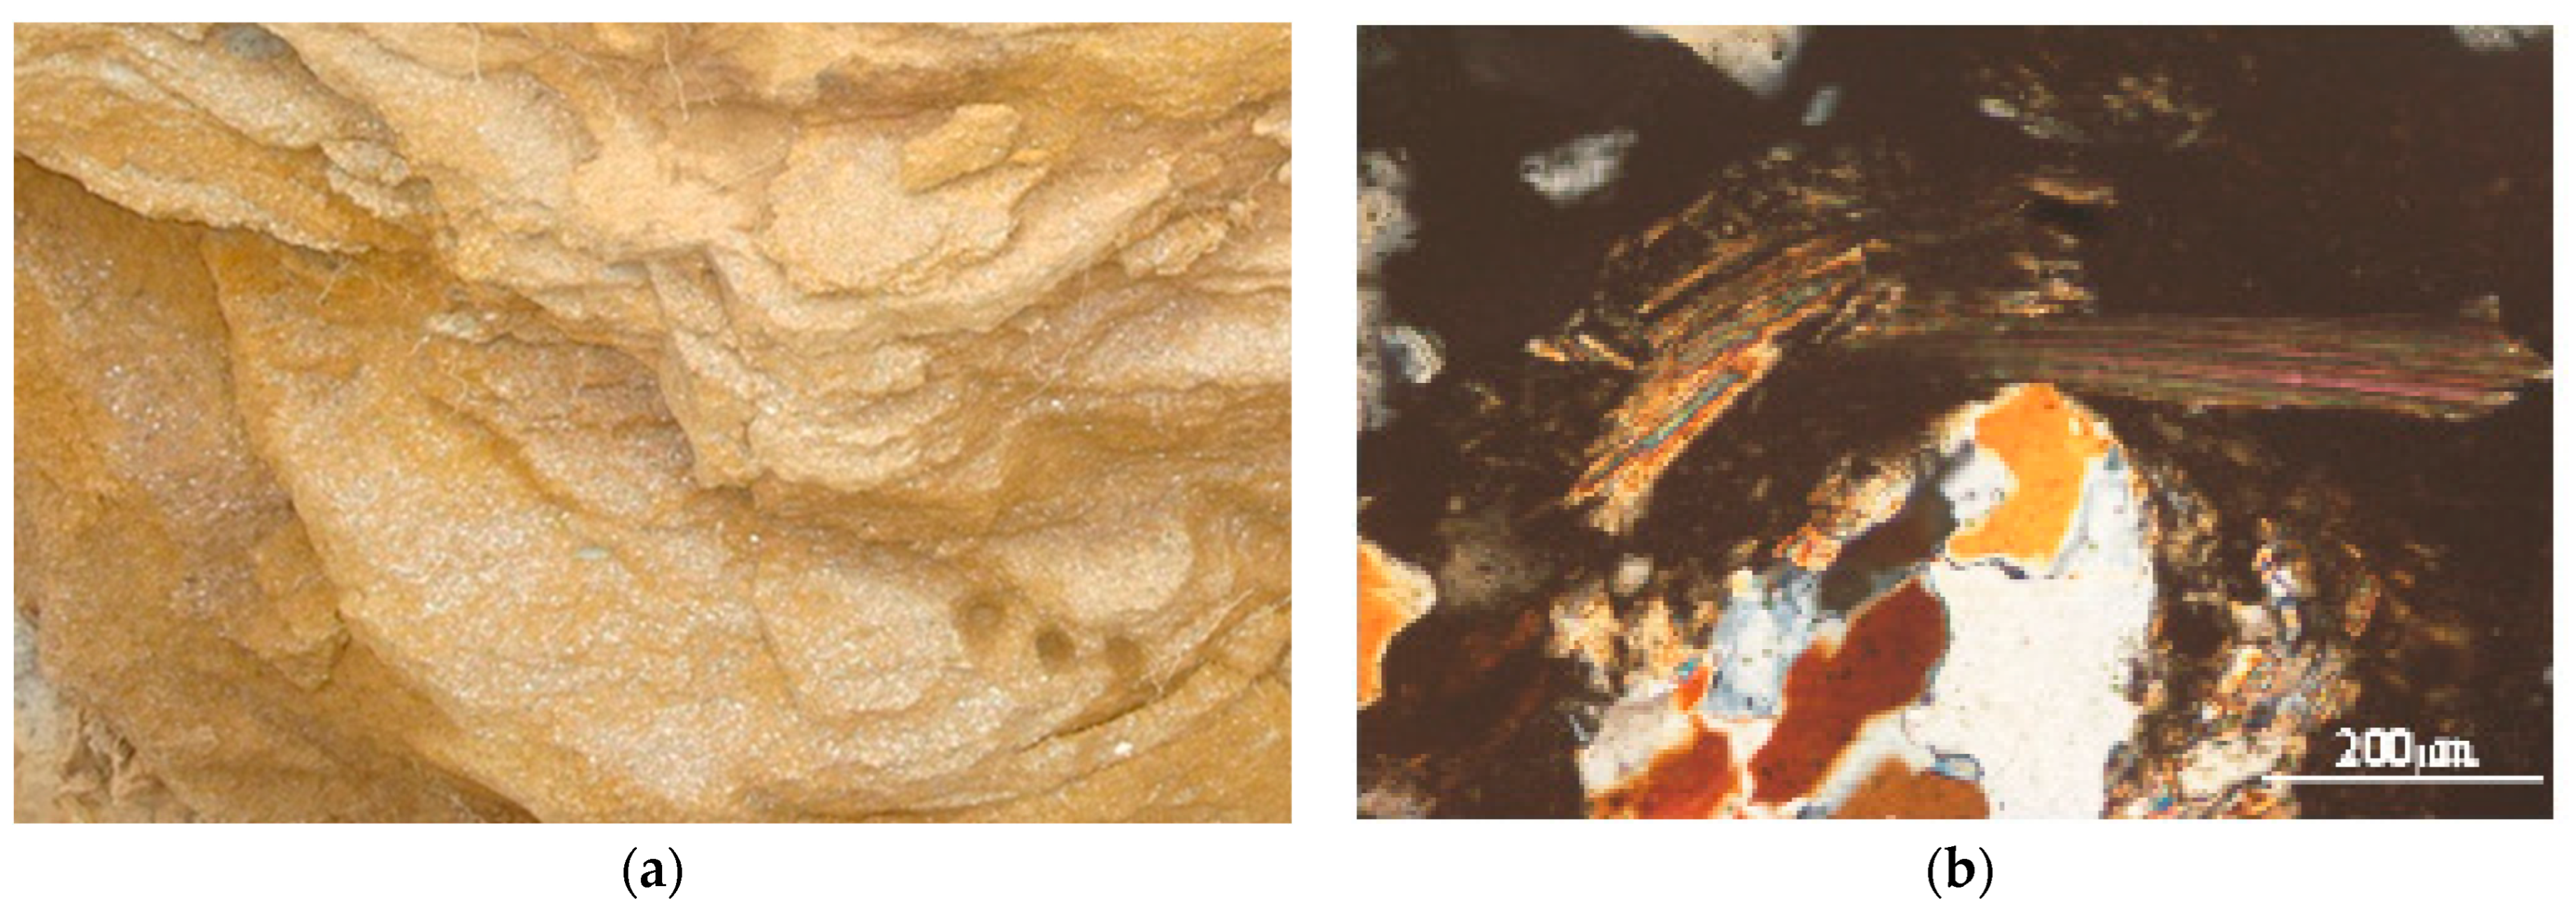
3.7. Geologic Control on Fluoride Distribution in Groundwater
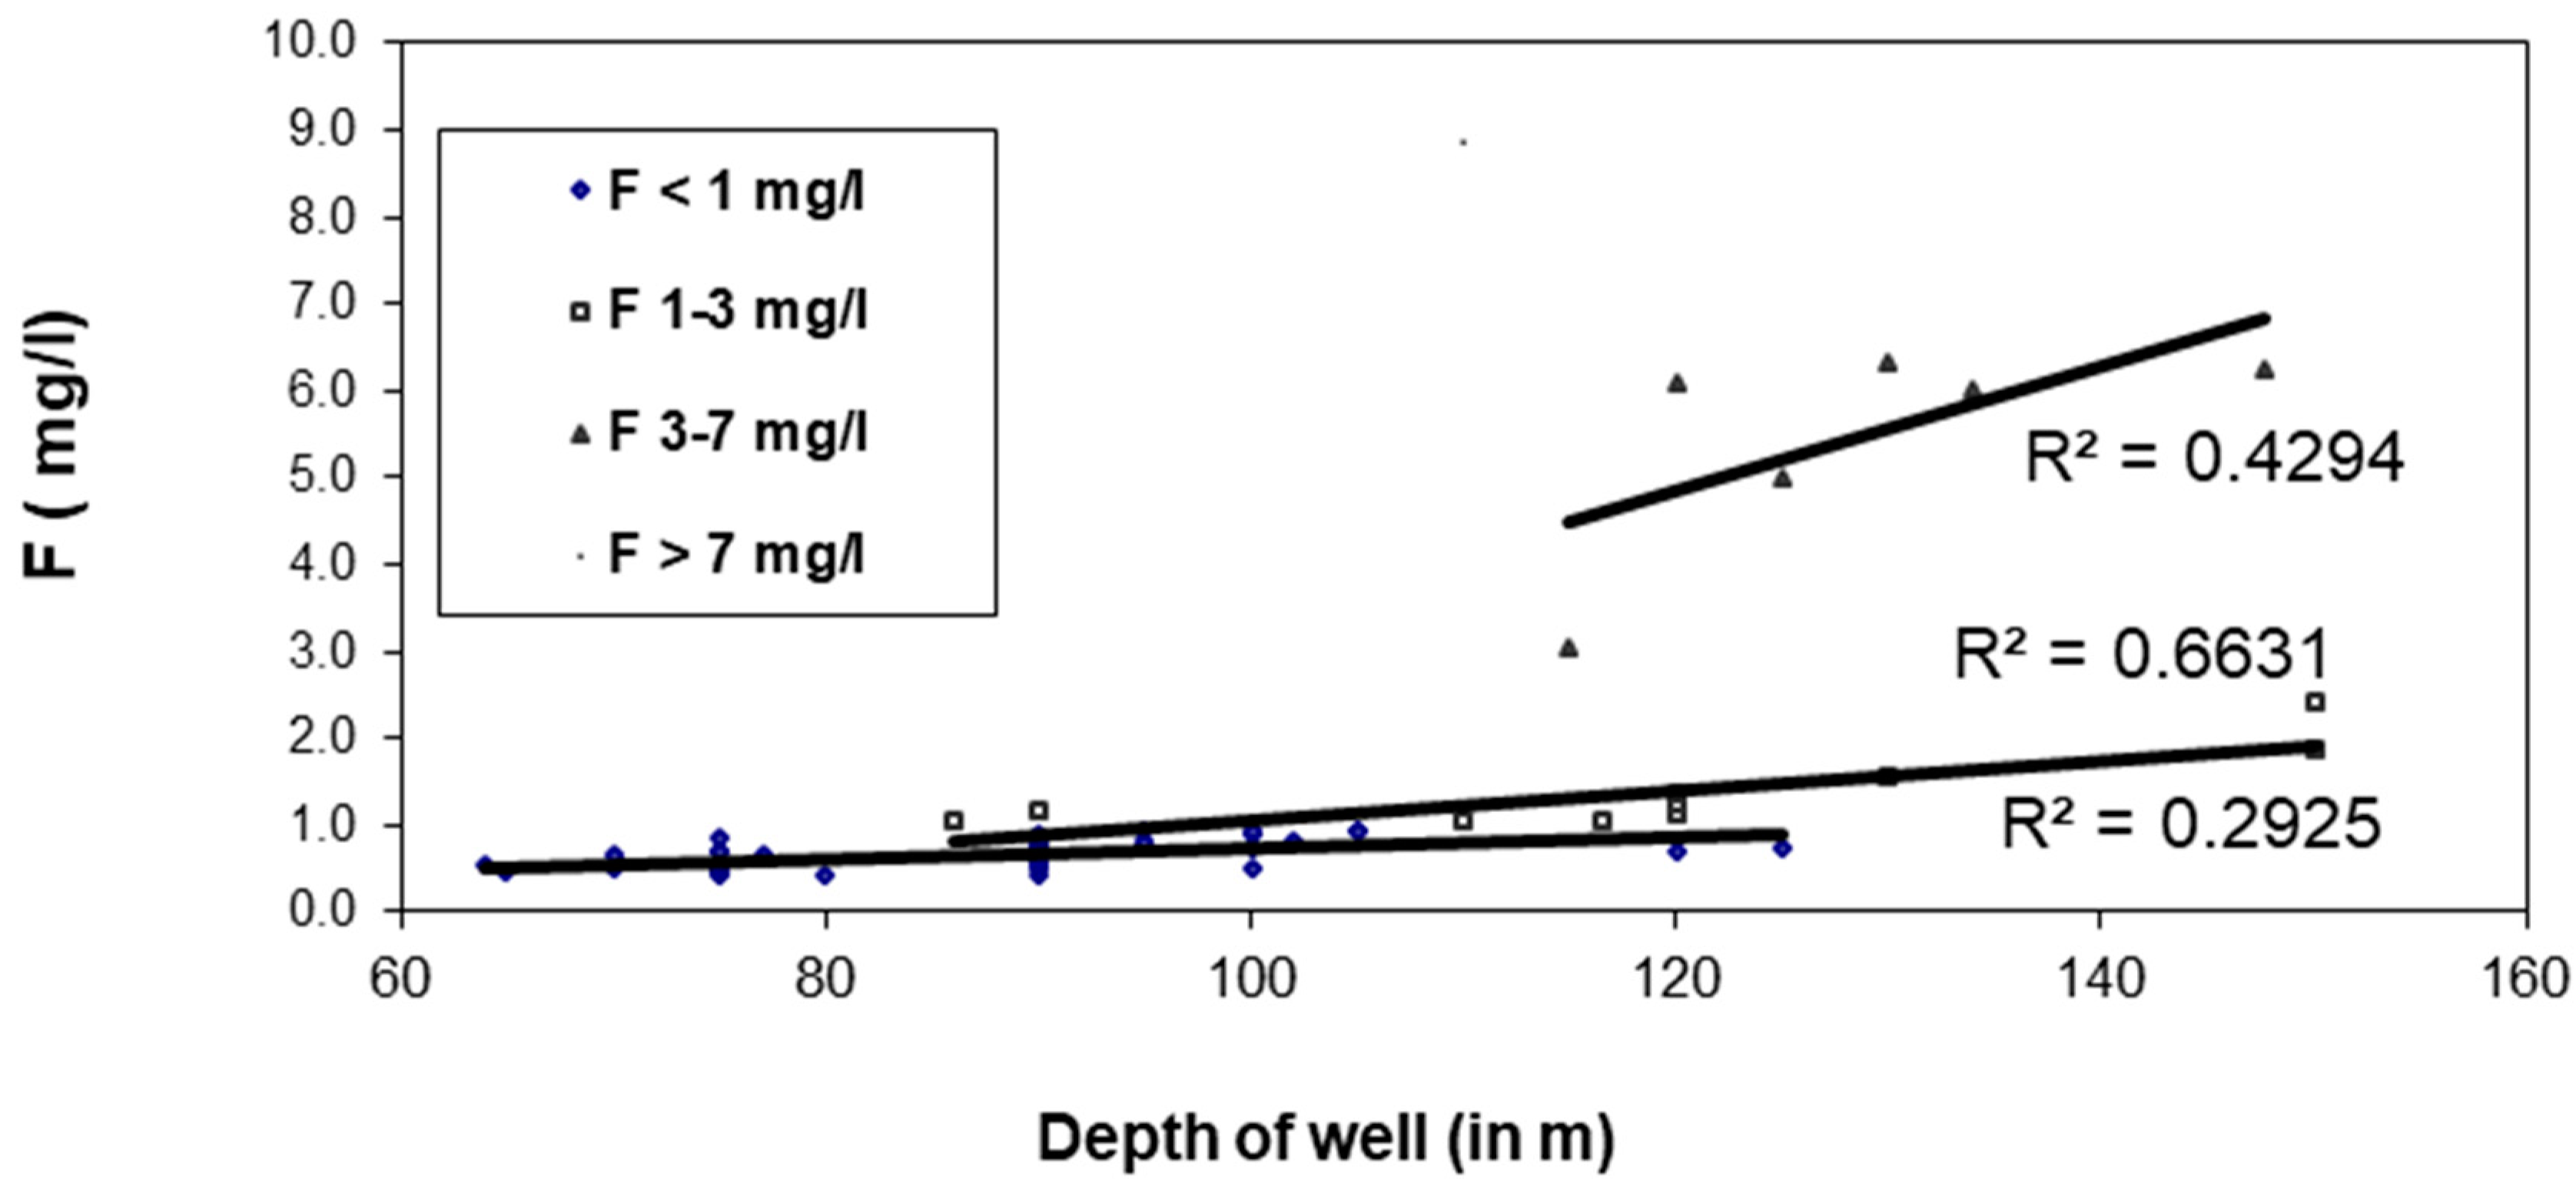
3.8. Relationship of F− with Well Depth
4. Discussion
5. Conclusions
Author Contributions
Funding
Data Availability Statement
Acknowledgments
Conflicts of Interest
References
- Grönwall, J.; Kerstin, D. Regarding Groundwater and Drinking Water Access through A Human Rights Lens: Self-Supply as A Norm. Water 2020, 12, 419. [Google Scholar] [CrossRef]
- Nizam, S.; Virk, H.S.; Sen, I.S. High levels of fluoride in groundwater from Northern parts of Indo-Gangetic plains reveals detrimental fluorosis health risks. Environ. Adv. 2022, 8, 100200. [Google Scholar] [CrossRef]
- Shukla, T.; Sen, I.S. Preparing for floods on the Third Pole, Satellite-based real-time monitoring is needed for Himalayan glacial catchments. Science 2021, 372, 232–234. [Google Scholar] [CrossRef]
- Rashid, A.; Farooqi, A.; Gao, X.; Zahir, S.; Noor, S.; Khattak, J.A. Geochemical modeling, source apportionment, health risk exposure and control of higher fluoride in groundwater of sub-district Dargai, Pakistan. Chemosphere 2020, 243, 125409. [Google Scholar] [CrossRef]
- WHO. World health Statistics 2017: Monitoring Health for the SDGs, Sustainable Development Goals; World Health Organization: Geneva, Switzerland, 2017. [Google Scholar]
- Jin, C.; Yan, Z.; Jianwei, L.; Ruodeng, X.; Sangbu, D. Environmental fluoride in Tibet. Environ. Res. 2000, 83, 333–337. [Google Scholar] [CrossRef]
- Podgorski, J.; Berg, M. Global analysis and prediction of fluoride in groundwater. Nat. Commun. 2022, 13, 4232. [Google Scholar] [CrossRef] [PubMed]
- Ahada, C.P.S.; Suthar, S. Assessment of Human Health Risk Associated with High Groundwater Fluoride Intake in Southern Districts of Punjab, India. Expo. Health 2017, 11, 267–275. [Google Scholar] [CrossRef]
- Haji, M.; Wang, D.; Li, L.; Qin, D.; Guo, Y. Geochemical evolution of Fluoride and implication for F¯ enrichment in groundwater: Example from the Bilate River Basin of Southern Main Ethiopian Rift. Water 2018, 10, 1799. [Google Scholar] [CrossRef]
- Kisku, G.C.; Sahu, P. Fluoride Contamination and Health Effects: An Indian Scenario. In Environmental Concerns and Sustainable Development; Shukla, V., Kumar, N., Eds.; Springer: Singapore, 2020. [Google Scholar] [CrossRef]
- Nordstrom, D.K.; Smedely, P.L. Fluoride in Groundwater: The Groundwater Project, Guelph, Ontario, Canada 2022. Available online: https://gw-project.org/books/fluoride-in-groundwater (accessed on 6 August 2023).
- Nordstrom, D.K. Fluoride in thermal and non-thermal groundwater: Insights from geochemical modeling. Sci. Total Environ. 2022, 824, 153606. [Google Scholar] [CrossRef]
- Muralidharan, D.; Nair, A.; Sathyanarayana, U. Fluoride in shallow aquifers in Rajgarh Tehsil of Churu District, Rajasthan–an arid environment. Curr. Sci. 2002, 83, 699–702. [Google Scholar]
- Gupta, S.; Banerjee, S.; Saha, R.; Datta, J.K.; Mondal, N. Fluoride geochemistry of groundwater in Nalhati-1 block of the Birbhum district, West Bengal, India. Fluoride 2006, 39, 318–320. [Google Scholar]
- UNICEF. State of the Art Report on the Extent of Fluoride in Drinking Water and the Resulting Endemicity in India; Fluorosis Research & Rural Development Foundation for UNICEF: New Delhi, India, 1999. [Google Scholar]
- Adimalla, N.; Li, P.; Venkatayogi, S. Hydrogeochemical Evaluation of Groundwater Quality for Drinking and Irrigation Purposes and Integrated Interpretation with Water Quality Index Studies. Environ. Process. 2018, 5, 363–383. [Google Scholar] [CrossRef]
- Amini, M.; Mueller, K.; Abbaspour, K.C.; Rosenberg, T.; Afyuni, M.; Møller, K.N.; Sarr, M.; Johnson, C.A. Statistical Modeling of Global Geogenic Fluoride Contamination in Groundwaters. Environ. Sci. Technol. 2008, 42, 3662–3668. [Google Scholar] [CrossRef]
- Raju, N.J.; Dey, S.; Das, K. Fluoride contamination in southern block of Sonbhadra district, Uttar Pradesh, India. Curr. Sci. 2009, 96, 699–702. [Google Scholar]
- Brindha, K.; Elango, L. Fluoride in Groundwater: Causes, Implications and Mitigation Measures. In Fluoride Properties, Applications and Environmental Management; Monroy, S.D., Ed.; Nova Publishers: New York, NY, USA, 2011; pp. 111–136. [Google Scholar]
- Chidambaram, S.; Bala Krishna Prasad, M.; Manivannan, R.; Karmegam, U.; Singaraja, C.; Anandhan, P.; Prasanna, M.V.; Manikandan, S. Environmental hydrogeochemistry and genesis of fluoride in groundwaters of Dindigul district, Tamilnadu (India). Environ. Earth Sci. 2012, 68, 333–342. [Google Scholar] [CrossRef]
- Islam, A.R.M.T.; Shen, S.; Haque, M.A.; Bodrud-Doza, M.; Maw, K.W.; Habib, M.A. Assessing groundwater quality and its sustainability in Joypurhat district of Bangladesh using GIS and multivariate statistical approaches. Environ. Dev. Sustain. 2017, 20, 1935–1959. [Google Scholar] [CrossRef]
- Vithanage, M.; Bhattacharya, P. Fluoride in the environment: Sources, distribution and defluoridation. Environ. Chem. Lett. 2015, 13, 131–147. [Google Scholar] [CrossRef]
- Patolia, P.; Sinha, A. Fluoride contamination in Gharbar Village of Dhanbad District, Jharkhand, India: Source identification and management. Arab. J. Geosci. 2017, 10, 381. [Google Scholar] [CrossRef]
- Subba Rao, N.; Marghade, D.; Dinakar, A.; Chandana, I.; Sunitha, B.; Ravindra, B.; Balaji, T. Geochemical characteristics and controlling factors of chemical composition of groundwater in a part of Guntur district, Andhra Pradesh, India. Environ. Earth Sci. 2017, 76, 747. [Google Scholar] [CrossRef]
- Kumar Das, A.; Das, N.; Goswami, R.; Singh, U.K. Co-occurrence perspective of arsenic and fluoride in the groundwater of Diphu, Assam, Northeastern India. Chemosphere 2016, 150, 227–238. [Google Scholar] [CrossRef]
- Bura, B.; Goni, I.B. Tracing the factors influencing occurrence of fluoride in groundwater of the Middle zone aquifer in Borno State. North-East. Niger. 2012, 48, 177–184. [Google Scholar]
- Kim, K.; Jeong, G.Y. Factors influencing natural occurrence of fluoride-rich groundwaters: A case study in the southeastern part of the Korean Peninsula. Chemosphere 2005, 58, 1399–1408. [Google Scholar] [CrossRef]
- Ali, S.; Thakur Sachin, S.; Aditya Shashank, S. Worldwide contamination of water by fluoride. Environ. Chem. Lett. 2016, 14, 291–315. [Google Scholar] [CrossRef]
- Rao, N.S.; Rao, P.S.; Dinakar, A.; Rao PV, N.; Marghade, D. Fluoride occurrence in the groundwater in a coastal region of Andhra Pradesh, India. Appl. Water Sci. 2017, 7, 1467–1478. [Google Scholar] [CrossRef]
- Adimalla, N.; Vasa, S.K.; Li, P. Evaluation of groundwater quality, Peddavagu in Central Telangana (PCT), South India: An insight of controlling factors of fluoride enrichment. Model. Earth Syst. Environ. 2018, 4, 841–852. [Google Scholar] [CrossRef]
- Chae, G.-T.; Yun, S.-T.; Mayer, B.; Kim, K.-H.; Kim, S.-Y.; Kwon, J.-S.; Kim, K.; Koh, Y.-K. Fluorine geochemistry in bedrock groundwater of South Korea. Sci. Total Environ. 2007, 385, 272–283. [Google Scholar] [CrossRef]
- Coetsiers, M.; Kilonzo, F.; Walraevens, K. Hydrochemistry and source of high fluoride in groundwater of the Nairobi area, Kenya/Hydrochimie et origine des fortes concentrations en fluorure dans l’eau souterraine de la région de Nairobi, au Kenya. Hydrol. Sci. J. 2008, 53, 1230–1240. [Google Scholar] [CrossRef]
- Guo, Q.; Wang, Y.; Ma, T.; Ma, R. Geochemical processes controlling the elevated fluoride concentrations in groundwaters of the Taiyuan Basin, Northern China. J. Geochem. Explor. 2007, 93, 1–12. [Google Scholar] [CrossRef]
- Subba Rao, N. Groundwater quality: Focus on fluoride concentration in rural parts of Guntur district, Andhra Pradesh, India. Hydrol. Sci. J. 2003, 48, 835–847. [Google Scholar] [CrossRef]
- Subba Rao, N.; John Devadas, D. Fluoride incidence in groundwater in an area of Peninsular India. Environ. Geol. 2003, 45, 243–251. [Google Scholar] [CrossRef]
- WHO. Guidelines for Drinking-Water Quality, 4th ed.; WHO: Geneva, Switzerland, 2006. [Google Scholar]
- Brunt, R.; Vasak, L.; Griffioen, J. Fluoride in Groundwater: Probability of Occurrence of Excessive Concentration on Global Scale; International Groundwater Resources Assessment Centre, UNESCO: London, UK, 2004; 20p. [Google Scholar]
- Beg, M.K. Geospatial Analysis of Fluoride Contamination in Ground Water of Tamnar Area, Raigarh District, Chhatisgarh State. Master Thesis, ITC, Enschede, The Netherlands, 2009. [Google Scholar]
- Beg, M.K.; Srivastav, S.K.; Carranza, E.J.M.; De, J.B. High fluoride incidence in groundwater and its potential health effects in parts of Author Smeth Published by: Association Stable URL: High fluoride incidence in groundwater of Raigarh District, Chhattisgarh. Curr. Sci. 2011, 100, 750–754. [Google Scholar]
- GSI. Geological Map on 1:50,000 Scale; GSI: Kolkata, India, 2008. [Google Scholar]
- Celesceri, L.; Greenberg, A.E.; Eaten, A.D. Standard and Methods for the Examination of Water and Wastewater; American Public Health Association (APHA): Washington, DC, USA, 1998. [Google Scholar]
- Coetsiers, M.; Walraevens, K. Chemical characterization of the Neogene Aquifer, Belgium. Hydrogeol. J. 2006, 14, 1556–1568. [Google Scholar] [CrossRef]
- Deutsch, W.J. Grounwater Geochemistry Fundamentals and Applications to Contamination; CRC Press: Boca Raton, FL, USA, 1997. [Google Scholar]
- Apambire, W.B.; Boyle, D.R.; Michel, F.A. Geochemistry, genesis, and health implications of fluoriferous groundwaters in the upper regions of Ghana. Environ. Geol. 1997, 33, 13–24. [Google Scholar] [CrossRef]
- Jacks, G.; Bhattacharya, P.; Chaudhary, V.; Singh, K.P. Controls on the genesis of some high-fluoride groundwaters in India. Appl. Geochem. 2005, 20, 221–228. [Google Scholar] [CrossRef]
- Handa, B.K. Geochemistry and Genesis of Fluoride-Containing Ground Waters in India. Groundwater 1975, 13, 275–281. [Google Scholar] [CrossRef]
- Srivastava, S.K.; Ramanathan, A.L. Geochemical assessment of fluoride enrichment and nitrate contamination in groundwater in hard-rock aquifer by using graphical and statistical methods. J. Earth Syst. Sci. 2018, 127, 1–23. [Google Scholar] [CrossRef]
- BIS. Indian Standard Drinking Water—Specification (Second Revision) IS 10500 (2012): Drinking water. Water Supply 2012, 25, 1–3. [Google Scholar]
- Adimalla, N. Assessment and mechanism of fluoride enrichment in groundwater from the hard rock terrain: A multivariate statistical approach. Geochem. Int. 2020, 58, 456–471. [Google Scholar] [CrossRef]
- Al-Amry, A. Hydrogeochemistry and origin of fluoride in groundwater of Hidhran & Alburayhi Basin, northwest Taiz City, Yemen. Delta J. Sci. 2009, 33, 10–20. [Google Scholar]
- Frengstad, B.; Skrede, A.K.; Banks, D.; Krog, J.R.; Siewers, U. The chemistry of Norwegian groundwaters: III. The distribution of trace elements in 476 crystalline bedrock groundwaters, as analysed by ICP-MS techniques. Sci Total Environ. 2000, 246, 21–40. [Google Scholar] [CrossRef] [PubMed]
- Gizaw, B. The origin of high bicarbonate and fluoride concentrations in waters of the Main Ethiopian Rift Valley, East African Rift system. J. Afr. Earth Sci. 1996, 22, 391–402. [Google Scholar] [CrossRef]
- Piper, A.M. A graphic procedure in geochemical interpretation of water analysis. Eos Trans. Am. Geophys. Union 1953, 25, 914–928. [Google Scholar] [CrossRef]
- Narsimha, A.; Sudarshan, V. Contamination of fluoride in groundwater and its effect on human health: A case study in hard rock aquifers of Siddipet, Telangana State, India. Appl. Water Sci. 2016, 7, 2501–2512. [Google Scholar] [CrossRef]
- Wu, J.; Li, P.; Wang, D.; Ren, X.; Wei, M. Statistical and multivariate statistical techniques to trace the sources and affecting factors of groundwater pollution in a rapidly growing city on the Chinese Loess Plateau. Hum. Ecol. Risk Assess. Int. J. 2020, 26, 1603–1621. [Google Scholar] [CrossRef]
- Shirsat, S. Occurrence of Fluorides in Drinking Water from Akota District. Biosci. Discov. 2011, 2, 143–145. [Google Scholar]
- Tiwari, A.N.; Nawale, V.P.; Tambe, J.; Kumar, Y. Correlation of fluoride with bicarbonate in groundwater of exploratory wells in parts of Maharashtra. J. Appl. Geochem. 2008, 10, 93–102. [Google Scholar]
- Narsimha, A.; Rajitha, S. Spatial distribution and seasonal variation in fluoride enrichment in groundwater and its associated human health risk assessment in Telangana State, South India. Hum. Ecol. Risk Assess. Int. J. 2018, 24, 2119–2132. [Google Scholar] [CrossRef]
- Ayoob, S.; Gupta, A.K. Fluoride in Drinking Water: A Review on the Status and Stress Effects. Crit. Rev. Environ. Sci. Technol. 2006, 36, 433–487. [Google Scholar] [CrossRef]
- Li, D.; Gao, X.; Wang, Y.; Luo, W. Diverse mechanisms drive fluoride enrichment in groundwater in two neighboring sites in northern China. Environ. Pollut. 2018, 237, 430–441. [Google Scholar] [CrossRef]
- Karro, E.; Rosentau, A. Fluoride levels in the Silurian-Ordovician aquifer system of western Estonia. Fluoride 2005, 38, 307–311. [Google Scholar]
- Brindha, K.; Jagadeshan, G.; Kalpana, L.; Elango, L. Fluoride in weathered rock aquifers of southern India: Managed Aquifer Recharge for mitigation. Environ. Sci. Pollut. Res. 2016, 23, 8302–8316. [Google Scholar] [CrossRef] [PubMed]
- He, X.; Ma, T.; Wang, Y.; Shan, H.; Deng, Y. Hydrogeochemistry of high fluoride groundwater in shallow aquifers, Hangjinhouqi, Hetao Plain. J. Geochem. Explor. 2013, 135, 63–70. [Google Scholar] [CrossRef]
- Jagadeshan, G.; Kalpana, L.; Elango, L. Major ion signatures for identification of geochemical reactions responsible for release of fluoride from geogenic sources to groundwater and associated risk in Vaniyar River basin, Dharmapuri district, Tamil Nadu, India. Environ. Earth Sci. 2015, 74, 2439–2450. [Google Scholar] [CrossRef]
- Kalpana, L.; Brindha, K.; Elango, L. FIMAR: A new Fluoride Index to mitigate geogenic contamination by Managed Aquifer Recharge. Chemosphere 2019, 220, 381–390. [Google Scholar] [CrossRef]
- Subramani, T.; Rajmohan, N.; Elango, L. Groundwater geochemistry and identification of hydrogeochemical processes in a hard rock region, Southern India. Environ. Monit. Assess. 2010, 162, 123–137. [Google Scholar] [CrossRef]
- Edmunds, W.M.; Smedley, P.L. Geochemistry and Health: An Overview. In Environmental Geochemistry and Health; Appleton, Fuge & McCall, Eds.; Geological Society Special Publication: London, UK, 1996; pp. 91–105. [Google Scholar]
- Adriano, D.C. Trace Elements in the Terrestrial Environment; Springer-Verlag: New York, NY, USA, 1986; Volume XIX, p. 533. [Google Scholar] [CrossRef]
- Vikas, C.; Kushwaha, R.; Ahmad, W.; Prasannakumar, V.; Reghunath, R. Genesis and geochemistry of high fluoride bearing groundwater from a semi-arid terrain of NW India. Environ. Earth Sci. 2013, 68, 289–305. [Google Scholar] [CrossRef]
- Guo, H.; Wang, Y. Geochemical characteristics of shallow groundwater in Datong basin, northwestern China. J. Geochem. Explor. 2005, 87, 109–120. [Google Scholar] [CrossRef]
- Saxena, V.; Ahmed, S. Inferring the chemical parameters for the dissolution of fluoride in groundwater. Environ. Geol. 2003, 43, 731–736. [Google Scholar] [CrossRef]
- Hem, J.D. Study and Interpretation of the Chemical Characteristics of Natural Water, 3rd ed.; U.S. Geological Survey Water-Supply Paper; U.S. Geological Survey: Liston, VA, USA, 1985; Volume 5, pp. 1–272. [Google Scholar]
- Dey, R.K.; Swain, S.K.; Mishra, S.; Sharma, P.; Patnaik, T.; Singh, V.K.; Dehury, B.N.; Jha, U.; Patel, R.K. Hydrogeochemical processes controlling the high fluoride concentration in groundwater: A case study at the Boden block area, Orissa, India. Environ. Monit. Assess. 2012, 184, 3279–3291. [Google Scholar] [CrossRef]
- Saxena, V.; Ahmed, S. Dissolution of fluoride in groundwater: A water-rock interaction study. Environ. Geol. 2001, 40, 1084–1087. [Google Scholar] [CrossRef]
- Carrillo-Rivera, J.; Cardona, A.; Edmunds, W. Use of abstraction regime and knowledge of hydrogeological conditions to control high-fluoride concentration in abstracted groundwater: San Luis Potosí Basin, Mexico. J. Hydrol. 2002, 261, 24–47. [Google Scholar] [CrossRef]
- Borgnino, L.; Garcia, M.G.; Bia, G.; Stupar, Y.V.; Le Coustumer, P.; Depetris, P.J. Mechanisms of fluoride release in sediments of Argentina’s central region. Sci. Total Environ. 2013, 443, 245–255. [Google Scholar] [CrossRef] [PubMed]
- Currell, M.; Cartwright, I.; Raveggi, M.; Han, D. Controls on elevated fluoride and arsenic concentrations in groundwater from the Yuncheng Basin, China. Appl. Geochem. 2011, 26, 540–552. [Google Scholar] [CrossRef]
- Möller, P.; Rosenthal, E.; Inbar, N.; Magri, F. Hydrochemical considerations for identifying water from basaltic aquifers: The Israeli experience. J. Hydrol. Reg. Stud. 2016, 5, 33–47. [Google Scholar] [CrossRef][Green Version]


| Age | Formation | Lithology |
|---|---|---|
| Recent to Sub-Recent | Soil and alluvium | Sand, clay, gravel, laterite |
| Permian to Triassic | Kamthi | Sandstone and argillaceous beds |
| Upper Permian | Raniganj | Sandstone and carbonaceous shale |
| Upper Permian | Barren Measure | Ferruginous sandstone and clay |
| Lower Permian | Barakar | Feldspathic sandstone, shale, carbonaceous shale with coal seams |
| Parameter | Pre-Monsoon Period (Number of Samples = 83) | Post-Monsoon Period (Number of Samples = 81) | ||||||
|---|---|---|---|---|---|---|---|---|
| Range | Mean | Median | SD | Range | Mean | Median | SD | |
| pH | 6.91–8.96 | 8.18 | 7.02 | 0.49 | 6.36–7.85 | 7.02 | 7.02 | 0.49 |
| EC | 78–2760 | 441.1 | 380.0 | 333.9 | 95–1268 | 453.3 | 400.0 | 226.1 |
| Ca2+ | 9.9–130.7 | 32.3 | 25.7 | 20.6 | 4.8–62.7 | 26.2 | 22.3 | 13.9 |
| Mg2+ | 2.4–125.2 | 20.0 | 16.9 | 16.0 | 2.0–42.2 | 13.1 | 11.0 | 8.3 |
| Na+ | 0.6–62.7 | 18.2 | 16.9 s | 12.9 | 1.0–84.7 | 16.4 | 14.0 | 13.6 |
| K+ | 3.0–80.5 | 21.3 | 17.4 | 15.7 | 1.1–44.9 | 14.9 | 11.7 | 10.6 |
| Li+ | nm | - | - | - | 0–0.08 | 0.01 | 0.0 | 0.02 |
| HCO3− | 24.4–483.6 | 190.9 | 186.5 | 88.0 | 30.3–519.4 | 198.3 | 182.3 | 93.9 |
| CO32− | nd | - | - | - | 0–29.2 | 2.4 | 0.0 | 5.8 |
| SO42− | 1.5–31.8 | 10.6 | 9.6 | 5.7 | 0–215.0 | 6.8 | 2.9 | 23.9 |
| Cl− | 0–335.8 | 24.0 | 12.0 | 45.9 | 1.0–90.4 | 15.4 | 10.9 | 17.0 |
| NO3− | 0–106.3 | 4.2 | 0.5 | 14.0 | 0–36.4 | 2.2 | 0.5 | 5.4 |
| F− | 0.09–8.88 | 1.08 | 0.64 | 1.6 | 0–7.12 | 1.03 | 0.5 | 1.52 |
| PO43− | nd | - | - | - | nd | - | - | - |
| SiO2 | 10–150 | 58.7 | 60.0 | 31.5 | nm | - | - | - |
| TH | 34.7–841 | 164.9 | 143.5 | 113.3 | 44.6–401 | 163.2 | 146.0 | 81.1 |
| Sampling Time | Number of Samples and Concentration Value in mg/L | |||
|---|---|---|---|---|
| F− < 0.6 | 0.6 ≤ F− ≤ 1.2 | F− > 1.2 | F− > 1.5 | |
| Pre-monsoon period (N = 83) | 40 (48%) | 31(37%) | 12 (15%) | 10 (12%) |
| Post-monsoon period (N = 81) | 54 (67%) | 14 (17%) | 13 (16%) | 11 (13%) |
| Mid-monsoon period * (N = 20) | 5 | 2 | 13 | 10 |
| pH | EC | TH | Ca2+ | Mg2+ | Na+ | K+ | HCO3− | SO42− | Cl− | NO3− | F− | SiO2 | |
|---|---|---|---|---|---|---|---|---|---|---|---|---|---|
| pH | 1 | ||||||||||||
| EC | 0.28 ** | 1 | |||||||||||
| TH | 0.37 ** | 0.95 ** | 1 | ||||||||||
| Ca2+ | 0.44 ** | 0.89 ** | 0.95 ** | 1 | |||||||||
| Mg2+ | 0.31 ** | 0.96 ** | 0.97 ** | 0.87 ** | 1 | ||||||||
| Na+ | 0.33 ** | 0.43 ** | 0.38 ** | 0.39 ** | 0.36 ** | 1 | |||||||
| K+ | 0.10 | 0.34 ** | 0.22 * | 0.19 * | 0.24 * | 0.16 | 1 | ||||||
| HCO3− | 0.67 ** | 0.46 ** | 0.58 ** | 0.62 ** | 0.55 ** | 0.56 ** | 0.13 | 1 | |||||
| SO42− | −0.03 | −0.15 | −0.16 | −0.16 | −0.13 | 0.12 | −0.18 | −0.03 | 1 | ||||
| Cl− | 0.10 | 0.92 ** | 0.84 ** | 0.80 ** | 0.82 ** | 0.36 ** | 0.34 ** | 0.17 | −0.20 * | 1 | |||
| NO3− | −0.54 * | 0.02 | −0.04 | −0.08 | −0.06 | 0.01 | 0.26 ** | −0.29 ** | 0.0 | 0.13 | 1 | ||
| F− | 0.03 | −0.11 | −0.22 * | −0.22 * | −0.20 * | 0.31 ** | −0.17 | −0.10 | 0.12 | −0.12 | −0.11 | 1 | |
| SiO2 | −0.09 | −0.22 * | −0.30 ** | −0.37 ** | −0.24 * | 0.20 * | −0.14 | −0.18 * | 0.19 * | −0.20 * | −0.18 | 0.36 ** | 1 |
| pH | EC | TH | Ca2+ | Mg2+ | Na+ | K+ | Li+ | HCO3− | SO42− | Cl− | NO3− | F− | |
|---|---|---|---|---|---|---|---|---|---|---|---|---|---|
| pH | 1 | ||||||||||||
| EC | 0.25 * | 1 | |||||||||||
| TH | 0.31 ** | 0.92 ** | 1 | ||||||||||
| Ca2+ | 0.36 ** | 0.82 ** | 0.88 ** | 1 | |||||||||
| Mg2+ | 0.21 * | 0.85 ** | 0.89 ** | 0.76 ** | 1 | ||||||||
| Na+ | 0.10 | 0.73 ** | 0.52 ** | 0.42 ** | 0.57 ** | 1 | |||||||
| K+ | 0.18 | 0.22 * | 0.08 | 0.06 | 0.04 | 0.04 | 1 | ||||||
| Li+ | −0.24 * | 0.08 | 0.05 | −0.07 | 0.14 | 0.12 | 0.12 | 1 | |||||
| HCO3− | 0.38 ** | 0.81 ** | 0.82 ** | 0.77 ** | 0.86 ** | 0.60 ** | 0.09 | 0.08 | 1 | ||||
| SO42− | −0.04 | 0.20 * | 0.25 * | 0.33 ** | 0.11 | −0.1 | 0.06 | −0.02 | −0.10 | 1 | |||
| Cl− | 0.07 | 0.69 ** | 0.51 ** | 0.50 ** | 0.44 ** | 0.66 ** | 0.29 ** | −0.10 | 0.35 ** | 0.06 | 1 | ||
| NO3− | 0.03 | 0.18 | 0.07 | 0.14 | 0.06 | 0.22 * | 0.11 | −0.10 | 0.01 | 0.03 | 0.27 ** | 1 | |
| F− | −0.22 * | −0.22 * | −0.30 ** | −0.33 ** | −0.24 * | 0.21 * | −0.18 * | 0.14 | −0.22 * | −0.05 | −0.10 | −0.04 | 1 |
| Water Type | Well Depth (m) | pH | EC | TDS | TH | ALK | Ca2+ | Mg2+ | Na+ | K+ | NO3− | HCO3− | Cl− | SO42− | F− | |
|---|---|---|---|---|---|---|---|---|---|---|---|---|---|---|---|---|
| Pre-monsoon period | MAX | 150 | 7.84 | 788 | 433 | 257.4 | 316.78 | 49.5 | 32.51 | 62.65 | 36.02 | 2.89 | 386 | 69.08 | 31.8 | 8.88 |
| MIN | 70 | 6.55 | 157.2 | 102 | 69 | 54.95 | 13.86 | 4.82 | 6.02 | 3.29 | 0.154 | 77 | 0 | 2.31 | 0.41 | |
| MEAN | 112.58 | 7.19 | 387.36 | 244.45 | 126.61 | 152.08 | 25.31 | 15.29 | 27.00 | 17.38 | 0.84 | 186.48 | 15.12 | 12.73 | 2.69 | |
| MEDIAN | 120 | 7.21 | 358.5 | 225 | 115.92 | 149.89 | 21.78 | 13.29 | 25.90 | 15.46 | 0.489 | 187.8 | 11.835 | 11.30 | 1.46 | |
| SD | 24.66 | 0.31 | 137.74 | 80.84 | 51.01 | 61.29 | 9.20 | 7.35 | 13.76 | 10.18 | 0.76 | 73.92 | 14.60 | 6.89 | 2.65 | |
| Water Type | Well Depth (m) | pH | EC | TDS | TH | ALK | Ca2+ | Mg2+ | Na+ | K+ | NO3− | HCO3− | Cl− | SO42− | F− | |
| Mid-monsoon period | MAX | 150 | 7.64 | 818 | 408 | 245 | 340 | 40.96 | 22.63 | 50.41 | 91.7 | 0.34 | 414.8 | 56.72 | 40.73 | 7.15 |
| MIN | 70 | 6.22 | 198 | 99 | 55 | 65 | 12.3 | 4.46 | 2.71 | 2.77 | 0.05 | 79.3 | 4.32 | 0.07 | 0.28 | |
| MEAN | 112.58 | 6.99 | 435.85 | 217.9 | 133.25 | 166.5 | 22.24 | 10.58 | 21.59 | 15.65 | 0.19 | 203.13 | 16.99 | 8.05 | 2.56 | |
| MEDIAN | 120 | 6.985 | 406 | 202.5 | 122.5 | 150 | 17.09 | 8.65 | 20.43 | 10.24 | 0.17 | 183 | 13.91 | 1.96 | 1.4 | |
| SD | 24.66 | 0.32 | 178.06 | 88.84 | 57.31 | 67.61 | 9.15 | 5.48 | 10.91 | 19.40 | 0.10 | 82.49 | 12.55 | 12.80 | 2.25 | |
| Water Type | Well Depth (m) | pH | EC | TDS | TH | ALK | Ca2+ | Mg2+ | Na+ | K+ | NO3− | HCO3− | Cl− | SO42− | F− | |
| Post-monsoon period | MAX | 150 | 8.92 | 1083 | 542 | 401 | 361.4 | 62.68 | 41.57 | 53.19 | 26.12 | 11.53 | 404.7 | 32.11 | 215 | 7.12 |
| MIN | 70 | 7.27 | 167 | 84 | 59.4 | 59.4 | 11 | 3.3 | 2.12 | 2.7 | 0 | 72.5 | 3.59 | 0.26 | 0.14 | |
| MEAN | 112.58 | 7.98 | 445.2 | 222.75 | 151.48 | 150.32 | 22.96 | 12.74 | 21.26 | 11.76 | 1.32 | 177.99 | 13.01 | 15.83 | 2.72 | |
| MEDIAN | 120 | 7.91 | 357.5 | 178.5 | 112.65 | 126.25 | 16.25 | 8.62 | 21.16 | 9.12 | 0.53 | 154 | 11.33 | 4.32 | 1.57 | |
| SD | 24.66 | 0.54 | 243.35 | 121.71 | 95.69 | 87.51 | 13.97 | 10.19 | 12.73 | 7.51 | 2.49 | 97.20 | 7.95 | 47.35 | 2.34 | |
Disclaimer/Publisher’s Note: The statements, opinions and data contained in all publications are solely those of the individual author(s) and contributor(s) and not of MDPI and/or the editor(s). MDPI and/or the editor(s) disclaim responsibility for any injury to people or property resulting from any ideas, methods, instructions or products referred to in the content. |
© 2023 by the authors. Licensee MDPI, Basel, Switzerland. This article is an open access article distributed under the terms and conditions of the Creative Commons Attribution (CC BY) license (https://creativecommons.org/licenses/by/4.0/).
Share and Cite
Beg, M.K.; Kumar, N.; Srivastava, S.K.; Carranza, E.J.M. Interpretation of Fluoride Groundwater Contamination in Tamnar Area, Raigarh, Chhattisgarh, India. Earth 2023, 4, 626-654. https://doi.org/10.3390/earth4030033
Beg MK, Kumar N, Srivastava SK, Carranza EJM. Interpretation of Fluoride Groundwater Contamination in Tamnar Area, Raigarh, Chhattisgarh, India. Earth. 2023; 4(3):626-654. https://doi.org/10.3390/earth4030033
Chicago/Turabian StyleBeg, Mirza Kaleem, Navneet Kumar, S. K. Srivastava, and E. J. M. Carranza. 2023. "Interpretation of Fluoride Groundwater Contamination in Tamnar Area, Raigarh, Chhattisgarh, India" Earth 4, no. 3: 626-654. https://doi.org/10.3390/earth4030033
APA StyleBeg, M. K., Kumar, N., Srivastava, S. K., & Carranza, E. J. M. (2023). Interpretation of Fluoride Groundwater Contamination in Tamnar Area, Raigarh, Chhattisgarh, India. Earth, 4(3), 626-654. https://doi.org/10.3390/earth4030033