
Landslide Susceptibility Mapping Using Multi-Criteria Decision-Making (MCDM), Statistical, and Machine Learning Models in the Aube Department, France

 , , ,
, , ,
Abstract
:1. Introduction
2. Study Area and Data
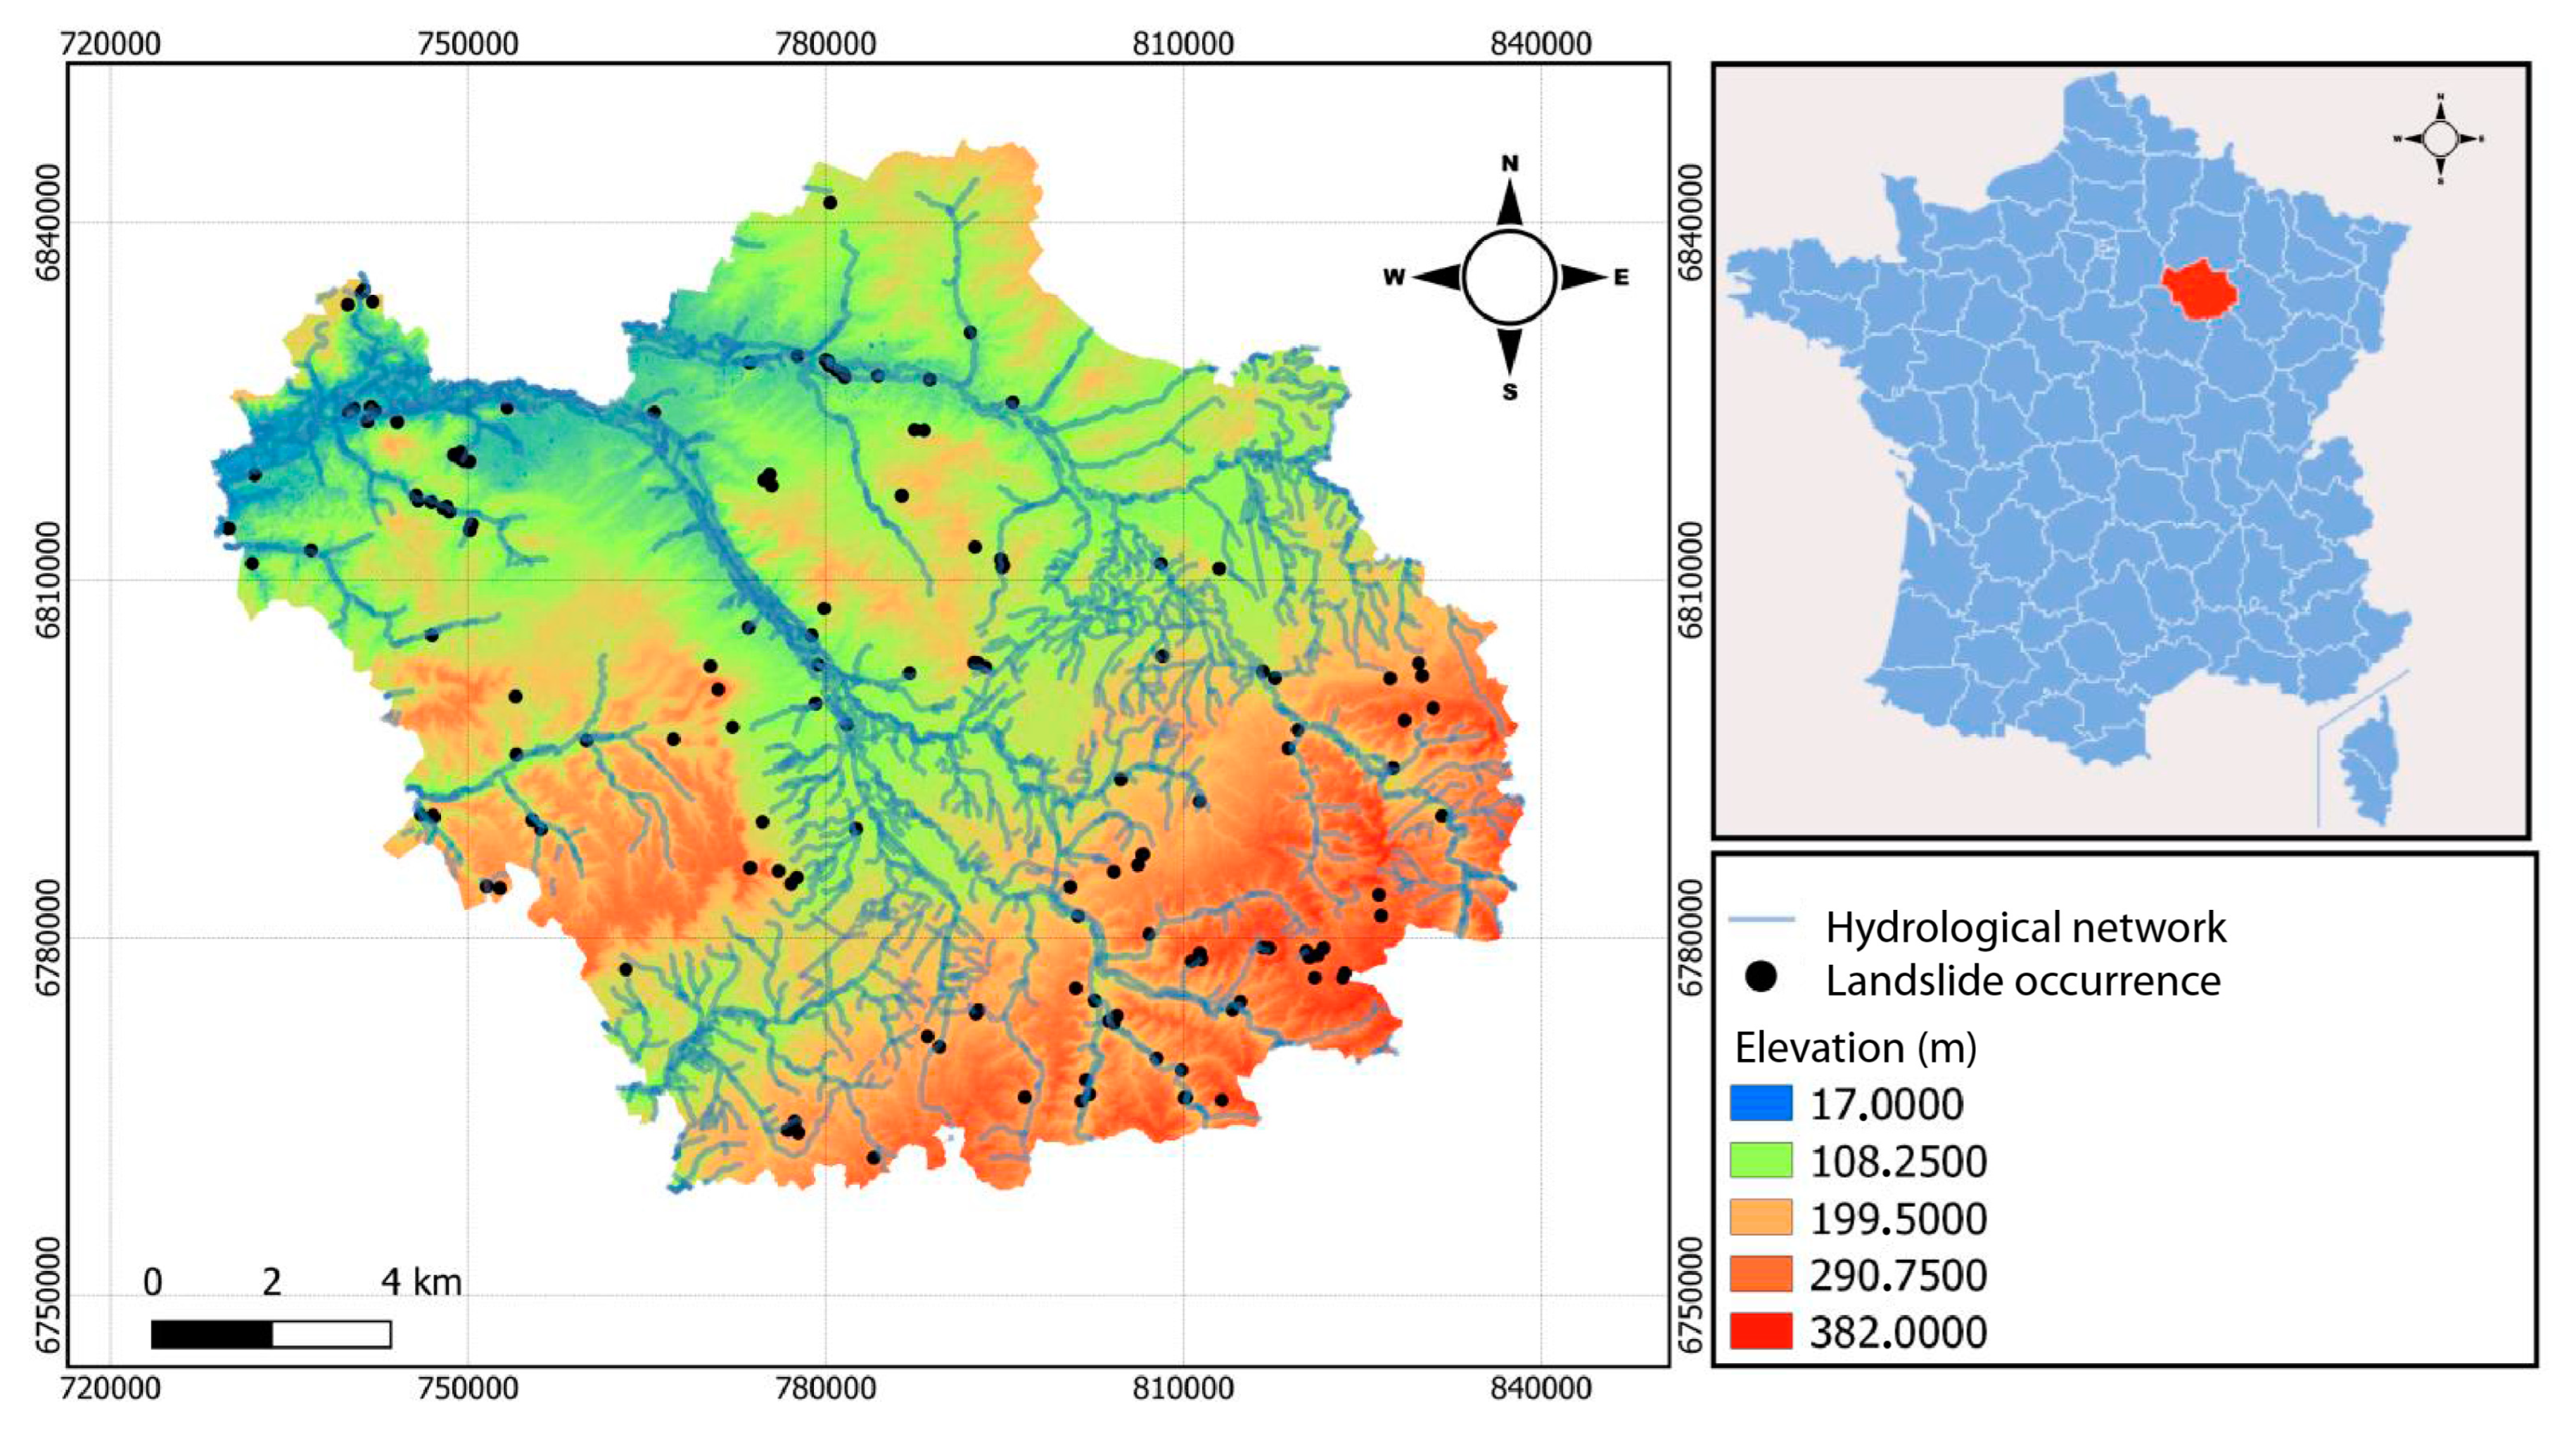
2.1. Study Area
2.2. Landslide Dataset
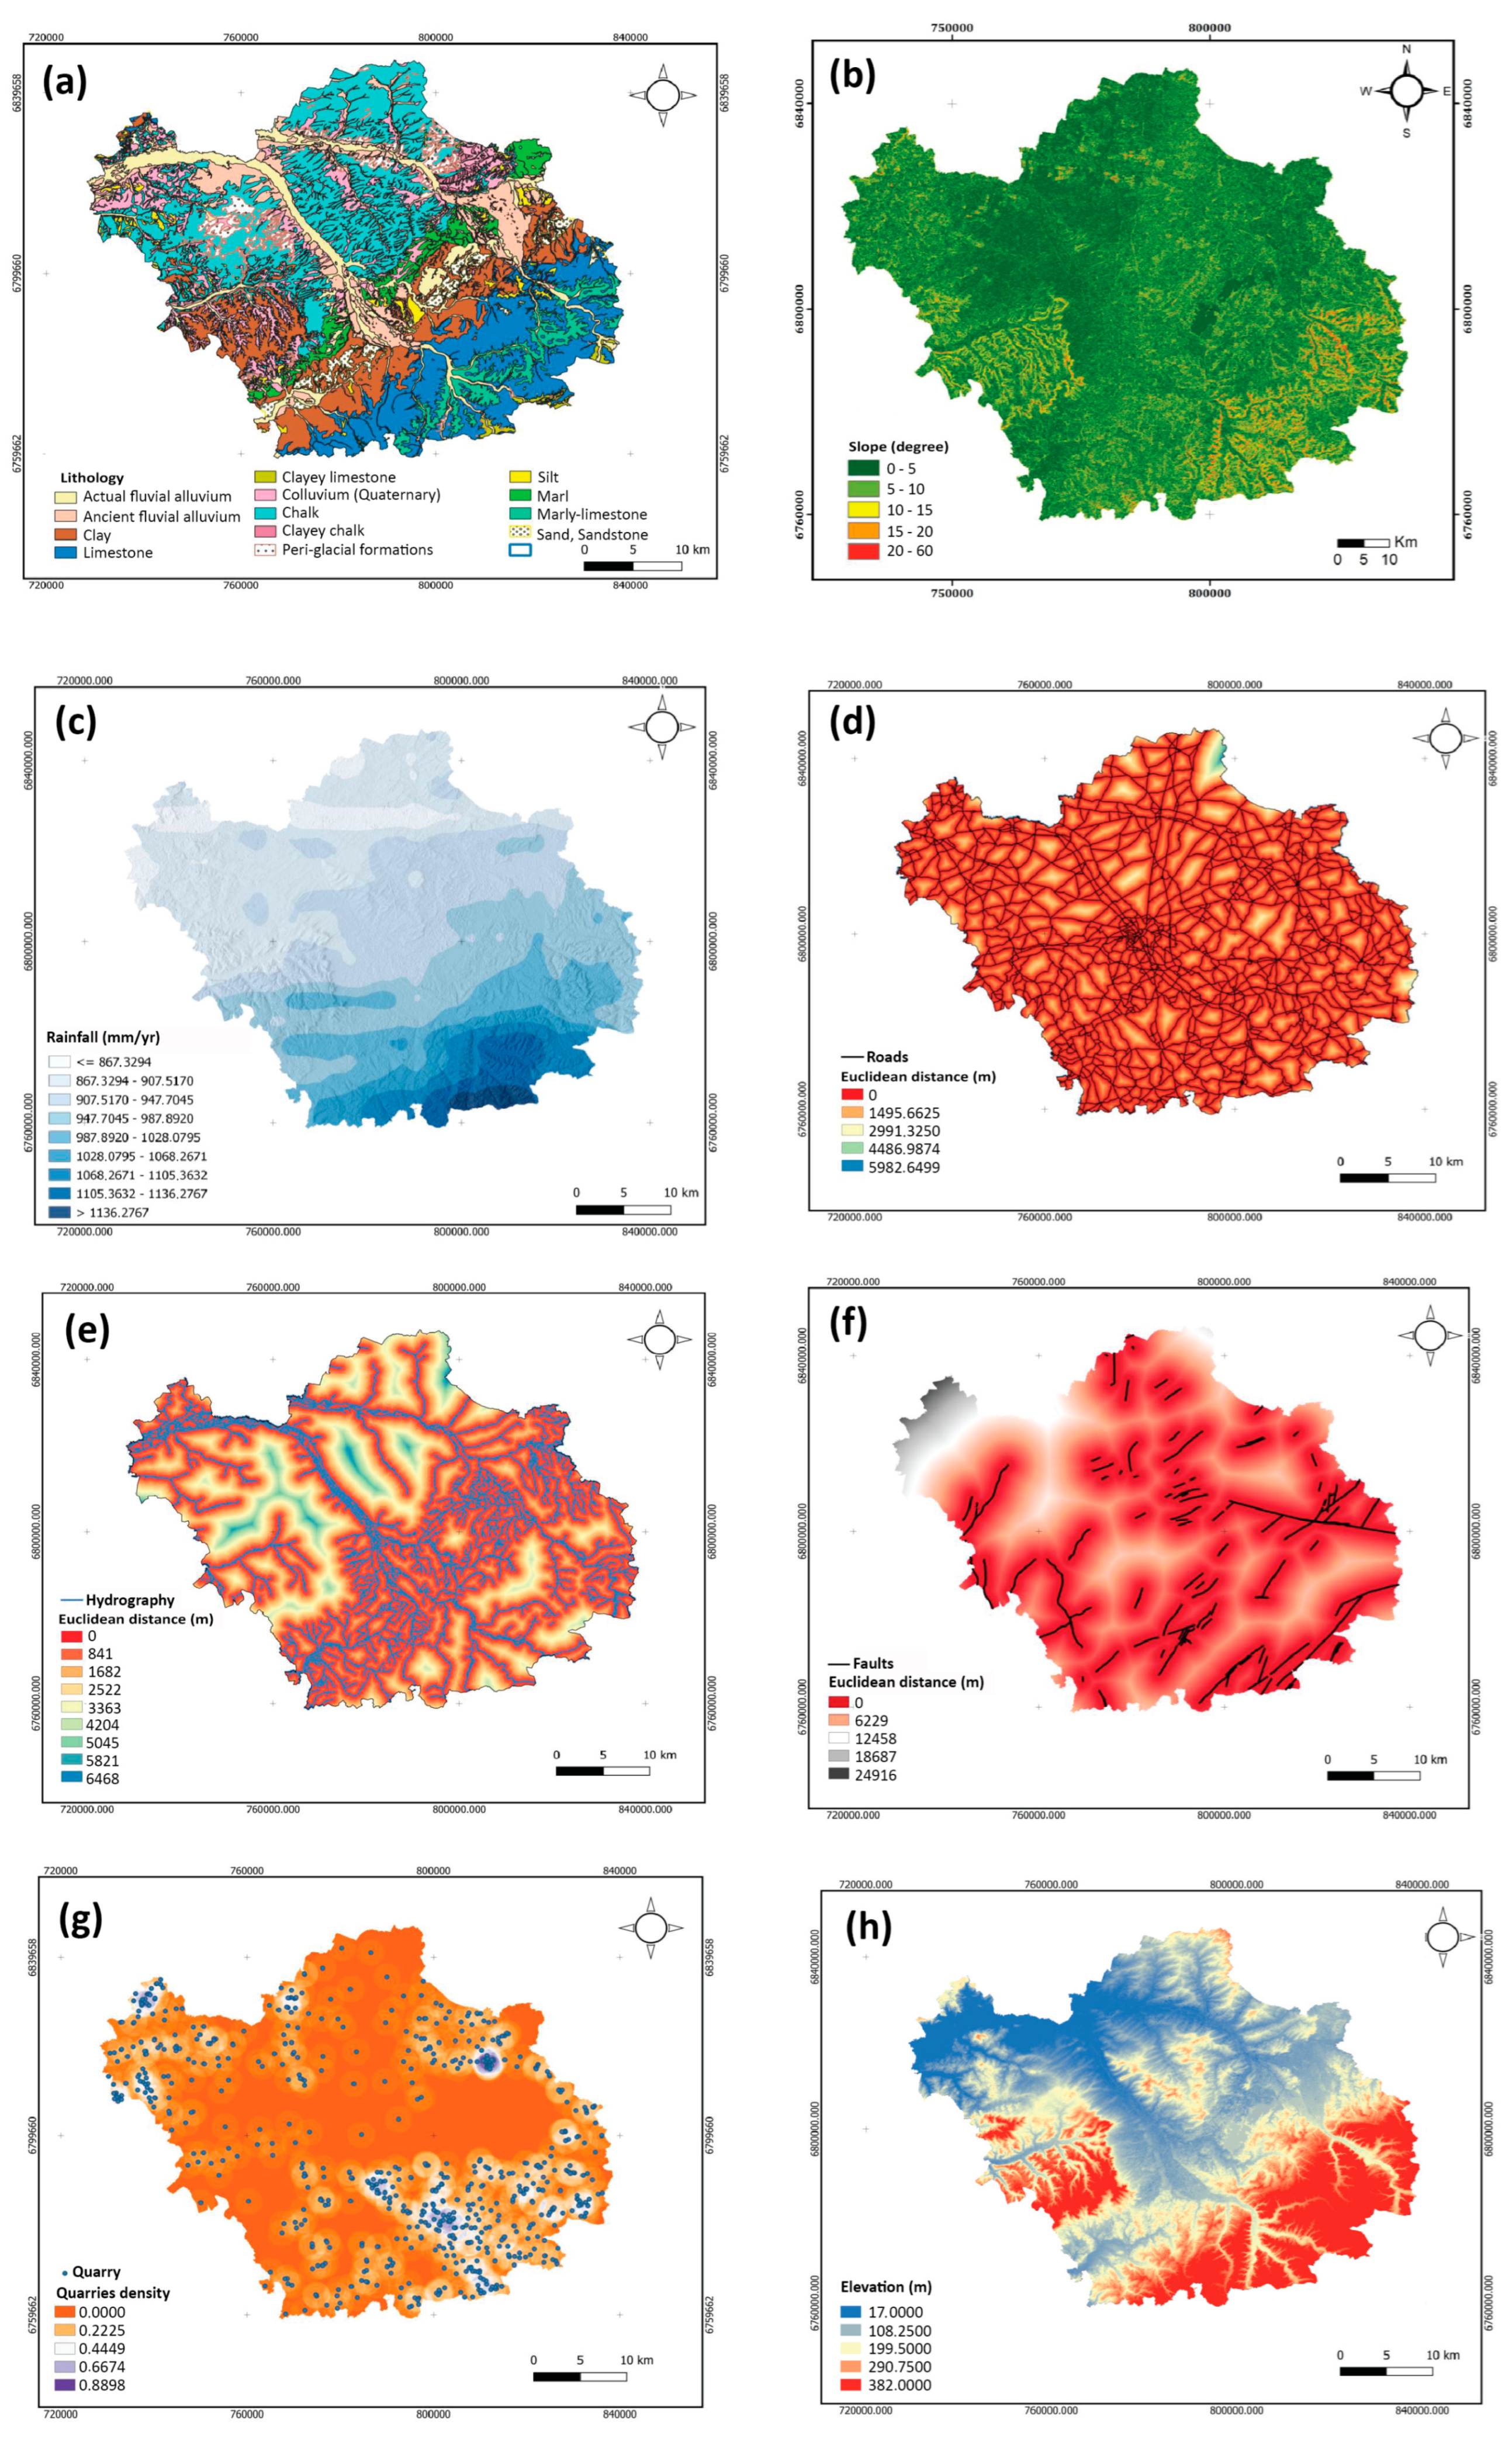
2.3. Controlling Factors Thematic Layers
- Lithology
- Slope
- Rainfall
- Road
- Hydrology
- Fault
- Quarry’s density
- Elevation
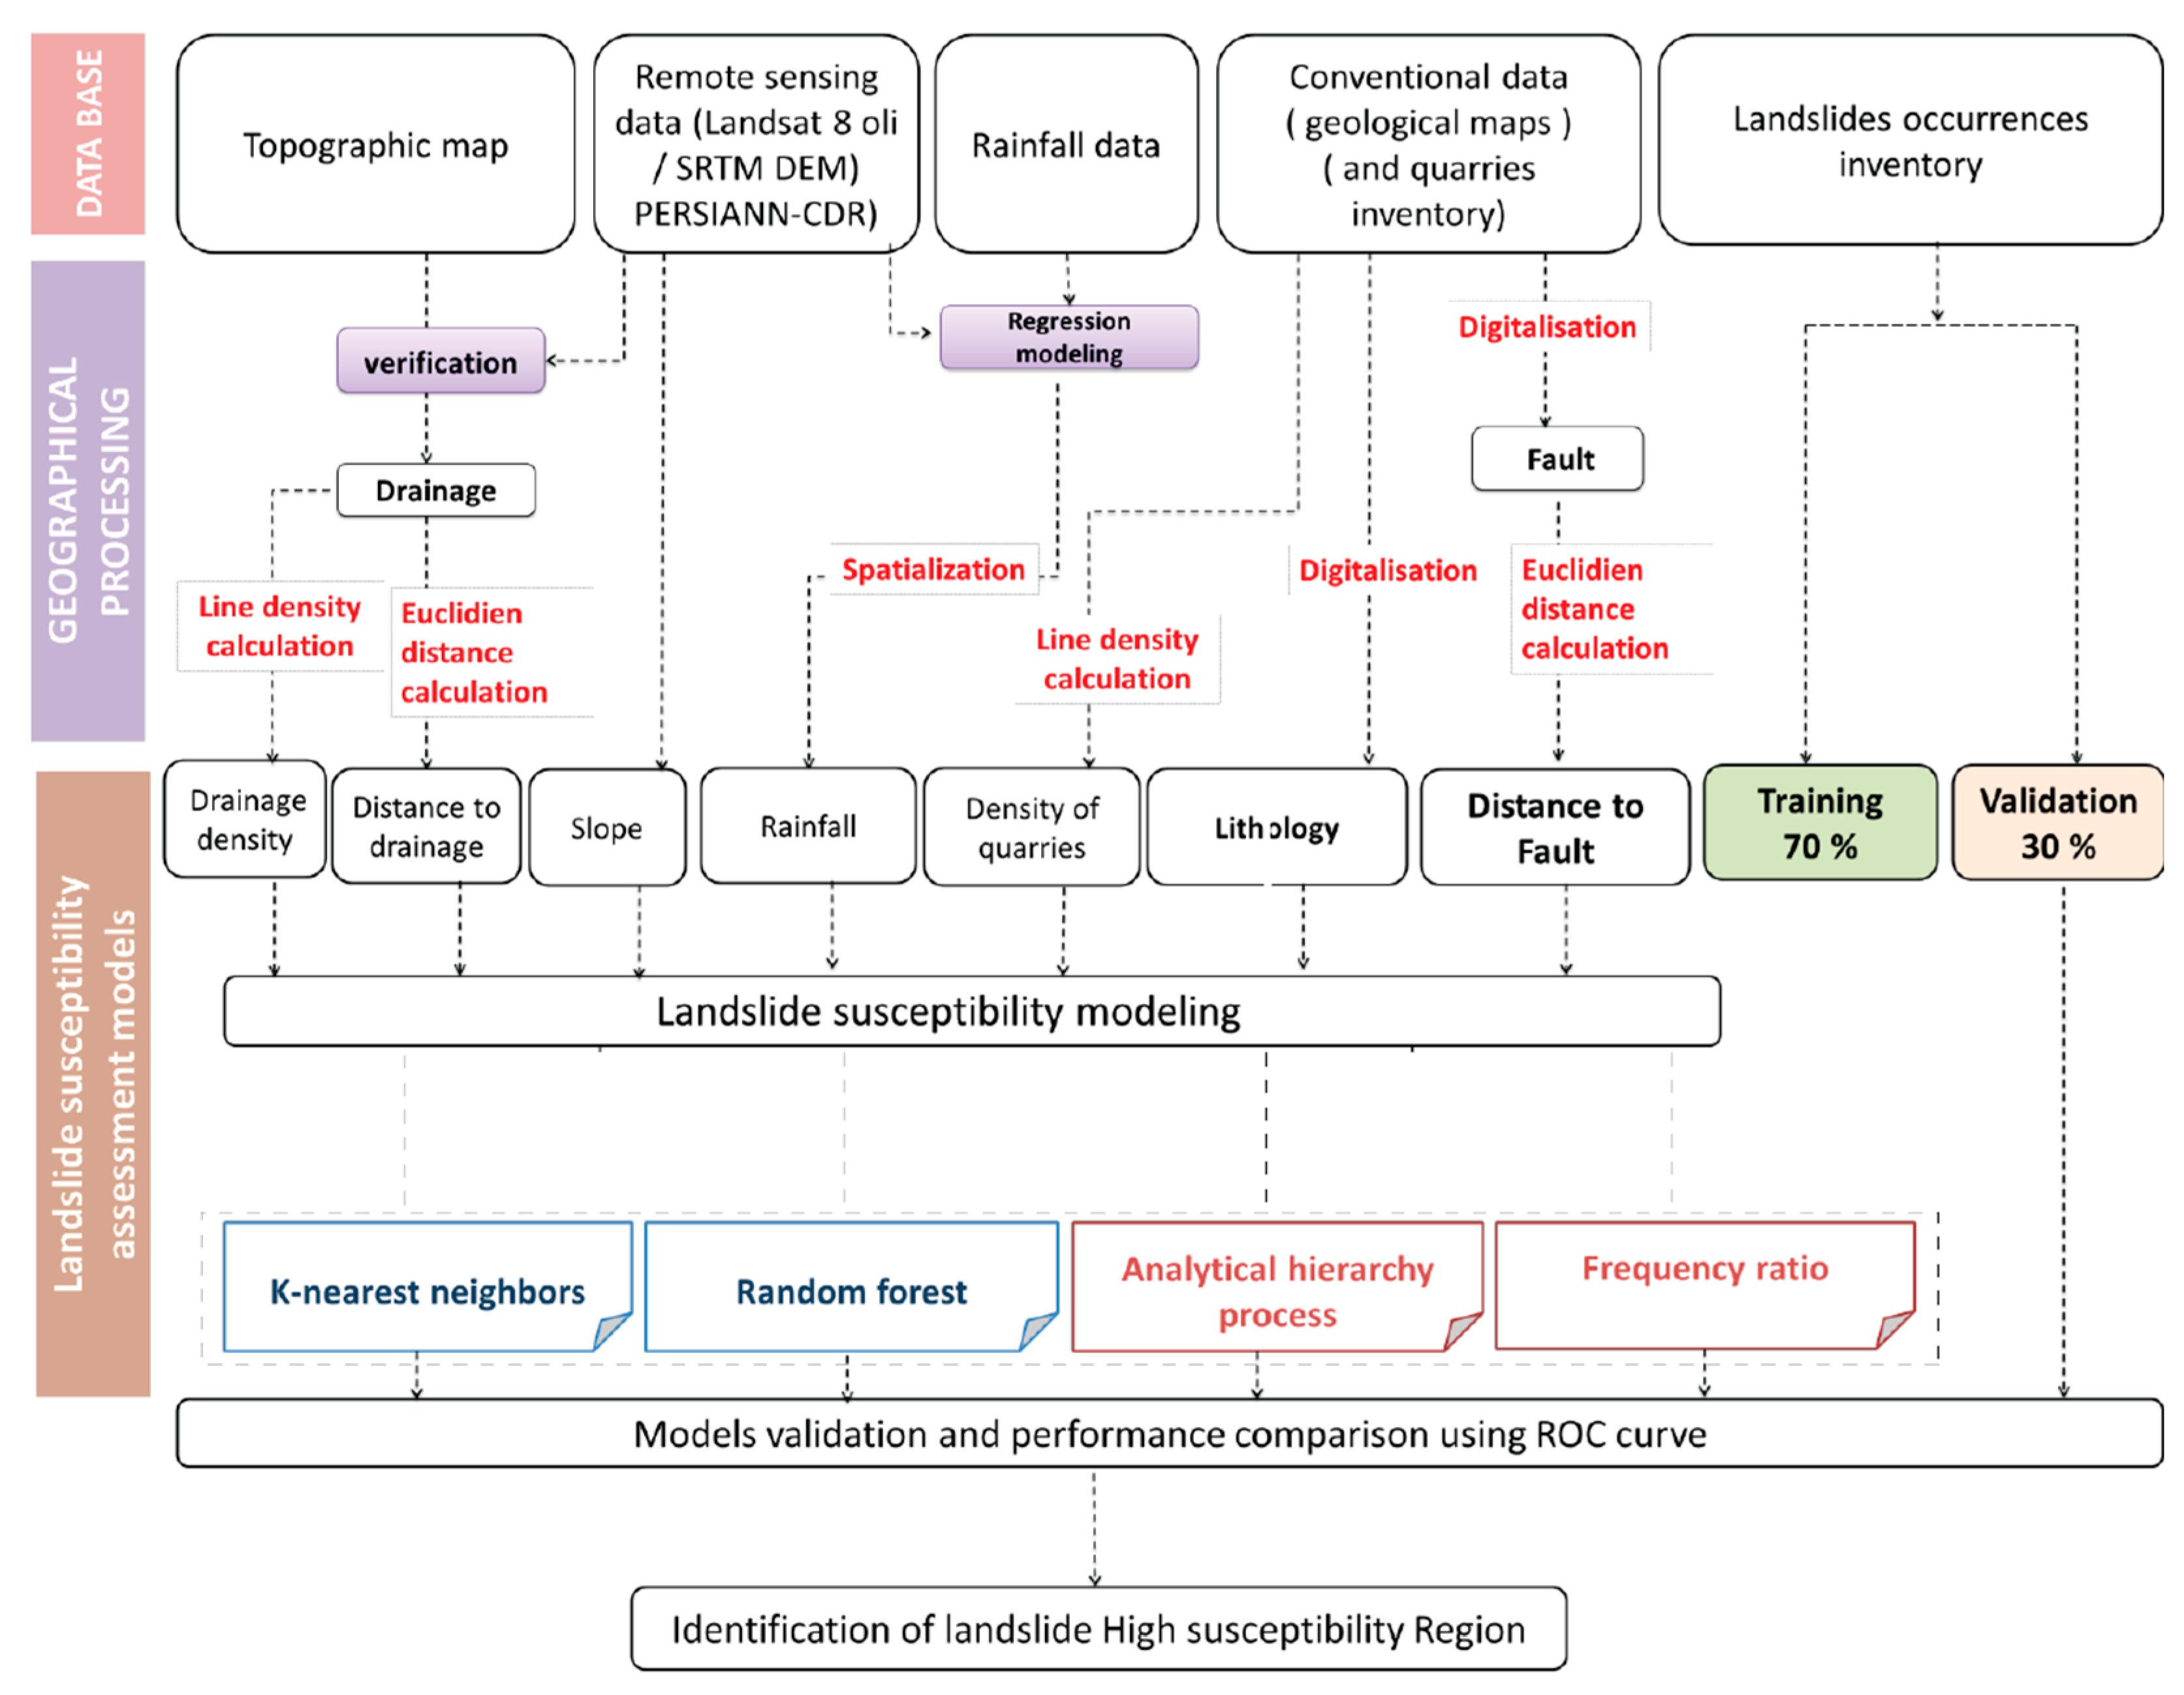
3. Methods
3.1. Analytic Hierarchy Process (AHP)
3.2. Frequency Ratio (FR)
3.3. k-Nearest Neighbor (k-NN)
3.4. Random Forest (RF)
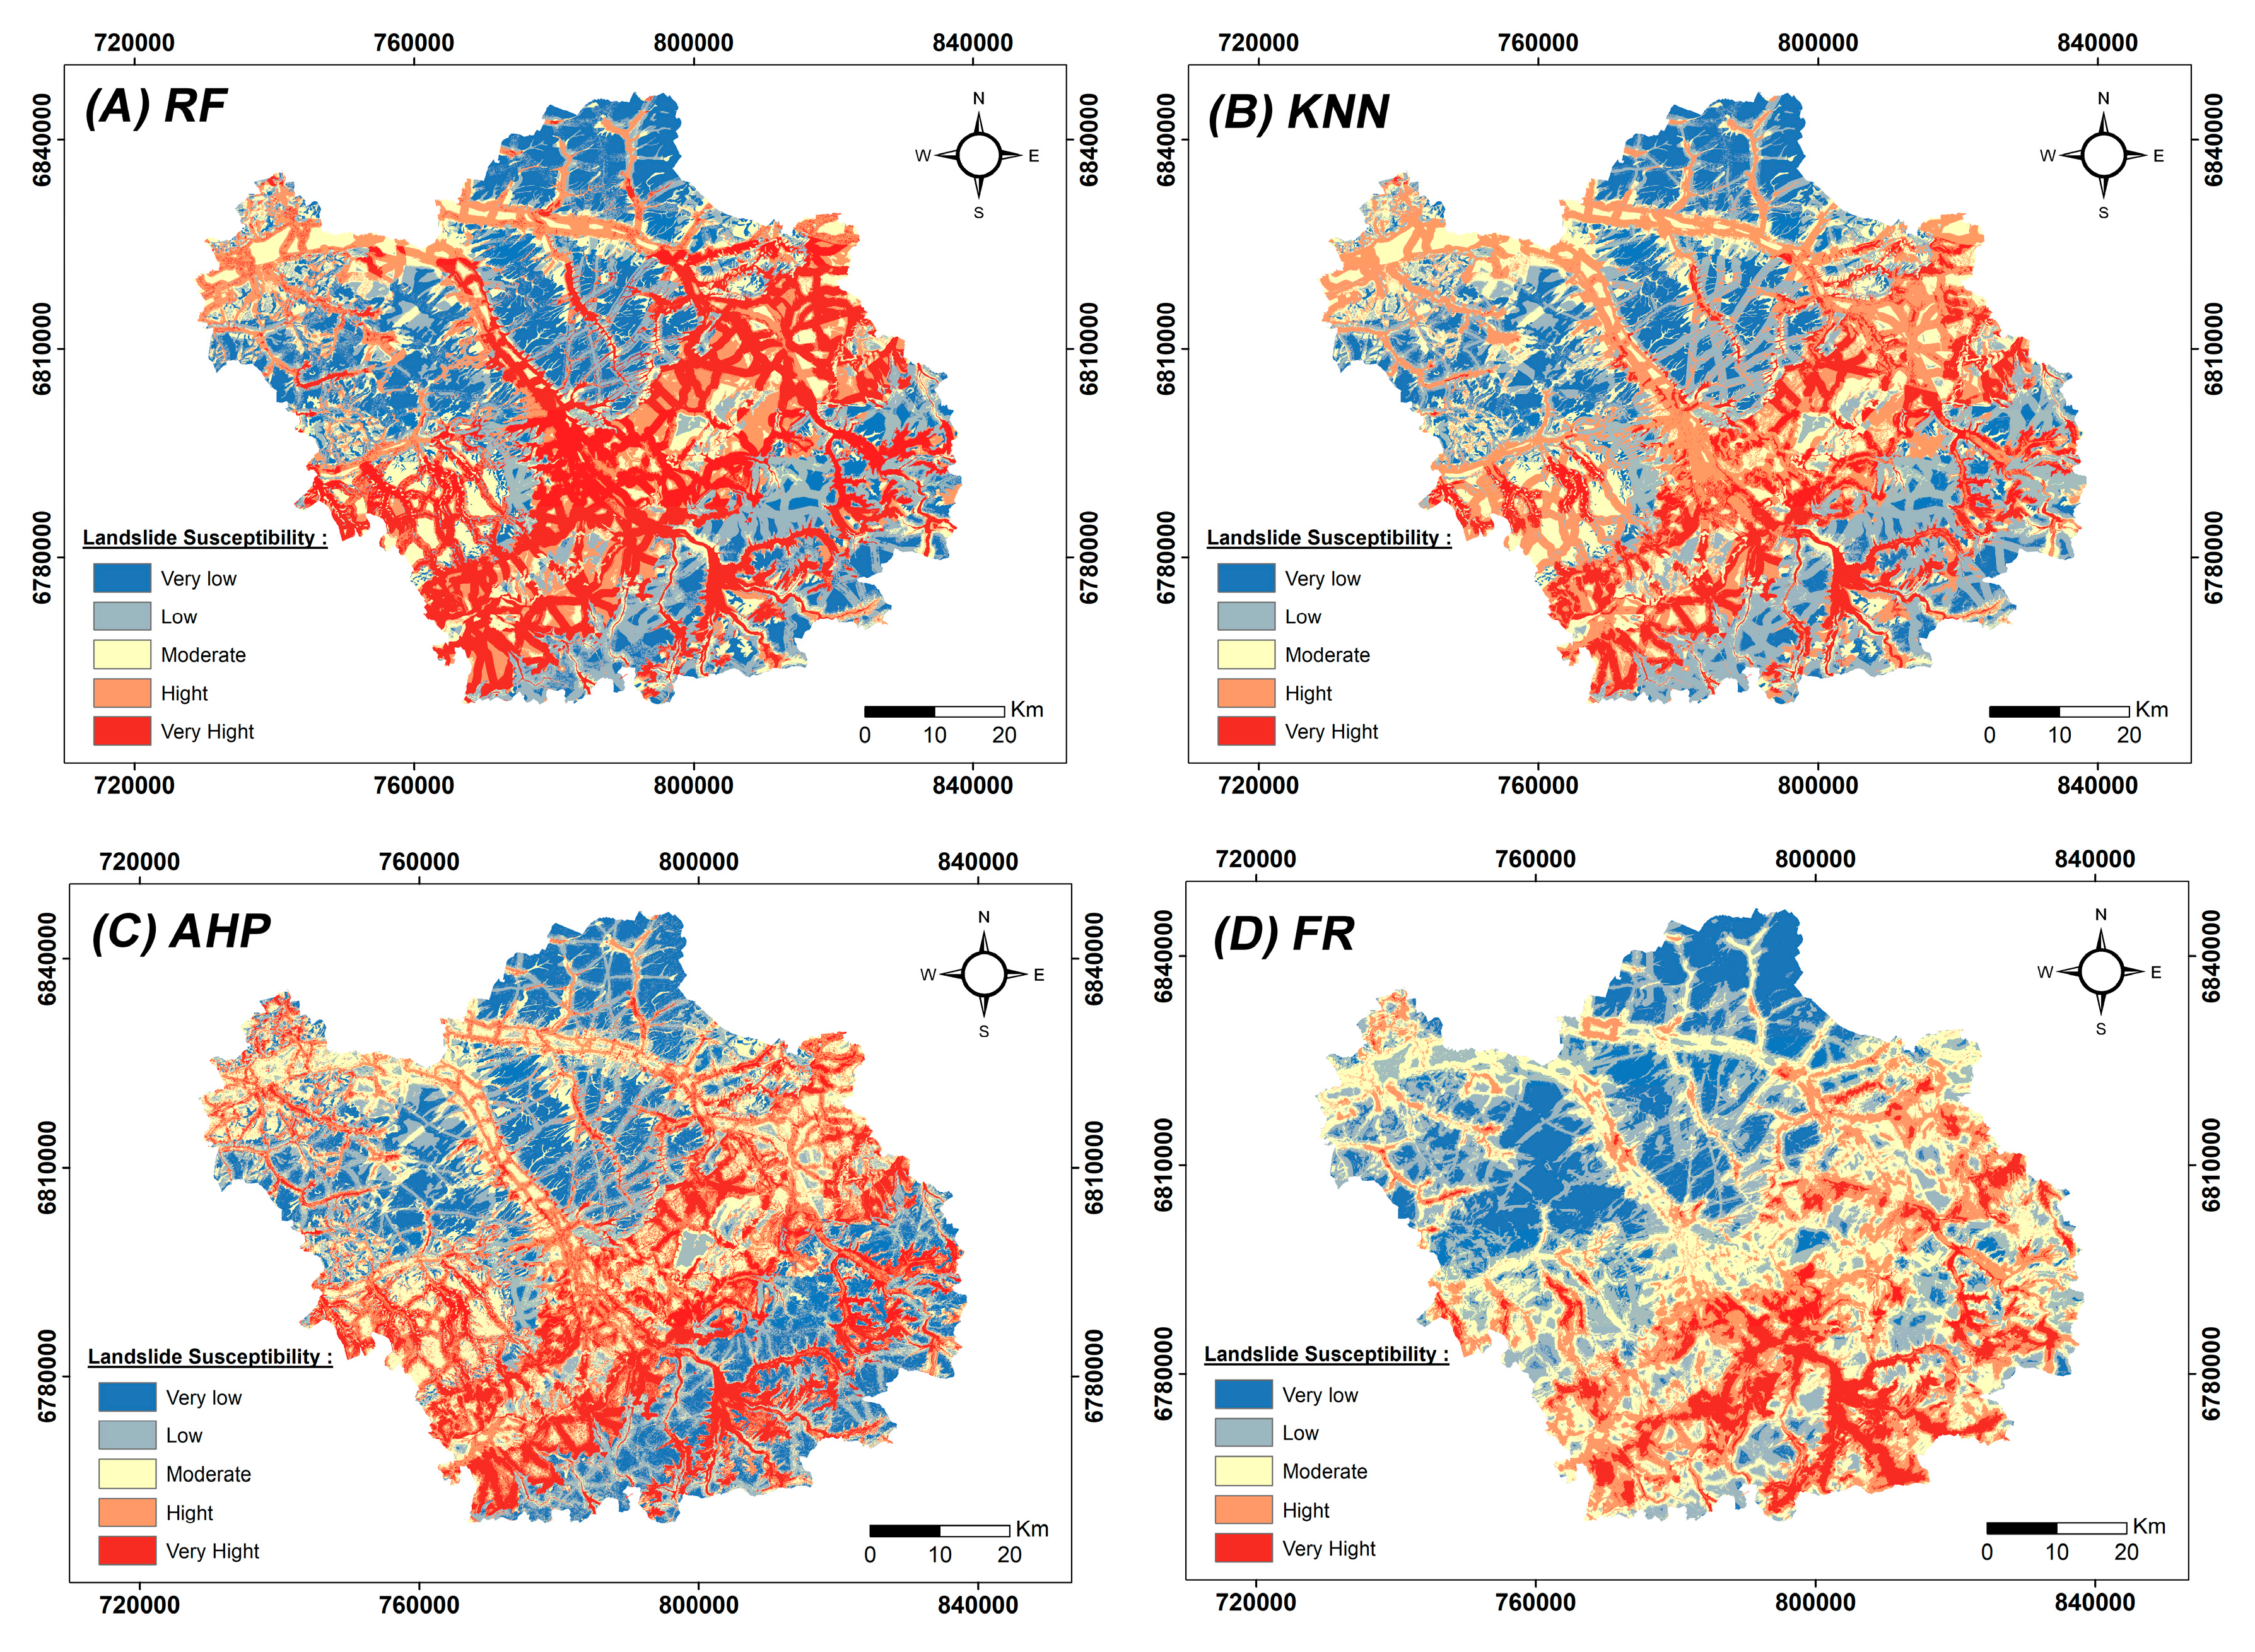
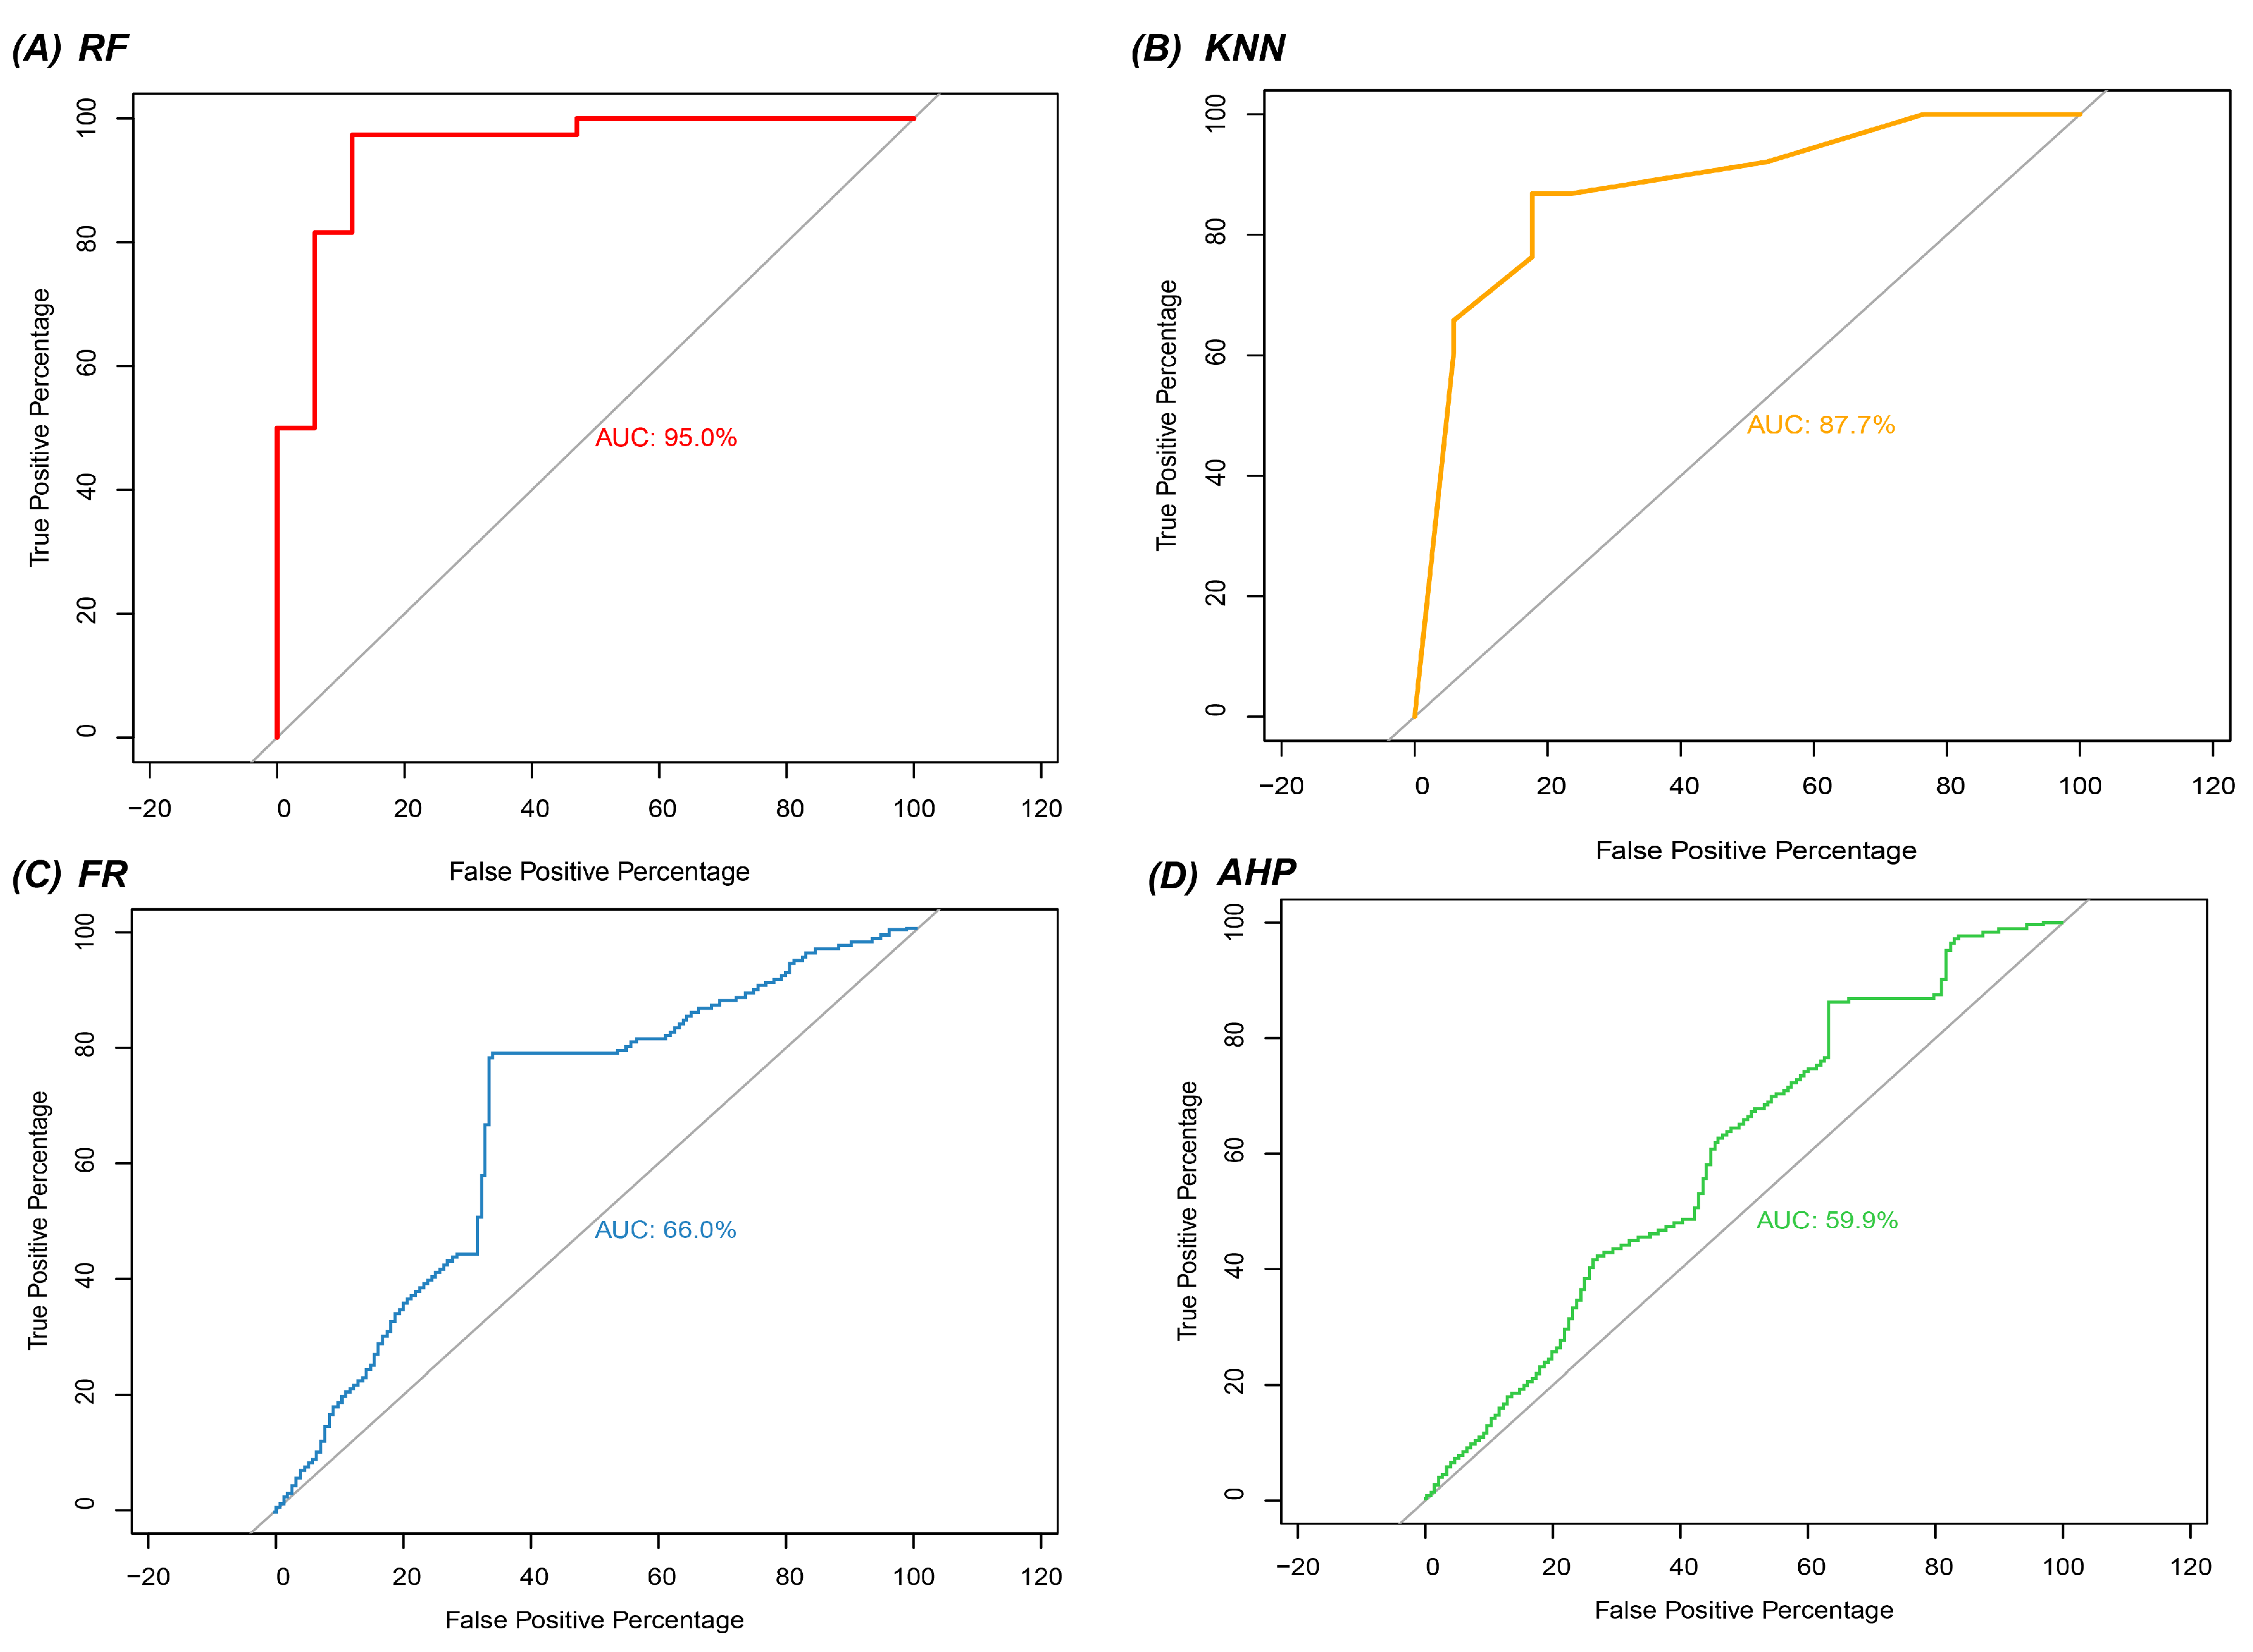
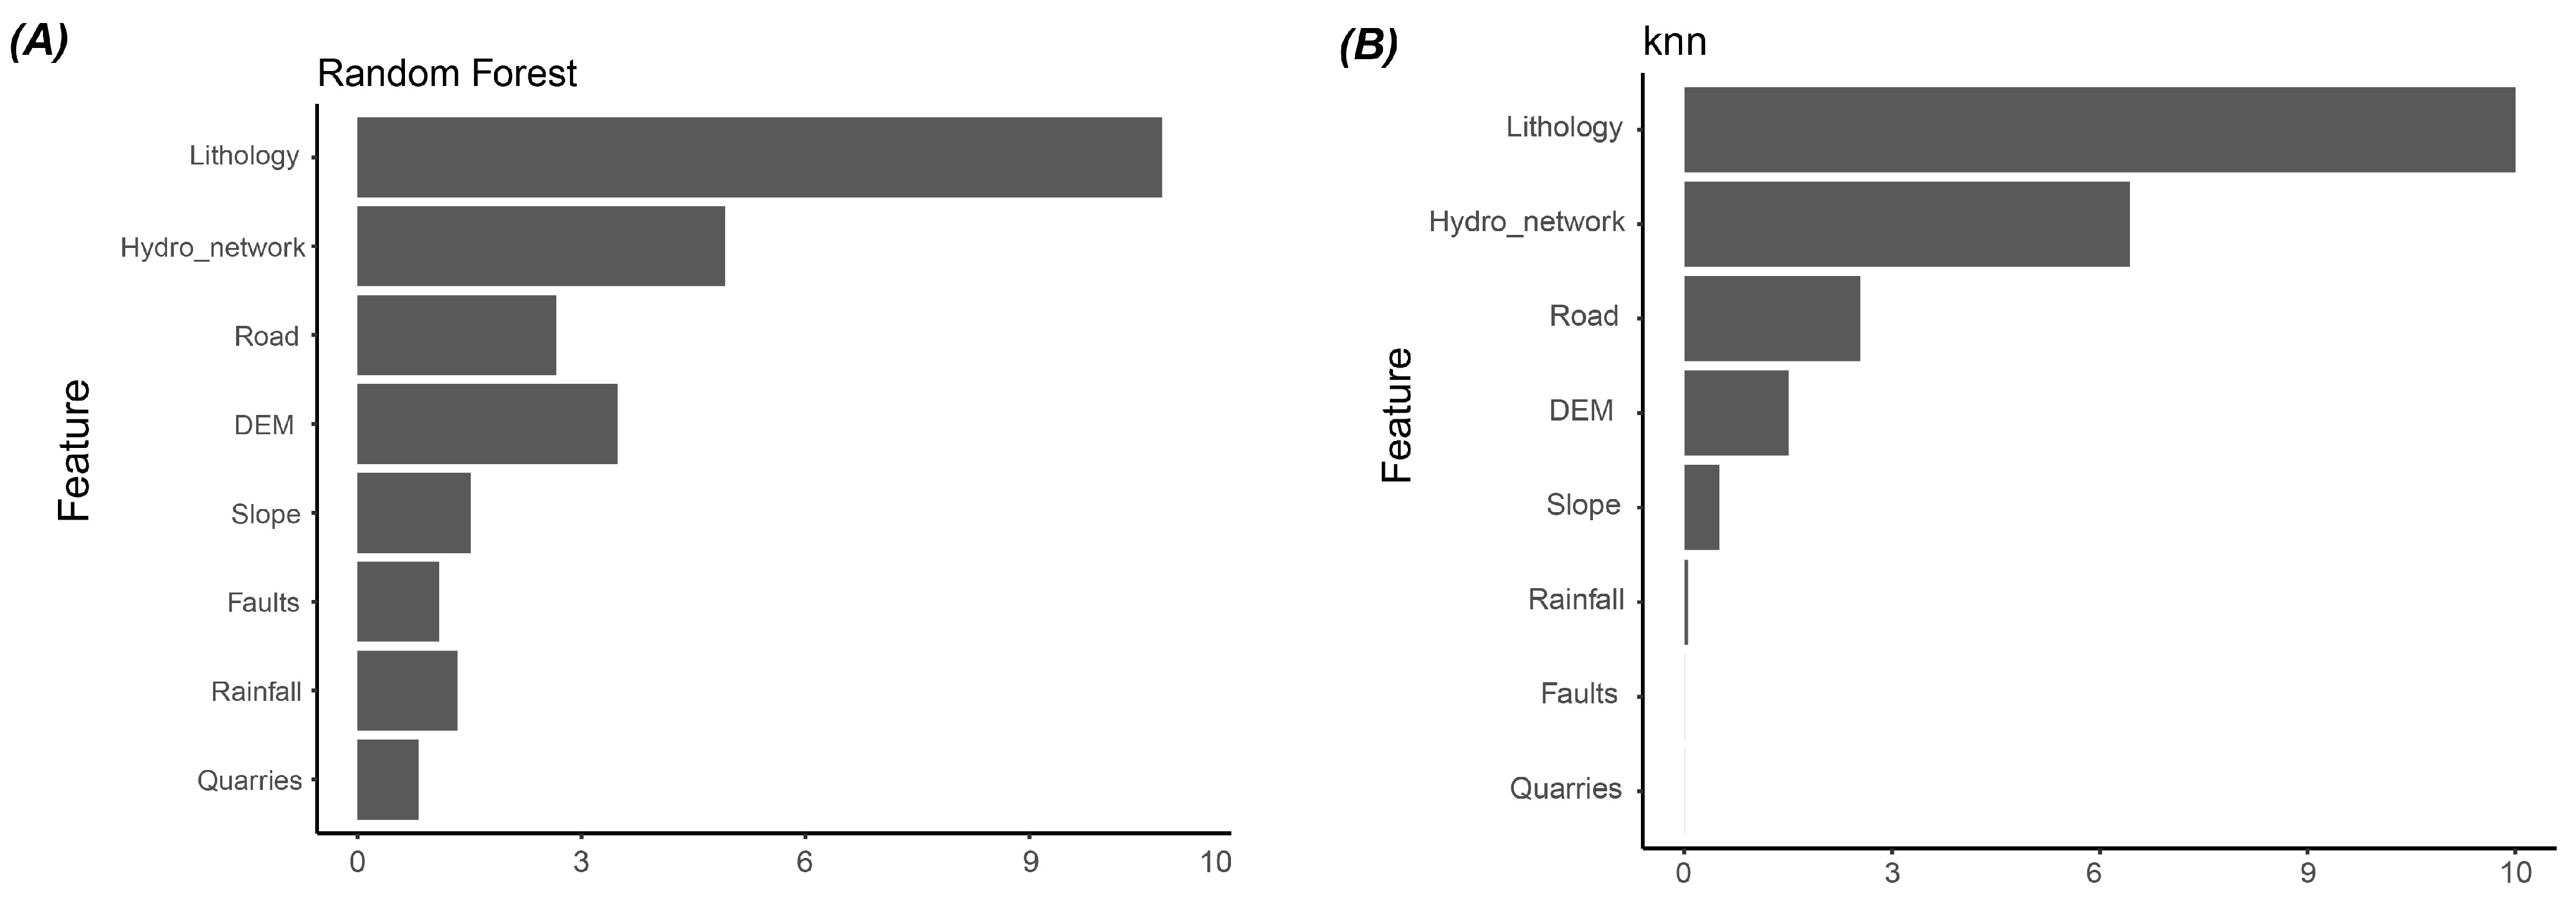
4. Results
5. Discussions
6. Conclusions
Author Contributions
Funding
Data Availability Statement
Acknowledgments
Conflicts of Interest
References
- Wallemacq, P.; House, R. Economic Losses, Poverty & Disasters 1998–2017; Centre for Research on the Epidemiology of Disasters: Brussels, Belgium; United Nations Office for Disaster Risk Reduction: Geneva, Switzerland, 2018. [Google Scholar]
- Zhang, X.; Li, L.; Xu, C. Large-scale landslide inventory and their mobility in Lvliang City, Shanxi Province, China. Nat. Hazards Res. 2022, 2, 111–120. [Google Scholar] [CrossRef]
- Van Westen, C.J. The modelling of landslide hazards using GIS. Surv. Geophys. 2000, 21, 241–255. [Google Scholar] [CrossRef]
- El Jazouli, A.; Barakat, A.; Khellouk, R. GIS-multicriteria evaluation using AHP for landslide susceptibility mapping in Oum Er Rbia high basin (Morocco). Geoenviron. Disasters 2019, 6, 3. [Google Scholar] [CrossRef]
- Saaty, T.L. A scaling method for priorities in hierarchical structures. J. Math. Psychol. 1980, 15, 234–281. [Google Scholar] [CrossRef]
- Yang, J.; Song, C.; Yang, Y.; Xu, C.; Guo, F.; Xie, L. New method for landslide susceptibility mapping supported by spatial logistic regression and GeoDetector: A case study of Duwen Highway Basin, Sichuan Province, China. Geomorphology 2019, 324, 62–71. [Google Scholar] [CrossRef]
- Polykretis, C.; Chalkias, C. Comparison and evaluation of landslide susceptibility maps obtained from weight of evidence, logistic regression, and artificial neural network models. Nat. Hazards 2018, 93, 249–274. [Google Scholar] [CrossRef]
- Pradhan, B. Landslide susceptibility mapping of a catchment area using frequency ratio, fuzzy logic and multivariate logistic regression approaches. J. Indian Soc. Remote Sens. 2010, 38, 301–320. [Google Scholar] [CrossRef]
- Akinci, H.; Yavuz Ozalp, A. Landslide susceptibility mapping and hazard assessment in Artvin (Turkey) using frequency ratio and modified information value model. Acta Geophys. 2021, 69, 725–745. [Google Scholar] [CrossRef]
- Kilicoglu, C. Investigation of the effects of approaches used in the production of training and validation data sets on the accuracy of landslide susceptibility mapping models: Samsun (Turkey) example. Arab. J. Geosci. 2021, 14, 2106. [Google Scholar] [CrossRef]
- Chen, W.; Xie, X.; Peng, J.; Shahabi, H.; Hong, H.; Bui, D.T.; Duan, Z.; Li, S.; Zhu, A.-X. GIS-based landslide susceptibility evaluation using a novel hybrid integration approach of bivariate statistical based random forest method. Catena 2018, 164, 135–149. [Google Scholar] [CrossRef]
- Hussain, M.A.; Chen, Z.; Kalsoom, I.; Asghar, A.; Shoaib, M. Landslide susceptibility mapping using machine learning algorithm: A case study along Karakoram Highway (KKH), Pakistan. J. Indian Soc. Remote Sens. 2022, 50, 849–866. [Google Scholar] [CrossRef]
- Yeon, Y.-K.; Han, J.-G.; Ryu, K.H. Landslide susceptibility mapping in Injae, Korea, using a decision tree. Eng. Geol. 2010, 116, 274–283. [Google Scholar] [CrossRef]
- Dou, J.; Yunus, A.P.; Bui, D.T.; Merghadi, A.; Sahana, M.; Zhu, Z.; Chen, C.-W.; Han, Z.; Pham, B.T. Improved landslide assessment using support vector machine with bagging, boosting, and stacking ensemble machine learning framework in a mountainous watershed, Japan. Landslides 2020, 17, 641–658. [Google Scholar] [CrossRef]
- Deng, Q.-X.; He, J.; Cao, Z.-J.; Papaioannou, I.; Li, D.-Q.; Phoon, K.-K. Bayesian learning of Gaussian mixture model for calculating debris flow exceedance probability. Georisk Assess. Manag. Risk Eng. Syst. Geohazards 2022, 16, 154–177. [Google Scholar] [CrossRef]
- Wang, Z.; Liu, Q.; Liu, Y. Mapping landslide susceptibility using machine learning algorithms and GIS: A case study in Shexian County, Anhui Province, China. Symmetry 2020, 12, 1954. [Google Scholar] [CrossRef]
- Ghasemian, B.; Shahabi, H.; Shirzadi, A.; Al-Ansari, N.; Jaafari, A.; Kress, V.R.; Geertsema, M.; Renoud, S.; Ahmad, A. A robust deep-learning model for landslide susceptibility mapping: A case study of Kurdistan Province, Iran. Sensors 2022, 22, 1573. [Google Scholar] [CrossRef]
- Lai, J.-S.; Tsai, F. Improving GIS-based landslide susceptibility assessments with multi-temporal remote sensing and machine learning. Sensors 2019, 19, 3717. [Google Scholar] [CrossRef] [PubMed]
- Yu, L.; Zhou, C.; Wang, Y.; Cao, Y.; Peres, D.J. Coupling Data-and Knowledge-Driven Methods for Landslide Susceptibility Mapping in Human-Modified Environments: A Case Study from Wanzhou County, Three Gorges Reservoir Area, China. Remote Sens. 2022, 14, 774. [Google Scholar] [CrossRef]
- Alkhasawneh, M.S.; Ngah, U.K.; Tay, L.T.; Mat Isa, N.A.; Al-Batah, M.S. Determination of important topographic factors for landslide mapping analysis using MLP network. Sci. World J. 2013, 2013, 415023. [Google Scholar] [CrossRef] [PubMed]
- Gunzburger, Y.; Merrien-Soukatchoff, V.; Guglielmi, Y. Influence of daily surface temperature fluctuations on rock slope stability: Case study of the Rochers de Valabres slope (France). Int. J. Rock Mech. Min. Sci. 2005, 42, 331–349. [Google Scholar] [CrossRef]
- Regmi, A.D.; Devkota, K.C.; Yoshida, K.; Pradhan, B.; Pourghasemi, H.R.; Kumamoto, T.; Akgun, A. Application of frequency ratio, statistical index, and weights-of-evidence models and their comparison in landslide susceptibility mapping in Central Nepal Himalaya. Arab. J. Geosci. 2014, 7, 725–742. [Google Scholar] [CrossRef]
- Nwazelibe, V.E.; Unigwe, C.O.; Egbueri, J.C. Testing the performances of different fuzzy overlay methods in GIS-based landslide susceptibility mapping of Udi Province, SE Nigeria. CATENA 2023, 220, 106654. [Google Scholar] [CrossRef]
- Ayalew, L.; Yamagishi, H. The application of GIS-based logistic regression for landslide susceptibility mapping in the Kakuda-Yahiko Mountains, Central Japan. Geomorphology 2005, 65, 15–31. [Google Scholar] [CrossRef]
- Chen, W.; Peng, J.; Hong, H.; Shahabi, H.; Pradhan, B.; Liu, J.; Zhu, A.-X.; Pei, X.; Duan, Z. Landslide susceptibility modelling using GIS-based machine learning techniques for Chongren County, Jiangxi Province, China. Sci. Total Environ. 2018, 626, 1121–1135. [Google Scholar] [CrossRef] [PubMed]
- Althuwaynee, O.F.; Pradhan, B. Semi-quantitative landslide risk assessment using GIS-based exposure analysis in Kuala Lumpur City. Geomat. Nat. Hazards Risk 2017, 8, 706–732. [Google Scholar] [CrossRef]
- Lee, S. Application of logistic regression model and its validation for landslide susceptibility mapping using GIS and remote sensing data. Int. J. Remote Sens. 2005, 26, 1477–1491. [Google Scholar] [CrossRef]
- Park, S.; Choi, C.; Kim, B.; Kim, J. Landslide susceptibility mapping using frequency ratio, analytic hierarchy process, logistic regression, and artificial neural network methods at the Inje area, Korea. Environ. Earth Sci. 2013, 68, 1443–1464. [Google Scholar] [CrossRef]
- Ray, P.C.; Parvaiz, I.; Jayangondaperumal, R.; Thakur, V.; Dadhwal, V.; Bhat, F. Analysis of seismicity-induced landslides due to the 8 October 2005 earthquake in Kashmir Himalaya. Curr. Sci. 2009, 97, 1742–1751. [Google Scholar]
- Ageenko, A.; Hansen, L.C.; Lyng, K.L.; Bodum, L.; Arsanjani, J.J. Landslide susceptibility mapping using machine learning: A Danish case study. ISPRS Int. J. Geo-Inf. 2022, 11, 324. [Google Scholar] [CrossRef]
- Bopche, L.; Rege, P.P. Landslide susceptibility mapping: An integrated approach using geographic information value, remote sensing, and weight of evidence method. Geotech. Geol. Eng. 2022, 40, 2935–2947. [Google Scholar] [CrossRef]
- Panchal, S.; Shrivastava, A.K. Landslide hazard assessment using analytic hierarchy process (AHP): A case study of National Highway 5 in India. Ain Shams Eng. J. 2022, 13, 101626. [Google Scholar] [CrossRef]
- El Morjani, Z.E.A. Conception D’un Système D’information à Référence Spatiale Pour la Gestion Environnementale: Application à la Sélection de Sites Potentiels de Stockage de Déchets Ménagers et Industriels en Région Semi-Aride (Souss, Maroc); University of Geneva: Geneva, Switzerland, 2002. [Google Scholar]
- Fashae, O.A.; Tijani, M.N.; Talabi, A.O.; Adedeji, O.I. Delineation of groundwater potential zones in the crystalline basement terrain of SW-Nigeria: An integrated GIS and remote sensing approach. Appl. Water Sci. 2014, 4, 19–38. [Google Scholar] [CrossRef]
- Ait Naceur, H.; Igmoulan, B.; Namous, M.; Amrhar, M.; Bourouay, O.; Ouayah, M.; Jadoud, M. A comparative study of different machine learning methods coupled with GIS for landslide susceptibility assessment: A case study of N’fis basin, Marrakesh High Atlas (Morocco). Arab. J. Geosci. 2022, 15, 1100. [Google Scholar] [CrossRef]
- Fix, E.; Hodges, J. Discriminatory Analysis, Nonparametric Discrimination; Tex., Project 21-49-004, Rep. 4, Contract AF-41- (128)-31; U.S. Air Force School of Aviation Medicine, Randolph Field: Montgomery County, OH, USA, 1951. [Google Scholar]
- Breiman, L. Random forests. Mach. Learn. 2001, 45, 5–32. [Google Scholar] [CrossRef]
- Díaz-Uriarte, R.; Alvarez de Andrés, S. Gene selection and classification of microarray data using random forest. BMC Bioinform. 2006, 7, 3. [Google Scholar] [CrossRef]
- Zhu, A.-X.; Miao, Y.; Liu, J.; Bai, S.; Zeng, C.; Ma, T.; Hong, H. A similarity-based approach to sampling absence data for landslide susceptibility mapping using data-driven methods. Catena 2019, 183, 104188. [Google Scholar] [CrossRef]
- Hajaj, S.; El Harti, A.; Jellouli, A.; Pour, A.B.; Mnissar Himyari, S.; Hamzaoui, A.; Hashim, M. Evaluating the Performance of Machine Learning and Deep Learning Techniques to HyMap Imagery for Lithological Mapping in a Semi-Arid Region: Case Study from Western Anti-Atlas, Morocco. Minerals 2023, 13, 766. [Google Scholar] [CrossRef]
- Luo, W.; Liu, C.-C. Innovative landslide susceptibility mapping supported by geomorphon and geographical detector methods. Landslides 2018, 15, 465–474. [Google Scholar] [CrossRef]
- Pham, B.T.; Bui, D.T.; Prakash, I.; Dholakia, M. Hybrid integration of Multilayer Perceptron Neural Networks and machine learning ensembles for landslide susceptibility assessment at Himalayan area (India) using GIS. Catena 2017, 149, 52–63. [Google Scholar] [CrossRef]
- Yu, L.; Cao, Y.; Zhou, C.; Wang, Y.; Huo, Z. Landslide susceptibility mapping combining information gain ratio and support vector machines: A case study from Wushan segment in the Three Gorges Reservoir area, China. Appl. Sci. 2019, 9, 4756. [Google Scholar] [CrossRef]
- Zhang, T.-Y.; Han, L.; Zhang, H.; Zhao, Y.-H.; Li, X.-A.; Zhao, L. GIS-based landslide susceptibility mapping using hybrid integration approaches of fractal dimension with index of entropy and support vector machine. J. Mt. Sci. 2019, 16, 1275–1288. [Google Scholar] [CrossRef]
- Zhang, W.; Gu, X.; Tang, L.; Yin, Y.; Liu, D.; Zhang, Y. Application of machine learning, deep learning and optimization algorithms in geoengineering and geoscience: Comprehensive review and future challenge. Gondwana Res. 2022, 109, 1–17. [Google Scholar] [CrossRef]
- Zeng, T.; Wu, L.; Peduto, D.; Glade, T.; Hayakawa, Y.S.; Yin, K. Ensemble learning framework for landslide susceptibility mapping: Different basic classifier and ensemble strategy. Geosci. Front. 2023, 14, 101645. [Google Scholar] [CrossRef]


| Triggering Factors | Data Source |
|---|---|
| Elevation | ASTER-DEM-30 m resolution (https://earthexplorer.usgs.gov), accessed on 5 October 2021. |
| Lithology | Geological map of the Aube department by BRGM (scale 1:25,000) |
| Slope | Extracted from ASTER-DEM (30 m resolution) |
| Precipitations | Obtained from a time series of PERSIANN-CDR (Resolution: 0.04 degrees). |
| Proximity to roads | Derived from GIS data of the IGN database |
| Proximity to drainage | Derived from GIS data of the IGN database |
| Density of quarries | Generated from points collected by BRGM (.xls format) |
| Faults density | Geological map of the department of Aube, France (scale 1:25,000). |
| Factors | Elevation | Fault | Hydrology | Lithology | Quarries | Rainfall | Road | Slope |
|---|---|---|---|---|---|---|---|---|
| VIF | 3.6453 | 1.1516 | 1.6088 | 1.2097 | 1.3613 | 3.3052 | 1.1283 | 1.0367 |
| Factor | Lithology | Slope | Precipitation | Elevation | Distance-Roads | Distance-Drainage | Density of Quarries | Distance-Faults |
|---|---|---|---|---|---|---|---|---|
| Lithology | 1 | 2 | 3 | 3 | 4 | 4 | 6 | 8 |
| slope | 1 | 3 | 4 | 3 | 3 | 5 | 6 | |
| precipitation | 1 | 1/2 | 2 | 2 | 4 | 5 | ||
| Elevation | 1 | 3 | 4 | 6 | 8 | |||
| Distance to roads | 1 | 2 | 3 | 3 | ||||
| Distance to hydrography | 1 | 3 | 1 | |||||
| Quarries density | 1 | 2 | ||||||
| Distance to faults | 1 |
| n | 1 | 2 | 3 | 4 | 5 | 6 | 7 | 8 | 9 | 10 |
|---|---|---|---|---|---|---|---|---|---|---|
| (RCI) | 0 | 0 | 0.58 | 0.90 | 1.12 | 1.24 | 1.32 | 1.41 | 1.45 | 1.49 |
| Factor | Classes | Area (Pixels) | Area (%) | Landslide (Pixels) | Landslide (%) | FR | AHP | |
|---|---|---|---|---|---|---|---|---|
| Assigned Rate | Weight % | |||||||
| Slope | 0–5 | 3,824,230 | 57.150 | 9985 | 57.378 | 1.003 | 2 | 23% |
| 0–10 | 2,167,308 | 32.400 | 5482 | 31.502 | 0.971 | 4 | ||
| 10–15 | 515,048 | 7.700 | 1295 | 7.442 | 0.966 | 7 | ||
| 15–20 | 132,478 | 1.970 | 408 | 2.345 | 1.189 | 8 | ||
| >20 | 52,169 | 0.770 | 232 | 1.333 | 1.730 | 10 | ||
| Density of quarries | 0–0.07 | 3,044,553 | 45.500 | 6091 | 35.002 | 0.768 | 2 | 3.5% |
| 0.07–0.2 | 2,253,187 | 33.670 | 5687 | 32.680 | 0.970 | 4 | ||
| 0.2–0.30 | 814,266 | 12.160 | 3573 | 20.532 | 1.684 | 6 | ||
| 0.3–0.5 | 462,708 | 6.910 | 1634 | 9.390 | 1.358 | 8 | ||
| >0.5 | 116,519 | 1.750 | 423 | 2.431 | 1.388 | 10 | ||
| Distance/ Drainage | 0–250 | 2,863,670 | 42.790 | 4358 | 25.043 | 0.584 | 10 | 5.7% |
| 250–500 | 580,094 | 8.660 | 1042 | 5.988 | 0.691 | 8 | ||
| 500–750 | 752,296 | 11.240 | 1279 | 7.350 | 0.653 | 6 | ||
| 750–1000 | 1,000,062 | 14.940 | 2948 | 16.941 | 1.134 | 2 | ||
| >1000 | 1,495,111 | 22.340 | 7781 | 44.713 | 2.001 | 1 | ||
| Distance/fault | 0–500 | 4,371,259 | 65.328 | 10,829 | 62.228 | 0.951 | 10 | 3% |
| 500–1000 | 572,063 | 8.549 | 1052 | 6.045 | 0.707 | 10 | ||
| 1000–1500 | 575,109 | 8.595 | 1537 | 8.832 | 1.027 | 8 | ||
| 1500–2000 | 575,109 | 8.595 | 1427 | 8.200 | 0.954 | 6 | ||
| >2000 | 597,693 | 8.932 | 2563 | 14.728 | 1.648 | 4 | ||
| Distance/ Road | 0–200 | 1,566,631 | 23.413 | 735 | 4.224 | 0.180 | 10 | 7.7% |
| 200–400 | 744,322 | 11.124 | 800 | 4.597 | 0.413 | 8 | ||
| 400–600 | 1,069,166 | 15.979 | 1560 | 8.964 | 0.560 | 6 | ||
| 600–800 | 1,404,849 | 20.995 | 3645 | 20.946 | 0.997 | 2 | ||
| >800 | 1,906,265 | 28.489 | 10,668 | 61.303 | 2.152 | 1 | ||
| Precipitation | 830–900 | 1,997,712 | 29.856 | 5999 | 34.473 | 1.154 | 6 | 11% |
| 900–950 | 1,829,344 | 27.339 | 3193 | 18.348 | 0.670 | 7 | ||
| 950–1000 | 1,639,949 | 24.509 | 3123 | 17.946 | 0.732 | 8 | ||
| 1000–1060 | 612,114 | 9.148 | 1475 | 8.476 | 0.925 | 9 | ||
| >1060 | 612,114 | 9.148 | 3618 | 20.791 | 2.270 | 10 | ||
| Elevation | 20 | 634,093 | 9.476 | 3786 | 21.759 | 2.297 | 2 | 16.9% |
| 100 | 3,517,229 | 52.565 | 6381 | 36.672 | 0.697 | 4 | ||
| 200 | 1,554,779 | 23.236 | 4820 | 27.701 | 1.191 | 6 | ||
| 300 | 837,664 | 12.519 | 2048 | 11.770 | 0.939 | 8 | ||
| >300 | 147,468 | 2.204 | 365 | 2.098 | 0.951 | 10 | ||
| Lithology | 1 | 1,019,944 | 15.243 | 4321 | 24.830 | 1.627 | 8 | 29.2% |
| 2 | 1,595,959 | 23.851 | 2528 | 14.527 | 0.608 | 6 | ||
| 3 | 254,879 | 3.809 | 386 | 2.218 | 0.592 | 4 | ||
| 4 | 1,610,862 | 24.074 | 5736 | 32.962 | 1.368 | 2 | ||
| 5 | 2,209,589 | 33.022 | 4428 | 25.445 | 0.770 | 8 | ||
Disclaimer/Publisher’s Note: The statements, opinions and data contained in all publications are solely those of the individual author(s) and contributor(s) and not of MDPI and/or the editor(s). MDPI and/or the editor(s) disclaim responsibility for any injury to people or property resulting from any ideas, methods, instructions or products referred to in the content. |
© 2023 by the authors. Licensee MDPI, Basel, Switzerland. This article is an open access article distributed under the terms and conditions of the Creative Commons Attribution (CC BY) license (https://creativecommons.org/licenses/by/4.0/).
Share and Cite
Jari, A.; Khaddari, A.; Hajaj, S.; Bachaoui, E.M.; Mohammedi, S.; Jellouli, A.; Mosaid, H.; El Harti, A.; Barakat, A. Landslide Susceptibility Mapping Using Multi-Criteria Decision-Making (MCDM), Statistical, and Machine Learning Models in the Aube Department, France. Earth 2023, 4, 698-713. https://doi.org/10.3390/earth4030037
Jari A, Khaddari A, Hajaj S, Bachaoui EM, Mohammedi S, Jellouli A, Mosaid H, El Harti A, Barakat A. Landslide Susceptibility Mapping Using Multi-Criteria Decision-Making (MCDM), Statistical, and Machine Learning Models in the Aube Department, France. Earth. 2023; 4(3):698-713. https://doi.org/10.3390/earth4030037
Chicago/Turabian StyleJari, Abdessamad, Achraf Khaddari, Soufiane Hajaj, El Mostafa Bachaoui, Sabine Mohammedi, Amine Jellouli, Hassan Mosaid, Abderrazak El Harti, and Ahmed Barakat. 2023. "Landslide Susceptibility Mapping Using Multi-Criteria Decision-Making (MCDM), Statistical, and Machine Learning Models in the Aube Department, France" Earth 4, no. 3: 698-713. https://doi.org/10.3390/earth4030037
APA StyleJari, A., Khaddari, A., Hajaj, S., Bachaoui, E. M., Mohammedi, S., Jellouli, A., Mosaid, H., El Harti, A., & Barakat, A. (2023). Landslide Susceptibility Mapping Using Multi-Criteria Decision-Making (MCDM), Statistical, and Machine Learning Models in the Aube Department, France. Earth, 4(3), 698-713. https://doi.org/10.3390/earth4030037