Next Issue
Volume 13, December
Previous Issue
Volume 13, October


Climate, Volume 13, Issue 11 (November 2025) – 21 articles

Cover Story (view full-size image): 
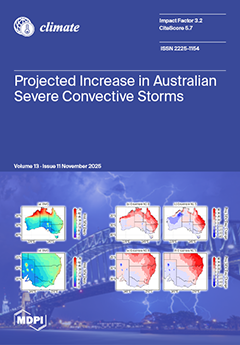
Under high-emission scenarios, this study projects a significant increase in severe thunderstorm risks for Australia in the latter half of the 21st century under climate change. Using high-resolution NARCliM regional climate models, we found that atmospheric instability (CAPE) will rise substantially, overcoming a stronger cap from convective inhibition that suppresses storms. Combined with vertical wind shear, this leads to a more storm-conducive environment, particularly in eastern and southeastern regions. The potential for severe storm days is projected to double during summer, and the storm season is expected to lengthen. These changes imply a future with more frequent and prolonged hazards from large hail, damaging winds, and flash floods. View this paper
  • Issues are regarded as officially published after their release is announced to the table of contents alert mailing list.
  • You may sign up for e-mail alerts to receive table of contents of newly released issues.
  • PDF is the official format for papers published in both, html and pdf forms. To view the papers in pdf format, click on the "PDF Full-text" link, and use the free Adobe Reader to open them.
Order results
Result details
Section
Select all
Export citation of selected articles as:
28 pages, 4649 KB  
Article
Rainfall Patterns and Trends on São Miguel Island (Azores, Portugal): A Hierarchical Clustering and Trend Analysis Approach
by Rui Fagundes Silva, Rui Marques, José Luís Zêzere and Marcelo Fragoso
Climate 2025, 13(11), 238; https://doi.org/10.3390/cli13110238 - 20 Nov 2025
Viewed by 881
Abstract
This study addressed rainfall patterns and trends on São Miguel Island (Azores, Portugal). Homogeneous rainfall areas were identified using Ward’s hierarchical clustering method. The analysis was performed using monthly rainfall data from 21 rainfall stations, considering the climatological periods of 1978/79–2019/20 (full dataset), [...] Read more.
This study addressed rainfall patterns and trends on São Miguel Island (Azores, Portugal). Homogeneous rainfall areas were identified using Ward’s hierarchical clustering method. The analysis was performed using monthly rainfall data from 21 rainfall stations, considering the climatological periods of 1978/79–2019/20 (full dataset), 1978/79–2009/10 (oldest sub-dataset), and 2010/11–2019/20 (latest sub-dataset). Four rainfall clusters were identified, with Mean Annual Rainfall (MAP) ranging from 835.8 mm in low-altitude areas to 2925.5 mm in regions with higher elevation. These clusters showed consistent patterns for the analysed periods, although some changes in their composition were observed when considering the oldest and latest sub-datasets. The correlation between altitude and rainfall was strong (R2 up to 0.83), indicating an increase of approximately 196 mm of MAP per 100 m elevation gain. Moreover, no notable variation was observed between the island’s windward and leeward slopes. Rainfall trend analysis using Mann–Kendall and Sen’s slope tests revealed significant declines in both annual and seasonal rainfall in recent years. The strongest decreases occurred in autumn and winter, with trends as steep as −31.6 mm/year and −12.1 mm/year in autumn (both at the Fogo III station). Between the oldest and most recent periods, rainfall reductions reached up to 41% in autumn (P10) and 55% in winter (P10), particularly affecting clusters at lower and mid-altitudes. Although certain stations showed significant declines, the overall trend hints at a potential deviation from projections of global climate change models, as well as from trends identified in previous long-term rainfall studies. The predominantly positive phase of the North Atlantic Oscillation (NAO) observed in recent years has likely contributed, at least partially, to the decrease in the rainfall trend. Overall, the results provide a refined spatial and temporal characterisation of rainfall across São Miguel Island, improving the understanding of local climatic variability and offering valuable insights for regional water management and climate adaptation strategies. Full article
(This article belongs to the Section Climate and Environment)
Show Figures

Figure 1

12 pages, 6113 KB  
Article
Springtime Influence of the Mascarene High over SE Africa: Linking El Niño to Early Rains
by Mark R. Jury
Climate 2025, 13(11), 237; https://doi.org/10.3390/cli13110237 - 20 Nov 2025
Viewed by 399
Abstract
A statistical study is conducted to understand how the Mascarene High (MH) of the southwest Indian Ocean affects the springtime climate of southeastern Africa, in response to global teleconnections. A temporal index of sea-level air pressure is formed and correlated with large-scale fields [...] Read more.
A statistical study is conducted to understand how the Mascarene High (MH) of the southwest Indian Ocean affects the springtime climate of southeastern Africa, in response to global teleconnections. A temporal index of sea-level air pressure is formed and correlated with large-scale fields of sea temperature, winds, and rainfall in the period 1980–2024. The results suggests that the MH tends to intensify and shift westward during Pacific El Niño conditions via a standing wave train in the subtropical jet stream over the South Atlantic. As this happens, anticyclonic airflow draws moisture from the Mozambique Channel and drives it onto the Kalahari plateau via low-level jets over the Limpopo and Zambezi River valleys. The Sep–Nov rainfall increases ~1 mm/day across southern Africa, accompanied by cooler temperatures and lower potential evaporation. So the spring season starts with a smaller water deficit that could favor early-planted, short-cycle crops. Outstanding questions remain on the stability of Pacific teleconnections and coupling with the Indian Ocean Dipole. Full article
Show Figures

Figure 1

22 pages, 3654 KB  
Article
Assessing Coastal Vulnerability to Sea Level Rise in Qatar: An Index-Based Approach Using Analytic Hierarchy Process
by Ali Nasser A. A. Ba-Khamis, Hazrat Bilal and Tareq Al-Ansari
Climate 2025, 13(11), 236; https://doi.org/10.3390/cli13110236 - 17 Nov 2025
Viewed by 683
Abstract
Sea level rise (SLR) is a global phenomenon impacting coastlines worldwide, with its effects varying according to local geophysical and climatic conditions. The Arabian Gulf, characterized by hyper-arid conditions and low-lying coastal zones, is particularly vulnerable to SLR. This includes the eastern Arabian [...] Read more.
Sea level rise (SLR) is a global phenomenon impacting coastlines worldwide, with its effects varying according to local geophysical and climatic conditions. The Arabian Gulf, characterized by hyper-arid conditions and low-lying coastal zones, is particularly vulnerable to SLR. This includes the eastern Arabian Peninsula, where densely populated cities and critical infrastructure in countries such as Iraq, Kuwait, Saudi Arabia, Bahrain, Qatar, and the United Arab Emirates (UAE) face increasing risk. This study assesses the potential impact of SLR on Qatar’s coastline using CVI, which integrates both physical and socio-economic parameters. The analysis separately calculates the Physical Vulnerability Index (PVI) and the Socio-Economic Vulnerability Index (SVI), which are then combined to produce the final CVI score. Each variable is assigned a semi-quantitative score on a scale from 1 to 5, representing a gradient from very low to very high vulnerability. To determine the relative importance of each variable, the AHP is employed as a weighting method. The findings reveal that the majority of Qatar’s coastline falls within the high to very high vulnerability categories, with the exception of Doha, which is classified as low risk due to extensive coastal modifications and protective infrastructure. In contrast, areas such as Al Khor and Ras Laffan in the north and northeast, as well as Dukhan and Al Zubarah in the west, exhibit considerably higher vulnerability. These results highlight the urgent need for continued assessment of SLR impacts and the development of targeted adaptation and resilience strategies to safeguard Qatar’s coastal zones. Full article
Show Figures

Figure 1

23 pages, 3728 KB  
Article
Analysis of Near-Surface Air Temperature Trends in Brazil Region Using Meteorological Station Data, ERA5 Reanalysis, and CMIP6 Models
by Ilya Serykh, Svetlana Krasheninnikova, Mariia Safonova, Tatiana Gorbunova, Roman Gorbunov, Francis Miranda, Fabio Luiz Peres Krykhtine and Osvaldo Moura Rezende
Climate 2025, 13(11), 235; https://doi.org/10.3390/cli13110235 - 17 Nov 2025
Viewed by 623
Abstract
In view of global climate change, studies on long-term changes in Near-Surface Air Temperature (NSAT) in the Brazil region are highly relevant. Climate warming requires the government to develop various adaptation strategies to these changes in order to maintain marine and terrestrial ecosystems [...] Read more.
In view of global climate change, studies on long-term changes in Near-Surface Air Temperature (NSAT) in the Brazil region are highly relevant. Climate warming requires the government to develop various adaptation strategies to these changes in order to maintain marine and terrestrial ecosystems in a stable state. Pearson correlation analysis, with significance assessment of the obtained results, was used to analyze NSAT data from 39 weather stations, along with the ERA5 reanalysis dataset and 33 CMIP6 models, for the different SSP scenarios of greenhouse gas emissions in the Brazil region (10° N–40° S; 75–25° W). The increase in NSAT of the Brazil region for 1964–2023 was 0.4 ± 0.2 °C based on meteorological stations and 0.3 ± 0.1 °C based on the ERA5 reanalysis. NSAT by ERA5 data changed little from 1940 to 1970, after which a relatively rapid increase began at a rate of +0.18 °C/10 years. The increase in NSAT for the period 1940–2023 was 0.66 ± 0.17 °C based on the CMIP6 model ensemble. The CMIP6 models show the increase in the average NSAT across the region of 0.75–1.08 °C from 1994–2023 to 2024–2053. The average NSAT in the region under the SSP1-2.6, SSP2-4.5, SSP3-7.0, and SSP5-8.5 scenarios shows an increase of 1.05, 1.89, 2.75, and 3.53 °C by the end of the 21st century, respectively. Moreover, NSAT over land in the study region is increasing faster than over the ocean. According to the CMIP6 ensemble, NSAT over land in the Brazil region increased by an average of 0.6–1.0 °C from 1940–1969 to 1994–2023, while over the ocean near the Brazilian coastline it increased by approximately 0.5 °C. From 1994–2023 to 2070–2099, the projected warming over land is expected to be 1.0–1.4, 1.6–2.6, 2.4–3.8, and 3.2–5.0 °C for the SSP1-2.6, SSP2-4.5, SSP3-7.0, and SSP5-8.5 scenarios, respectively. Over the ocean, however, the estimated warming is substantially smaller—from 0.8 to 2.8 °C, depending on the SSP scenario, which may be explained by the stabilizing role of the ocean. Full article
Show Figures

Figure 1

21 pages, 5100 KB  
Article
Chilling Out or Heating Up: Investigating the Thermal Perception in Resting Areas of Small Urban Parks
by Lihua Cui and Shozo Shibata
Climate 2025, 13(11), 234; https://doi.org/10.3390/cli13110234 - 17 Nov 2025
Viewed by 469
Abstract
Small urban parks are the dominant form of green spaces in most Japanese cities and hold great potential for heat stress mitigation. However, most research has focused on large urban parks, leaving a knowledge gap in how small parks can be designed to [...] Read more.
Small urban parks are the dominant form of green spaces in most Japanese cities and hold great potential for heat stress mitigation. However, most research has focused on large urban parks, leaving a knowledge gap in how small parks can be designed to mitigate heat. Given that small parks are primarily used for rest, we focused on resting areas and assessed their thermal conditions in three typical small parks in Kyoto, Japan. We then examined how the spatial arrangements of park elements influenced thermal conditions. Results revealed that nearly half of the resting areas were uncomfortable, underscoring the urgent need for spatial design improvements. Linear mixed-effects models showed that while shade elements, such as tree canopies and roofs, most effectively enhanced thermal perception, their effectiveness was distance- and orientation-dependent. We also found a critical mismatch between green ground and shade elements that adversely affected thermal conditions. Our findings highlight that strategic spatial design, particularly the thoughtful placement of shade elements and resting areas, is the key to providing thermal comfort in small urban parks. This study provides evidence that small parks can act as urban heat spots if poorly designed, but with appropriate design they can become cool refuges. Full article
(This article belongs to the Special Issue Climate Adaptation and Mitigation in the Urban Environment)
Show Figures

Figure 1

26 pages, 4191 KB  
Article
Understanding Changing Trends in Extreme Rainfall in Saudi Arabia: Trend Detection and Automated EVT-Based Threshold Estimation
by Said Munir, Turki M. A. Habeebullah, Arjan O. Zamreeq, Muhannad M. A. Alfehaid, Muhammad Ismail, Alaa A. Khalil, Abdalla A. Baligh, M. Nazrul Islam, Samirah Jamaladdin and Ayman S. Ghulam
Climate 2025, 13(11), 233; https://doi.org/10.3390/cli13110233 - 16 Nov 2025
Viewed by 723
Abstract
The increasing occurrence of extreme rainfall events often leads to flash floods, infrastructure damage, loss of human life, and significant economic impacts. There is a pressing need for data-driven assessments and the application of robust analytical approaches to better understand these changes. Analyzing [...] Read more.
The increasing occurrence of extreme rainfall events often leads to flash floods, infrastructure damage, loss of human life, and significant economic impacts. There is a pressing need for data-driven assessments and the application of robust analytical approaches to better understand these changes. Analyzing ground-level daily rainfall data from 1985 to 2023 from 26 monitoring stations, this study first employs the Mann–Kendall test using robust statistics including minimum, median, various quartiles, and maximum rainfall values for detecting long-term trends across Saudi Arabia. Next, the k-means clustering technique is applied to characterize the annual rainfall cycles across different regions of the country. Finally, the Peaks Over Threshold (POT) approach within Extreme Value Theory (EVT) is employed to identify site-specific thresholds for extreme rainfall using the Generalized Pareto Distribution (GPD). This automated, data-driven method offers a more objective alternative to the commonly used ad hoc percentile-based threshold selection, thereby enhancing the rigour and reproducibility of extreme rainfall analysis. Local specific thresholds were computed ranging from about 16 to 47 mm from Arar and Jazan, respectively. These thresholds were then used to calculate the frequency and intensity of extreme rainfall events. The fitted GPD parameters were further used to estimate return levels (RLs) for different return periods (2-, 5-, 10-, 20-, 50-, and 100-year) into the future. The results underscore considerable spatial variability in extreme rainfall behaviour across Saudi Arabia, with a higher likelihood of intense and infrequent precipitation events in the coming decades. Full article
Show Figures

Figure 1

22 pages, 708 KB  
Article
Season-Long Time-Series Analysis of Soil Respiration in Furrow-Irrigated Corn with and Without Cover Crop in the Lower Mississippi River Basin
by Diego Della Lunga, Kristofor Brye, Michael J. Mulvaney, Mike Daniels, Tabata de Oliveira, Beth Baker, Timothy Bradford, Jr. and Chandler Arel
Climate 2025, 13(11), 232; https://doi.org/10.3390/cli13110232 - 14 Nov 2025
Viewed by 513
Abstract
Temporal resolution of carbon dioxide (CO2) release from the soil at the field scale is not completely understood. The objectives of this study were to identify trends, repetitive cycles, and residual patterns and structures with a time-series analysis from a furrow-irrigated [...] Read more.
Temporal resolution of carbon dioxide (CO2) release from the soil at the field scale is not completely understood. The objectives of this study were to identify trends, repetitive cycles, and residual patterns and structures with a time-series analysis from a furrow-irrigated corn (Zea mays L.) field with and without cover crops (i.e., CC and No-CC, respectively) over the course of one growing season in the Lower Mississippi River Basin. Carbon dioxide fluxes were measured from 5 May to 18 August 2024, four times a day (i.e., 0300, 0900, 1500, and 2100 h) from each of the two CC treatments. Linear trends were significant, but they were only able to explain 3 and 10% of the CO2-flux variability for CC and No-CC, respectively. Spectral density analyses indicated the significant presence of repetitive patterns every four lags, the amplitude of which was numerically 25% greater for CC than for No-CC. The structure of the residual was best described by separate autoregressive-moving-average (ARMA) models for the CC and No-CC treatments. The current study provides preliminary yet fundamental information to improve the understanding of the dynamics of soil respiration processes from a row-crop production system. Full article
Show Figures

Figure 1

28 pages, 11459 KB  
Article
Impact of Climate Change on Drought Dynamics in the Ganale Dawa River Basin, Ethiopia
by Mohammed Mussa Abdulahi, Pascal E. Egli, Anteneh Belayneh, Yazidhi Bamutaze and Sintayehu W. Dejene
Climate 2025, 13(11), 231; https://doi.org/10.3390/cli13110231 - 11 Nov 2025
Viewed by 638
Abstract
Understanding how climate change will reshape drought dynamics is essential for planning sustainable water and agricultural systems in tropical regions. However, large uncertainties in existing projections limit effective adaptation. To address this, we applied machine learning-enhanced climate projections and satellite-based drought indices to [...] Read more.
Understanding how climate change will reshape drought dynamics is essential for planning sustainable water and agricultural systems in tropical regions. However, large uncertainties in existing projections limit effective adaptation. To address this, we applied machine learning-enhanced climate projections and satellite-based drought indices to assess drought dynamics in Ethiopia’s Ganale Dawa Basin as a case study. Agricultural and hydrological droughts were analyzed for a historical baseline (1982–2014) and three future periods (2015–2040, 2041–2070, 2071–2100) under SSP2-4.5 (a moderate-emission pathway) and SSP5-8.5 (a high-emission pathway) scenarios. Results show that agricultural droughts occurred 34 times during the historical baseline. Under SSP2-4.5, their frequency declined to 10 in the mid-future, before rising to 16 events in the far future. In contrast, SSP5-8.5 projected increased variability with 33 events in the near future, dropping to 2 in the mid-future, and increasing again to 19 in the far future. Hydrological droughts were more persistent, with a baseline frequency of 31 events, and 26–36 events over future periods under both scenarios. These findings reveal increasing variability in agricultural drought and continued recurrence of hydrological drought. The findings emphasize a dual adaptation approach combining immediate agricultural responses with sustained water management and climate mitigation. Full article
(This article belongs to the Topic Disaster Risk Management and Resilience)
Show Figures

Graphical abstract

19 pages, 6027 KB  
Article
Spatiotemporal Patterns of Cloud Water Resources in Response to Complex Terrain in the North China Region
by Junjie Zhao, Miao Cai, Yuquan Zhou, Jie Yu, Shujing Shen, Jianjun Ou and Zhaoxin Cai
Climate 2025, 13(11), 230; https://doi.org/10.3390/cli13110230 - 8 Nov 2025
Viewed by 427
Abstract
Based on a cloud water resources (CWR) diagnostic dataset with a 1° × 1° resolution over China from 2000 to 2019, this study systematically analyzes the spatiotemporal patterns of CWR in the complex terrain of the North China Region. The results indicate the [...] Read more.
Based on a cloud water resources (CWR) diagnostic dataset with a 1° × 1° resolution over China from 2000 to 2019, this study systematically analyzes the spatiotemporal patterns of CWR in the complex terrain of the North China Region. The results indicate the following: (1) CWR-related physical quantities exhibit significant seasonal differences, with most being highest in summer and lowest in winter; water vapor convergence is strongest in summer and weakest in autumn, while hydrometeor convergence is smallest in summer and largest in winter; and the water surplus (precipitation minus evaporation) is minimal and negative in spring, indicating severe spring drought. (2) At the annual scale, precipitation is highly correlated with cloud condensation (r > 0.99), and CWR variation is primarily controlled by hydrometeor influx (r > 0.99). (3) The regional annual CWR and precipitation increase at rates of 34.8 mm/10 years and 49.2 mm/10 years, respectively, but exhibit seasonal asynchrony—CWR increases in all four seasons, while precipitation shows a slight decreasing trend in winter. (4) Spatially, CWR show a pattern of “more in the south and north, less in the central region; more in the east, less in the west,” with significant increases in the central–southern parts (southern Shanxi and Hebei, Beijing, and Tianjin). (5) Empirical orthogonal function (EOF) analysis reveals two dominant modes of CWR anomalies: a “region-wide consistent pattern” and a “north–south out-of-phase dipole pattern,” the latter being related to terrain-induced differences in water vapor transport and uplift condensation. The results statistically elucidate the distribution patterns of CWR under the influence of complex topography in NCR, providing a scientific reference for the development and utilization of regional CWR. Full article
(This article belongs to the Special Issue Impacts of Climate Change on Hydrological Processes)
Show Figures

Figure 1

17 pages, 2813 KB  
Article
Projected Convective Storm Environment in the Australian Region from Two Downscaling Ensemble Systems Under the SRES-A2/RCP8.5 Scenarios
by Kevin K. W. Cheung, Fei Ji, Jason P. Evans, Nidhi Nishant, Nicholas Herold, Giovanni di Virgilio, Kathleen Beyer and Matthew L. Riley
Climate 2025, 13(11), 229; https://doi.org/10.3390/cli13110229 - 4 Nov 2025
Viewed by 702
Abstract
Local thunderstorms are among the major meteorological hazards in the Australian region. These storms inherently have compound impacts, including hail, flash floods, and wind gusts, and consistently cause some of the highest insured losses. Studies on the climate change impact on local storms [...] Read more.
Local thunderstorms are among the major meteorological hazards in the Australian region. These storms inherently have compound impacts, including hail, flash floods, and wind gusts, and consistently cause some of the highest insured losses. Studies on the climate change impact on local storms face the challenges of unreliable storm climatology and uncertainties in the numerical modeling of physical processes. In this study we have adopted an approach to examining the ingredients of severe storm development based on regional climate simulations. We examined two generations of NARCliM datasets (NSW and Australian Regional Climate Modeling). Projected changes in convective indices for the latter half of the twenty-first century indicate an environment more conducive to thunderstorm development, primarily due to enhanced atmospheric instability, despite a concurrent increase in convective inhibition. A measure that combines the dynamic factor of vertical wind shear further shows that the potential storm days will increase substantially, such as a doubling of days with storms during summer, under the influence of climate change over tropical, eastern, and southeastern Australia. The storm season in a year is also expected to elongate. These projections imply increasing thunderstorm-related hazards in the future, including hail, flood, and high winds. Full article
(This article belongs to the Special Issue Recent Climate Change Impacts in Australia)
Show Figures

Figure 1

20 pages, 857 KB  
Systematic Review
Enablers, Barriers and Systems for Organizational Change for Adopting and Implementing Local Governments’ Climate Mitigation Strategies: A Systematic Literature Review
by Mark Goudsblom and Amelia Clarke
Climate 2025, 13(11), 228; https://doi.org/10.3390/cli13110228 - 2 Nov 2025
Viewed by 1051
Abstract
By 2050, the global population will be predominantly living in urban areas, and climate change mitigation planning will be crucial for addressing the climate emergency. Local governments are well-positioned to lead in adopting effective climate mitigation strategies. This systematic literature review examines the [...] Read more.
By 2050, the global population will be predominantly living in urban areas, and climate change mitigation planning will be crucial for addressing the climate emergency. Local governments are well-positioned to lead in adopting effective climate mitigation strategies. This systematic literature review examines the barriers, enablers, and systems that local governments will need to consider when implementing climate mitigation and strategies. A search across Scopus, Web of Science, and ProQuest databases yielded 411 results, from which 28 articles were selected for detailed analysis. Using Covidence and NVivo 14 software, the study employed a combination of deductive and inductive coding to identify key themes. The study identified themes specific to enablers, such as technology, collaboration, leadership, and management culture, as well as barrier themes, including short-term thinking, uncertainty avoidance, lack of knowledge among decision-makers, resource shortages, and organizational challenges. The findings underscore the importance of addressing organizational issues and allocating appropriate resources to bolster local-level systems change in support of climate change mitigation efforts. Full article
(This article belongs to the Collection Adaptation and Mitigation Practices and Frameworks)
Show Figures

Figure 1

24 pages, 1530 KB  
Article
Drought Management in Zambia: Insights from the 2023/2024 Drought
by Andrew Mwape, Michael Hayes, Deborah J. Bathke, Kelly Helm Smith, Rezaul Mahmood and Elizabeth Jones
Climate 2025, 13(11), 227; https://doi.org/10.3390/cli13110227 - 31 Oct 2025
Viewed by 986
Abstract
Zambia continues to experience increasingly frequent and intense droughts, with the 2023/2024 season among the most severe in recent history. These events have threatened livelihoods, strained water and food systems, and placed immense pressure on already limited national and local resources. Given the [...] Read more.
Zambia continues to experience increasingly frequent and intense droughts, with the 2023/2024 season among the most severe in recent history. These events have threatened livelihoods, strained water and food systems, and placed immense pressure on already limited national and local resources. Given the limited knowledge in the literature on drought management in Zambia, this study investigated the state of localized district efforts across the country. By using mixed methods with a total of 161 interviews, it assessed the participation of district governments and sector players across key components of drought governance, including early warning, monitoring, vulnerability and impact assessment, mitigation, and response. Although Zambia has made notable progress in establishing national institutional frameworks and climate policies, key findings reveal a pattern of limited proactive engagement, with most participation occurring only in response to extreme events like the 2023/2024 drought. This reactive posture at the district level is further compounded by inadequate resources, limited coordination, a lack of localized drought planning, and systemic bureaucratic constraints that undermine a timely and effective response. Nonetheless, numerous opportunities exist to strengthen drought management by localizing decision-making, integrating indigenous knowledge into existing early warning systems, and leveraging community-based infrastructures to maximize scarce resources and build long-term resilience. The paper concludes with recommendations for enhancing Zambia’s drought preparedness and response capacity through inclusive, risk-based, and proactive strategies; insights that can be adapted to other developing country contexts. Full article
(This article belongs to the Special Issue Coping with Flooding and Drought)
Show Figures

Figure 1

20 pages, 9389 KB  
Article
Let Us Change the Aerodynamic Roughness Length as a Function of Snow Depth
by Jessica E. Sanow and Steven R. Fassnacht
Climate 2025, 13(11), 226; https://doi.org/10.3390/cli13110226 - 31 Oct 2025
Viewed by 491
Abstract
A shallow, seasonal snowpack is rarely homogeneous in depth, layer characteristics, or surface structure throughout an entire winter. Aerodynamic roughness length (z0) is typically considered a static parameter within hydrologic and atmospheric models. Here, we present observations showing z0 [...] Read more.
A shallow, seasonal snowpack is rarely homogeneous in depth, layer characteristics, or surface structure throughout an entire winter. Aerodynamic roughness length (z0) is typically considered a static parameter within hydrologic and atmospheric models. Here, we present observations showing z0 as a dynamic variable that is a function of snow depth (ds). This has a significant impact on sublimation modeling, especially for shallow snowpacks. Terrestrial LiDAR data were collected at nine different study sites in northwest Colorado from the 2019 to 2020 winter season to measure the spatial and temporal variability of the snowpack surface. These data were used to estimate the geometric z0 from 91 site visits. Values of z0 decrease during initial snow accumulation, as the snow conforms to the underlying terrain. Once the snowpack is sufficiently deep, which depends on the height of the ground surface roughness features, the surface becomes more uniform. As melt begins, z0 increases, when the snow surface becomes more irregular. The correlation value of z0 was altered by human disturbance at several of the sites. The z0 versus ds correlation was almost constant, regardless of the initial roughness conditions that only affected the initial z0. Full article
(This article belongs to the Special Issue Meteorological Forecasting and Modeling in Climatology)
Show Figures

Figure 1

49 pages, 1699 KB  
Article
Selecting Tailored Risk Indicators for Assessing Marine Heatwave Risk to the Fisheries Sector in Vanuatu
by Isabella Aitkenhead, Yuriy Kuleshov, Qian (Chayn) Sun and Suelynn Choy
Climate 2025, 13(11), 225; https://doi.org/10.3390/cli13110225 - 30 Oct 2025
Viewed by 722
Abstract
Climate change is increasing the frequency and intensity of Marine Heatwave (MHW) events, threatening Western Tropical Pacific Small Island Developing States (SIDSs). MHWs critically threaten the fisheries sector which vitally supports food and nutrition security in local communities and local livelihoods. Currently, MHW [...] Read more.
Climate change is increasing the frequency and intensity of Marine Heatwave (MHW) events, threatening Western Tropical Pacific Small Island Developing States (SIDSs). MHWs critically threaten the fisheries sector which vitally supports food and nutrition security in local communities and local livelihoods. Currently, MHW risk to fisheries in Western Tropical Pacific SIDSs remains underexplored. Vanuatu is a Western Tropical Pacific SIDS which requires expanded MHW risk knowledge to improve the adaptive capacity of fisheries. A fundamental method for expanding MHW risk knowledge is tailored risk assessment. This study conducts the initial steps in a tailored MHW risk assessment methodology, displaying how a tailored indicator selection and weighting process can inform effective MHW risk assessment for fisheries in Western Tropical Pacific SIDSs. Hazard, vulnerability, and exposure indicators were selected through a combined process utilising a literature review and participatory research survey. Survey results were also used to develop a user-informed indicator weighting scheme. Selected indicators included sea surface temperature (SST), coral bleaching/mortality, and chlorophyll-a concentration (hazard); terrestrial-based food and income generation, fishing skills and technology, fishery fish diversity/fishery flexibility, and primary production of commercial fisheries (vulnerability); seagrass population/C content, coral habitat health/crown-of-thorns prevalence, crab stock health, and fish mortality/fish stock health (exposure). These indicators and their assigned weights are recommended for use in a future MHW risk assessment for Vanuatu fisheries. A tailored, fisheries-specific MHW risk assessment could advise local decision-makers on where/when MHW risk is high and aid the implementation of more effective fisheries risk management. Full article
Show Figures

Figure 1

15 pages, 3175 KB  
Article
From Descriptive Records to Instrumental Measurements: Addressing Inhomogeneities in the 250-Year Fog Time Series of Padua
by Claudio Stefanini, Francesca Becherini, Antonio della Valle, Fabio Zecchini and Dario Camuffo
Climate 2025, 13(11), 224; https://doi.org/10.3390/cli13110224 - 30 Oct 2025
Viewed by 721
Abstract
The fog in Padua, Italy, is the result of a complex interplay between local climate, pollution and synoptic-scale meteorological conditions. The modern definition of “fog” was adopted by the World Meteorological Organization, founded in 1950. Prior to that, no precise visibility threshold had [...] Read more.
The fog in Padua, Italy, is the result of a complex interplay between local climate, pollution and synoptic-scale meteorological conditions. The modern definition of “fog” was adopted by the World Meteorological Organization, founded in 1950. Prior to that, no precise visibility threshold had been established, and early meteorological observers recorded its occurrence based on subjective criteria. The meteorological observations made in Padua since the mid-18th century include sky conditions and fog, but the distinction between fog and mist was undefined, making it difficult to compare records from different observers. Caution is therefore needed when analyzing fog occurrence to distinguish the climate signal from observational artifacts. For instance, at the Specola Observatory in Padua from 1773 to 1913, the fog that appeared only on the horizon—but not at the zenith—was often disregarded, since vertical visibility was crucial for astronomical observations. Starting from 1920, other manned stations began providing systematic fog records, which have continued to the present. The aim of this study is to reconstruct the occurrence of fog in Padua since the late 18th century. As available datasets —observational and instrumental—partly overlap in time, and data from nearby locations are available, it is possible to assess their mutual consistency, to evaluate the reliability of historical visual observations, and to investigate fog variability and trend over time. Full article
(This article belongs to the Special Issue Climate Variability in the Mediterranean Region (Second Edition))
Show Figures

Figure 1

15 pages, 3137 KB  
Article
Climate Change and the Escalating Cost of Floods: New Insights from Regional Risk Assessment Perspective
by Andrej Vidmar, Filmon Ghilay Ghebrebimichael and Simon Rusjan
Climate 2025, 13(11), 223; https://doi.org/10.3390/cli13110223 - 27 Oct 2025
Viewed by 672
Abstract
Global climate change is expected to alter characteristics of flood events. This study evaluates the rising flood risk and damage potential in the lower Vipava River valley—a transboundary catchment between Slovenia and Italy—under climate scenarios RCP 2.6, 4.5, and 8.5. The area has [...] Read more.
Global climate change is expected to alter characteristics of flood events. This study evaluates the rising flood risk and damage potential in the lower Vipava River valley—a transboundary catchment between Slovenia and Italy—under climate scenarios RCP 2.6, 4.5, and 8.5. The area has experienced multiple floods in recent decades, indicating high vulnerability. Using hydraulic modeling for current and future conditions, flood hazard zones were identified and integrated into the KRPAN model to estimate expected annual damage (EAD). The findings show that EAD escalates from €0.97 million under current conditions to €1.97 million under the most extreme scenario. A 20% rise in flood peaks leads to a 1.4-fold increase in damage, while a 40% rise results in losses that are more than double. Buildings show a 2.5-fold increase in EAD, and water infrastructure EAD rises by a factor of 1.9. These results underscore the substantial economic consequences of climate change on flood risk. The study highlights the urgent need to incorporate climate scenarios into flood risk assessments and spatial planning to support adaptive strategies and reduce future damage. These insights are essential for making informed decisions and achieving long-term resilience. Full article
(This article belongs to the Topic Disaster Risk Management and Resilience)
Show Figures

Figure 1

18 pages, 4133 KB  
Article
Assessing Climate Trends in Bangladesh Using the Spatial Synoptic Classification
by Nishat T. Sumaya, Jason C. Senkbeil and Scott C. Sheridan
Climate 2025, 13(11), 222; https://doi.org/10.3390/cli13110222 - 27 Oct 2025
Viewed by 1752
Abstract
Climate change is reshaping weather patterns and atmospheric circulation globally, particularly in monsoon-dominated tropical environments. To examine how these changes are unfolding in Bangladesh, we extend the Spatial Synoptic Classification (SSC) using ERA5 reanalysis (1960–2024) at three representative stations (Chittagong, Khulna, and Sylhet) [...] Read more.
Climate change is reshaping weather patterns and atmospheric circulation globally, particularly in monsoon-dominated tropical environments. To examine how these changes are unfolding in Bangladesh, we extend the Spatial Synoptic Classification (SSC) using ERA5 reanalysis (1960–2024) at three representative stations (Chittagong, Khulna, and Sylhet) to assess long-term changes in the SSC weather types and their internal meteorological properties. The SSC calendars were constructed and analyzed for seasonal distribution, interannual trends, and decadal anomalies of temperature and dew point. Results reveal that Bangladesh’s climatology is dominated by Moist Tropical (MT), Moist Moderate (MM), and Dry Moderate (DM) weather types with a coherent seasonal cycle. Interannually, MT increased strongly across all stations, while MM and DM declined significantly. Decadal anomalies show consistent warming and moistening since the 2000s, which are most pronounced for Dry Tropical (DT) and MT. These findings indicate that climate change in Bangladesh is expressed not only through shifting frequencies but also through evolving thermodynamic characteristics of daily weather types, underscoring the SSC framework’s value in tropical monsoon regions for generating actionable climate information to support heat-stress planning and climate-health services. Full article
Show Figures

Figure 1

25 pages, 7440 KB  
Article
Climate Change in the Middle East and the West Indian Subcontinent: Geographic Interconnections and the Modulation Roles of the Extreme Phases of the Atlantic Meridional Oscillation (AMO) and the Monsoon Cloudiness
by Afsaneh Heydari, Mohammad Jafar Nazemosadat and Parisa Hosseinzadehtalaei
Climate 2025, 13(11), 221; https://doi.org/10.3390/cli13110221 - 27 Oct 2025
Viewed by 682
Abstract
In this study, the long-term (1961–2020) values of the summertime station-based surface air temperature (SAT) data at 151 qualified stations, alongside the corresponding ERA5 gridded data, were analyzed to investigate climate change over the Middle East and the west Indian subcontinent. Significant positive [...] Read more.
In this study, the long-term (1961–2020) values of the summertime station-based surface air temperature (SAT) data at 151 qualified stations, alongside the corresponding ERA5 gridded data, were analyzed to investigate climate change over the Middle East and the west Indian subcontinent. Significant positive (negative) trends were observed at 134 (2) stations, while trends were insignificant at 15 stations. The positive (negative and insignificant) trends were mainly concentrated in the interior highlands (monsoon-dominated lowlands), where ERA5 exhibited from 10% to 70% overestimations (5% to 26% underestimations). These ERA5-related biases exhibited strong correlations with elevation. To assess the trends’ disparity reasons, we first showed that the outputs of SAT+AMO − SAT−AMO are highly positive (negative or near zero) over the overestimated (underestimated) regions. The study then demonstrated that cloudiness, atmospheric circulation, specific humidity, and convective activities above the monsoon-dominated areas differ between +AMO and −AMO. For these areas, the enhanced +AMO-related cloudiness suppresses positive SAT anomalies, while the increased −AMO-associated sunshine offsets negative SAT anomalies. Contrarily, for some areas such as northern Iran, the +AMO (−AMO)-associated cloudiness or clear sky can affect climate change by amplifying the warmness or coldness. In addition, +AMO (−AMO) has caused further convective activities over the Arabian Sea (Bengal Bay). Full article
(This article belongs to the Special Issue Hydroclimatic Extremes: Modeling, Forecasting, and Assessment)
Show Figures

Figure 1

19 pages, 3226 KB  
Article
Time Lags Between Meteorological and Hydrological Droughts: Evaluating Indicator Scales and Propagation Patterns
by Giovana Cristina Santos de Medeiros, Samiria Maria Oliveira da Silva, Ályson Brayner Sousa Estácio, Ticiana Marinho de Carvalho Studart and Francisco de Assis de Souza Filho
Climate 2025, 13(11), 220; https://doi.org/10.3390/cli13110220 - 26 Oct 2025
Viewed by 590
Abstract
The hydrological response to meteorological drought is often nonlinear, due to physiographic features and human activities, necessitating methodologies that surpass simple drought indices. This study investigates whether drought propagation can be statistically modeled, identifies factors influencing the time lag between meteorological and hydrological [...] Read more.
The hydrological response to meteorological drought is often nonlinear, due to physiographic features and human activities, necessitating methodologies that surpass simple drought indices. This study investigates whether drought propagation can be statistically modeled, identifies factors influencing the time lag between meteorological and hydrological droughts, and evaluates the most suitable temporal scales of drought indicators. Meteorological droughts were detected using Standardized Precipitation Index (SPI), while hydrological droughts were identified by the Adapted Threshold Level Method (ATLM), which balances available reservoir volume and the water demand, including withdrawals and evaporation losses. Castanhão, Banabuiú, and Orós reservoirs, in the State of Ceará, Brazil, were used to study drought events, across three aggregated time scales of 12, 24, and 36 months. The propagation time was determined using three indicators, corresponding to onset (Δb), peak (Δp), and conclusion (Δe) lags. Longer meteorological droughts were found to propagate more slowly to hydrological systems, with temporal lags following a consistent order of Δp > Δb > Δe. The combination of SPI-12 and ATLM-36 droughts provided the strongest and most consistent positive correlations (95% confidence level) between drought duration and all three lag markers. This combination offers a robust framework for modeling drought propagation dynamics and improving water resource management strategies. Full article
(This article belongs to the Special Issue Global Warming and Extreme Drought)
Show Figures

Figure 1

28 pages, 1426 KB  
Article
Environmental Institutional Determinants of Climate Behavior Among Taiwan’s Public Officials
by Chyi Liang, Shin-Cheng Yeh, Pei-Hsuan Lin, Homer C. Wu and Shiang-Yao Liu
Climate 2025, 13(11), 219; https://doi.org/10.3390/cli13110219 - 25 Oct 2025
Viewed by 1000
Abstract
This study investigates how climate change literacy (CCL) and institutional contexts shape the climate-related behaviors of Taiwan’s public officials. Drawing on a 2024 national survey of 1940 civil servants, we apply hierarchical and comparative regression analyses to examine the relative influence of knowledge, [...] Read more.
This study investigates how climate change literacy (CCL) and institutional contexts shape the climate-related behaviors of Taiwan’s public officials. Drawing on a 2024 national survey of 1940 civil servants, we apply hierarchical and comparative regression analyses to examine the relative influence of knowledge, affective dispositions, and organizational supports. Results show that solution-oriented knowledge exerts greater behavioral influence than factual awareness. At the same time, affective resources—particularly self-efficacy and environmental identity—are the strongest and most consistent drivers of engagement. Institutional factors further condition these relationships: central officials’ behaviors are shaped by departmental mandates and bureaucratic constraints, whereas local officials rely more on supervisor support and prior project involvement. These findings integrate literacy research with institutional perspectives, demonstrating that effective climate governance requires both individual agency and enabling organizational contexts. Policy implications include strengthening leadership training, creating experiential learning opportunities, and streamlining administrative structures across governance levels to accelerate climate action. Full article
(This article belongs to the Section Policy, Governance, and Social Equity)
Show Figures

Graphical abstract

19 pages, 3501 KB  
Article
Vulnerability in Coastal Touristic Cities Impacted by Tropical Cyclones and Landslides in a Changing Climate: A Case Study from Los Cabos, Mexico
by Miguel Angel Imaz-Lamadrid, Jobst Wurl, Antonina Ivanova-Boncheva, María Z. Flores-López and Mayra Violeta Guadalupe Gutierrez-González
Climate 2025, 13(11), 218; https://doi.org/10.3390/cli13110218 - 23 Oct 2025
Viewed by 1458
Abstract
Coastal areas are rich in diverse resources and are ideal locations for developing the tourism industry. Thus, in coastal tourist centers, the growth rate is high, although often disorganized and unsustainable. In Mexico, tourist centers have fostered poverty belts where inhabitants live in [...] Read more.
Coastal areas are rich in diverse resources and are ideal locations for developing the tourism industry. Thus, in coastal tourist centers, the growth rate is high, although often disorganized and unsustainable. In Mexico, tourist centers have fostered poverty belts where inhabitants live in conditions of high vulnerability due to hydrometeorological and geological phenomena in regular and irregular settlements. Thus, various coastal tourist areas in Mexico have been impacted by these types of phenomena, causing deaths, a high number of victims, and significant economic losses. Previous studies have confirmed that tropical cyclones can trigger landslides resulting from intense rainfall; however, risk estimation models and their components are presented separately. This paper presents a model based on the Intergovernmental Panel on Climate Change (IPCC) framework to estimate vulnerability to tropical cyclones and landslides in the context of climate change. The integration of both disruptive phenomena and climate change was carried out in the exposure sub-index. The socioeconomic situation of the inhabitants was included in the sensitivity sub-index. Vulnerability was modeled for the near, medium, and distant future, with population growth projections for the towns of Cabo San Lucas and San José del Cabo, Mexico. Climate change associated with urban expansion will increase exposure from 121.27 to 956.74 km2, while the vulnerable population is expected to increase from 133,266 to 250,386 by 2100. The model proved to be an effective tool for determining the combined vulnerability of both phenomena, allowing for the generation of strategies for decision-makers to implement actions focused on reducing vulnerability and building resilience. Full article
(This article belongs to the Topic Disaster Risk Management and Resilience)
Show Figures

Figure 1

Previous Issue
Next Issue
Back to TopTop