You are currently viewing a new version of our website. To view the old version click .
Climate
  • Article
  • Open Access

17 November 2025

Chilling Out or Heating Up: Investigating the Thermal Perception in Resting Areas of Small Urban Parks

and
1
Graduate School of Agriculture, Kyoto University, Kyoto 6068502, Japan
2
Tokyo Metropolitan Research Institute for Environmental Protection, Tokyo 1360075, Japan
3
Awaji Landscape Planning and Horticulture Academy, Awaji 6561726, Japan
*
Author to whom correspondence should be addressed.
This article belongs to the Special Issue Climate Adaptation and Mitigation in the Urban Environment

Abstract

Small urban parks are the dominant form of green spaces in most Japanese cities and hold great potential for heat stress mitigation. However, most research has focused on large urban parks, leaving a knowledge gap in how small parks can be designed to mitigate heat. Given that small parks are primarily used for rest, we focused on resting areas and assessed their thermal conditions in three typical small parks in Kyoto, Japan. We then examined how the spatial arrangements of park elements influenced thermal conditions. Results revealed that nearly half of the resting areas were uncomfortable, underscoring the urgent need for spatial design improvements. Linear mixed-effects models showed that while shade elements, such as tree canopies and roofs, most effectively enhanced thermal perception, their effectiveness was distance- and orientation-dependent. We also found a critical mismatch between green ground and shade elements that adversely affected thermal conditions. Our findings highlight that strategic spatial design, particularly the thoughtful placement of shade elements and resting areas, is the key to providing thermal comfort in small urban parks. This study provides evidence that small parks can act as urban heat spots if poorly designed, but with appropriate design they can become cool refuges.

1. Introduction

The IPCC [] states that the most significant impacts of climate change on East Asia are increasing hot summer days and decreasing cold winter days. In Japan, such changes have occurred in most cities during the last few decades, and the trend is predicted to continue []. The increase in hot summer days and nights causes various issues such as promoting greenhouse gas emissions owing to the increased use of cooling systems [,], limiting outdoor physical activities [], and resulting in increased mortality [] and morbidity [].
The cooling effects of urban parks, namely park cool islands effects (PCI), have been demonstrated in various regions in the past decade (Table 1). Previous studies indicate that the cooling effect of urban parks is associated with their size, suggesting the need to increase park sizes [,]. However, spaces for urban parks are restricted in many cities, particularly in densely populated cities. Taking Kyoto, Japan, as an example, more than half of the urban parks are smaller than 500 m2, and over 90% are smaller than 5000 m2 (Figure 1a). These small urban parks serve as the primary public open spaces in most Japanese cities. Notably, urban parks in Japan are parks and green spaces established and managed by national or local governments. Many existing urban parks were constructed in the late 20th century, primarily for disaster evacuation and children’s play. Due to limited space, small urban parks typically consist of a few trees, benches, and play equipment (Figure 1b). In highly urbanized cities, where green spaces are generally limited, these small urban parks are valuable green spaces that provide various ecosystem services. However, the challenge of small urban parks in heat mitigation has been documented by Chang et al., who conducted a comprehensive study of 61 urban parks in Taipei, Taiwan []. Their research revealed that smaller parks are more likely to be hotter than their surroundings. While large green spaces benefit from abundant vegetation that provides extensive shade and cooling through evapotranspiration, small green spaces are particularly vulnerable to the heat-amplifying effects of surrounding built environments.
Figure 1. (a) Histogram of the area of urban parks in Kyoto, Japan; (b) an example of small urban parks in Kyoto.
Effectiveness is especially critical for small urban parks due to the limited space available for implementing heat mitigation measures, but knowledge of how to maximize the effectiveness within a small space is limited. This is because most research on PCI has primarily focused on parks larger than 1 hectare, with a significant portion centering on comparing air temperature (Ta) or land surface temperature (LST) between parks and their surroundings (Table 1). While these studies contribute to urban heat island effects mitigation, Ta and LST are insufficient proxies for understanding thermal perception because they do not account for factors such as humidity, wind speed, and radiation. Therefore, to better capture how people experience thermal environments, it is essential to use thermal comfort indices such as physiological equivalent temperature (PET) and universal thermal climate index (UTCI) to assess the heat stress mitigation function of green spaces.
Moreover, small parks are often overlooked in research and planning, likely because their benefits are assumed to scale with size. In effect, they play an essential role in urban resilience. They are located closer to people’s homes, and therefore are more accessible, more frequently used by children [], and more convenient for daily activities. Improving the summer thermal comfort of small urban parks is thus both important and increasingly necessary in the context of rising global temperature.
Among the many factors that affect thermal comfort, researchers suggest tree canopies and shade shelters play a pivotal role in reducing heat stress by intercepting solar radiation [,]. Accordingly, as the ambient temperature rises, people naturally seek out shaded areas for relief [,,]. Shade provision is particularly critical in hot regions. Cheung and Jim [], who have explored the effect of shade provision on temperature in a humid-tropical region, recommend a very high level of tree cover (90%) for thermal comfort. Recent studies focusing on maximizing the heat mitigation effect of shade provision highlight the importance of strategically positioning shade elements. Cui and Shibata [] found that Japanese gardens are strategically designed to protect visitors from the summer heat, and the cooling effect is attributed to the extensive shade (about 70%) provided by roofs positioned within a 10 m radius of resting areas. Lachapelle et al. assessed the cooling effect of different tree placements in street canyons, concluding that evenly distributed trees are more effective for heat mitigation than clustered arrangements []. Nonetheless, several key questions remain unanswered, such as how the orientation of shade elements influences thermal comfort and what the optimal size of shade elements is to ensure thermal comfort. Such insights are important for small green spaces where room for shade elements is limited.
Grass and pavement are other primary park elements that can potentially influence thermal perception. Multiple studies have demonstrated that grassy surfaces provide better summer thermal conditions compared to impervious surfaces like pavement [,]. This difference stems from several key characteristics of grass: its lower albedo, potential for evapotranspiration, and soil water evaporation, which collectively contribute to lower air and surface temperatures during summer days [,]. However, research indicates that grass is less effective at reducing heat stress compared to trees [,,,,]. Moreover, Cui and Shibata [] suggest that while grassy surfaces can improve thermal comfort in shaded areas, the effect requires a substantial area of grass to be meaningfully noticeable. However, the nighttime cooling effect of grass is highly recognized, it is even better than that of trees, because the heat trapped in the grassy area can be released through longwave exchange with the night sky [,,]. Some studies suggest irrigated grass can greatly increase cooling effects [,], but concerns remain as few cities can provide irrigation for public parks, especially in regions with arid climates. Overall, while the effects of grass on air and surface temperatures are relatively well-understood, how the distribution of grass and pavement in small green spaces impacts thermal perception remains less explored.
In small urban parks, limited space often restricts visitor activity to designated resting areas like benches, making these areas the primary sites of user interaction. Consequently, the thermal conditions within these resting areas play a critical role in determining overall user comfort. We hypothesize that the spatial arrangement of park elements surrounding these resting areas significantly impacts users’ thermal perception. Therefore, strategically designing the immediate surroundings of resting areas can enhance the heat mitigation performance of small urban parks.
To test this hypothesis and address gaps in the spatial design strategies of small urban parks for effective heat mitigation, we conducted field measurements and spatial analysis to answer the research question: How can the arrangement of park elements around resting areas be optimized to enhance thermal comfort in small urban parks?
This main question is further examined through two specific sub-questions:
(1)
How are park elements positioned around resting areas in small urban parks?
(2)
How does the placement of park elements, such as their orientation relative to resting areas and their proportions within a defined proximity, influence thermal perception?
Table 1. Literature on Park Cool Islands.
ReferencePark NumberPark ScaleMethodsPCI Presented ByCityClimate
[]14.5 haSimulation (Envi-met)Ta (Air temperature)ChongqingHot and humid climate
[]271–106 haIn situ measurementLST (Land surface temperature)MelbourneTemperate oceanic climate
[]1680 haIn situ measurementTa BeijingMonsoon influenced humid continental climate
[]1015.2–285.3 haIn situ measurementTa BeijingMonsoon influenced humid continental climate
[]1530.3–461.7 haRemote sensingLSTChangshaSubtropical monsoon climate
[]12.0 haSimulation (CFD)TaLjubljanaTemperate oceanic climate
[]114 haIn situ measurementTa ArgentinaArid continental climate
[]80.3–7.7 haRemote sensingLSTGranadaMediterranean climate
[]31.5–26 haIn situ measurementLSTMelbourneTemperate oceanic climate
[]1355 haSimulation (Envi-met)PET and TaBerlinTemperate oceanic climate
[]11.5 haIn situ measurementTa MelbourneTemperate oceanic climate
[]2660.4–5654 haRemote sensingLSTBeijingMonsoon influenced humid continental climate
[]7 locations on a university campus/In situ measurement and simulation (Envi-met)Ta and MRTPortlandTemperate oceanic climate
Note: The reference list is a result of a literature search conducted on ScienceDirect using the keyword “park cool island” in November 2023.

2. Study Area and Methods

2.1. Study Area

The study area, Kyoto (35°00′ N, 135°46′ E), has a warm temperate climate (Cfa, Köppen climate), with an annual precipitation of 1522.9 mm, and a daily mean maximum temperature in August of 33.7 °C (average based on the values observed from 1991 to 2020) []. It is not the hottest city in Japan, but it ranks at the top for the number of extremely hot days (defined as days with temperatures exceeding 35 °C) among all cities in Japan. As a historic former capital, Kyoto’s city center is characterized by narrow streets and dense construction, with a population density exceeding 11,000 people per km2 []. This compact urban form poses significant challenges for green space planning, leaving very limited room for urban parks or other vegetated areas. As a result, most parks in the city center are small in scale, with a median area of 830 m2 [].
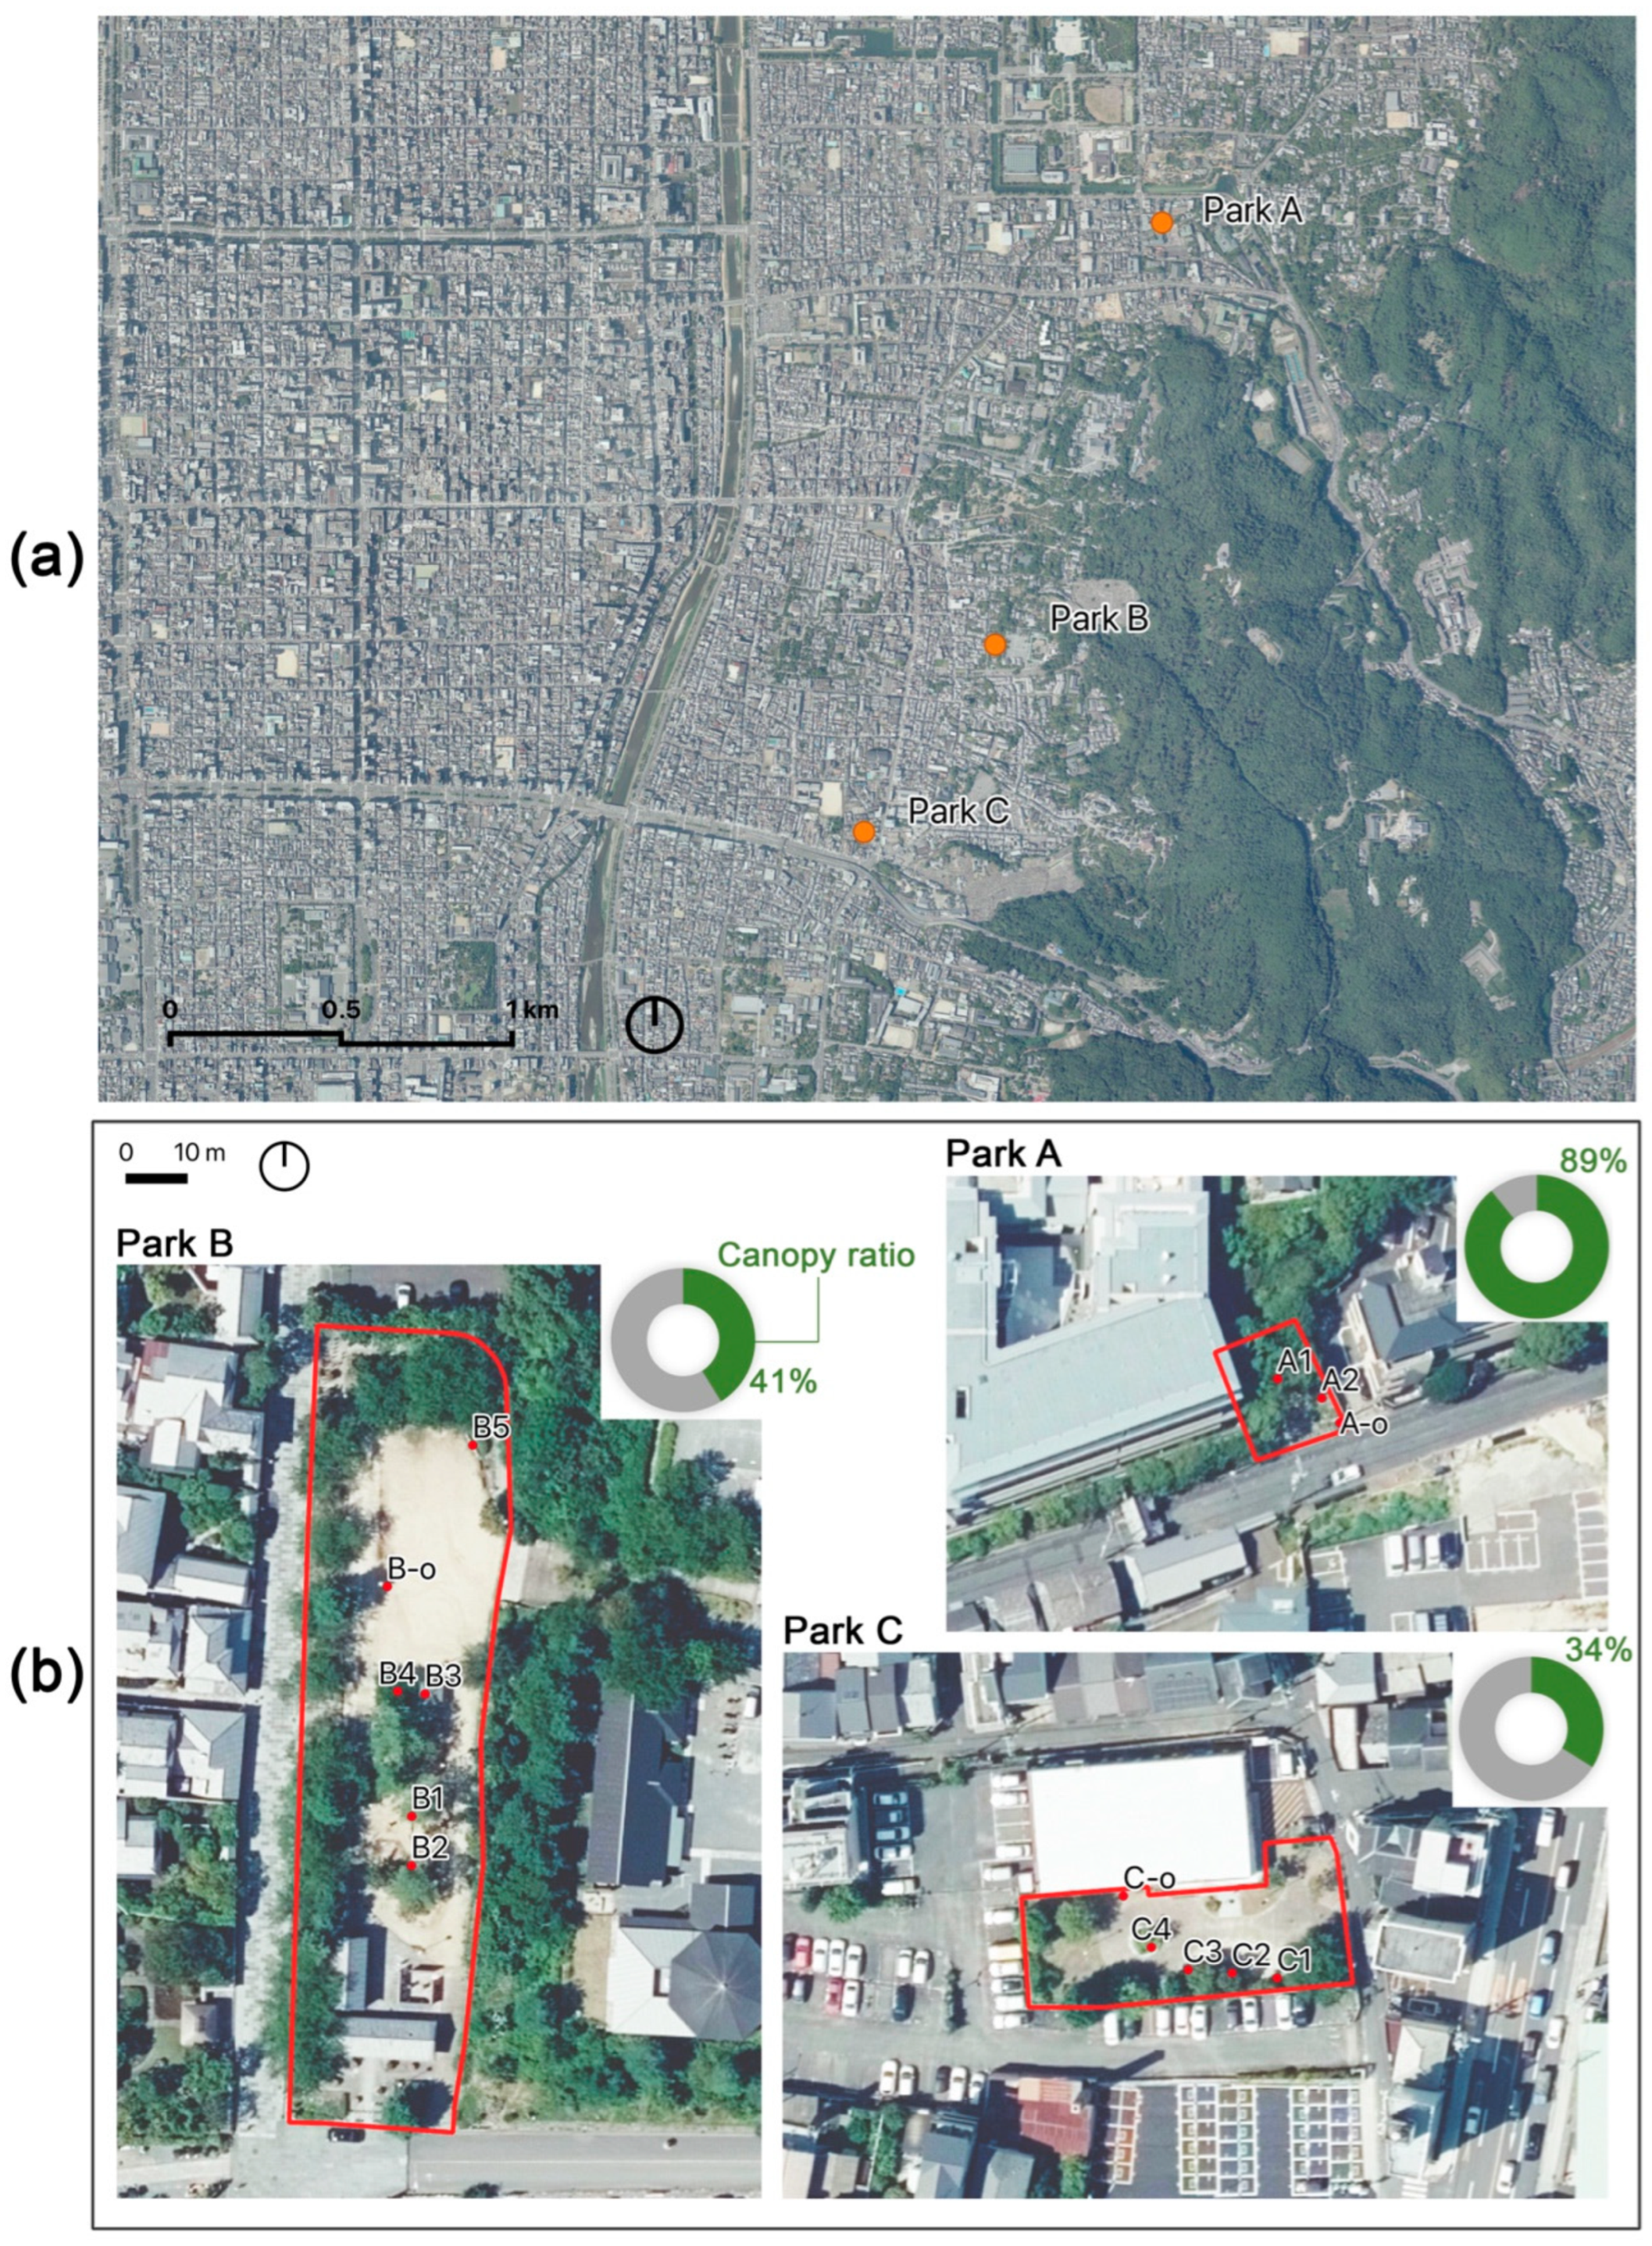
We selected three typical small urban parks, Parks A, B, and C (Figure 2 and Table 2), that are near each other, differ in scale and environments, and are equipped with resting areas such as benches and pavilions. All the study sites are in residential areas facing narrow streets. As shown in Figure 2b, Park A is particularly small and is only equipped with two benches. However, it is the most profoundly shaded park among the three study parks. Park B is the biggest one, including three benches, one pavilion, and one wisteria trellis. A line of cherry trees is planted on the west, and the north and east of the park are forested with big trees. In the middle of the park is an island planted with pine trees. Park C has the features of typical urban block parks, being relatively small and having some benches and play equipment.
Figure 2. (a) Location of the study parks; (b) satellite images of the three study parks and study points. A1, A2, B1-B5, and C1-C4 are the investigation points of the resting areas, and A-o, B-o, and C-o are the reference points.
Table 2. Profile of the three study parks.

2.2. On-Site Meteorological Measurement

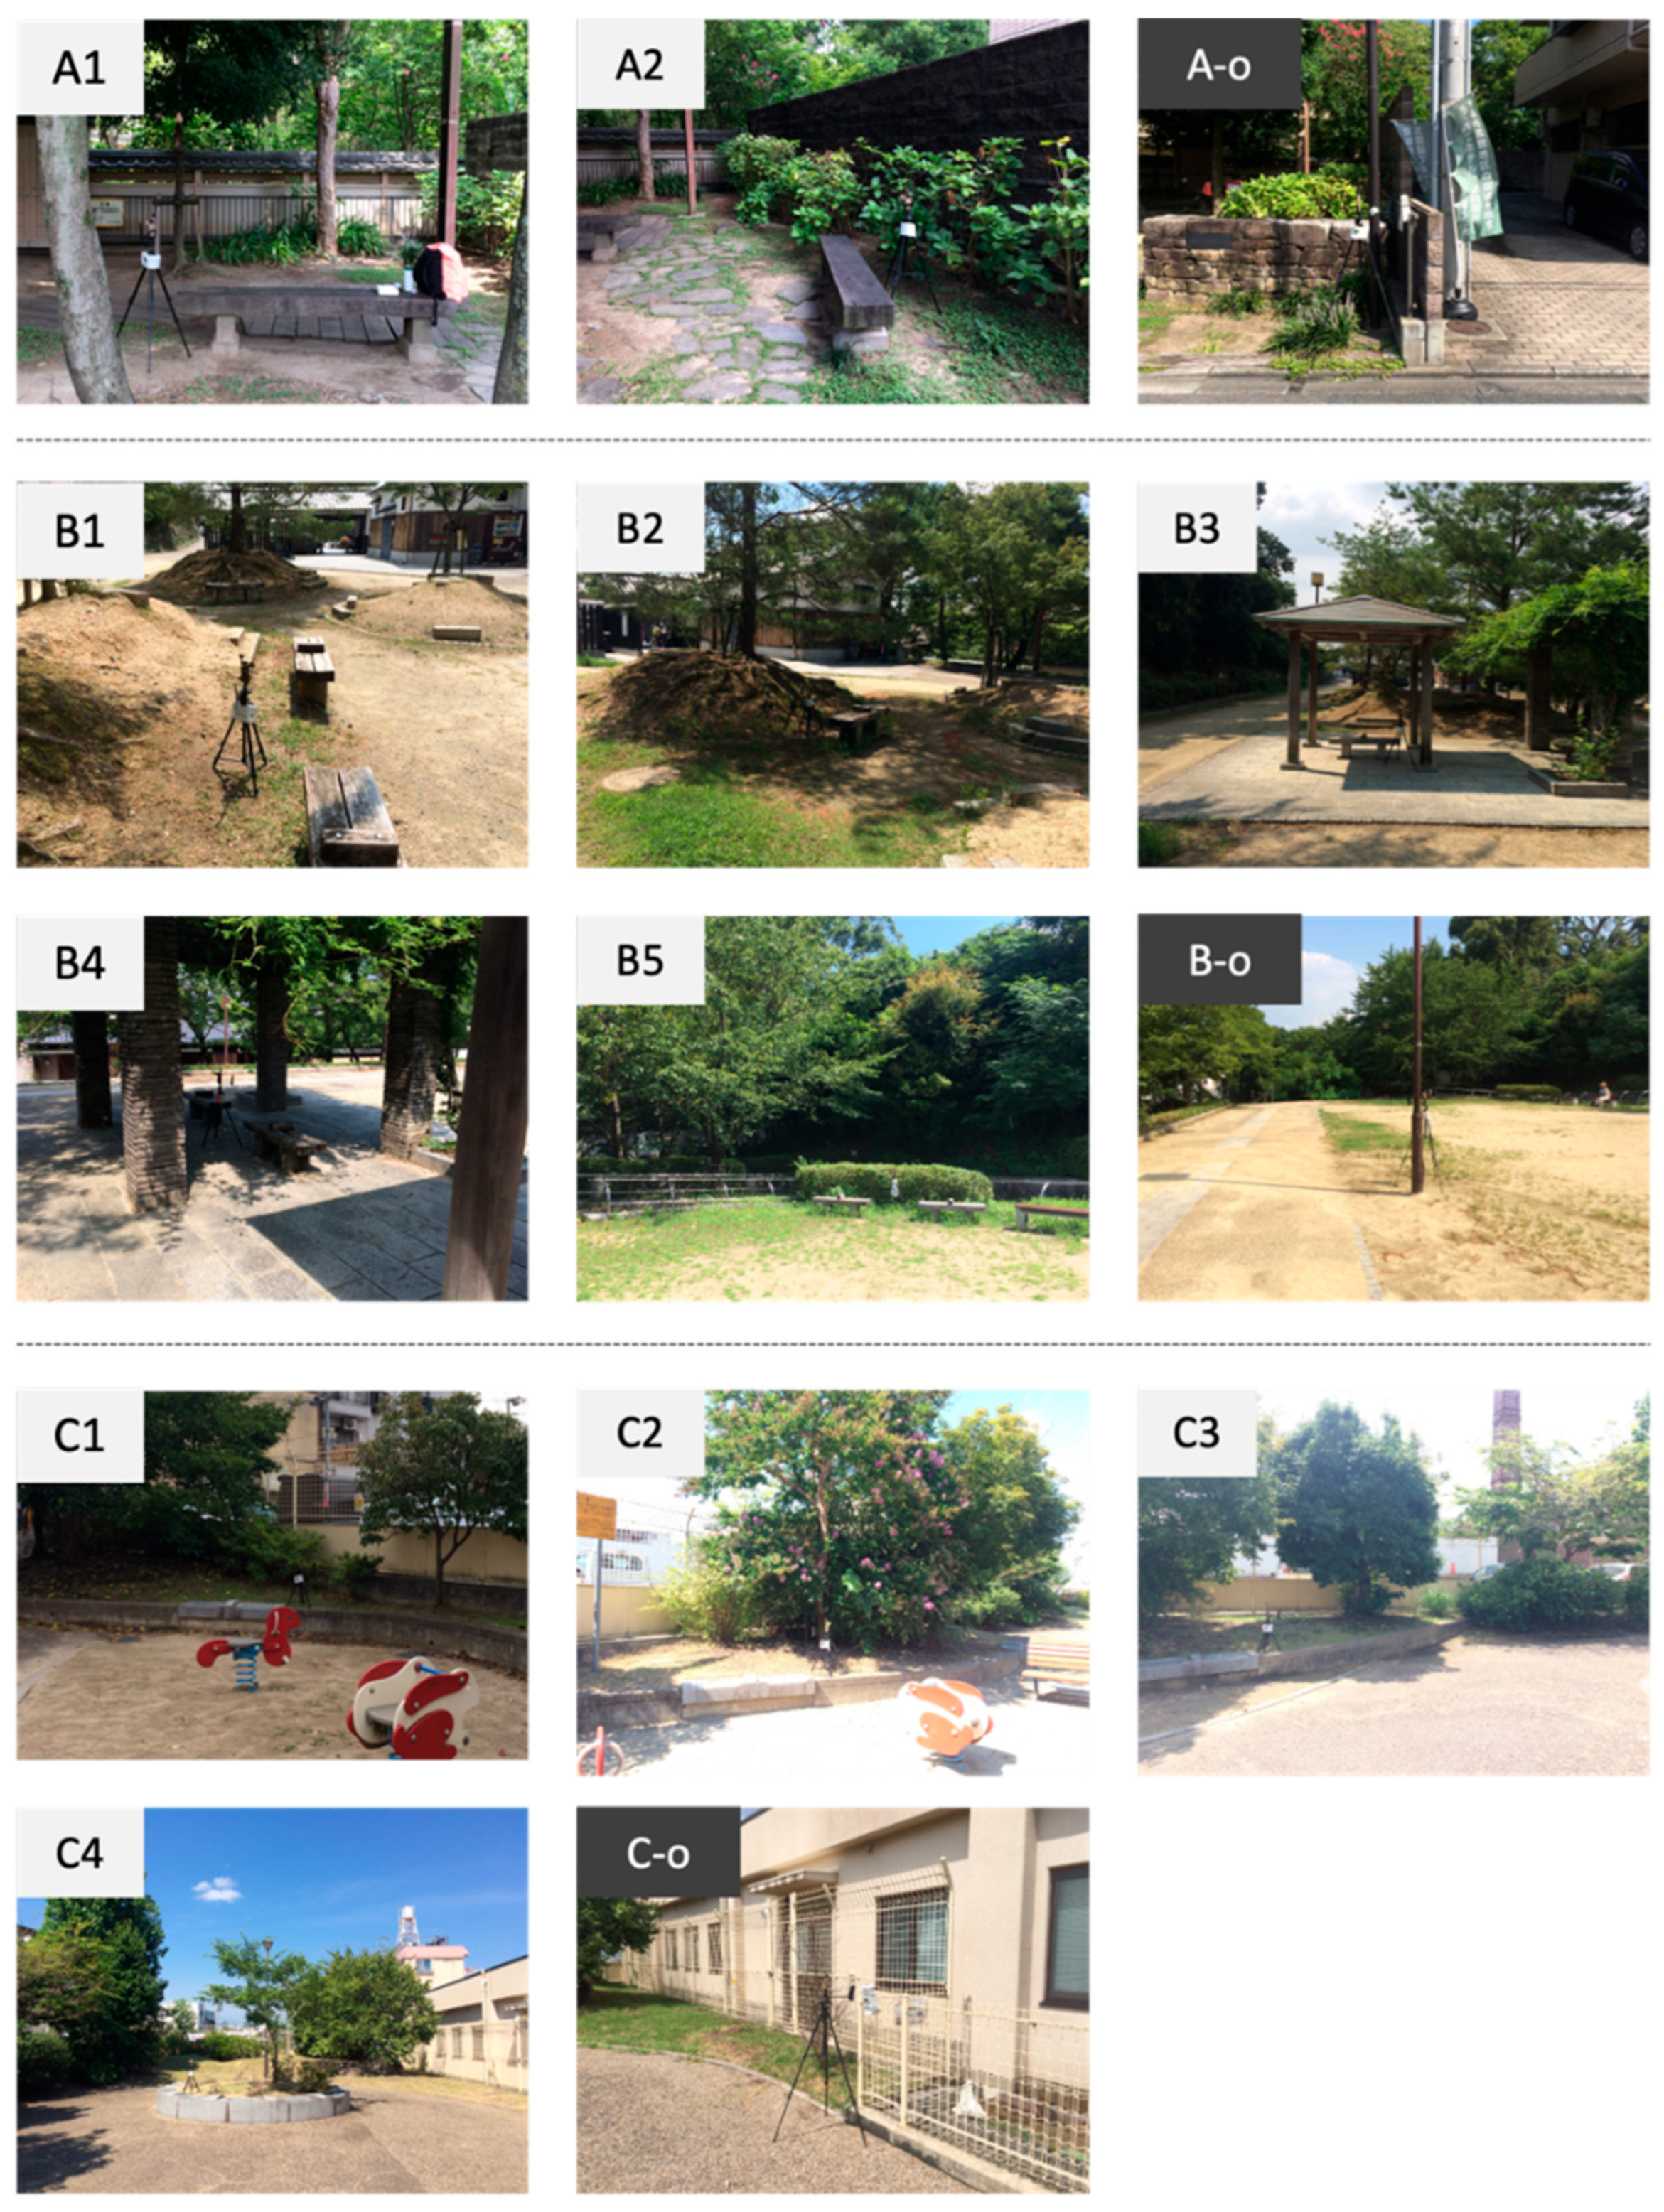
Meteorological measurements were conducted for three non-continuous days in each park from August to early September 2019. All the measurements were conducted on sunny or partly cloudy days, from 9:00 to 17:00. Since small parks are primarily used for resting, we focused on the thermal perception in resting areas. All resting areas, including benches and the seating areas under pavilions and trellises, were designated as study points (Figure 2b and Figure 3). For each park, we also established a reference point in a nearby open area to compare the difference in thermal perception between resting areas and the open area. Notably, as illustrated in Figure 2b, all three parks are located along narrow streets, making it difficult to find areas perfectly isolated from surrounding buildings and trees. We carefully selected reference points within or near the parks that were less likely to be shaded by surrounding buildings or trees and minimally affected by vehicle traffic.
Figure 3. Photos of the resting and open areas. Notably, the reference points A-o and C-o were placed to the south of the buildings and therefore were not shaded by the buildings during the study period.
The Kestrel 5400 Heat Stress Tracker (hereafter referred to as Kestrel) and the WatchDog 2400 Mini Station (hereafter referred to as WatchDog) were used to monitor thermal conditions (see Supplementary Material Table S1 for specifications). The Kestrel records air temperature (Ta), relative humidity (RH), wind speed (v), and globe temperature (Tg), all of which are necessary for evaluating physiological equivalent temperature (PET). Its high mobility allowed rotation between multiple resting areas with limited number of instruments (n = 3). In Park A, two Kestrels were placed by two benches, with one at the reference point (A-o). In Park B, three Kestrels were moved between paired study points (B1 & B2, B3 & B4, B5 & B-o) every 15 min. In Park C, two Kestrels were moved between C1 & C2 and C3 & C4 every 15 min, with a third placed at the reference point (C-o). As the sensor for measuring Ta requires approximately eight minutes to reach 95% accuracy, only data after this period were used for thermal perception evaluation. A notable limitation of the Kestrel is its lack of radiation shielding, leading to higher Ta readings due to solar radiation. To address this, Ta was simultaneously measured at reference points (A-o, B-o, and C-o) using the radiation-shielded WatchDog. All Kestrel-measured Ta values were calibrated against WatchDog data to ensure accuracy (see Supplementary Material Figure S1 for calibration details). In resting areas, sensors were tripod-mounted at the seated breast height of resting areas. For the reference point, sensors were mounted at 1.5 m, corresponding to the standing breast height of an average adult (Figure 3).

2.3. Thermal Perception Evaluation

Physiological equivalent temperature (PET) was used to evaluate the thermal perception experienced in the resting areas of the parks. Höppe developed PET in the 1990s according to the Munich Personal Energy Balance Model [], and today it is the most widely used index to assess thermal comfort []. RayMan model 1.2 [] was used to calculate PETs. In Central and Western Europe, PET values ranging from 18 to 23 °C indicate thermally comfortable conditions [] (Table 3). People in different regions perceive thermal conditions differently, hence researchers have calibrated the perception ranges of PET for different climates so that the evaluation can accurately reflect local people’s thermal perception. In this study, due to the lack of relative studies conducted in Japan, we used the PET perception ranges that were calibrated for people in central Taiwan (Table 3). Although central Taiwan is at a lower latitude, its hot and humid climatic conditions are closest to those of Kyoto compared to other cities that have calibrated PET perception ranges [].
Table 3. Physiological equivalent temperature (PET) values and relevant thermal perception in Central Western Europe and Central Taiwan.
The estimation of PET values requires the input of the mean radiant temperature (MRT), Ta, RH, and v as meteorological parameters, as well as personal parameters and clothing-insulation data. The metabolic rate was set to a sitting-quiet level (58 W). The clothing insulation was set to typical summer clothes (0.5 clo), and the personal data was set to a typical Japanese man at 35 years old (1.72 m tall and 71 kg, referred to the official statistics of Japan).
MRT represents the radiative exchange between the human body and its surrounding environment. It is a key factor for evaluating outdoor thermal conditions because people’s thermal perception is predominantly affected by radiation. We estimated MRT by using Equation (1) which was calibrated by Ouyang et al. [] for estimating MRT in hot and humid regions.
M R T = [ 273 + T g 4 + 0.678 × 10 8 v 0.019 ( T g T a ) / ε D 0.4 ] 0.25 273
where Tg is the globe temperature, Ta is air temperature, v is wind velocity, ε is the emissivity of the globe (0.95), and D is the globe diameter (0.025 m) of the globe thermometer.

2.4. Spatial Analysis

Spatial analysis was performed to examine the placement of key park elements, namely trees, roofs, green ground, and pavement in relation to resting areas. Definitions of these park elements are provided in Table 4. We first measured the area of park elements within 5, 10, and 20 m radii from the resting areas by using QGIS (version 3.16.11). These distances were selected because the composition of park elements was the most diverse within these ranges without extending too far beyond the park boundaries (Figure 4). The areas of roofs, green ground, and pavement were measured based on site plans of the parks provided by Kyoto City, while tree canopy coverage was measured using high-resolution aerial photographs taken in August 2020 (provided by Geospatial Information Authority of Japan), and cross-checked by Google Earth satellite imageries and onsite confirmation. Second, we analyzed the directional relationship between shade-providing elements and resting areas. Given the importance of shade for summer thermal comfort [], the combined area of tree canopies and roofs (TR) was additionally divided into four cardinal directions (Figure 4) and the proportion of TR in each direction was calculated.
Table 4. Definitions of the park elements considered in this study.
Figure 4. Satellite images of resting areas, within a radius of 20 m from the investigation points.

2.5. Statistical Analysis

A linear mixed-effects regression analysis was conducted to examine the relationship between the proportions of park elements and thermal perception in resting areas. In addition to the park elements’ proportions (fixed effects), variations in locations and survey dates (random effects) could influence thermal perception as well, because meteorological measurements were conducted on different days across the three parks. In this sense, linear mixed-effects regression models provide a more accurate estimation of the fixed effects on thermal perception, accounting for the random effects []. All statistical analysis was conducted with R (version 4.1.1), and the linear mixed-effects regressions were analyzed with the lme4 package.

3. Results

3.1. Thermal Perception in the Resting Areas and Surrounding Open Areas

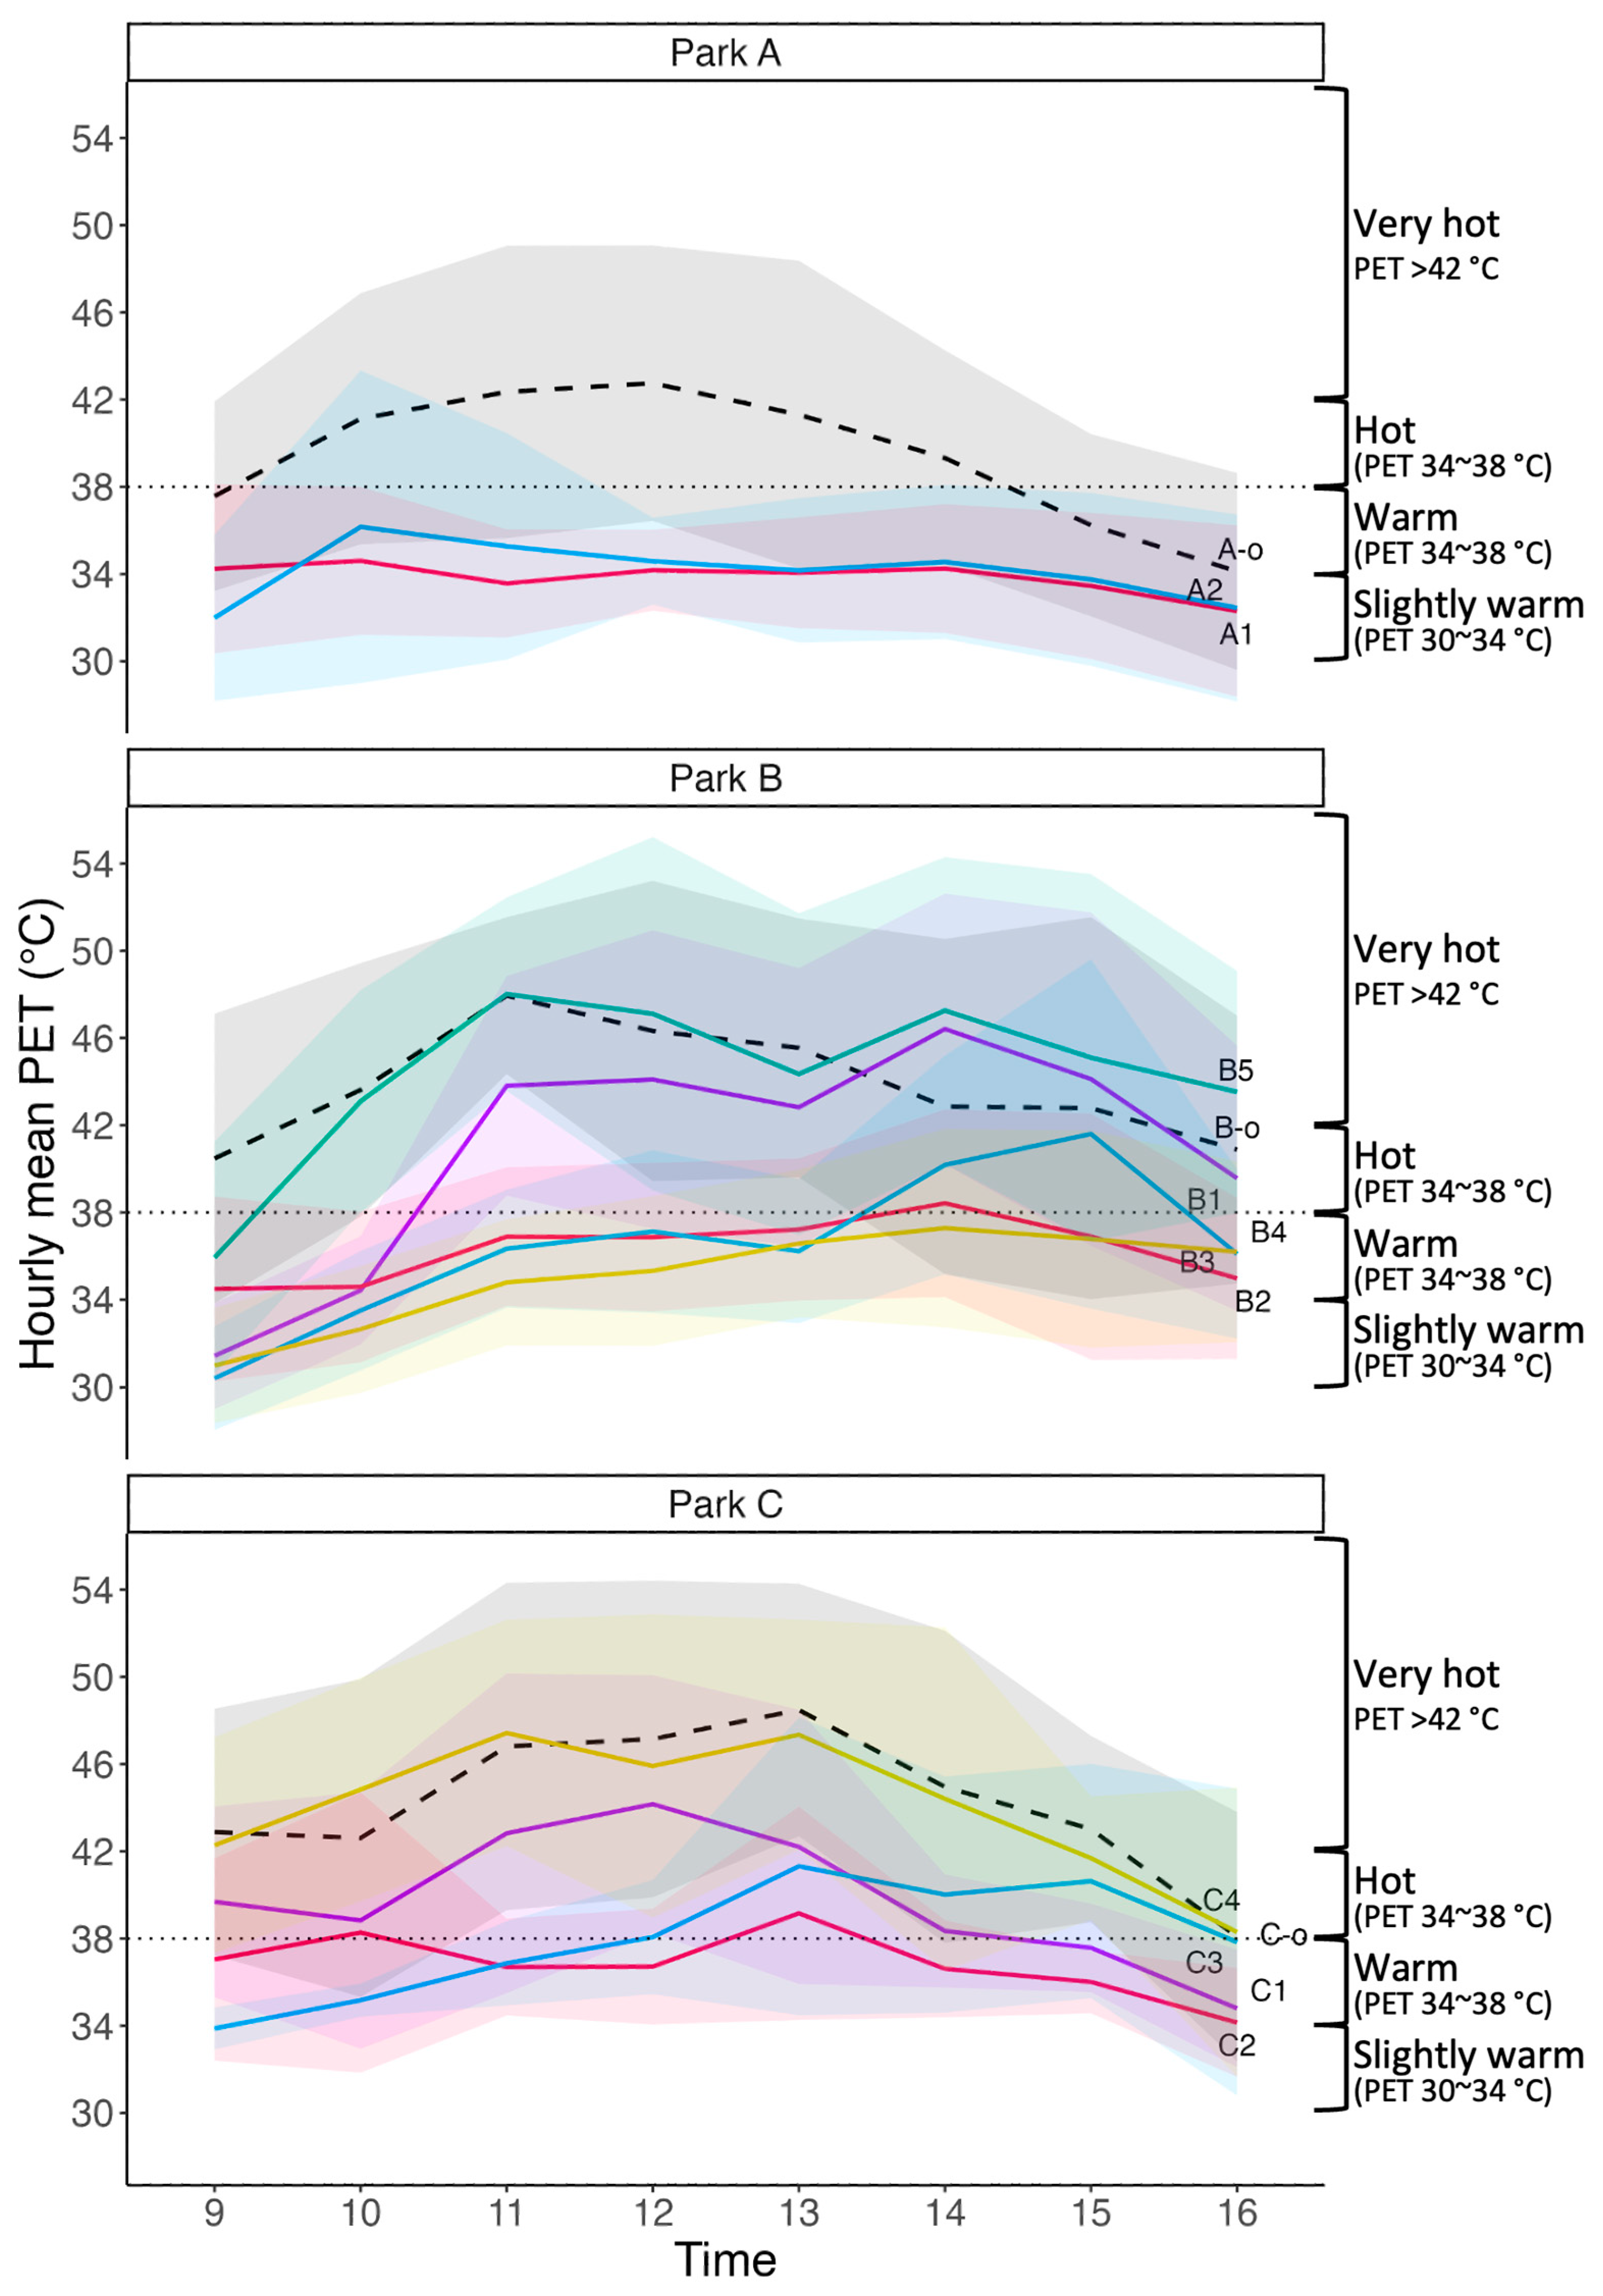
The maximum temperature on all nine survey days exceeded 30 °C, and, on five of those days, surpassed 35 °C (see Supplementary Material Table S2 for weather conditions). As shown in Figure 5, thermal conditions at the reference points were evaluated mainly as “hot” (PET of 38–42 °C) and “very hot” (PET > 42 °C), revealing severe hot conditions urban Kyoto would experience without heat mitigation measures. Compared to open areas, the thermal perception in the resting areas was generally improved but to different degrees. In Park A, the thermal perception at the two benches remained relatively stable during the survey period, ranging from “slightly warm” (PET of 30–34 °C) to “warm” (PET of 34–38 °C). This indicates that Park A was suitable for resting even on the hottest days in Kyoto. In contrast, the resting areas in Parks B and C exhibited varying thermal conditions. While some resting areas were mainly “slightly warm” and “warm,” about half of the resting areas were primarily “very hot,” indicating Parks B and C cannot comprehensively ameliorate heat stress.
Figure 5. Hourly mean PETs of resting and open areas during the survey period. Dashed lines represent PET trends in open areas and solid lines represent those in resting areas. Shaded areas indicate variability (±SD) around hourly mean PET shown by the lines of the same colors.

3.2. Spatial Relationship Between Park Elements and Resting Areas

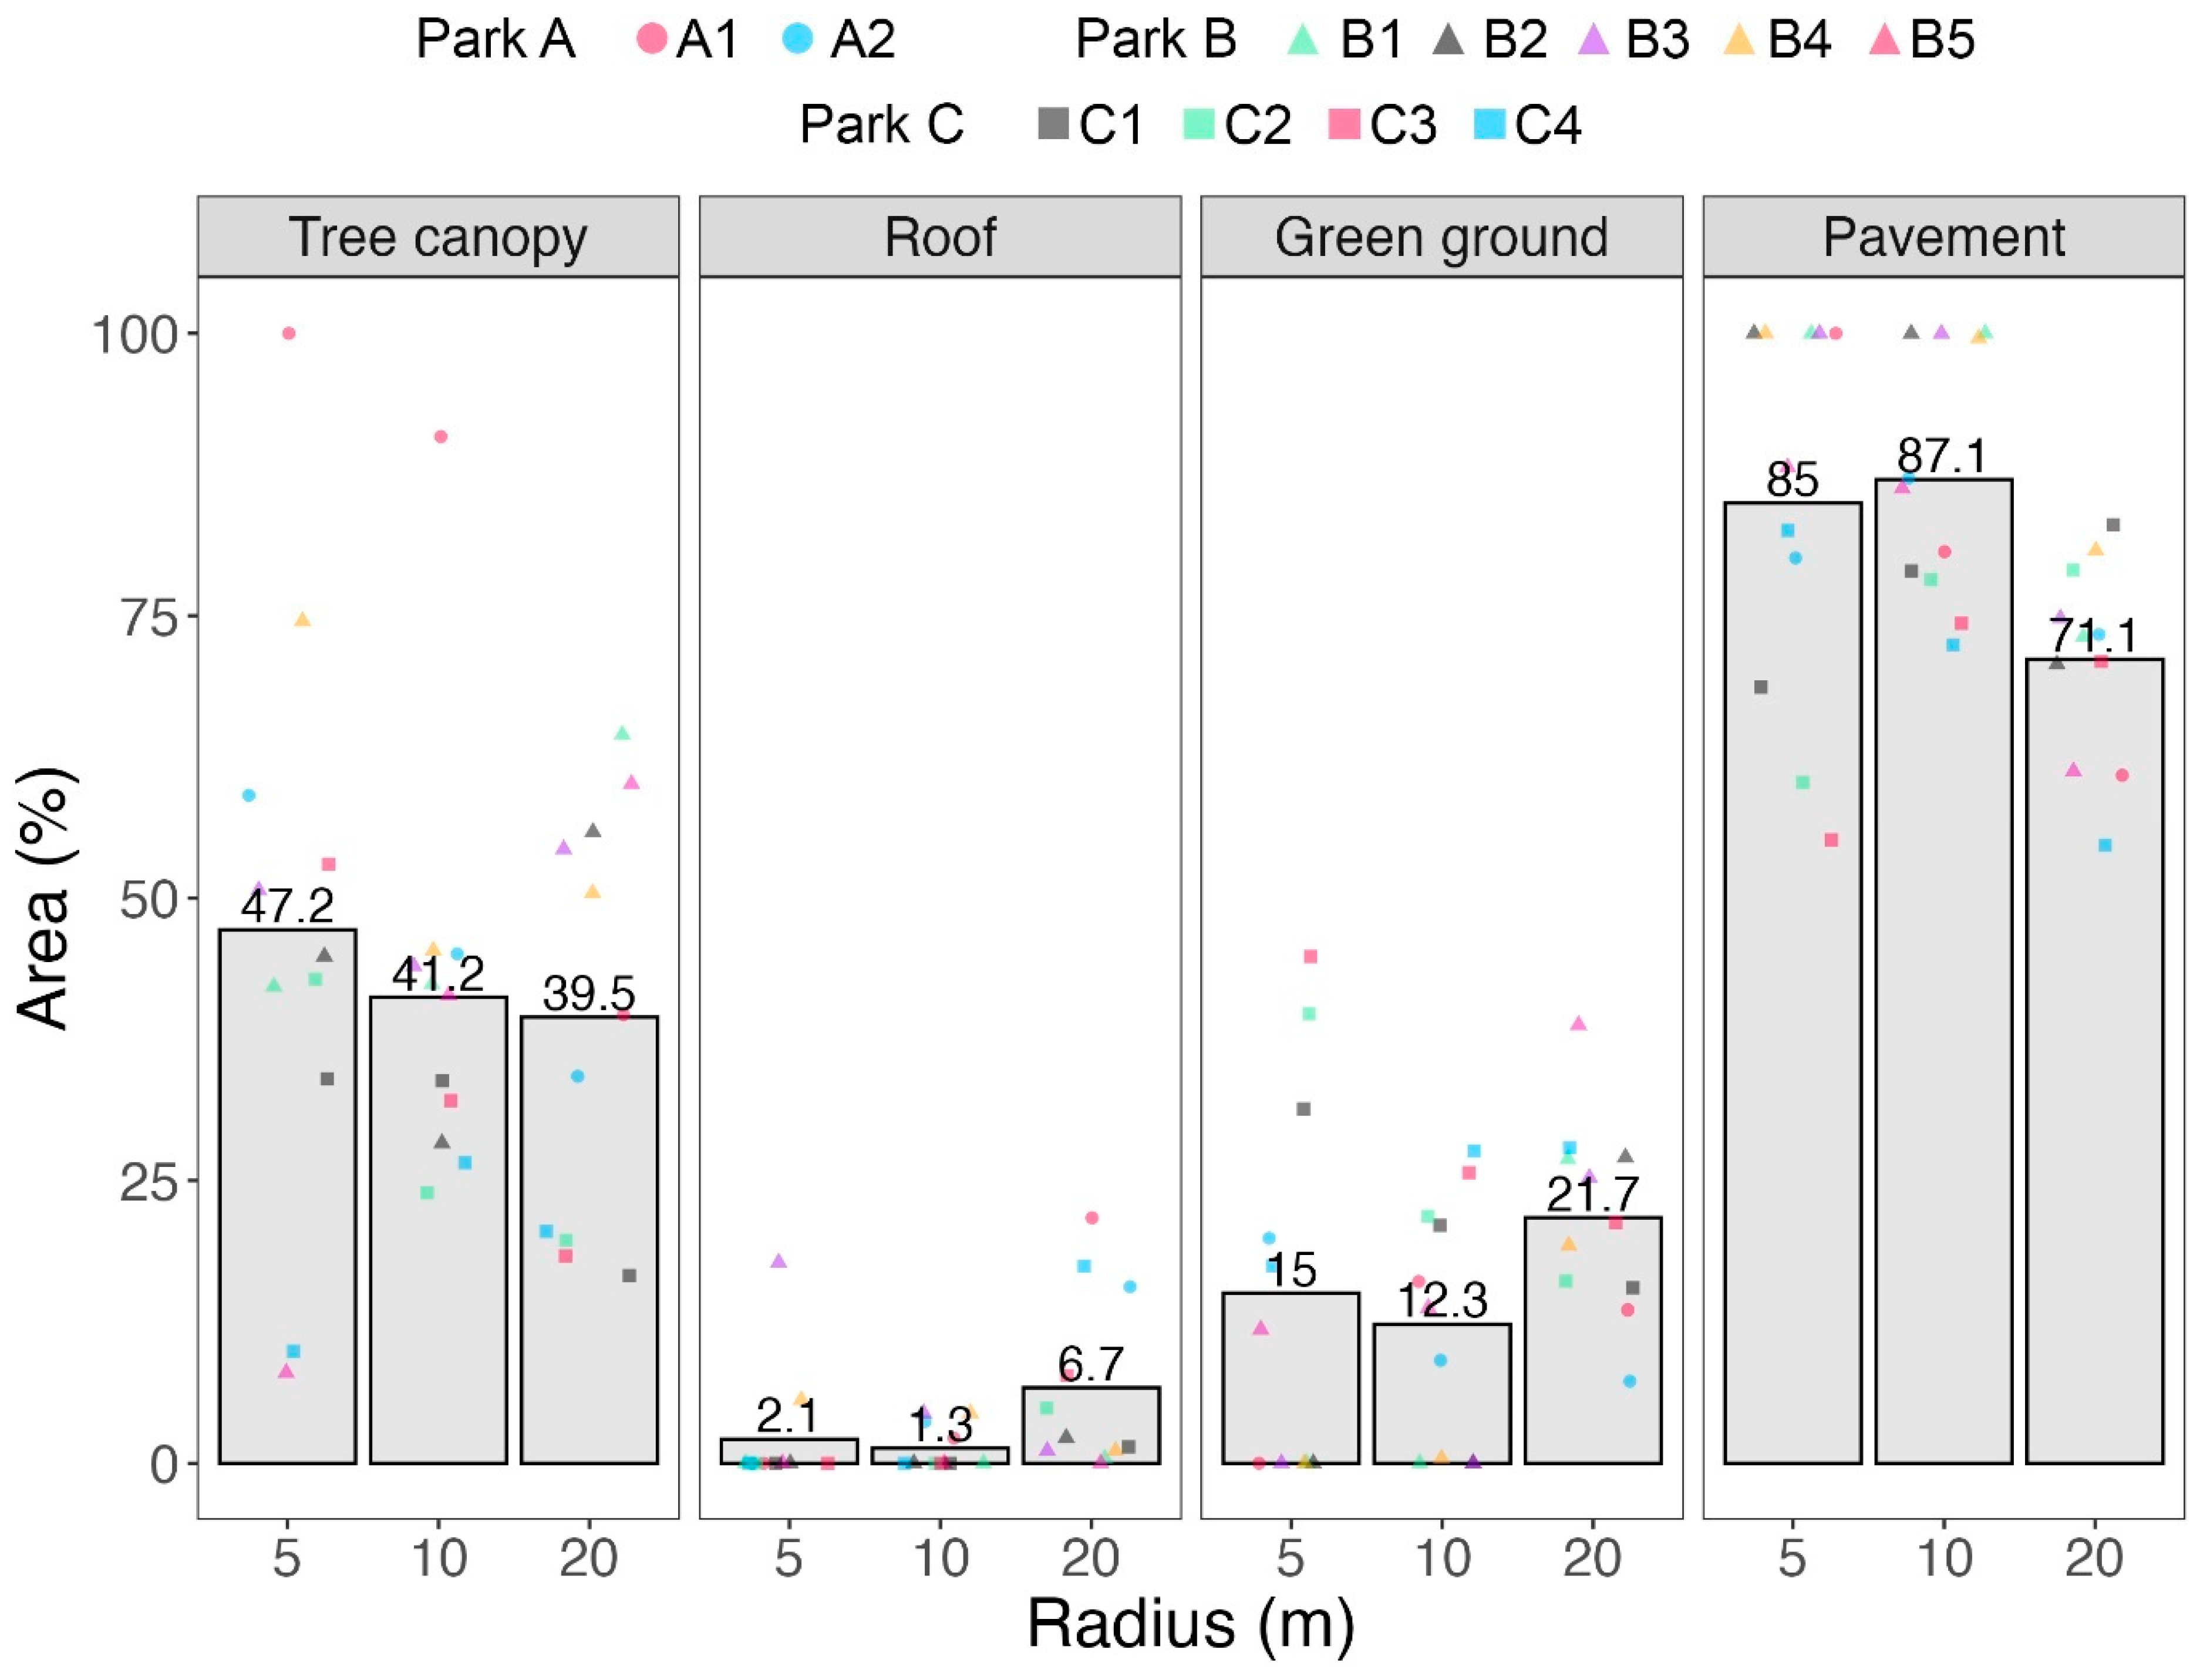
The proportions of the four park elements surrounding the resting areas highlight the diverse spatial environments of the resting areas (Figure 6). The most notable variation was observed in the tree canopy, the proportion of which ranged from 8% to 100% within a 5 m radius. On average, tree canopy cover within a 5 m radius was 47.2% but gradually decreased to 39.5% within a 20 m radius. As only one resting area (B3) was located under a pavilion, the average roof area was 2.1% and 1.3% within 5 and 10 m radii, respectively. However, the roof proportion increased to 6.7% within a 20 m radius due to the inclusion of nearby building roofs in the measurements. Pavement accounted for an average of over 85% within 5 and 10 m radii, making it the most extensively used park element surrounding the resting areas. The proportions of green ground and pavement within these radii were significantly and negatively correlated (see Supplementary Material Figure S2-1 for the full results).
Figure 6. Area (%) of the four park elements in 5, 10, and 20 m radii from the resting areas.
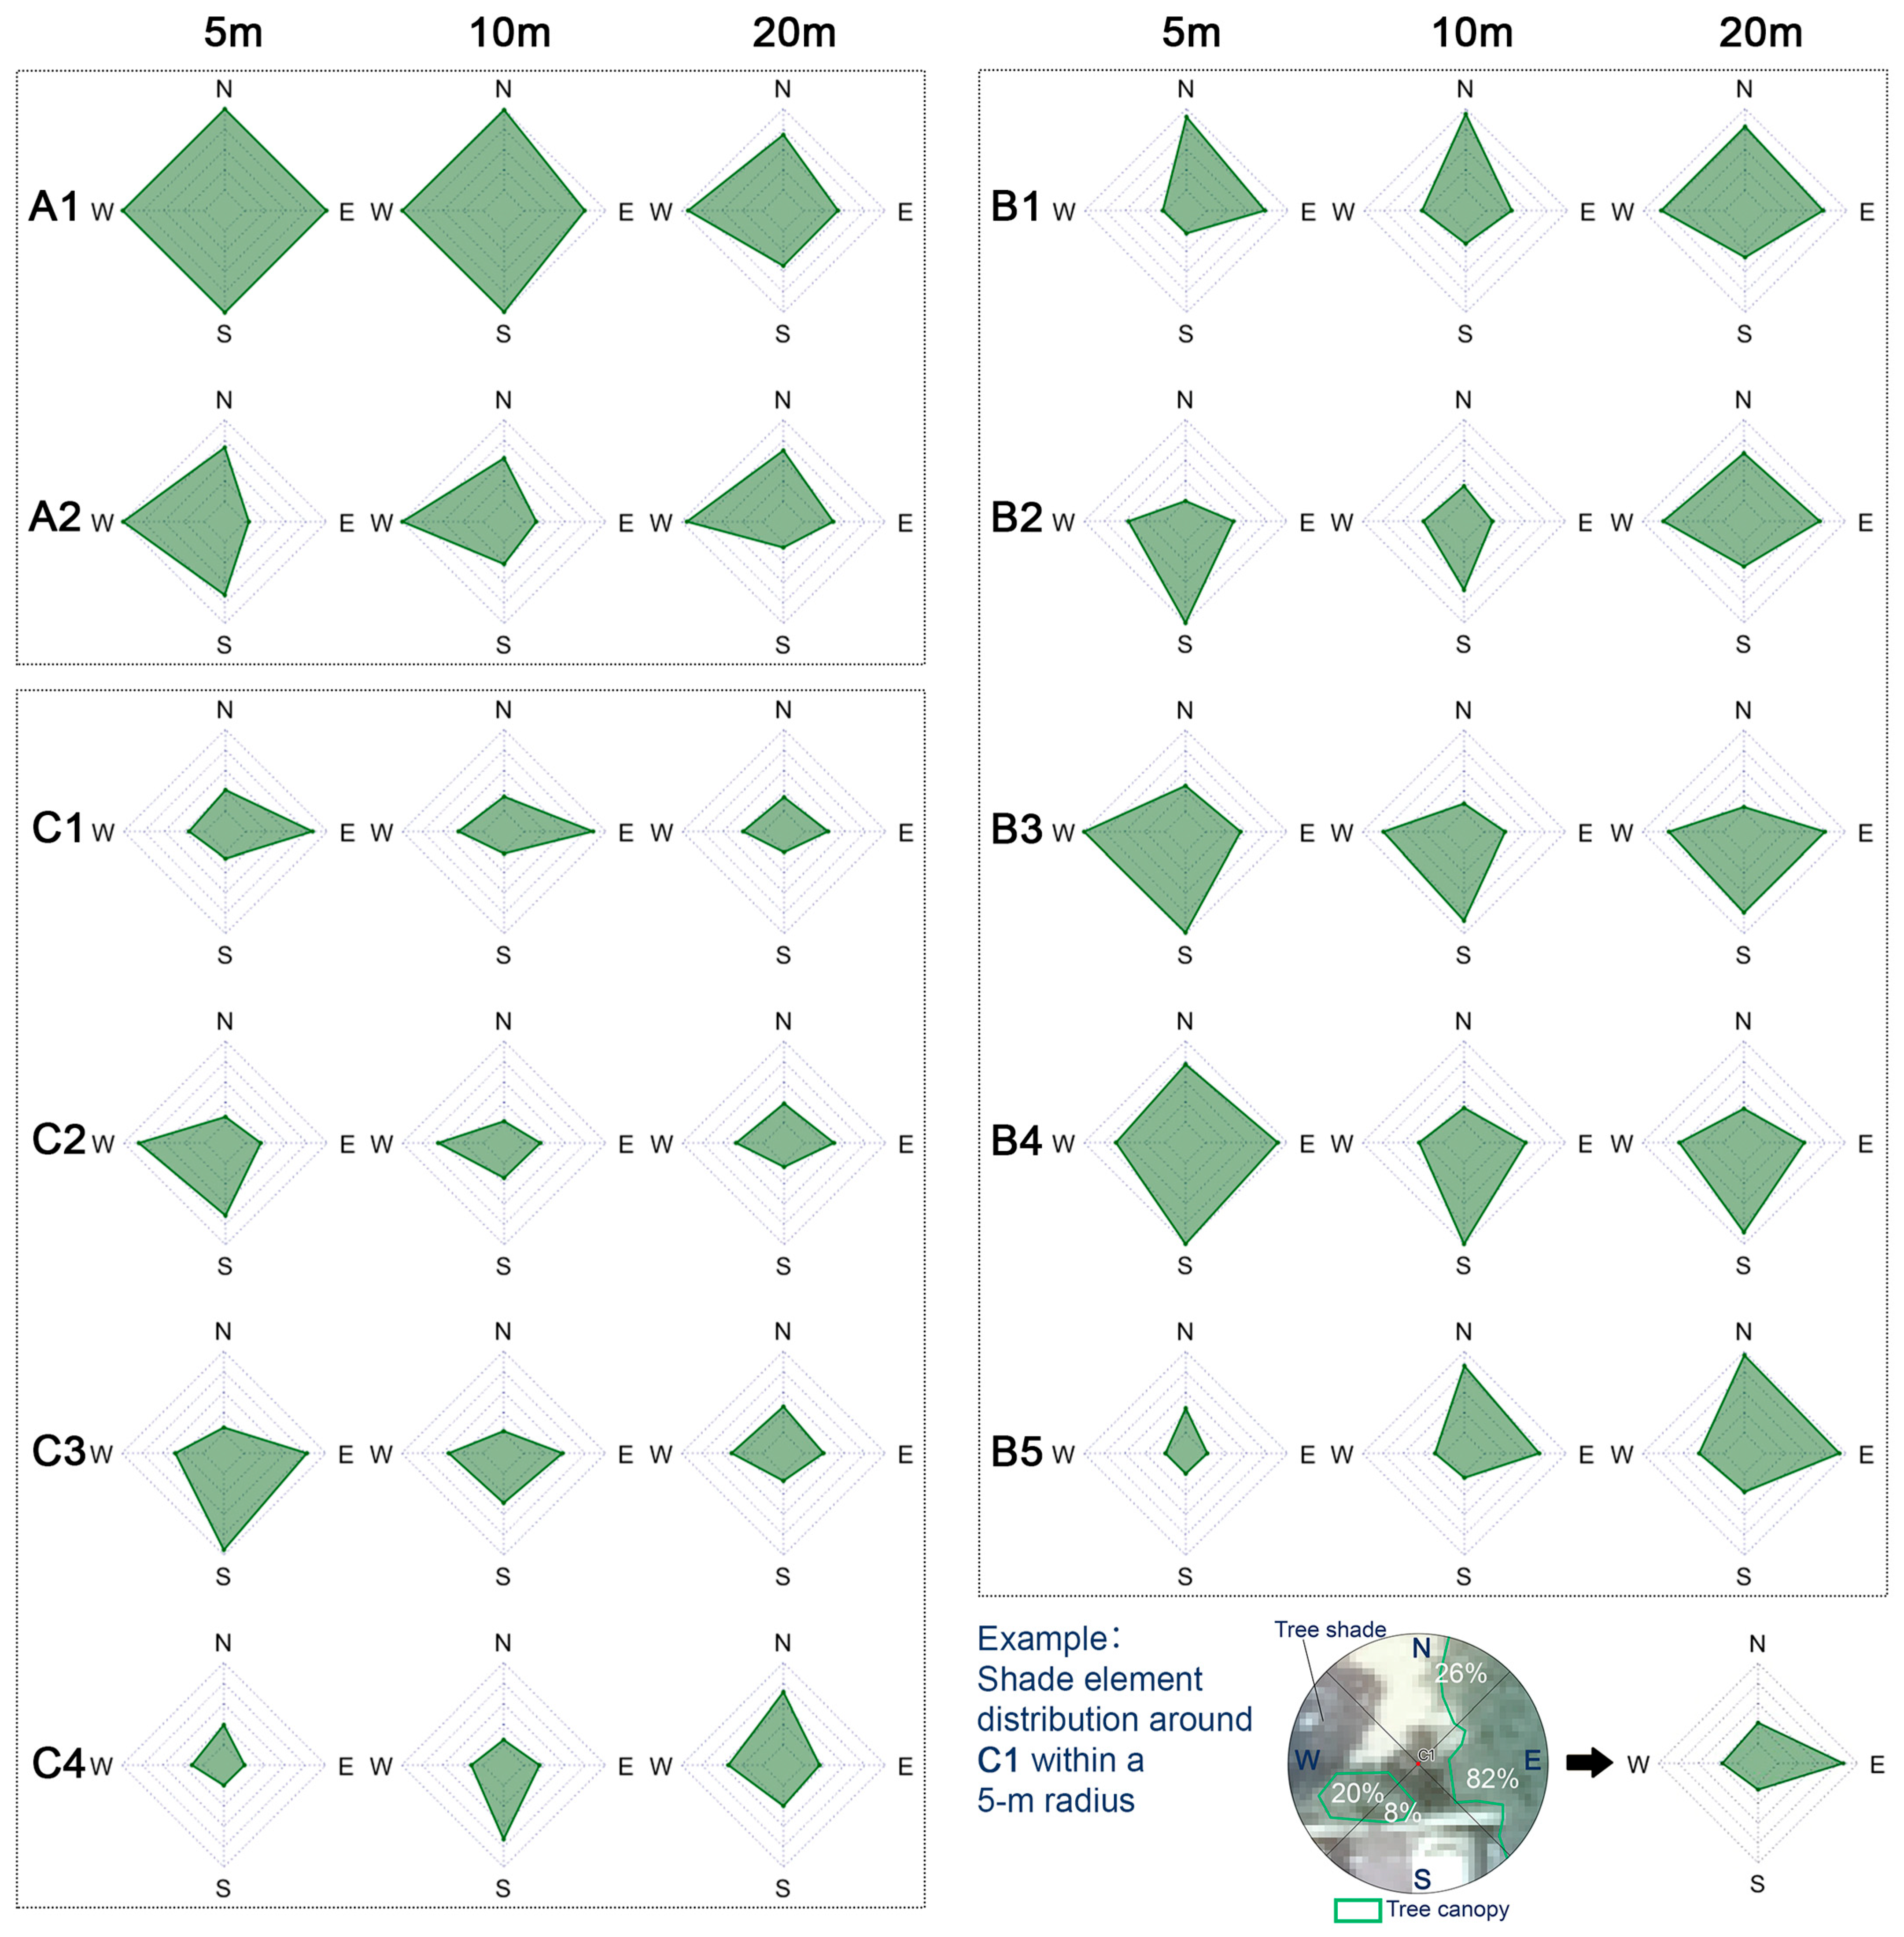
The cardinal distribution of tree canopies and roofs (TR) in relation to resting areas was presented in Figure 7. The orientation of TR is important when assessing whether the shade elements provide shade throughout different times of the day. For instance, B1 had 42.2% of TR within a 5 m radius but they were distributed mostly to the north and east of B1 (Figure 7). This spatial relationship left B1 exposed to solar radiation during noon and afternoon hours, resulting in high heat stress as shown in Figure 5. Similarly, although B1 and B2 had comparable proportions of TR within a 5 m radius (42.2% and 44.8%), thermal perception in B1 was significantly hotter than that in B2. This disparity arose because the TR around B1 were primarily located to the north and east, whereas around B2 they were positioned to the south, offering more effective shading during the hottest hours. The relationship between the orientation of shade elements and thermal perception is further discussed in Section 3.3.
Figure 7. Proportion of shade elements (tree canopies and roofs) across the 11 resting areas within the radii of 5, 10, and 20 m, presented in four cardinal directions.

3.3. Effects of Park Element Placement on Thermal Perception in Resting Areas

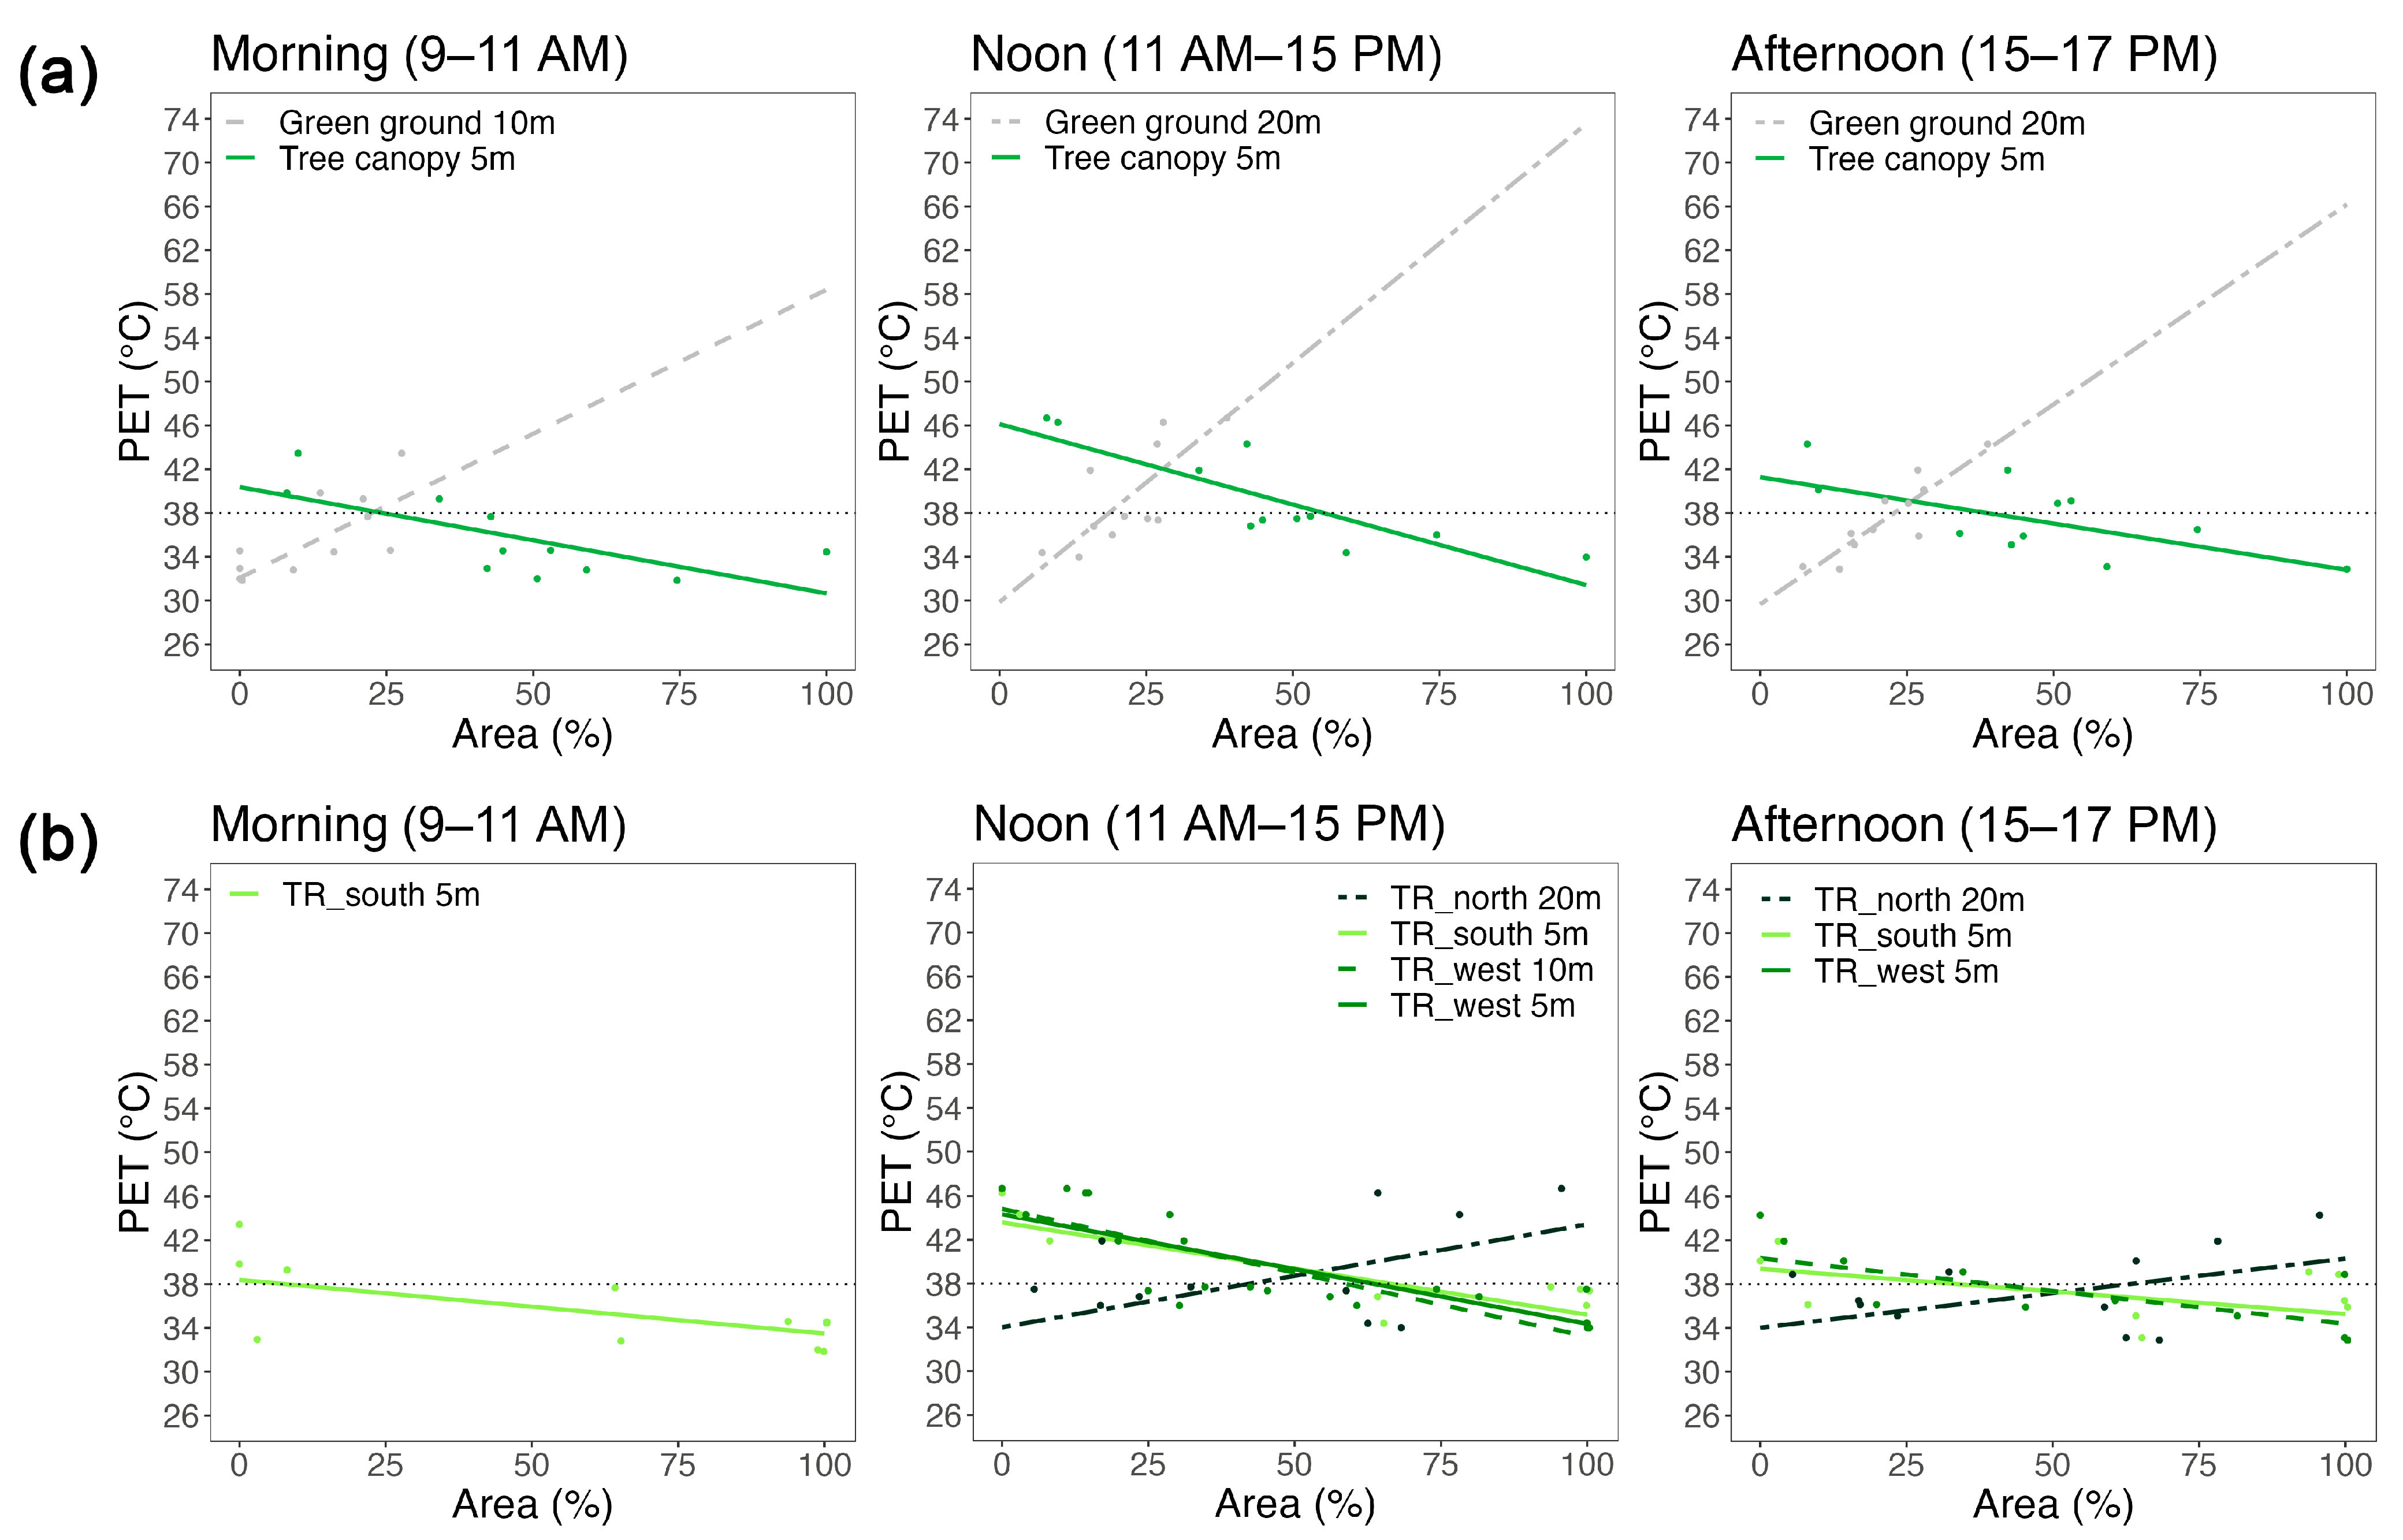
Among the four park elements examined, tree canopies and green ground significantly influenced the thermal perception (Figure 8a). In line with previous studies, resting areas with a higher proportion of surrounding tree canopies exhibited improved thermal conditions from morning to afternoon. A novel finding of this study, however, is that this relationship is significant only within a 5 m radius. Taking resting area B5 as an example, because most trees were in some distance to it, it experienced “very hot” thermal conditions throughout the survey period despite it having about 60% tree canopy coverage within a 20 m radius. This highlights the importance of proximity and the shade effect of trees, underscoring that the cooling effect of trees is most effective when they are located close to resting areas. Although roofs could have effectively improved thermal perception, as there was a very limited area of roofs near the resting areas (2.1% within a 5 m radius), no significant relationship was found between roof areas and PET values.
Figure 8. Relationships between the PETs in the resting areas during the morning, noon, and afternoon hours and (a) the area of park elements, as well as (b) the area of shade elements in four directions. The horizontal dotted line at 38 °C marks the threshold for "hot" thermal conditions. Note that only the significant relationships (p < 0.05) were plotted on this figure. Each point represents a resting area, and its PET value represents the average PET value for morning, noon, or afternoon at that location. See Supplementary Material Tables S3 for the full results.
To further investigate the effect of shade orientation on thermal comfort, the correlation between TR (the combined proportion of tree canopies and roofs) in four cardinal directions and PET was examined. As shown in Figure 8b, PET values were influenced by TR in specific directions, with the effects varying by time of day. In the morning (9–11 AM), TR to the south of resting areas (TR_S) within a 5 m radius significantly reduced PET. During midday (11 AM–15 PM), TR_S within a 5 m radius and TR_W within 5 and 10 m radii had strong heat mitigation effects. In contrast, TR to the north (TR_N) within a 20 m radius significantly worsened thermal perception during this period. This phenomenon persisted into the afternoon, lasting until 17:00. This negative effect was probably attributed to TR_N’s inability to provide shade and its potential to obstruct air movement and increase humidity, thereby reducing thermal comfort. In the afternoon (15–17 PM), TR_S and TR_W within a 5 m radius continued to be negatively correlated with PET. Meanwhile, TR_E showed no significant correlation during any of the survey periods. While many studies have emphasized the benefits of tree canopy coverage, our findings highlight that trees are not always beneficial but only when they are strategically oriented to provide shade over resting areas.
Linear mixed-effects models further suggest that, to maintain thermal perception below the “hot” condition (PET < 38 °C) during morning hours, about 8% coverage of TR_S is needed within a 5 m radius. As heat intensifies over time, the required shade coverage increases as well. At noon, TR_W coverage is suggested to exceed 63% and TR_S coverage should exceed 66% within a 5 m radius. Notably, TR_S plays a slightly more important role at noon, whereas in the afternoon, greater coverage of TR_W is required, about 40% TR_W and 34% TR_S, to maintain PET below 38 °C.
While previous studies have suggested that green ground contributes to summer thermal comfort, our findings indicate the opposite, that larger areas of green ground were associated with increased heat stress (Figure 8a). Specifically, green ground within a 10 m radius was negatively correlated to thermal comfort during the morning (9:00–11:00) and green ground within a 20 m radius had negative effects from noon to late afternoon (11:00–17:00). This adverse effect is likely attributable to the fact that green ground in these parks was more frequently paired with open sky than with shade elements. Supporting this interpretation, the linear correlation analysis of park element proportions revealed a negative association between green ground within a 20 m radius and tree canopy within a 5 m radius, as well as TR_W within 5 and 10 m radii (see Supplementary Material Figure S2-2). These results suggest that high thermal stress in some resting areas was not directly caused by the presence of green ground, but rather by a lack of shade over both the resting areas and the adjacent green ground. This points to a potential mismatch in park spatial design: resting areas surrounded by green ground are more likely to be open, and thus exposed to direct solar radiation, while those adjacent to paved surfaces are more often shaded and thermally comfortable.
Overall, the results suggest that shade elements—particularly those located to the west and south of resting areas and positioned nearby—play a crucial role in enhancing thermal comfort. In contrast, shade elements that do not provide shade to resting areas, whether due to their distance or orientation, as well as green ground lacking overhead shade, do not contribute to thermal comfort during hot summer days in Kyoto.

4. Discussion

4.1. Thermal Perception in the Resting Areas of Small Urban Parks

Urban thermal conditions in Kyoto apply high heat stress on people as exhibited by the high PET values in the open areas (Figure 5). Therefore, cool urban parks are essential for helping pedestrians and outdoor workers relieve heat stress and enabling children to safely enjoy outdoor activities during the summer. This study focused specifically on resting areas within small urban parks to examine whether they are strategically designed to alleviate heat stress for visitors seeking relief from urban heat. Contrary to the common belief that urban parks provide cooling effects, not all resting areas in the study parks offered sufficiently cool environments for comfortable rest. From noon to the afternoon, half of the resting areas were “very hot”, while the other half were “warm” or “hot.” These findings suggest that a considerable number of small urban parks in Kyoto may not effectively mitigate heat stress, particularly during the hottest hours of the day. Considering the warming climate and increasing frequency of extremely hot days, enhancing the thermal conditions of resting areas in small urban parks will be crucial to maintaining their usability and contributing to a climate-resilient urban environment.

4.2. Suggestions for Small Urban Park Design for Thermal Comfort

The findings of this study suggest that shade provision is the most critical intervention for improving thermal comfort in the hot and humid climate of Kyoto. This aligns with previous studies conducted in regions with similar climatic conditions, such as southern Taiwan [], Hong Kong [], and central Japan [], where shade from trees and shelters was identified as the dominant factor reducing heat stress.
Many studies have proposed practical design and planning strategies for effective shading. Kántor et al. [] examined the heat mitigation effect of trees and sun sails in southwestern Hungary and found that both significantly improved thermal perception, with dense canopy reducing PET the most, followed by sparse canopy, and sun sails. Similarly, a study conducted in central Japan reported that building and pergola shades improved thermal perception to a comparable degree []. These findings suggest that shade elements with low transmissivity, such as dense canopies, buildings, and pergolas are effective in enhancing thermal comfort. In addition, numerous studies have explored ways to improve pedestrian comfort. Research in Colombo (Sri Lanka) [] and Hong Kong [] found that deeper street canons are positively associated with pedestrians’ thermal comfort, as narrower streets and taller buildings provide more extensive and longer-lasting shade.
A novel and significant contribution of this study is the emphasis on the strategic placement and orientation of shade elements in relation to resting areas within small urban parks.
(1)
Orientation and placement of shade elements:
To block solar radiation effectively, shade elements should be placed to the west and south of resting areas. We also recommend placing shade elements and resting areas in proximity, ideally within a 5 m radius. While this may seem obvious, especially for artificial shelters like pavilions and roofs, as benches are typically placed beneath them, the alignment between trees and resting areas is often less consistent. For instance, in our study parks, nearly half of resting areas lacked effective shading, while some well-shaded spots under large tree canopies were left unused simply due to the absence of seating amenities.
The sun’s position varies throughout the day, causing shifting shadow patterns. During the morning hours (9:00–11:00), when the sun was high in the southeast, shade elements to the south within a 5 m radius had a significant influence on thermal perception. Around midday (11:00–15:00), with the highest solar altitude, shade elements with sufficient horizontal spread became essential for providing effective shade. Accordingly, shade elements to the west and south within a 5 m radius showed the strongest mitigation effect. As the sun moved westward during this period, west-side shade elements within a 10 m radius still provided some shading, though less effectively than those positioned closer to the resting areas (Figure 8b). In the afternoon (15:00–17:00), as the sun lowered toward the west and shadows extended, west-oriented shade became more important while the required TR proportion decreased. Overall, close-proximity shade elements provide shading benefits in low-latitude summer conditions. In practice, the placement of shade elements can also be adjusted according to typical periods of use. For example, green spaces in busy districts require a more extensive and evenly distributed shade to support full-day use, whereas spaces primarily used for morning or evening exercises may be effectively shaded with a moderate amount of cover concentrated on the south or west.
(2)
Proportion of shade elements:
The results indicate that positioning over 60% of shade elements to the west or south of resting areas, within a 5 m radius, can prevent those areas from becoming “hot” during peak daytime temperatures (11:00–15:00). For afternoon comfort (15:00–17:00), 30–40% shade elements are required. As morning thermal conditions are relatively cool, approximately 10% shade coverage to the south is sufficient. A study on Japanese gardens in Kyoto [] suggest maintaining about 85% and 80% shade coverage within 5 and 10 m radii, respectively, to maintain a PET below 38 °C. These quantitative thresholds offer practical value for park designers and urban planners, enabling the creation of thermally comfortable rest spots in limited spaces using the minimum number of trees or shelters.
Beyond hot and humid regions, the strategic placement of shade elements is also critical for summer thermal comfort in other warm climates. However, the optimal density and type of shade should be calibrated to local climatic conditions. For instance, evergreen trees provide continuous shading and are advantageous in regions with extended hot seasons, while deciduous trees can enhance seasonal comfort in temperate climates by offering shade in summer and allowing solar warming in winter. Therefore, while the design suggestions proposed in this study have broad applicability, vegetation selection and seasonal management should be tailored to regional climate characteristics.
(3)
Balancing shade and ventilation:
In this study, the effects of trees and buildings (roofs) were primarily assessed through their contributions to shade provision. However, these elements may also influence thermal perception by blocking wind. A simulation study of urban canyons reported that higher green coverage ratios and denser tree canopies weaken airflow []. Similarly, in this study, the proportion of tree canopies and roofs located to the north within a 20 m radius (TR_N) was negatively associated with thermal perception (Figure 8b). Although this effect was not explicitly quantified in the present analysis, it should be further examined in future studies and carefully considered in practical park design.
(4)
Ground materials:
The effect of green ground on thermal comfort has been found to be weak in many studies [,], including the present study. This is likely due to the small volumes of ground vegetation in small green spaces and inappropriate placement of green ground. Although small patches of green ground may not substantially improve thermal perception, increasing green ground coverage reduces pavement area, which is important because paved surfaces can intensify heat stress, especially under direct sunlight []. In this study, green ground was negatively correlated to thermal comfort (Figure 8a) because resting areas surrounded by a large proportion of green ground were often designed to be open with fewer trees. As this study examined only three parks, further research is needed to determine whether this pattern is widespread in park design. Nevertheless, unshaded green ground not only provides limited cooling but is also vulnerable to water stress under solar radiation, whereas shaded green ground can further enhance thermal comfort due to lower surface temperatures []. Similarly, both Cui and Shibata [] and Cui et al. [] suggest that green ground enhances thermal comfort when it is extensive and shaded. Taking these findings into account, along with the broader benefits of green ground, including habitat provision and flood mitigation, we recommend prioritizing green ground over pavement in urban parks, provided that effective shade is ensured during the hottest hours of the day.

4.3. Limitations

This study has several methodological limitations that should be considered when interpreting the findings.
This study only investigated three small urban parks. While the results indicate that many resting areas lack thermal comfort, the small sample size limits the generalizability of findings. A comprehensive evaluation of thermal conditions across urban parks is therefore needed to identify those lacking cooling capabilities, which could serve as a first step toward enhancing cities’ heat resilience. Such assessments would help the government develop long-term heat-mitigation strategies, improve the thermal conditions of existing urban parks, and ultimately contribute to more resilient urban environments.
The limited number of study points (n = 11) also restricts the ability to generalize the relationships between park spatial design and thermal perception. Future studies should collect a larger volume of meteorological and spatial data to improve the accuracy of regression models. This approach, however, is time-consuming, labor-intensive, and expensive. In this sense, numerical simulations could serve as valuable tools for quantifying the efficacy of various spatial designs and suggesting practical green space designs that can mitigate heat stress under prevailing and future climates.
Due to the limited number of instruments, thermal conditions in Parks B and C were measured at 15 min intervals using rotation protocol. This may have introduced temporal aliasing, potentially missing short-term peak exposures. To mitigate this bias, measurements were conducted over three days at each site under similar weather conditions, allowing the temporal variation to be averaged across the dataset.
Air temperatures were obtained using a combination of Kestrel and WatchDog. Although empirical calibration was applied, certain errors remained (RMSE = 0.872 °C). This was likely because the calibration was based on open conditions, while field measurements included both shaded and sun-exposed locations, which may have introduced site-specific deviations. Nevertheless, because all data were collected and processed consistently and the calibration was based on a large dataset (n = 2254), we consider the overall thermal patterns and comparative findings to be robust.
Thermal perception was evaluated based on the PET thresholds calibrated in central Taiwan. Although previous studies suggest that populations in hot and humid climates tend to exhibit similar summer thermal perceptions [,], this study did not verify whether the PET thresholds derived from central Taiwan are appropriate for the population in Kyoto. Therefore, further research should establish locally calibrated PET thresholds that accurately reflect thermal perception in Japanese cities.
Heat mitigation strategies should not sacrifice winter thermal comfort. Kyoto’s winters are cold and humid, making open and bright environments desirable during this season. Deciduous trees should be ideal for placement near resting areas, as they provide shade in summer while allowing sunlight to penetrate in winter. However, this study focused exclusively on summer conditions, and therefore the findings primarily reflect heat mitigation performance rather than year-round thermal comfort. Future studies need to incorporate multi-seasonal measurements to seek the most ideal design strategies for the thermal comfort of urban parks in all seasons. In addition, airflow affects thermal perception differently in hot and cold seasons. Studies exploring the relationships between spatial configurations and desirable wind conditions would further enhance climate-responsive park designs.

5. Conclusions

In this study, we evaluated the thermal conditions of 11 resting areas across three typical small urban parks (<5000 m2) and assessed whether these parks can protect people from summer heat in a hot and humid city. Approximately half of the resting areas were found to be unsuitable for use on hot summer days. As urban temperatures continue to rise, these conditions are likely to worsen, leading to underutilization of valuable urban green spaces. Immediate improvements in park design and thermal conditions are therefore required. Our findings indicate that strategic placement of park elements is key to ameliorating heat stress. Shade elements should ideally be placed within a 5 m radius of resting areas. Orientation also matters. Shade elements placed to the east or north of resting areas contribute little to thermal comfort, whereas placement to the west and south maximizes heat mitigation, with hottest hour thermal comfort achieved when shade elements occupy more than 60% of the area within a 5 m radius. Notably, thermal comfort at noon relies more on south-facing shade, while afternoon comfort relies more on west-facing shade. While green coverage and accessibility are widely acknowledged as important park qualities, our observations suggest that not all parks effectively reduce heat stress, highlighting the need for evidence-based design guidance. As cities become hotter, accessibility alone is insufficient if parks do not provide comfortable shelters. We recommend that cities, especially in hot regions, establish design guidelines to ensure every neighborhood has access to parks with high heat mitigation capacity. Such parks are especially critical in neighborhoods with low-income residents or a high share of older adults, who are more vulnerable to summer heat and have a greater need for cool public spaces [,]. In Japan, which has the world’s highest share of elderly citizens—28.9% aged 65 and above in 2021 []—strategically designed urban parks can significantly enhance both park value and citizens’ well-being [,].

Supplementary Materials

The following supporting information can be downloaded at: https://www.mdpi.com/article/10.3390/cli13110234/s1.

Author Contributions

Conceptualization, L.C. and S.S.; methodology, L.C. and S.S.; formal analysis, L.C.; investigation, L.C.; writing—original draft preparation, L.C.; writing—review and editing, L.C. and S.S.; visualization, L.C.; supervision, S.S.; funding acquisition, S.S. All authors have read and agreed to the published version of the manuscript.

Funding

This study has been funded by the Grant-in-Aid for Scientific Research (B) from the Japan Society for the Promotion of Science (21H02224/23K21211).

Data Availability Statement

Dataset available on request from the authors.

Acknowledgments

The authors appreciate Christoph Rupprecht for his valuable comments. We also thank the reviewers for their constructive suggestions, which helped to improve the quality of this manuscript.

Conflicts of Interest

The authors declare no conflicts of interest.

Abbreviations

The following abbreviations are used in this manuscript:
PCIPark cool islands
PETPhysiological equivalent temperature
UTCIUniversal thermal climate index
TaAir temperature
RHRelative humidity
vWind velocity
TgGlobe temperature
MRTMean radiant temperature

References

  1. IPCC. Climate Change 2021: The Physical Science Basis. Contribution of Working Group I to the Sixth Assessment Report of the Intergovernmental Panel on Climate Change; IPCC: Geneva, Switzerland, 2021. [Google Scholar]
  2. Japan Meteorological Agency. Global Warming Projection Vol.9 (Dataset Interpretation); Japan Meteorological Agency: Tokyo, Japan, 2021.
  3. Waite, M.; Cohen, E.; Torbey, H.; Piccirilli, M.; Tian, Y.; Modi, V. Global Trends in Urban Electricity Demands for Cooling and Heating. Energy 2017, 127, 786–802. [Google Scholar] [CrossRef]
  4. International Energy Agency. The Future of Cooling; IEA: Paris, France, 2018; p. 92. [Google Scholar]
  5. Bernard, P.; Chevance, G.; Kingsbury, C.; Baillot, A.; Romain, A.-J.; Molinier, V.; Gadais, T.; Dancause, K.N. Climate Change, Physical Activity and Sport: A Systematic Review. Sports Med. 2021, 51, 1041–1059. [Google Scholar] [CrossRef]
  6. Vicedo-Cabrera, A.M.; Scovronick, N.; Sera, F.; Royé, D.; Schneider, R.; Tobias, A.; Astrom, C.; Guo, Y.; Honda, Y.; Hondula, D.M.; et al. The Burden of Heat-Related Mortality Attributable to Recent Human-Induced Climate Change. Nat. Clim. Change 2021, 11, 492–500. [Google Scholar] [CrossRef]
  7. Parks, R.M.; Bennett, J.E.; Tamura-Wicks, H.; Kontis, V.; Toumi, R.; Danaei, G.; Ezzati, M. Anomalously Warm Temperatures Are Associated with Increased Injury Deaths. Nat. Med. 2020, 26, 65–70. [Google Scholar] [CrossRef]
  8. Li, Y.; Fan, S.; Li, K.; Zhang, Y.; Kong, L.; Xie, Y.; Dong, L. Large Urban Parks Summertime Cool and Wet Island Intensity and Its Influencing Factors in Beijing, China. Urban For. Urban Green. 2021, 65, 127375. [Google Scholar] [CrossRef]
  9. Liao, W.; Guldmann, J.-M.; Hu, L.; Cao, Q.; Gan, D.; Li, X. Linking Urban Park Cool Island Effects to the Landscape Patterns inside and Outside the Park: A Simultaneous Equation Modeling Approach. Landsc. Urban Plan. 2023, 232, 104681. [Google Scholar] [CrossRef]
  10. Chang, C.-R.; Li, M.-H.; Chang, S.-D. A Preliminary Study on the Local Cool-Island Intensity of Taipei City Parks. Landsc. Urban Plan. 2007, 80, 386–395. [Google Scholar] [CrossRef]
  11. Rupprecht, C.D.D.; Cui, L. Understanding Threats to Young Children’s Green Space Access in Unlicensed Daycare Centers in Japan. Int. J. Environ. Res. Public Health 2020, 17, 1948. [Google Scholar] [CrossRef] [PubMed]
  12. Cui, L.; Shibata, S. Exploring Climate-Adaptive Green-Space Designs for Hot and Humid Climates: Lessons from Japanese Dry Gardens. Urban For. Urban Green. 2024, 93, 128207. [Google Scholar] [CrossRef]
  13. Hwang, Y.H.; Lum, Q.J.G.; Chan, Y.K.D. Micro-Scale Thermal Performance of Tropical Urban Parks in Singapore. Build. Environ. 2015, 94, 467–476. [Google Scholar] [CrossRef]
  14. Lin, T.-P.; Tsai, K.-T.; Liao, C.-C.; Huang, Y.-C. Effects of Thermal Comfort and Adaptation on Park Attendance Regarding Different Shading Levels and Activity Types. Build. Environ. 2013, 59, 599–611. [Google Scholar] [CrossRef]
  15. Martinelli, L.; Lin, T.-P.; Matzarakis, A. Assessment of the Influence of Daily Shadings Pattern on Human Thermal Comfort and Attendance in Rome during Summer Period. Build. Environ. 2015, 92, 30–38. [Google Scholar] [CrossRef]
  16. Watanabe, S.; Ishii, J. Effect of Outdoor Thermal Environment on Pedestrians’ Behavior Selecting a Shaded Area in a Humid Subtropical Region. Build. Environ. 2016, 95, 32–41. [Google Scholar] [CrossRef]
  17. Cheung, P.K.; Jim, C.Y. Differential Cooling Effects of Landscape Parameters in Humid-Subtropical Urban Parks. Landsc. Urban Plan. 2019, 192, 103651. [Google Scholar] [CrossRef]
  18. Lachapelle, J.A.; Scott Krayenhoff, E.; Middel, A.; Coseo, P.; Warland, J. Maximizing the Pedestrian Radiative Cooling Benefit per Street Tree. Landsc. Urban Plan. 2023, 230, 104608. [Google Scholar] [CrossRef]
  19. Middel, A.; Krayenhoff, E.S. Micrometeorological Determinants of Pedestrian Thermal Exposure during Record-Breaking Heat in Tempe, Arizona: Introducing the MaRTy Observational Platform. Sci. Total Environ. 2019, 687, 137–151. [Google Scholar] [CrossRef] [PubMed]
  20. Bowler, D.E.; Buyung-Ali, L.; Knight, T.M.; Pullin, A.S. Urban Greening to Cool Towns and Cities: A Systematic Review of the Empirical Evidence. Landsc. Urban Plan. 2010, 97, 147–155. [Google Scholar] [CrossRef]
  21. Armson, D.; Stringer, P.; Ennos, A.R. The Effect of Tree Shade and Grass on Surface and Globe Temperatures in an Urban Area. Urban For. Urban Green. 2012, 11, 245–255. [Google Scholar] [CrossRef]
  22. Liu, S.; Zhao, J.; Xu, M.; Ahmadian, E. Effects of Landscape Patterns on the Summer Microclimate and Human Comfort in Urban Squares in China. Sustain. Cities Soc. 2021, 73, 103099. [Google Scholar] [CrossRef]
  23. Amani-Beni, M.; Zhang, B.; Xie, G.; Xu, J. Impact of Urban Park’s Tree, Grass and Waterbody on Microclimate in Hot Summer Days: A Case Study of Olympic Park in Beijing, China. Urban For. Urban Green. 2018, 32, 1–6. [Google Scholar] [CrossRef]
  24. Cui, L.; Rupprecht, C.D.D.; Shibata, S. Climate-Responsive Green-Space Design Inspired by Traditional Gardens: Microclimate and Human Thermal Comfort of Japanese Gardens. Sustainability 2021, 13, 2736. [Google Scholar] [CrossRef]
  25. Ng, E.; Chen, L.; Wang, Y.; Yuan, C. A Study on the Cooling Effects of Greening in a High-Density City: An Experience from Hong Kong. Build. Environ. 2012, 47, 256–271. [Google Scholar] [CrossRef]
  26. Gillner, S.; Vogt, J.; Tharang, A.; Dettmann, S.; Roloff, A. Role of Street Trees in Mitigating Effects of Heat and Drought at Highly Sealed Urban Sites. Landsc. Urban Plan. 2015, 143, 33–42. [Google Scholar] [CrossRef]
  27. Lee, H.; Mayer, H.; Chen, L. Contribution of Trees and Grasslands to the Mitigation of Human Heat Stress in a Residential District of Freiburg, Southwest Germany. Landsc. Urban Plan. 2016, 148, 37–50. [Google Scholar] [CrossRef]
  28. Cheung, P.K.; Jim, C.Y.; Tapper, N.; Nice, K.A.; Livesley, S.J. Daytime Irrigation Leads to Significantly Cooler Private Backyards in Summer. Urban Clim. 2022, 46, 101310. [Google Scholar] [CrossRef]
  29. Shashua-Bar, L.; Pearlmutter, D.; Erell, E. The Influence of Trees and Grass on Outdoor Thermal Comfort in a Hot-Arid Environment. Int. J. Climatol. 2011, 31, 1498–1506. [Google Scholar] [CrossRef]
  30. Lu, J.; Li, Q.; Zeng, L.; Chen, J.; Liu, G.; Li, Y.; Li, W.; Huang, K. A Micro-Climatic Study on Cooling Effect of an Urban Park in a Hot and Humid Climate. Sustain. Cities Soc. 2017, 32, 513–522. [Google Scholar] [CrossRef]
  31. Algretawee, H.; Rayburg, S.; Neave, M. Estimating the Effect of Park Proximity to the Central of Melbourne City on Urban Heat Island (UHI) Relative to Land Surface Temperature (LST). Ecol. Eng. 2019, 138, 374–390. [Google Scholar] [CrossRef]
  32. Yan, H.; Wu, F.; Dong, L. Influence of a Large Urban Park on the Local Urban Thermal Environment. Sci. Total Environ. 2018, 622–623, 882–891. [Google Scholar] [CrossRef] [PubMed]
  33. Vidrih, B.; Medved, S. Multiparametric Model of Urban Park Cooling Island. Urban For. Urban Green. 2013, 12, 220–229. [Google Scholar] [CrossRef]
  34. RUIZ, M.A.; COLLI, M.F.; MARTINEZ, C.F.; CORREA-CANTALOUBE, E.N. Park Cool Island and Built Environment. A Ten-Year Evaluation in Parque Central, Mendoza-Argentina. Sustain. Cities Soc. 2022, 79, 103681. [Google Scholar] [CrossRef]
  35. García, D.H. Spatio-Temporal Analysis of the Urban Green Infrastructure of the City of Granada (Spain) as a Heat Mitigation Measure Using High-Resolution Images Sentinel 3. Urban For. Urban Green. 2023, 87, 128061. [Google Scholar] [CrossRef]
  36. Algretawee, H. The Effect of Graduated Urban Park Size on Park Cooling Island and Distance Relative to Land Surface Temperature (LST). Urban Clim. 2022, 45, 101255. [Google Scholar] [CrossRef]
  37. Sodoudi, S.; Zhang, H.; Chi, X.; Müller, F.; Li, H. The Influence of Spatial Configuration of Green Areas on Microclimate and Thermal Comfort. Urban For. Urban Green. 2018, 34, 85–96. [Google Scholar] [CrossRef]
  38. Motazedian, A.; Coutts, A.M.; Tapper, N.J. The Microclimatic Interaction of a Small Urban Park in Central Melbourne with Its Surrounding Urban Environment during Heat Events. Urban For. Urban Green. 2020, 52, 126688. [Google Scholar] [CrossRef]
  39. Qiu, K.; Jia, B. The Roles of Landscape Both inside the Park and the Surroundings in Park Cooling Effect. Sustain. Cities Soc. 2020, 52, 101864. [Google Scholar] [CrossRef]
  40. Taleghani, M.; Sailor, D.J.; Tenpierik, M.; Dobbelsteen, A. van den Thermal Assessment of Heat Mitigation Strategies: The Case of Portland State University, Oregon, USA. Build. Environ. 2014, 73, 138–150. [Google Scholar] [CrossRef]
  41. Japan Meteorological Agency Annual Climate Report (Observations from 1991 to 2020). Available online: https://www.jma.go.jp/jma/press/2103/24a/210324_heinenchi.html (accessed on 25 July 2023).
  42. Kyoto City Kyoto City Statistics Portal/Montly Report. Available online: https://www2.city.kyoto.lg.jp/sogo/toukei/Publish/Monthly/ (accessed on 21 May 2023).
  43. Kyoto City Official Website Urban Parks in Kyoto City. Available online: https://www.city.kyoto.lg.jp/kensetu/page/0000214383.html (accessed on 21 May 2023).
  44. Höppe, P. The Physiological Equivalent Temperature—A Universal Index for the Biometeorological Assessment of the Thermal Environment. Int. J. Biometeorol. 1999, 43, 71–75. [Google Scholar] [CrossRef]
  45. Binarti, F.; Koerniawan, M.D.; Triyadi, S.; Utami, S.S.; Matzarakis, A. A Review of Outdoor Thermal Comfort Indices and Neutral Ranges for Hot-Humid Regions. Urban Clim. 2020, 31, 100531. [Google Scholar] [CrossRef]
  46. Matzarakis, A.; Rutz, F.; Mayer, H. Modelling Radiation Fluxes in Simple and Complex Environments—Application of the RayMan Model. Int. J. Biometeorol. 2007, 51, 323–334. [Google Scholar] [CrossRef]
  47. Matzarakis, A.; Mayer, H. Another Kind of Environmental Stress: Thermal Stress. WHO Newsl. 1996, 18, 7–10. [Google Scholar]
  48. Lin, T.P.; Matzarakis, A. Tourism Climate and Thermal Comfort in Sun Moon Lake, Taiwan. Int. J. Biometeorol. 2008, 52, 281–290. [Google Scholar] [CrossRef]
  49. Ouyang, W.; Liu, Z.; Lau, K.; Shi, Y.; Ng, E. Comparing Different Recalibrated Methods for Estimating Mean Radiant Temperature in Outdoor Environment. Build. Environ. 2022, 216, 109004. [Google Scholar] [CrossRef]
  50. Chen, L.; Ng, E. Outdoor Thermal Comfort and Outdoor Activities: A Review of Research in the Past Decade. Cities 2012, 29, 118–125. [Google Scholar] [CrossRef]
  51. Lee, L.S.H.; Cheung, P.K.; Fung, C.K.W.; Jim, C.Y. Improving Street Walkability: Biometeorological Assessment of Artificial-Partial Shade Structures in Summer Sunny Conditions. Int. J. Biometeorol. 2020, 64, 547–560. [Google Scholar] [CrossRef] [PubMed]
  52. Thorsson, S.; Honjo, T.; Lindberg, F.; Eliasson, I.; Lim, E.-M. Thermal Comfort and Outdoor Activity in Japanese Urban Public Places. Environ. Behav. 2007, 39, 660–684. [Google Scholar] [CrossRef]
  53. Kántor, N.; Chen, L.; Gál, C.V. Human-Biometeorological Significance of Shading in Urban Public Spaces—Summertime Measurements in Pécs, Hungary. Landsc. Urban Plan. 2018, 170, 241–255. [Google Scholar] [CrossRef]
  54. Watanabe, S.; Nagano, K.; Ishii, J.; Horikoshi, T. Evaluation of Outdoor Thermal Comfort in Sunlight, Building Shade, and Pergola Shade during Summer in a Humid Subtropical Region. Build. Environ. 2014, 82, 556–565. [Google Scholar] [CrossRef]
  55. Johansson, E.; Emmanuel, R. The Influence of Urban Design on Outdoor Thermal Comfort in the Hot, Humid City of Colombo, Sri Lanka. Int. J. Biometeorol. 2006, 51, 119–133. Available online: https://link.springer.com/article/10.1007/s00484-006-0047-6 (accessed on 27 October 2025).
  56. Ma, X.; Leung, T.M.; Chau, C.K.; Yung, E.H.K. Analyzing the Influence of Urban Morphological Features on Pedestrian Thermal Comfort. Urban Clim. 2022, 44, 101192. [Google Scholar] [CrossRef]
  57. Yuan, C.; Norford, L.; Ng, E. A Semi-Empirical Model for the Effect of Trees on the Urban Wind Environment. Landsc. Urban Plan. 2017, 168, 84–93. [Google Scholar] [CrossRef]
  58. Shashua-Bar, L.; Pearlmutter, D.; Erell, E. The Cooling Efficiency of Urban Landscape Strategies in a Hot Dry Climate. Landsc. Urban Plan. 2009, 92, 179–186. [Google Scholar] [CrossRef]
  59. Yang, W.; Wong, N.H.; Zhang, G. A Comparative Analysis of Human Thermal Conditions in Outdoor Urban Spaces in the Summer Season in Singapore and Changsha, China. Int. J. Biometeorol. 2013, 57, 895–907. [Google Scholar] [CrossRef]
  60. Enssle, F.; Kabisch, N. Urban Green Spaces for the Social Interaction, Health and Well-Being of Older People— An Integrated View of Urban Ecosystem Services and Socio-Environmental Justice. Environ. Sci. Policy 2020, 109, 36–44. [Google Scholar] [CrossRef]
  61. Ottoni, C.A.; Sims-Gould, J.; Winters, M.; Heijnen, M.; McKay, H.A. “Benches Become like Porches”: Built and Social Environment Influences on Older Adults’ Experiences of Mobility and Well-Being. Soc. Sci. Med. 2016, 169, 33–41. [Google Scholar] [CrossRef]
  62. Statistics Bureau of Japan Statistics Bureau Home Page/Statistical Handbook of Japan 2022. Available online: https://www.stat.go.jp/english/data/handbook/c0117.html (accessed on 11 May 2023).
  63. Kántor, N.; Unger, J. Benefits and Opportunities of Adopting GIS in Thermal Comfort Studies in Resting Places: An Urban Park as an Example. Landsc. Urban Plan. 2010, 98, 36–46. [Google Scholar] [CrossRef]
Disclaimer/Publisher’s Note: The statements, opinions and data contained in all publications are solely those of the individual author(s) and contributor(s) and not of MDPI and/or the editor(s). MDPI and/or the editor(s) disclaim responsibility for any injury to people or property resulting from any ideas, methods, instructions or products referred to in the content.

Article Metrics

Citations

Article Access Statistics

Article metric data becomes available approximately 24 hours after publication online.