You are currently viewing a new version of our website. To view the old version click .
Climate
  • Article
  • Open Access

17 November 2025

Assessing Coastal Vulnerability to Sea Level Rise in Qatar: An Index-Based Approach Using Analytic Hierarchy Process

,
and
1
College of Science and Engineering, Hamad Bin Khalifa University, Qatar Foundation, Education City, Doha P.O. Box 34110, Qatar
2
Qatar Environment and Energy Research Institute, Hamad Bin Khalifa University, Qatar Foundation, Education City, Doha P.O. Box 34110, Qatar
*
Author to whom correspondence should be addressed.
This article belongs to the Special Issue Coastal Climate Variability and Predictability: Challenges and Emerging Solutions

Abstract

Sea level rise (SLR) is a global phenomenon impacting coastlines worldwide, with its effects varying according to local geophysical and climatic conditions. The Arabian Gulf, characterized by hyper-arid conditions and low-lying coastal zones, is particularly vulnerable to SLR. This includes the eastern Arabian Peninsula, where densely populated cities and critical infrastructure in countries such as Iraq, Kuwait, Saudi Arabia, Bahrain, Qatar, and the United Arab Emirates (UAE) face increasing risk. This study assesses the potential impact of SLR on Qatar’s coastline using CVI, which integrates both physical and socio-economic parameters. The analysis separately calculates the Physical Vulnerability Index (PVI) and the Socio-Economic Vulnerability Index (SVI), which are then combined to produce the final CVI score. Each variable is assigned a semi-quantitative score on a scale from 1 to 5, representing a gradient from very low to very high vulnerability. To determine the relative importance of each variable, the AHP is employed as a weighting method. The findings reveal that the majority of Qatar’s coastline falls within the high to very high vulnerability categories, with the exception of Doha, which is classified as low risk due to extensive coastal modifications and protective infrastructure. In contrast, areas such as Al Khor and Ras Laffan in the north and northeast, as well as Dukhan and Al Zubarah in the west, exhibit considerably higher vulnerability. These results highlight the urgent need for continued assessment of SLR impacts and the development of targeted adaptation and resilience strategies to safeguard Qatar’s coastal zones.

1. Introduction

Climate change describes changes in average weather conditions, such as temperature and rainfall, over an extended period []. Both natural and anthropogenic activities are causing changes in the earth’s climate system; however, recent climate changes are due to human-induced factors, resulting in global warming. These activities are exemplified by emissions from fuel combustion from factories, transportation, cutting down trees (deforestation), farming, livestock, and rapid socio-economic development []. These activities increase the intensity of carbonic-acid gases in the air, magnifying the natural greenhouse effect, where greenhouse gases effectively trap infrared heat, causing temperatures to rise [,]. One of the many impacts of climate change is sea-level rise, as there is a rise in global ocean levels due to the impacts of global warming, which in turn causes a shift in the global climate [,]. Similarly, global SLR is rising due to melting ice caps and glaciers, thermal expansion, and terrestrial water storage changes [,]. The latest estimates indicate that the global sea level increased by 96 mm with a margin of error of 4 mm over 28 years; on average, SLR rises by 3.3 mm annually []. Sea levels began rising more rapidly due to anthropogenic atmospheric changes in the early 1910s and have continued to increase steadily since then. In a recent study, the rate of sea level rise from 1900 to 2009 was reported to be 1.7 mm per year, with an error rate of 0.2 mm per year []. Given the accelerating pace of sea-level rise, coastal regions are increasingly at risk of inundation, shoreline erosion, and socio-economic disruptions. To systematically evaluate these risks, researchers often employ the Coastal Vulnerability Index (CVI), a widely used framework that integrates physical and socio-economic factors to assess and map coastal areas most susceptible to the impacts of sea-level rise.
CVI has been applied since the 1990s to identify areas vulnerable to SLR and other coastal hazards such as tsunamis and floods []. The CVI simplifies multiple risk factors into a standardized index, enabling comparative analysis across different regions [,]. Over time, various modifications have been made to the CVI methodology to account for regional differences, as each location has distinct environmental drivers and characteristics []. Many countries have adapted the original CVI equation to better fit their specific coastal conditions, continuously refining the methodology []. The literature review thoroughly examines CVI globally and regionally showing the gaps this research aims to fill in, then explains the factors that are used in the CVI calculation of Qatar. Given the flexibility of CVI, calculations can adapt to any local or regional need depending on the factors chosen and can be improved continuously [,]. Therefore, continuous research and methodological improvements are essential, as they must adapt to regional activities and evolving environmental phenomena []. The application of the CVI across diverse coastal regions highlights that standardized methodologies do not always align with specific local conditions. Many tools are used to assess coastal vulnerability globally due to climate change and SLR, and CVI is one of the most prominent out of them []. While many researchers, including [,], incorporate socio-economic variables, others emphasize the social dimension entirely. For example, [] investigated social equity as a key determinant of environmental justice and flood risk in the United States, paving the way for advanced CVI methodologies that offer in-depth, region-specific assessments. Many regions have in-depth and advanced CVI assessments such as Venice starting with [] wherein land subsidence and SLR forced the advancement of CVI calculations. leading to advanced assessments such as one by [] where complex hydrodynamic processes affecting Venice lagoon are studied, providing a foundation and insights that must be considered in any CVI assessment in the region or with similar conditions. The Netherlands is another country with an advanced CVI assessment, as much of its land lies below sea level and is highly susceptible to flooding due to the presence of three major European rivers the Rhine, Meuse, and Scheldt as well as the North Sea []. Research underscores the importance of CVI in evaluating factors such as subsidence, SLR, and socio-economic aspects []. The Arabian, which experiences the highest SLR rate globally, presents a unique and pressing challenge []. Another research study by [] focuses on the combined threat of SLR and tsunami threats in the Arabian Gulf. The research highlights the susceptibility of coastal areas in the region and calls for further understanding and in-depth studies to prevent such catastrophes. This underscores the importance of carefully selecting each parameter in the calculation of CVI to ensure accuracy and relevance.
Developed by [] in the 1970s, the AHP is a robust decision-making tool that decomposes complex problems into manageable, hierarchical components by evaluating both physical and socio-economic variables [,]. Widely used to complement the CVI and other multi-variable studies, AHP assigns relative weights to criteria that vary by region [,,] as shown in Table 1. For instance, [] applied AHP in Bangladesh’s Bhola District to identify vulnerable coastal areas and guide flood mitigation, while [] utilized it to develop a cyclone proximity map. Its systematic approach breaks down intricate decision-making into simpler sub-problems, allowing for detailed assessments by combining weights assigned based on local conditions []. A comprehensive review by [] of 60 vulnerability studies over 29 years identified key parameters such as coastal slope, geomorphology, and historical shoreline changes, emphasizing that criteria selection should integrate literature review and expert insight, while [] combined AHP with Technique for Order of Preference by Similarity to Ideal Solution (TOPSIS) to rank vulnerability along Taiwan’s Miaoli coasts based on engineering safety, ecology, and coastal landscape. Studies by [] applied the method in South Gujarat, India, and southwest Sri Lanka, respectively, to integrate physical and social criteria in coastal vulnerability assessments. Overall, AHP offers a flexible and scalable framework that effectively integrates diverse datasets and expert insights into comprehensive, locally tailored coastal planning.
Table 1. Literature review of CVI studies and selected parameters.
The Arabian Gulf experiences a regional SLR rate of 4.3 mm/year, exceeding the global average of 3 mm/year [], raising significant concerns. As a peninsula extending into the Arabian Gulf, Qatar is particularly vulnerable to SLR. Various regional factors can either mitigate or exacerbate sea level changes, and in the case of the Arabian Gulf, these influences can have severe consequences []. Rising temperatures in the region further increase coastal vulnerability, primarily through thermal expansion, a process intensifying SLR [,] highlights how warming climates impact islands in the Indian Ocean, with similar effects observed in the Bay of Bengal and the Arabian Gulf. Additionally, salinity fluctuations present another challenge, as the increasing demand for freshwater has led to the proliferation of desalination plants, further altering hydrographic conditions in the region [].
Given the uncertainties surrounding SLR in the Arabian Gulf, this study aims to improve understanding of its impacts and contribute to the protection of coastal urban infrastructure through CVI assessment. Despite the high regional SLR rate, there is a notable lack of CVI studies in the Arabian Gulf, with only a few comprehensive assessments available. Notable exceptions include [], which evaluated the UAE’s coastline and highlighted its high vulnerability, and [], which reported similar findings for Kuwait’s coastal areas. However, no detailed CVI or SLR research has been conducted for Qatar, representing a critical gap in the literature. This study specifically addresses the high SLR rate and its potential impacts on Qatar, aligning its CVI methodology with that of the USGS [] while making region-specific modifications. These adjustments, derived from [], include an explicit addition of SLR as a variable to assess its direct effects on regional vulnerability. This study represents the first comprehensive assessment of Qatar’s coastal vulnerability, as existing data predominantly focuses on Doha, the country’s main urban center. The study first examines SLR trends on global and regional scales, before narrowing the focus to the Arabian Gulf. After defining the necessity for a coastal vulnerability assessment, the CVI methodology is introduced in detail, along with the key factors involved in its calculation. The PVI and SVI are calculated separately, assessing each index individually before merging them into the final CVI where the PVI weighs 75% and the SVI weighs 25% as the study focuses on SLR predominantly. The CVI assessment of Qatar’s coastline provides insights into the country’s infrastructure resilience, A numerical comparison further highlights key areas of concern, and the discussion outlines future research directions. Given the rapid rate of SLR in the Arabian Gulf, it is imperative to establish a comprehensive CVI assessment for the entire region [].

2. Methodology and Data

2.1. Study Area

The state of Qatar is a peninsula situated along the Arabian Gulf between the three countries of Bahrain, Saudi Arabia, and the United Arabian Emirates. It only shares land on the south with Saudi Arabia. The rest of the country is a coastal region along the Arabian Gulf as seen in Figure 1. Qatar’s geomorphology is predominantly flat and arid, according to [] with the highest point being 107–109 m above sea level []. The topography mainly comprises desert sands, sabkhas, inland plains, mesas and plateaus, and various coastal features along the 560 km coastline. According to the [], the population of the State of Qatar is roughly 2.9 million by the end of August, with an annual growth rate of 1.2% measured in 2020. The areas of importance in the study are the whole coastline, which consists of 560 km with various features, such as bays, inlets, natural harbors, and manmade projects. Sabkhas dominate most of the coastline, especially in the northern region []. Climate of Qatar is harsh with a mean annual temperature of 27.22 °C. Rainfall is scarce, usually less than 79 mm per year, there are no surface water resources and water is provided by desalination and groundwater extraction [].
Figure 1. Digital Elevation Model and location of the study area.

2.2. The Coastal Vulnerability Index (CVI)

The Coastal Vulnerability Index (CVI) can incorporate multiple factors depending on the study area. Initial assessments included seven factors [,], but the number has been adjusted over time based on regional applicability. Some studies have used fewer factors, such as [], while others have expanded the framework by adding various parameters including physical and socio-economic [,,]. For this study, the CVI for Qatar will be based on six physical factors and 3 socio-economic (Table 2) forming a physical vulnerability index and (PVI) and socio-economic vulnerability index (SVI) separately before merging them in the complete CVI, with sea level rise (SLR) as the core variable, while the remaining geological and physical factors are specifically relevant to Qatar’s coastline and regional SLR trends. Since socio-economic indicators are not the focus of this study as SLR is the core variable, it weighs less than the physical vulnerability index (PVI).
The six key factors include SLR in the Arabian Gulf, which is the primary driver of coastal vulnerability in the region. Geomorphology plays a crucial role in determining whether the coastal terrain is natural or manmade []. Coastal slope is another significant factor as it assesses the angle and sharpness of the coastline, influencing its susceptibility to inundation []. Additionally, shoreline erosion and accretion rates help evaluate both natural and manmade changes in coastal landforms, including land reclamation and erosion rates []. Mean tide range is also considered, accounting for seasonal variations in tidal fluctuations, which are influenced by wind patterns and climate drivers such as ENSO. This factor helps reduce the error margin in regional SLR assessments by tracking minute shoreline changes [,]. The final factor, mean wave height, represents wave intensity near the coastline and is calculated as an annual average. Similar to mean tide range, this variable varies seasonally and contributes to shoreline vulnerability []. Each of these six factors is directly influenced by SLR, meaning that any increase in sea levels can exacerbate their impact. Among the six factors, SLR is the most critical for Qatar, as the country experiences the highest regional SLR rate in the world, placing its coastline at significant risk. The three variables used for the SVI are population density, land use, and income levels. Population density is pivotal to coastal vulnerability, ensuring routes are available to seek shelter []. Land use can better position development projects saving money to focus on key areas []. GDP and GDP per capita can determine the course of action to ensure viable options are available [].
The CVI equation typically includes at least six variables, which can be modified or expanded based on the specific driving factors of a given region []. The European Environment Agency presents various formulations of the CVI equation, which were originally proposed and tested by [,] to evaluate coastal vulnerability across different environments. The variables considered were 6 and the testing was in terms of sensitivity analysis. After determining the key variables, each variable was given a semi-quantitative score from 1 to 5 wherein 1 represents the lowest score and 5 being the highest score in terms of contribution to the coastal vulnerability as shown in Table 3, where all variables are integrated into single index []. Additionally, x represents the semi-quantitative score for each variable, and n represents the number of total variables.
Product mean:
C V I 1 = x 1 × x 2 × x 3 × x n n ,
Square root of product mean:
C V I 2 = C V I 1 ,
The equation selected for this evaluation is the second equation, which will be referred to simply as PVI for the physical parameters and SVI for the socio-economic parameters. This equation has been widely applied by the U.S. Geological Survey (USGS) in two major projects: the first aimed at evaluating the coastal vulnerability of the entire U.S. coastline, while the second focused on assessing coastal vulnerability within the U.S. National Park Service. However, in its application, the USGS [] utilized six variables. For this study, six physical variables are used to assess Qatar’s coastline, forming the PVI equation. The calculation (PVI) will be directly compared to the USGS model with the 6 variables. Where
  • a = geomorphology.
  • b = coastal slope.
  • c = relative sea-level rise rate.
  • d = shoreline erosion/accretion rate.
  • e = mean tide range.
  • f = mean wave height.
PVI = a × b × c × d × e × f 6
The SVI contains 3 variables wherein the calculation will be similar to the PVI. Where
  • g = population density.
  • h = land use.
  • i = GDP per capita.
SVI = g × h × i 3
After both PVI and SVI are calculated for the whole coastline, CVI is calculated by a simple weighted average of PVI and SVI in 3 different scenarios, wherein PVI is weighted 0.75, 0.5, and 0.25, respectively, and SVI is weighted 0.25, 0.5, and 0.75, respectively.
Table 2. Selected parameters and data sources.
VariableDefinition & Data Source
Relative SLR rateThe observed increase in sea level relative to the land, considered both the sea level change and vertical movement (land subsidence).
[]
GeomorphologyThe physical structure and composition of the coastline, which determines the resilience to coastal hazards.
[,,]
Coastal SlopeThe gradient of the coastal land surface, determining inland water penetration capabilities.
Shuttle Radar Topography Mission (SRTM) 30 m, (https://earthexplorer.usgs.gov/) (accessed on 10 October 2024)
Shoreline
Erosion/Accretion Rate
The rate at which the shoreline is changing, whether it is retreating or advancing due to natural or artificial processes.
Landsat-8 Data (https://earthexplorer.usgs.gov/) (accessed on 10 October 2024)
Mean Tide RangeThe average vertical difference between low and high tides across certain key locations.
Qatar Meteorology Department (https://qweather.gov.qa/CAA/Index.aspx) (accessed on 24 August 2024)
Mean Wave HeightThe average height of waves reaching the shoreline across certain key locations.
Qatar Meteorology Department (https://qweather.gov.qa/CAA/Index.aspx) (accessed on 24 August 2024)
Population DensityThe number of people residing per square kilometer along the coastline.
[]
Land UseThe classification of coastal areas based on order of importance in cases of coastal hazards.
Landsat-8 Data (https://earthexplorer.usgs.gov/) (accessed on 10 October 2024) []
Gross Domestic Product (GDP) An economic indicator reflecting the average income of Qatar, which demonstrates the capacity of a country to adapt and respond to coastal hazards.
[]
Table 3. Selected parameters and their vulnerability classification.
VariableVery Low (1)Low (2)Moderate (3)High (4)Very High (5)
GeomorphologyRocky CliffsIndented Coasts
Medium Cliffs
Low Cliffs Cobble Beaches
Lagoon
Mangroves
Sand beaches
Mud Flats
Deltas
Coastal Slope (%)>3622–3610–225–10<5
Relative SLR Rate (mm/yr)<1.51.5–2.52.5–3.03.0–3.16>3.16
Shoreline Erosion/Accretion Rate (m/yr)Accretion
>10
Accretion
<10
StableErosion
<5
Erosion
>5
Mean Tide Range (m)1.48–1.681.68–1.801.80–2.022.02–2.112.11–2.74
Mean Wave Height (m)<0.50.5–0.80.8–1.01.0–1.1>1.1
Population Density (people/km2)<150151–300301–500501–1000>1000
Land UseUndeveloped land
No ecological hotspots
Coastal areasAgriculture
Preservations
Urban developmentIndustrial development
GDP (billion) (USD)>471.40471.40–72.8572.84–18.9018.89–4.95<4.94

2.3. Analytic Hierarchy Process

The Analytic Hierarchy Process (AHP) is a technique introduced in 1977 by [], to organize and weigh various variables using mathematical and logical principles. AHP is one of the most common weighing methods used to show how much each variable contributes to the final assessment []. The process involves a pair-wise comparison matrix based on the contribution of variables to the coastal vulnerability index, as shown in Table 4. Each variable is rated against every other variable with values from 1–9, starting from 1 being 2 variables with equal importance, and ending with 9 being 1 variable is extremely important than the other variable, wherein (2, 4, 6, 8) are indeterminate values to help refine the matrix.
Table 4. Pair-wise comparison matrix selection standard.
In this study, the 9 variables were weighted by six experts, and the average final weightage score was used for each variable. To keep results consistent, the Analytic Hierarchy Process (AHP) is validated using mathematical calculation to derive the Consistency Ratio (CR) wherein:
C R = C I / R I
The Random Index (RI) stands for the average of the consistency index, depending on the order of the matrix according to []. While the Consistency Index (CI) can be expressed as:
C I = ( λ m a x n ) / ( n 1 )
where λ max is the eigenvalue of the variable’s matrix, and n represents the order of the matrix. The CR must be lower than 0.1 to as proof of consistency. The weighted criteria after confirming the validity through CR is used to weigh the variables contribution to the coastal vulnerability assessment.

2.4. Geomorphology

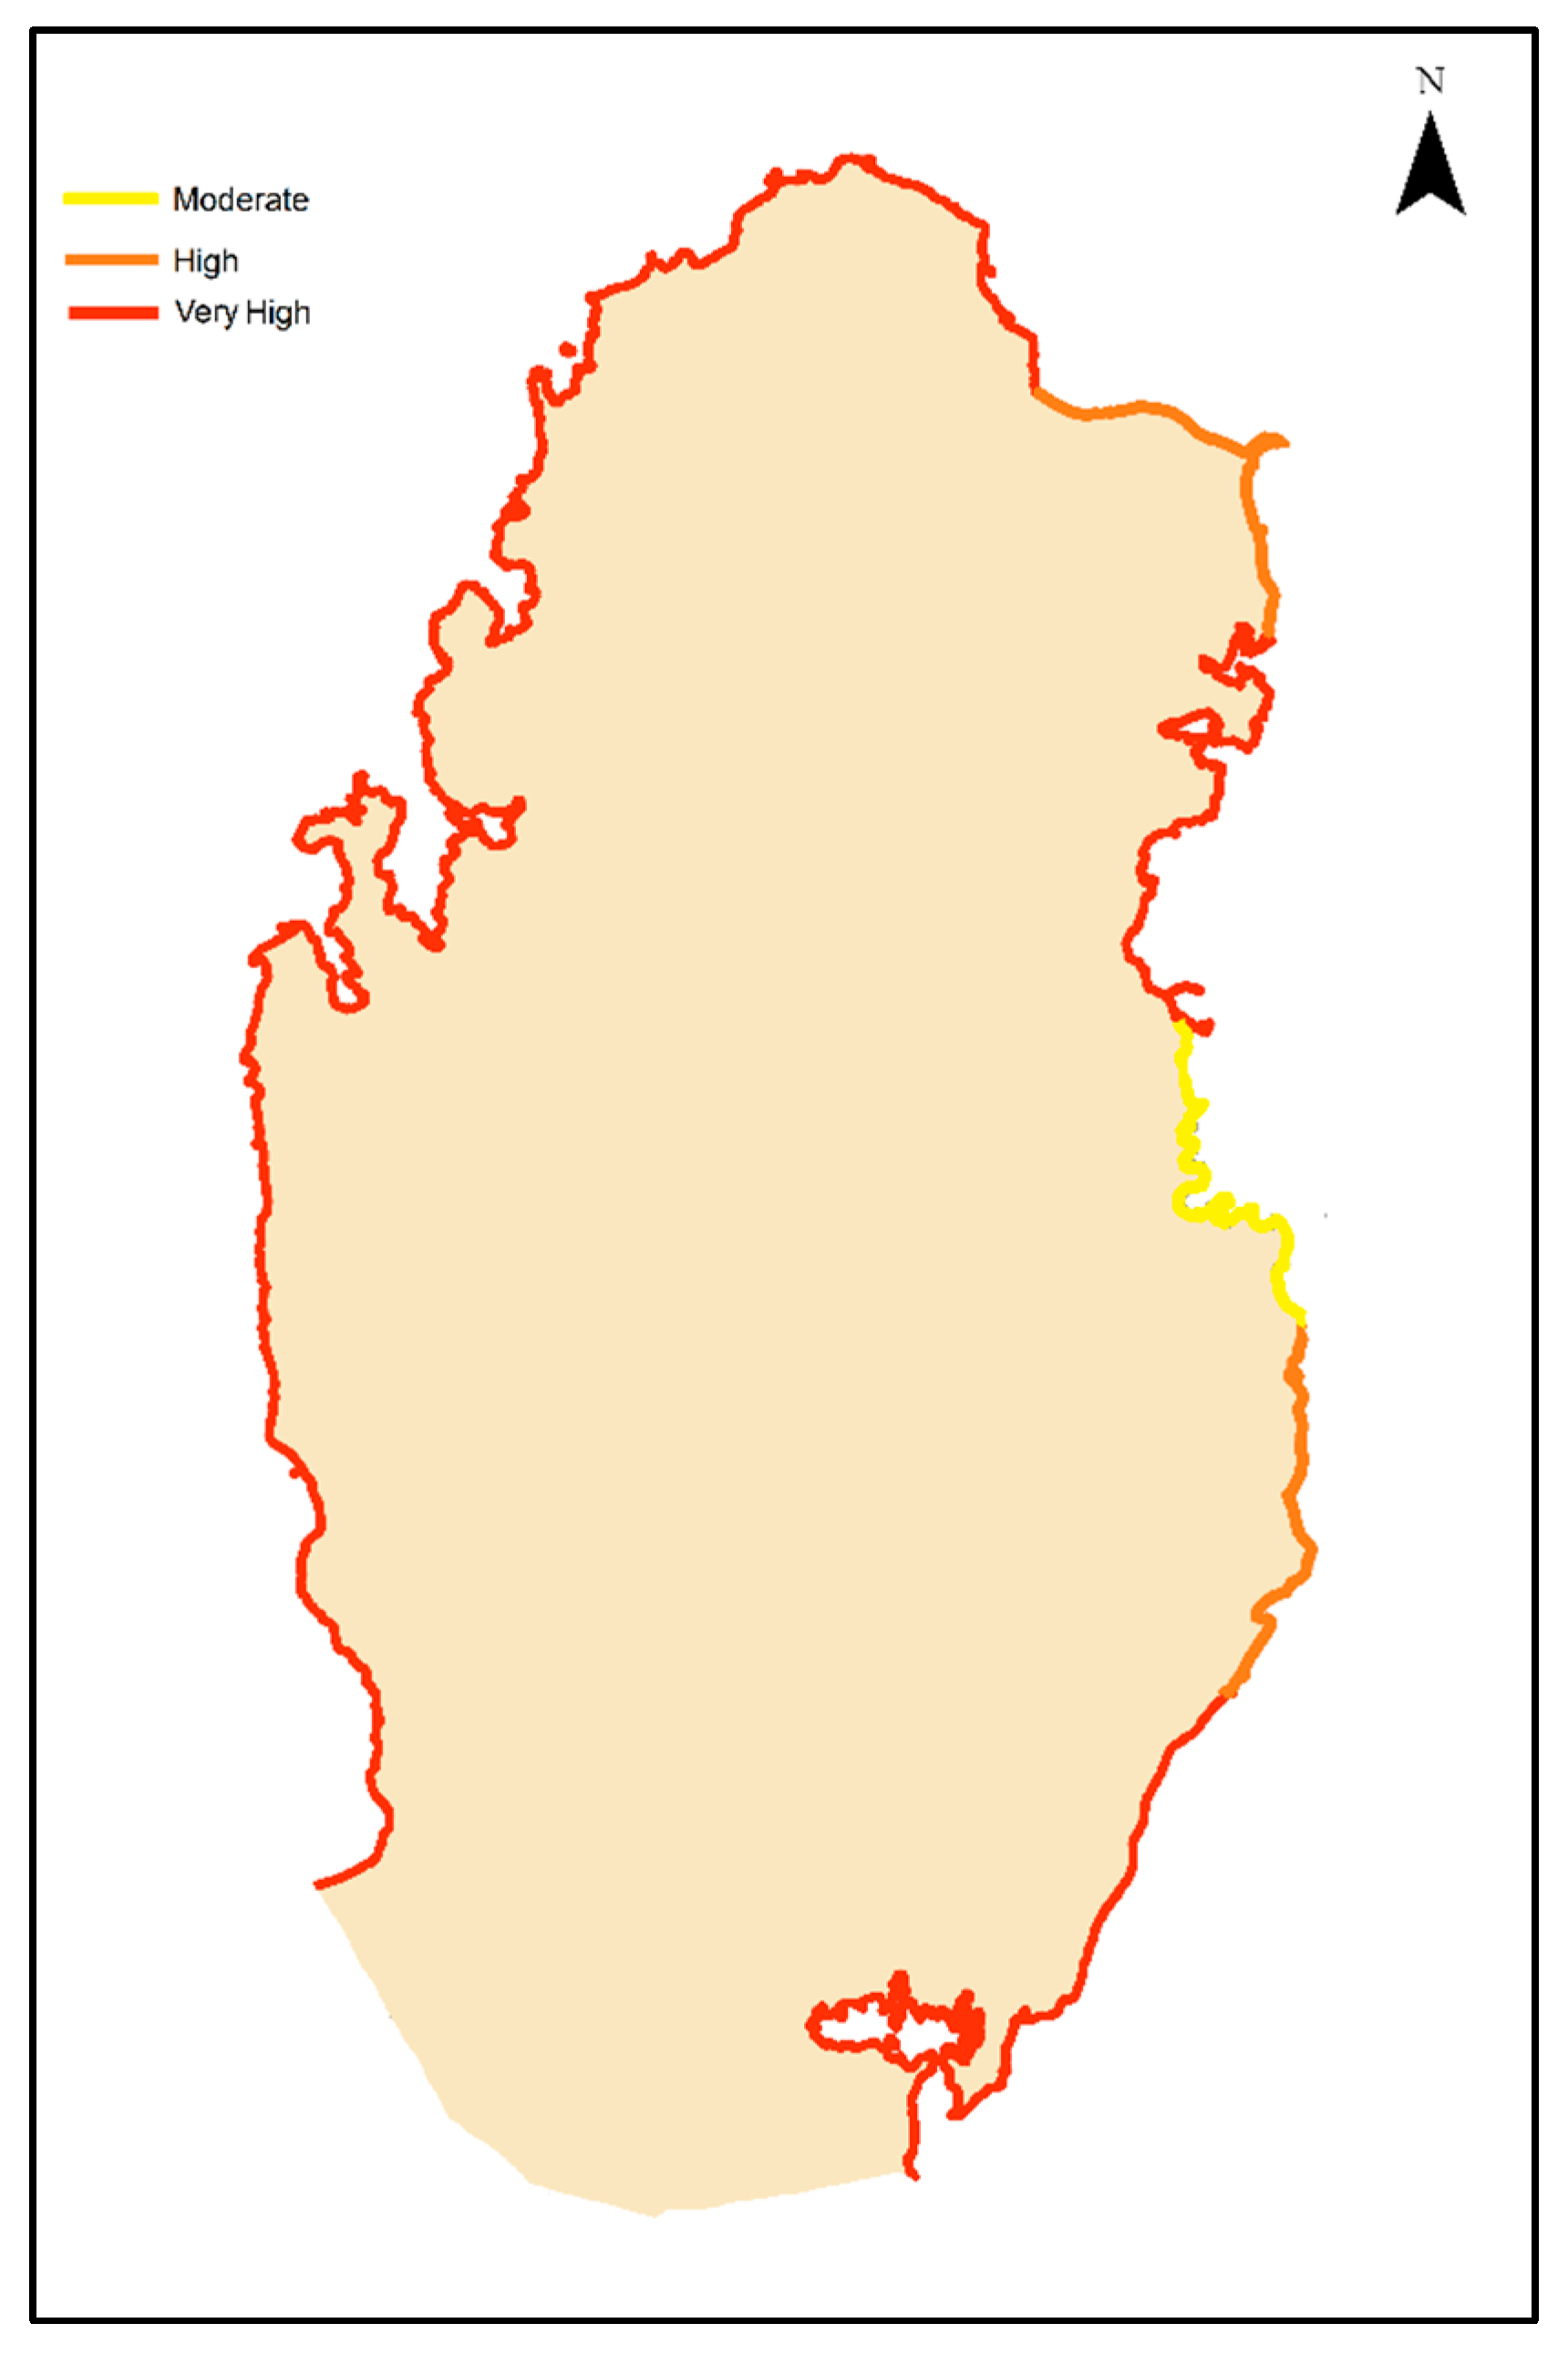
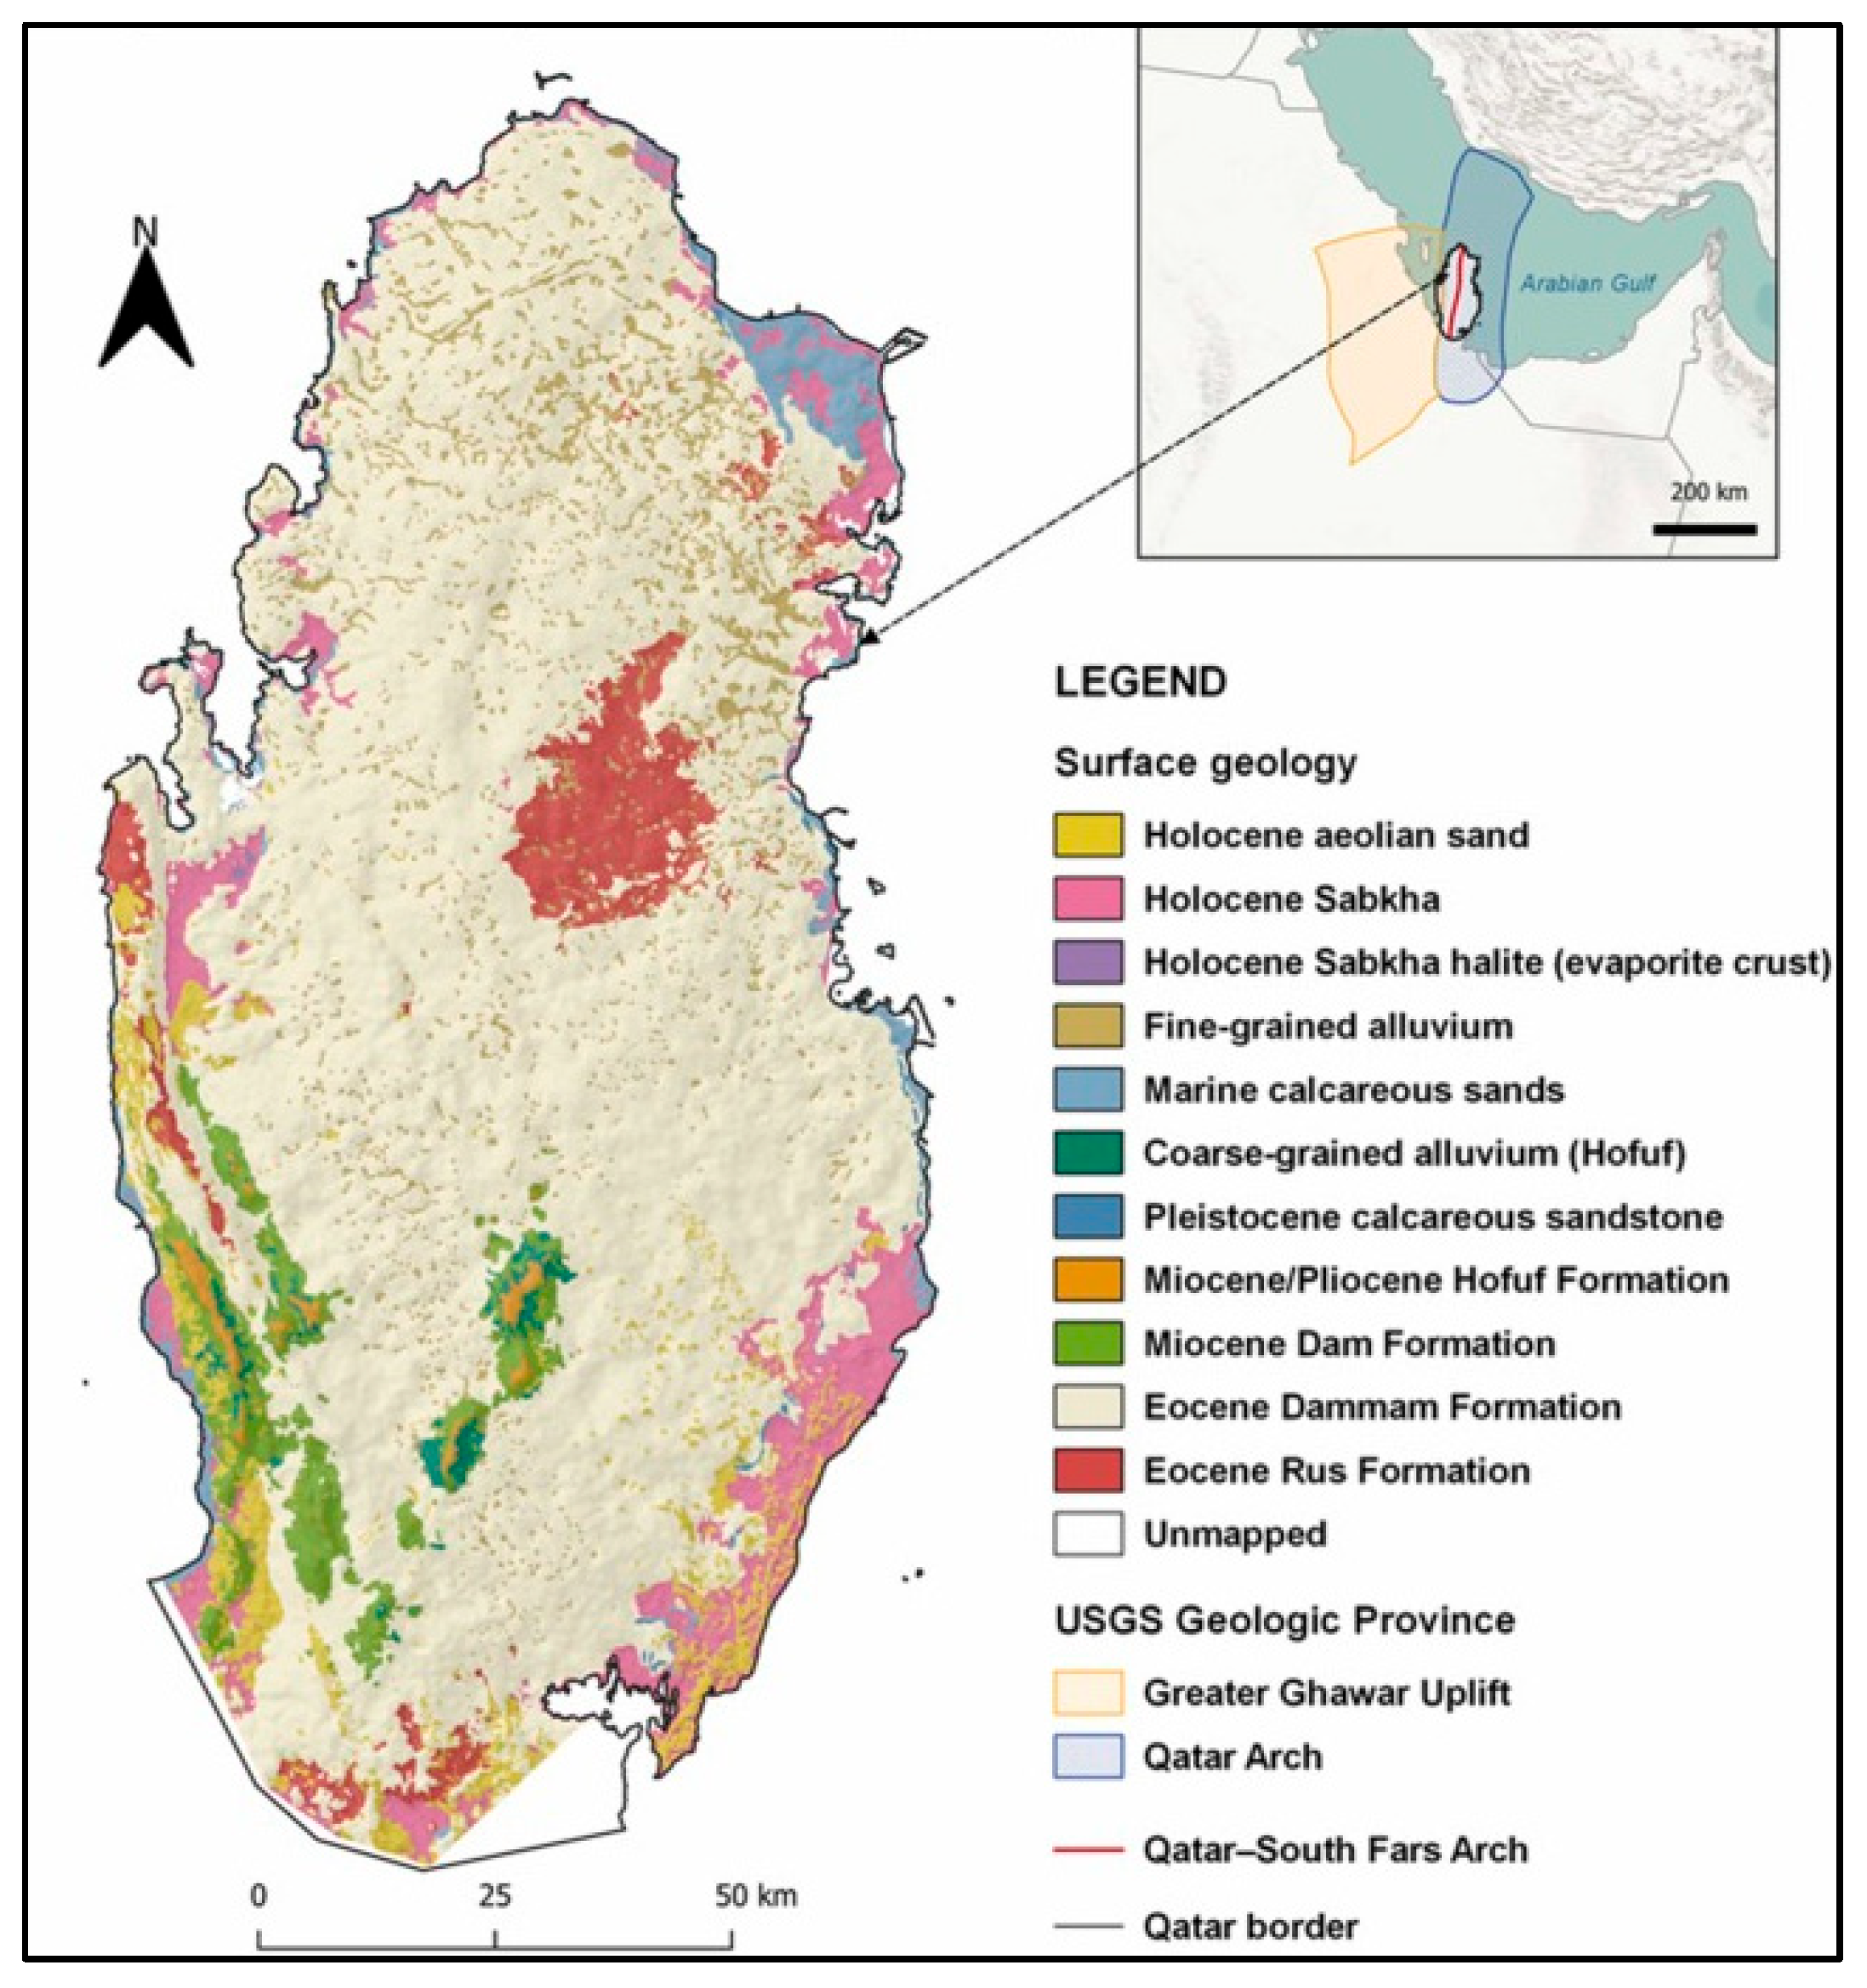
One of the most crucial variables in Coastal Vulnerability analysis is geomorphology, as it determines whether the coastal terrain is natural or manmade and reflects the relative erodibility of different landforms. This variable is essential in assessing the susceptibility of coastlines to erosion and inundation. Low-risk terrains, classified as category 1, consist of high rocky cliffs, which are highly resistant to erosion. In contrast, high-risk terrains, classified as category 5, are highly vulnerable and primarily include sandy beaches, mudflats, mangroves, barrier beaches, deltas, and coral reefs, which are more prone to erosion and flooding. For this study, geomorphology data for Qatar was obtained from the literature and topographic maps as shown in Figure 2, providing a detailed assessment of the country’s coastal features. Understanding Qatar’s coastal terrain is essential for accurately evaluating coastal vulnerability to sea level rise (SLR) and other environmental stressors. With around 560 km of coastline [] the geomorphology in Qatar heavily leans onto the highly vulnerable side with over 90% of the coastal terrain falls within the very high risk category. On the other hand, less than 8% falls within the high risk category [,]. The last 2% is attributed to land reclamation projects, as most of them have reinforced the coastline with dam-like structures with a very high slope to break waves. This 2% corresponds primarily to the Doha coastline, which has undergone extensive manmade modifications, as shown in Figure 3. The other 8% includes regions around Ras Laffan, Al Wakra, and Mesaieed, where similar coastal protection measures have been implemented, particularly to safeguard industrial infrastructure from saltwater intrusion.
Figure 2. The geomorphology map of Qatar adapted from [,,].
Figure 3. Geomorphology Vulnerability map of the coastline of Qatar.
Geomorphology is the main physical variable after Regional SLR, as it defines the resilience of the shoreline covering the entirety of Qatar. With certain features being more susceptible to coastal vulnerability and damage, as demonstrated in Table 3. The indexing of geomorphology features is measured and used in all CVI studies []. Qatar has a disadvantage as the whole coastline is of values 3 to 5 which weighs heavily on CVI calculation.

2.5. Coastal Slope

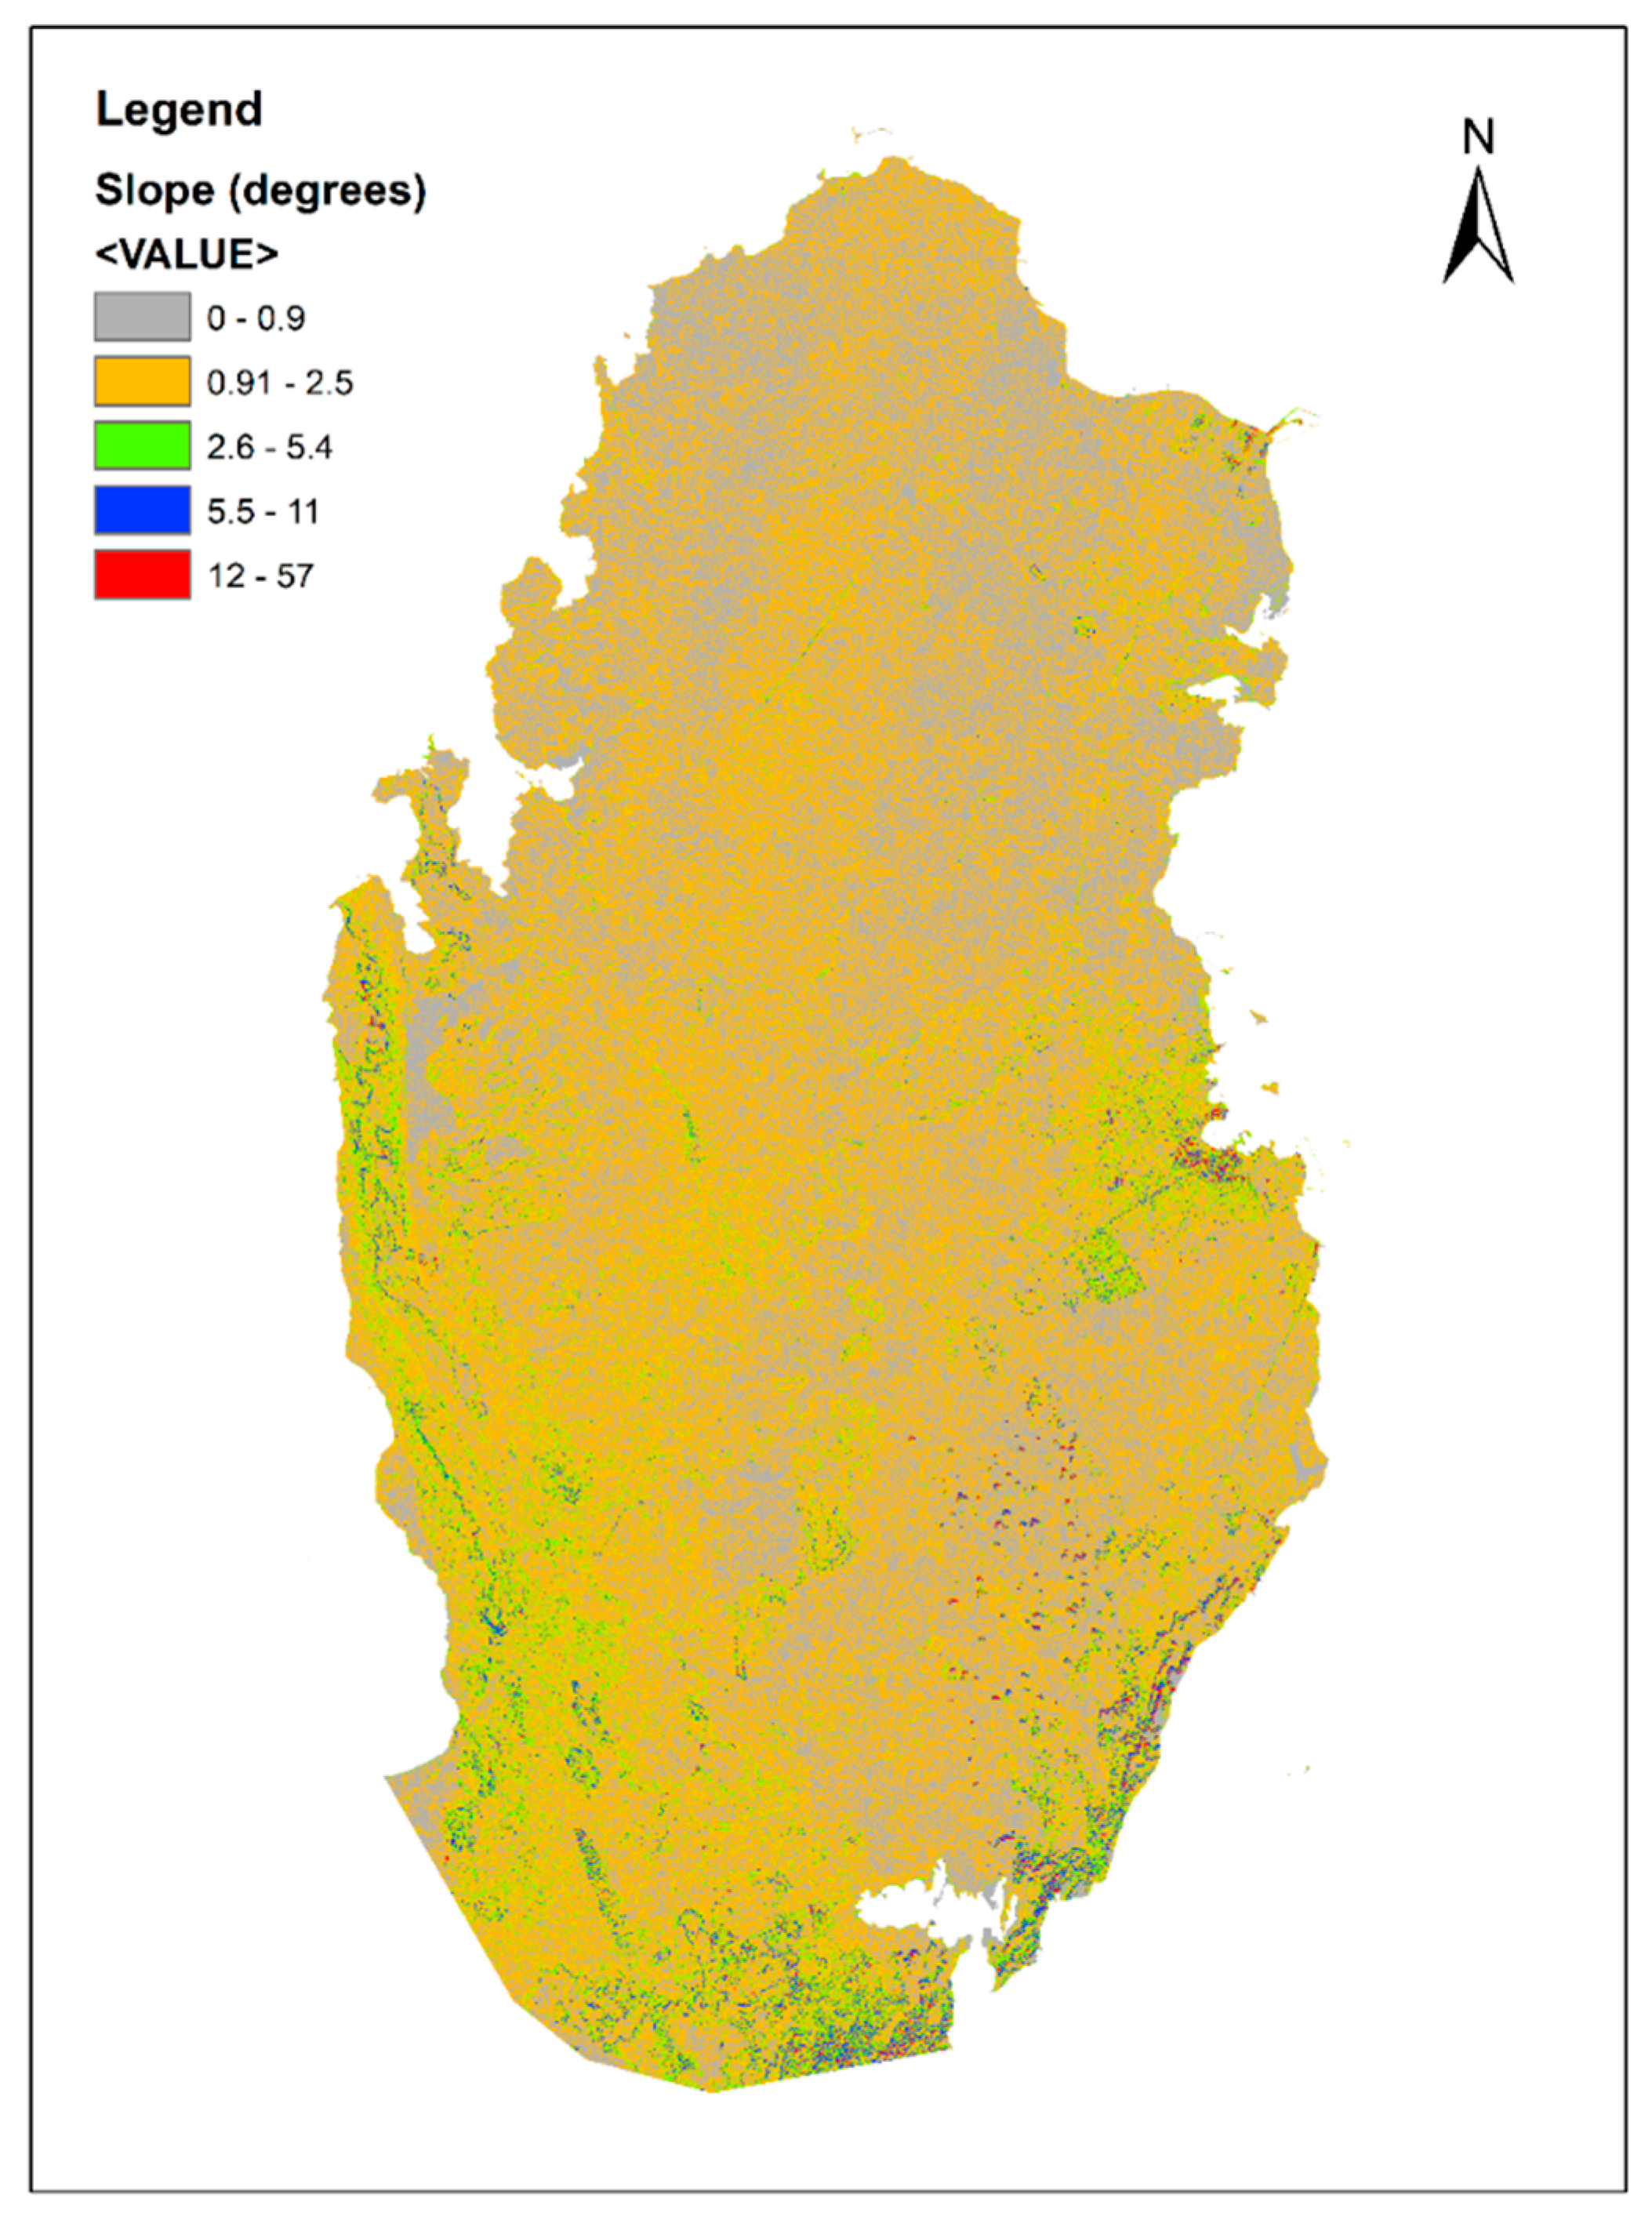
This variable assesses vulnerability to inundation based on slope angle and gradient sharpness. According to the U.S. Geological Survey (USGS) [], very high-risk coastal slopes are those with gradients of 0.25% or less, whereas [] defines very high-risk slopes as those 5% or less. For this study, a very high-risk coastal slope is defined as 5% or lower. According to [], Qatar’s coastal terrain is predominantly flat with a low coastal slope, except for a few scattered exceptions, including man-made modifications in Doha []. However, these artificially elevated areas remain relatively low-lying and generally fall within the moderate-risk or low-risk categories as shown in Figure 4. In contrast, very low-risk coastal slopes are defined as 36% or higher, a classification that does not apply to Qatar due to its naturally flat topography.
Figure 4. Coastal slope map (degree) of Qatar based on SRTM 30 m [].
The coastal slope data used in this study is based on [], as it provides a more suitable comparison between Qatar and the studied location. The review by [] is modeled after the USGS coastal analysis [] and incorporates the same variables, with the exception of sand dunes, which are not relevant to Qatar’s coastal landscape, as noted by []. The coastal slope distribution for Qatar is illustrated in Figure 4.
The coastal slope is a crucial factor in Coastal Vulnerability Index (CVI) calculations, as it determines a coastline’s resistance to erosion and inundation. According to [], Qatar lacks natural protection from storms and flooding, making it highly vulnerable. Most of the country falls within level 5 on the CVI scale, the highest risk category, which has a significant impact on CVI calculations. The only exception is Doha, where manmade coastal modifications provide some level of protection. However, this assessment assumes sea levels remain stable, whereas future sea level rise (SLR) could alter this classification. The primary function of CVI is to simplify coastal vulnerability assessments by converting complex data into index values. Given that Qatar’s coastal slope is relatively uniform, its classification is derived from comparative indexing, rather than direct reference to coastlines in other regions. This approach aligns with methodologies used in previous CVI studies that incorporate coastal slope as a key physical variable [].

2.6. Relative Sea Level Rise Rate

The global sea level rise (SLR) rate is approximately 3 mm/year, with an error margin of 0.4 mm/year. However, the Arabian Gulf stands out as an anomaly, exhibiting an SLR rate of 4.3 mm/year, making it not only the highest regional rate but also the only recorded dataset exceeding 4 mm/year, according to NOAA data [] from 1992 to 2022. Since Qatar’s coastline is entirely influenced by the Arabian Gulf, this value is consistently applied in CVI calculations. The USGS [] classifies SLR rates above 3.16 mm/year as very high risk. Given that the Arabian Gulf’s SLR rate is 1.4 times the global average, Qatar’s entire coastline falls into this very high-risk category. Although the NOAA dataset [] provides a basin-wide measurement of SLR for the Arabian Gulf, determining precise regional variations within Qatar remains challenging. However, even accounting for a hypothetical error margin of −1 mm/year, the SLR rate along Qatar’s coastline would still exceed the USGS very high-risk threshold [] and align with the findings of []. SLR is the most critical physical variable in this research, as the Arabian Gulf ranks as a level 5 risk index when compared to other SLR-vulnerable regions []. Since the SLR rate is assigned the highest index value (5) in CVI calculations, it has a uniformly significant impact on Qatar’s entire coastline. The inclusion of SLR as a key factor aims to quantify the current level of exposure and emphasize that continuing sea level rise will only exacerbate Qatar’s coastal vulnerability in the future.
Qatar is experiencing significant land subsidence, with rates reaching 14 mm/year in several locations []. It is largely driven by the presence of Sabkhas, which exist both along the coastline and inland, leading to vertical land movement [,]. Additionally, groundwater depletion is another key contributor to subsidence []. The 14 mm/year subsidence rate places Qatar in the highest-risk category (5), making it one of the most critical variables in the CVI calculation. Along with SLR, land subsidence is the only variable classified as high risk across the entire coastline, further exacerbating Qatar’s vulnerability to coastal hazards [], thus it was included in the Relative SLR parameter.

2.7. Shoreline Erosion/Accretion Rate

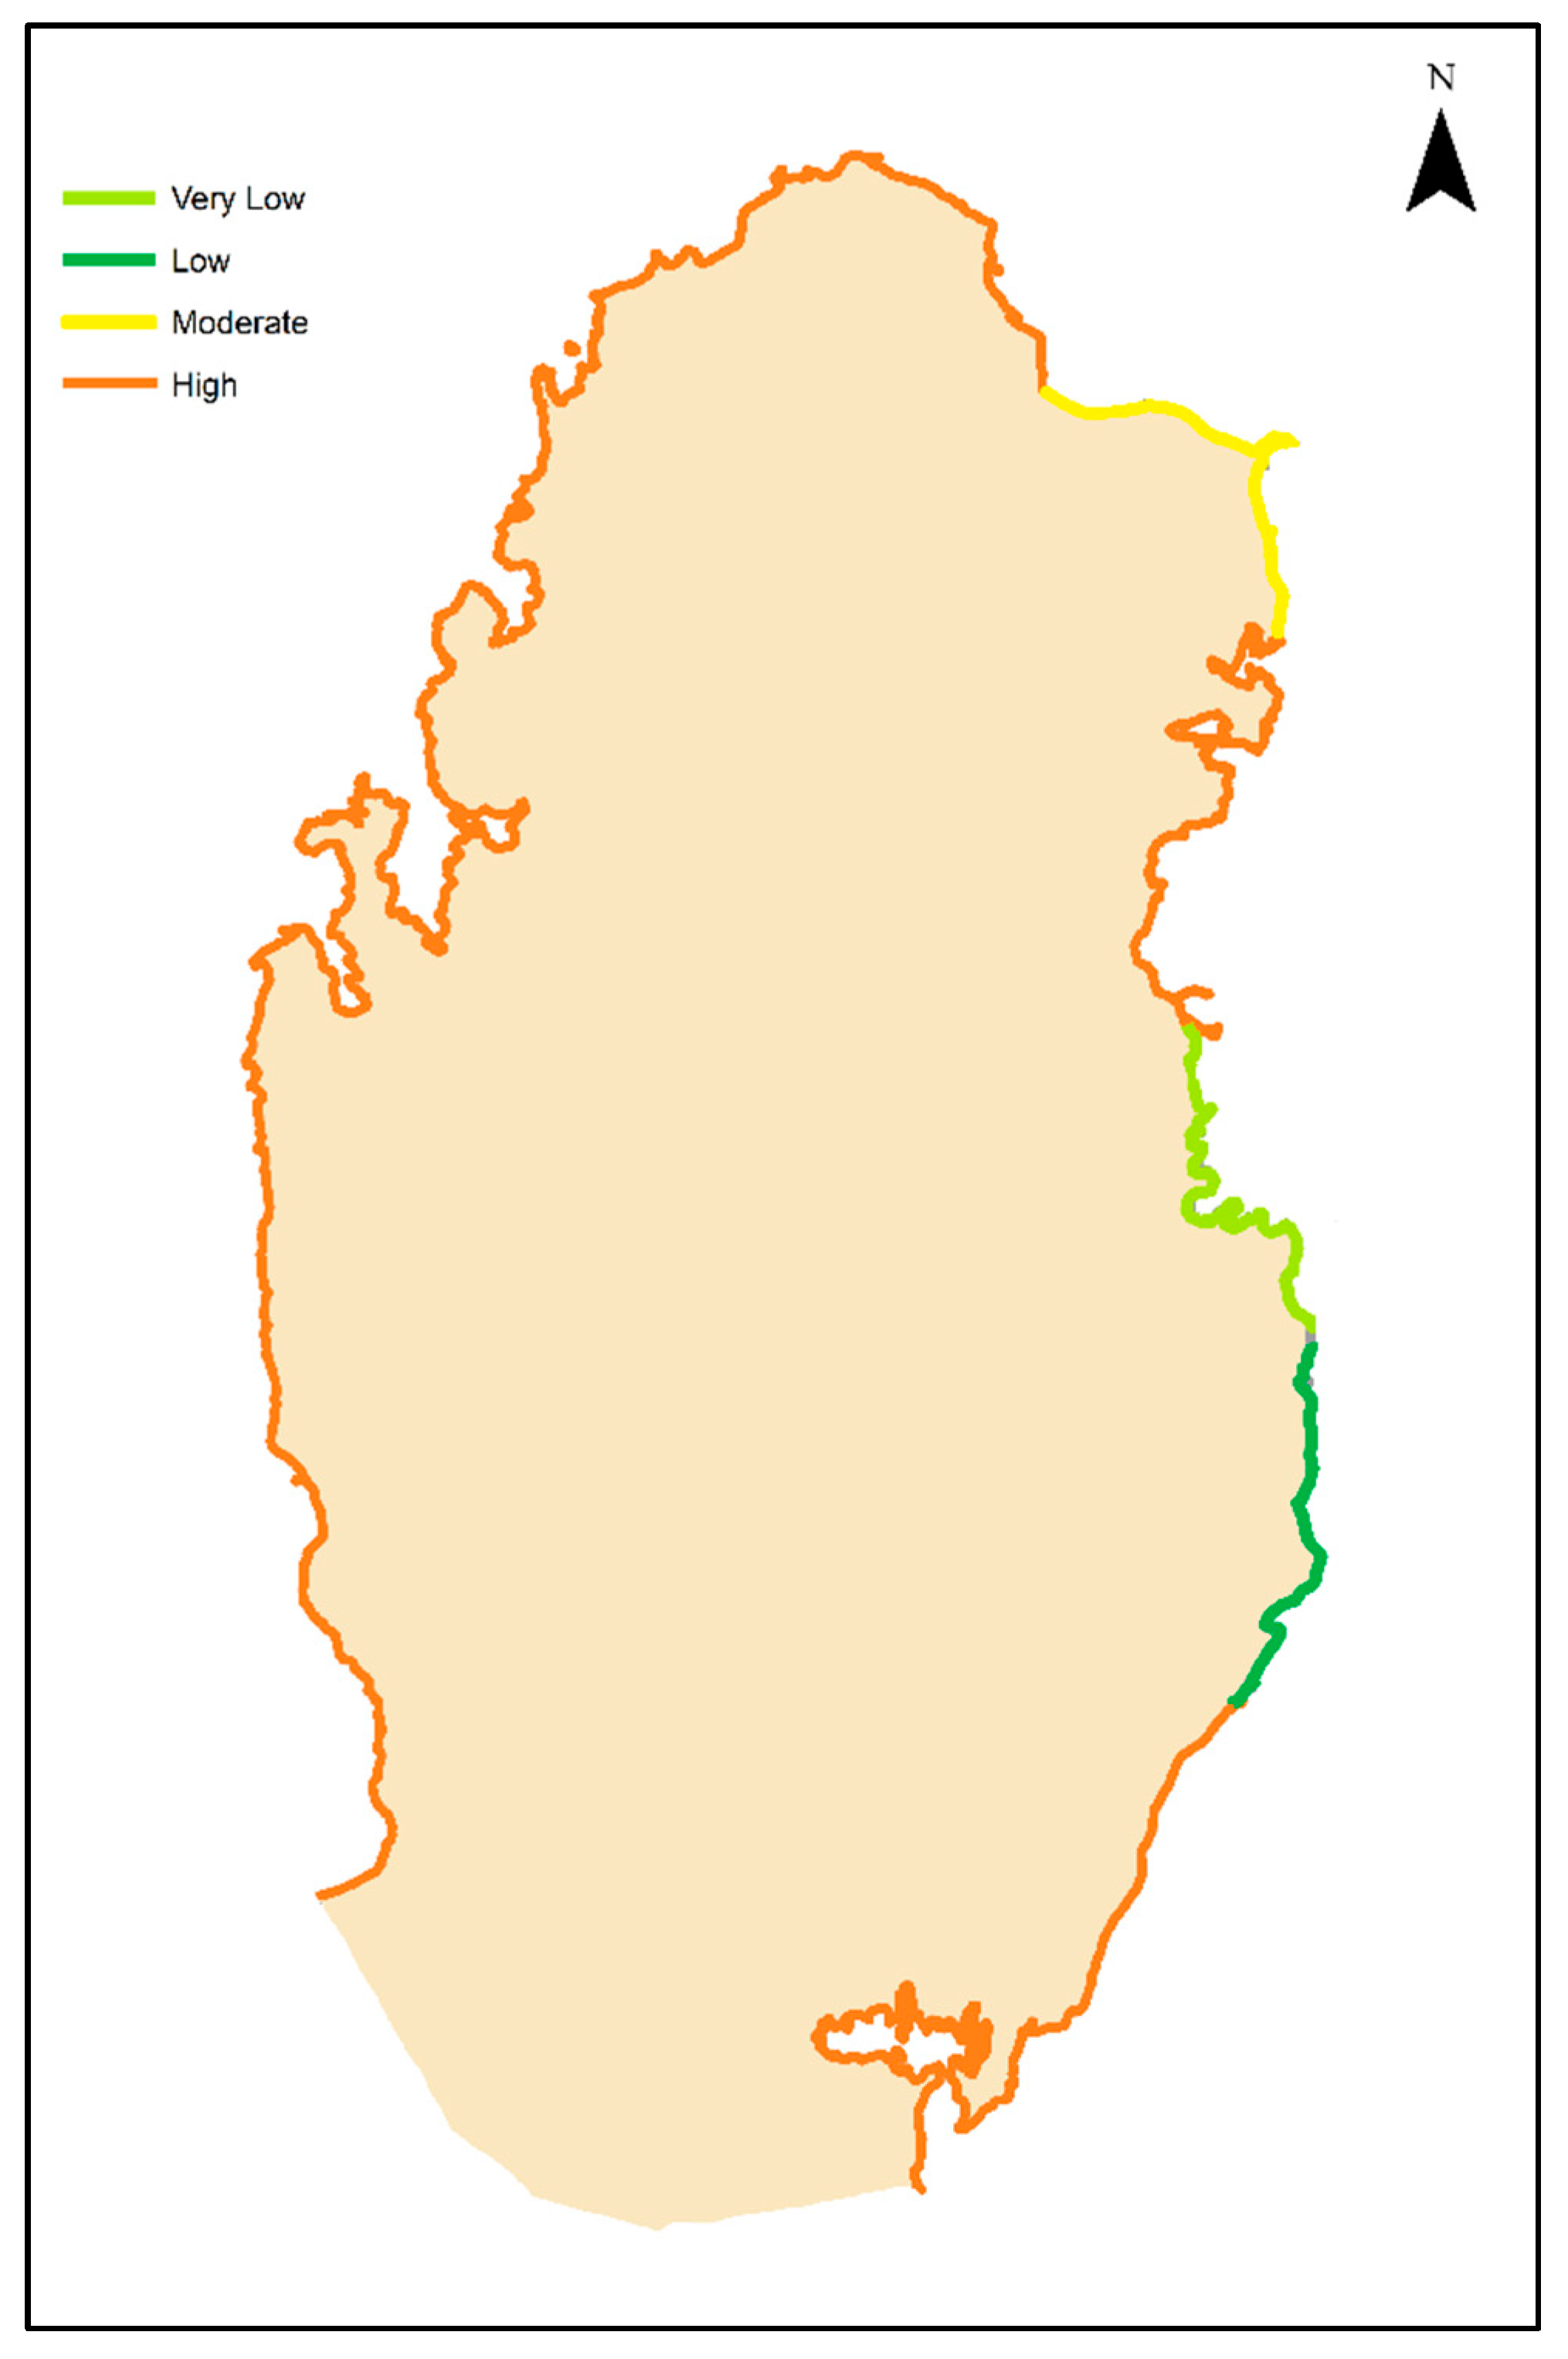
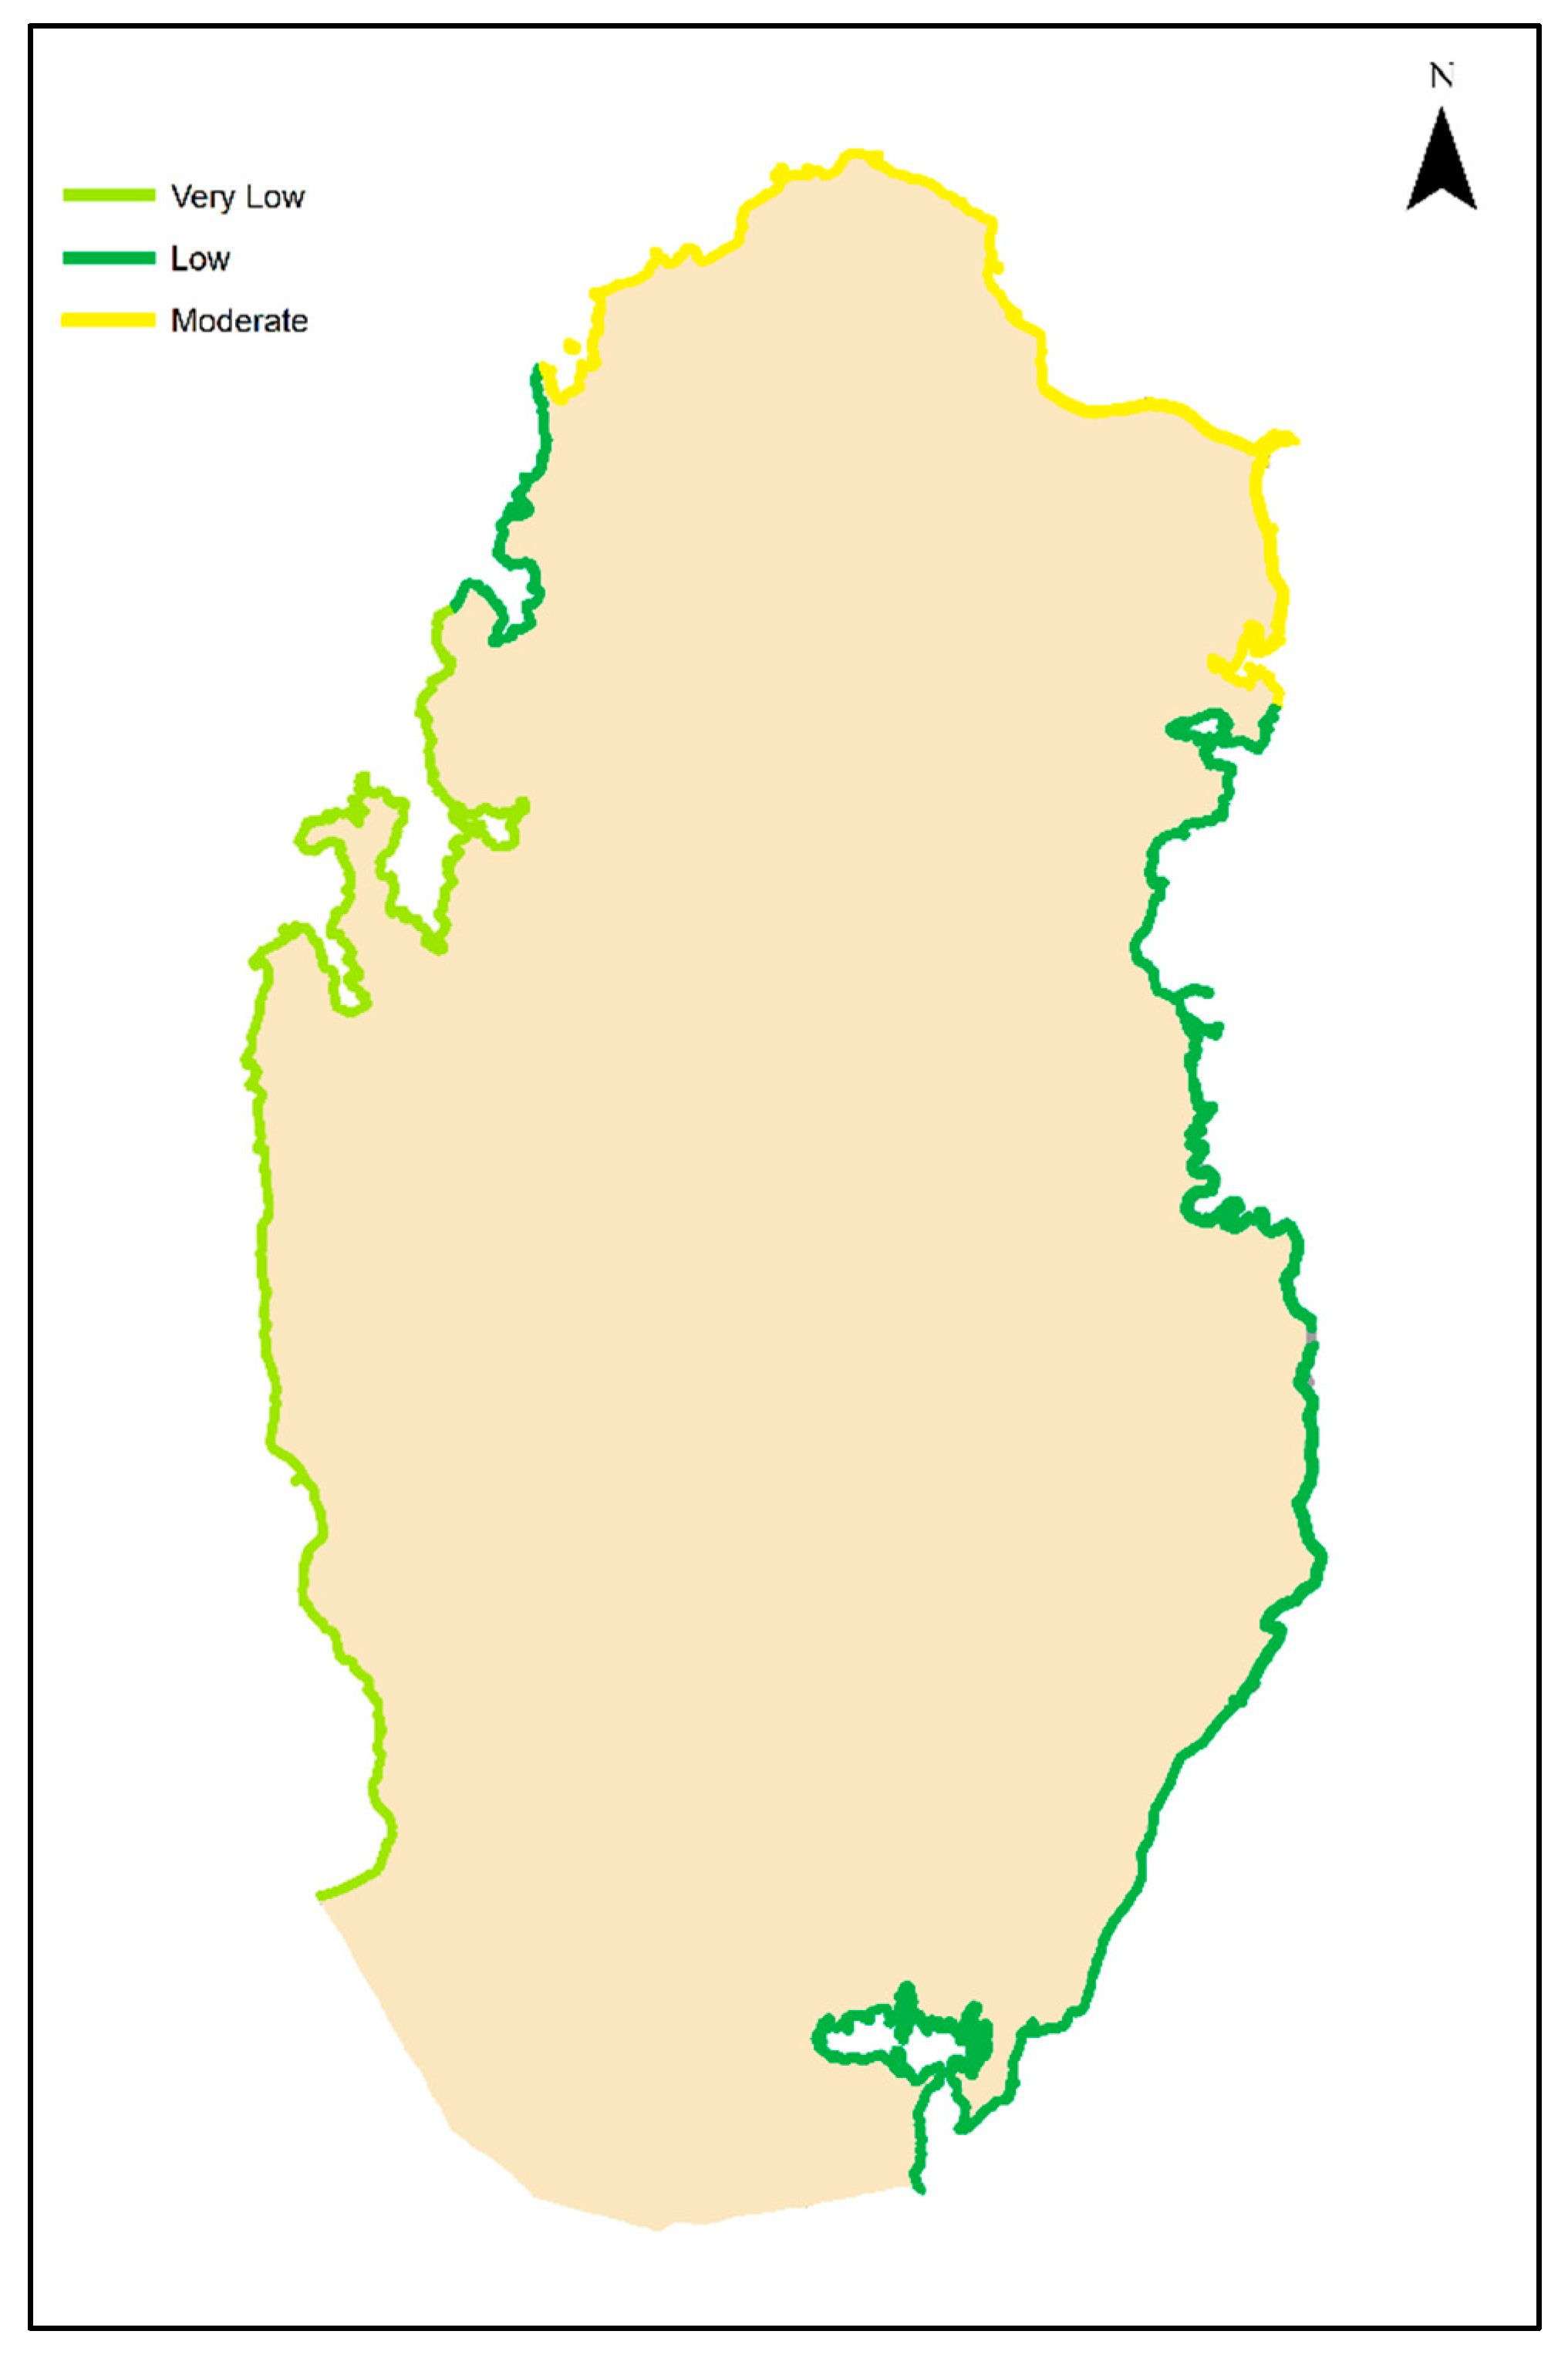
This variable represents the rate of land reclamation and coastal loss, whether driven by natural processes or human activities. In Doha, extensive land reclamation projects, such as Lusail, The Pearl, and the Corniche, have significantly changed the coastal landscape, with many of these projects either completed or ongoing. According to the World Bank estimates, coastal areas lacking protection measures or land reclamation efforts experience erosion rates exceeding 2 m/year. However, in Qatar, the overall erosion rate is considerably lower, ranging between 0.3 and 0.9 m/year. Doha, in particular, has undergone coastal accretion due to continuous land reclamation efforts, a trend that extends to parts of Lusail and Al Wakra. As depicted in Figure 5, coastal erosion patterns vary significantly across Qatar. While no area has reached the level 5 (very high-risk) classification, the entire western coast is categorized as high risk. The eastern coastline exhibits a different erosion pattern, largely influenced by human activities. In the northern region, Ras Laffan is moderately protected from erosion, falling within the moderate-risk index. Further south, Al Wakra and Mesaieed exhibit low erosion rates, classifying them in the low-risk category. Doha, due to its significant land reclamation projects, is classified as very low risk. However, the coastal stretch between Ras Laffan and Doha, as well as the southeastern coastline starting from Sealine, is considered high risk, similar to the western coast. Notably, these two high-risk regions have minimal human activity, indicating that natural erosion processes play a dominant role in shaping their coastal vulnerability.
Figure 5. Shoreline erosion/accretion risk map of the coastline of Qatar.
The shoreline erosion/accretion rate is selected as a key physical variable because it directly measures a coastline’s resilience to environmental changes. Erosion indicates coastal retreat, highlighting the coastline’s susceptibility to land loss, while accretion represents sediment deposition, which can occur naturally such as from river discharge into the Arabian Gulf basin or through manmade land reclamation projects. In Qatar, shoreline changes vary significantly across the coastline, but no area reaches the level 5 (very high-risk) classification. However, due to the spatial variation in erosion and accretion patterns, index values fluctuate across different coastal regions. This variability makes shoreline erosion/accretion the most dynamic factor among the six physical variables in CVI calculations, leading to regionally diverse vulnerability assessments across Qatar’s coast.

2.8. Mean Tide Range

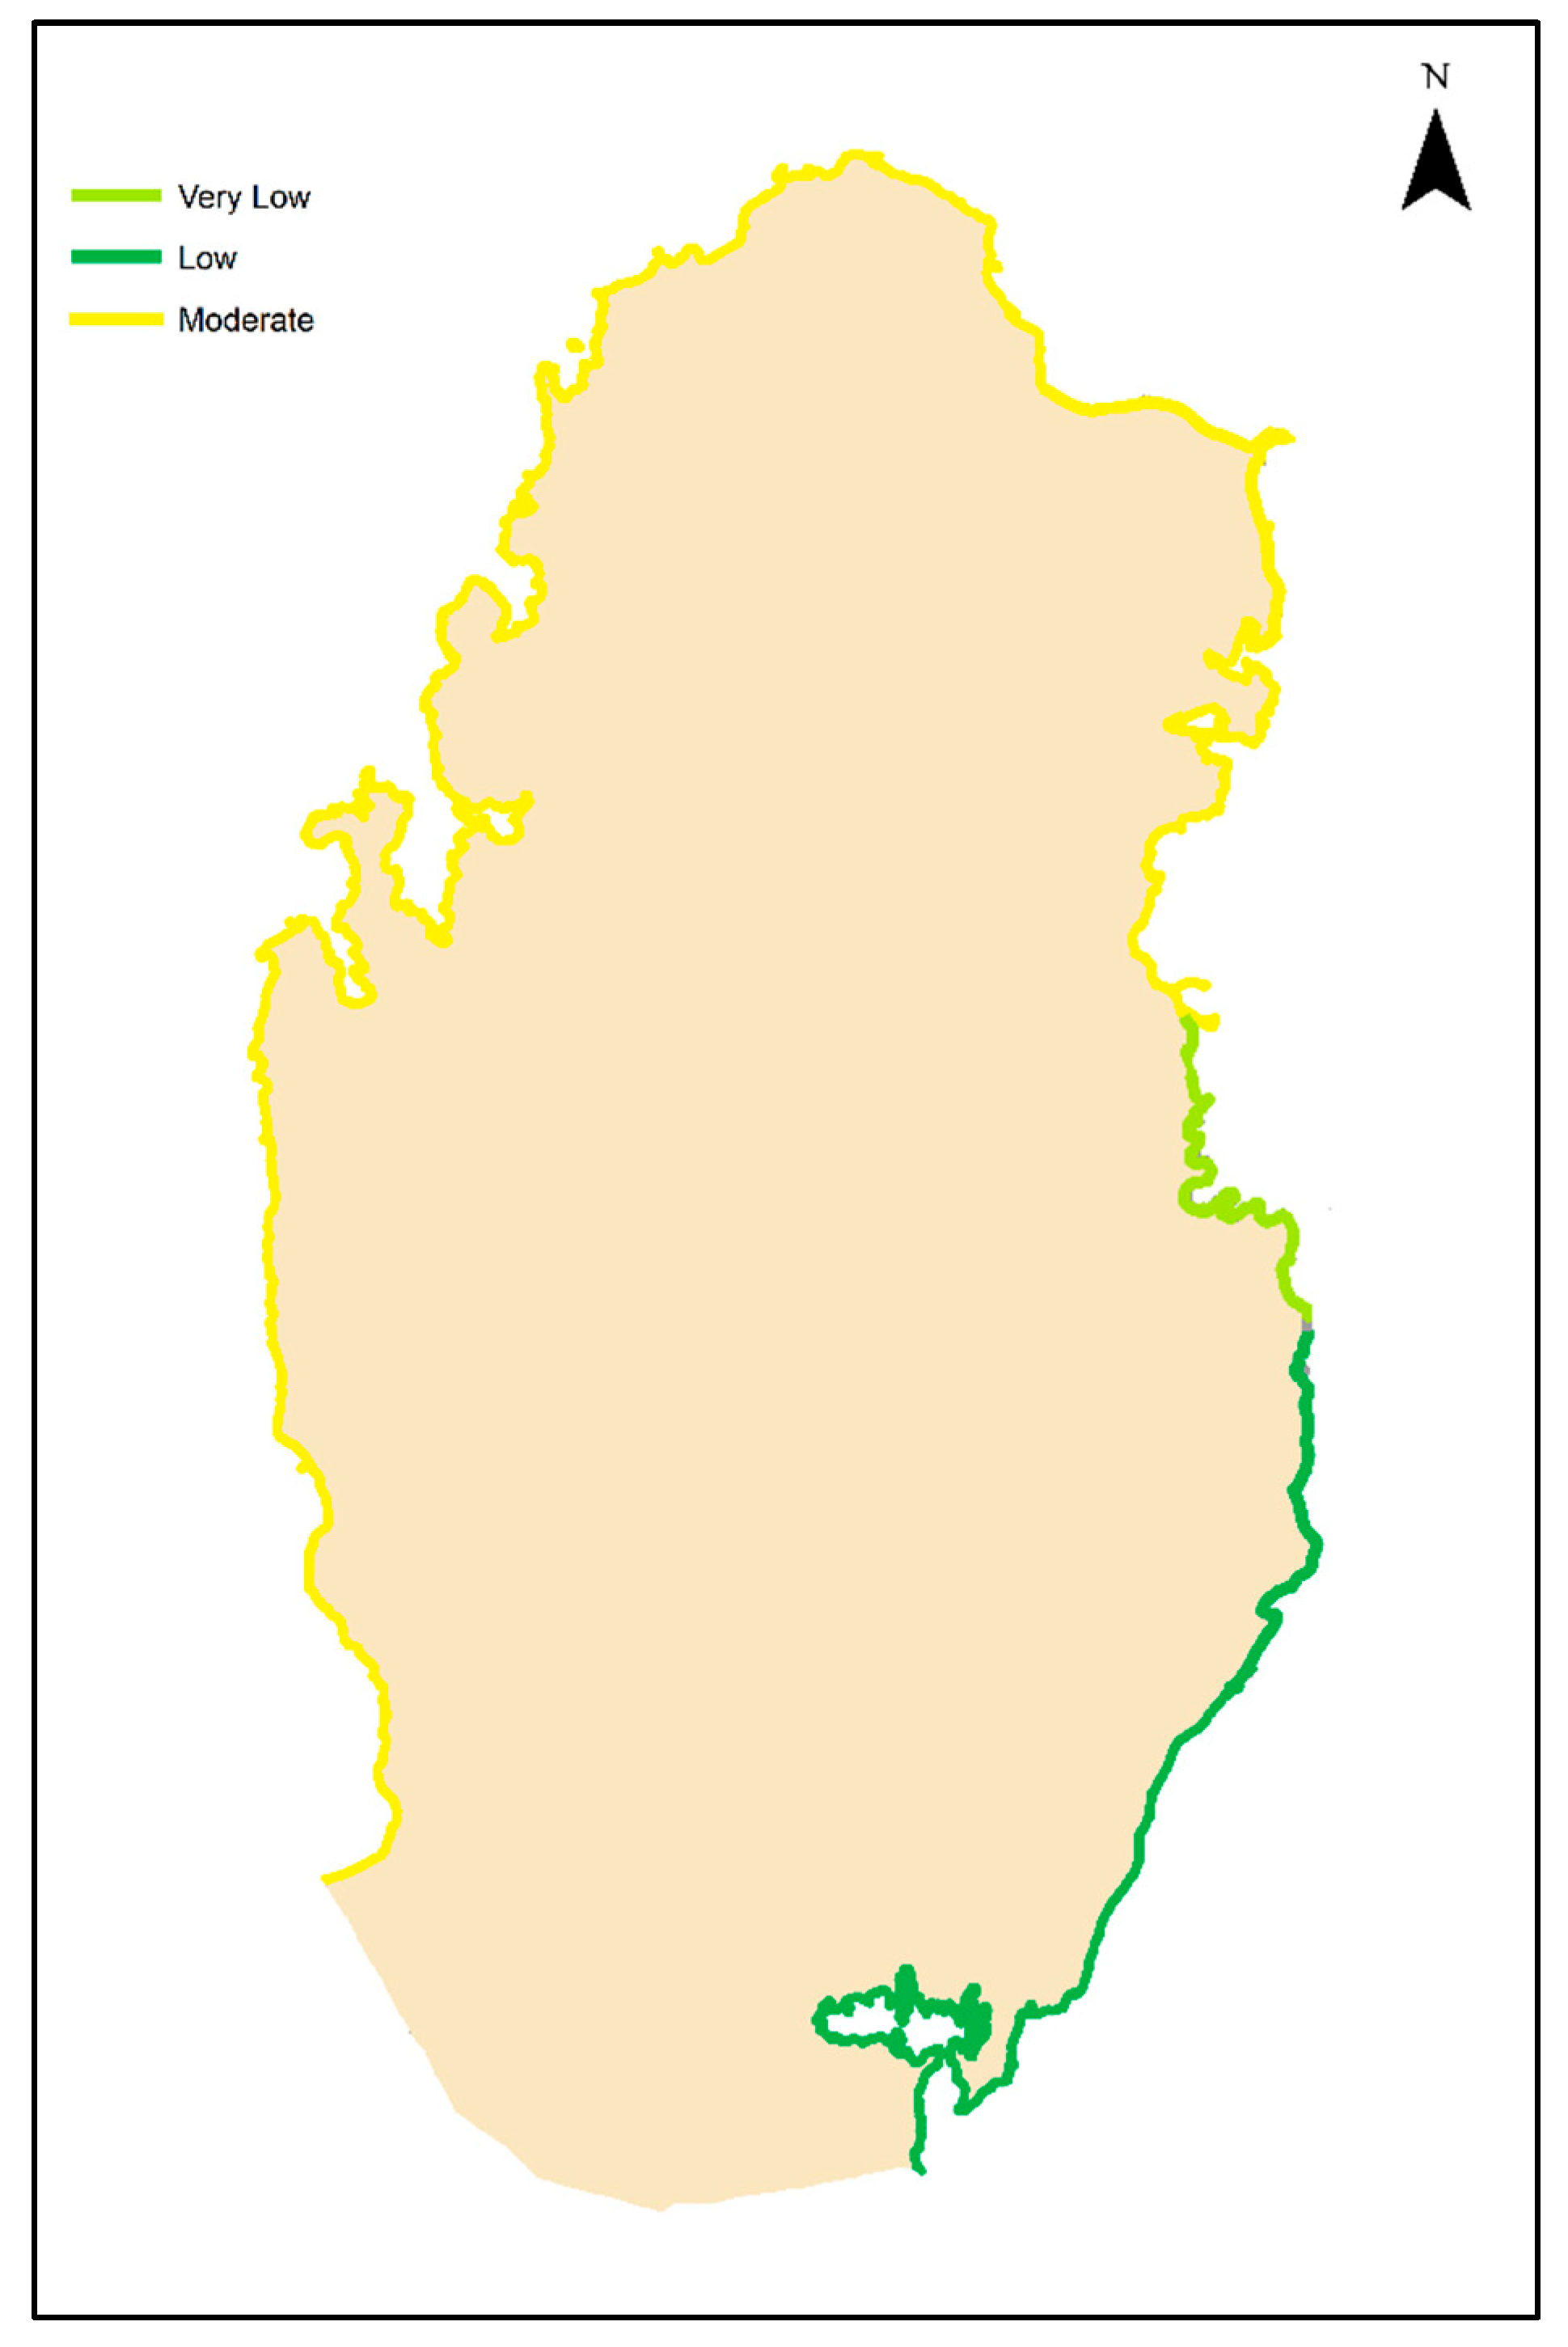
Given the seasonal variability of tides and the influence of wind patterns, including ENSO, tide levels can fluctuate significantly. However, for this study, the mean tide range is calculated as an annual average to ensure consistency in assessment. As outlined by [] and the USGS [], the mean tide range is categorized into five levels, with higher values corresponding to greater risk. The very low-risk category (1) ranges from 1.48 to 1.68 m, while the very high-risk category is set between 2.11 and 2.74 m. According to the Qatar Meteorology Department, the national average mean tide range is 1.5 m, though variations existing across different coastal regions. The highest recorded mean tide range over the year is in Al Khor, reaching 2.04 m. The western coast of Qatar experiences lower tidal extremes compared to the eastern coast. As depicted in Figure 6, the tide range distribution in Qatar produces unexpected results when compared to the USGS classification system []. The entire western coastline, along with the northern and eastern coast up to Doha, falls within the moderate-risk category. However, the risk level drops significantly to very low in the Doha region, before rising again from the southern part of Doha to the country’s border, where it is classified as low risk.
Figure 6. Mean tide range risk map of the coastline of Qatar.
Obtaining detailed data on the mean tide range across the entire coastline is a challenging task, requiring specialized equipment for precise measurements. This study incorporates data from the Qatar Meteorology Department, which provides publicly available records from six locations: Doha, Al Khor, Mesaieed, Al Wakrah, Dukhan, and Al Ruwais. To estimate tide levels along the entire coastline, the data was interpolated by averaging values between two adjacent measurement points in a gradual manner. The results indicate unexpected index values, ranging from 1 to 3, suggesting moderate variability in tidal influence across different regions. The mean tide range is a crucial physical variable in Coastal Vulnerability Index (CVI) calculations, as higher tide levels serve as an early indicator of potential coastal inundation [].

2.9. Mean Wave Height

This variable measures wave height closest to the shoreline over the course of a year, using the annual average. Similar to mean tidal range, wave height fluctuates seasonally and varies year to year. According to the Qatar Meteorology Department, the average wave height near Qatar’s coast is 0.3 m, with maximum recorded heights reaching 1.52 m. The northern and northeastern coastlines experience the strongest waves, whereas the western coastline generally has smaller waves. This discrepancy may be due to Bahrain’s geographical position, which provides natural shielding for Qatar’s western coast from direct wave exposure. For this study, rather than applying the USGS classification system [] which is based on oceanic conditions with significantly larger waves, the classification system proposed by [] is adopted, as it is better suited for the Arabian Gulf’s enclosed environment. Under this classification, very low-risk wave heights are set at 0.5 m or less, which aligns with Qatar’s average wave height. Meanwhile, the high-risk category is defined by wave heights exceeding 1.1 m. As shown in Figure 7, three distinct wave height risk zones are present along Qatar’s coastline. The very low-risk category applies to most of the western coastline, extending up to Zekreet, as well as the southeastern coast, beginning at Sealine. The low-risk category encompasses most of the eastern coastline, stretching from Doha to Al Khor, in addition to the Al Zubarah region on the western coast. Finally, the moderate-risk category is observed in the northern coastal zone, spanning Al Zubarah to the southern part of Ras Laffan, where wave heights tend to be higher.
Figure 7. Mean wave height risk map of the coastline of Qatar.
Mean wave height is included as a key physical variable in the Coastal Vulnerability Index (CVI) calculation because it has a direct influence on coastal inundation, similar to mean tidal range []. However, data on mean wave height is scarce and challenging to obtain, highlighting the need for further research and data enhancement to improve the accuracy of coastal vulnerability assessments. Currently, available data places Qatar’s wave height index values between 1 and 3, indicating low to moderate risk. The upper limit of wave height in Qatar remains relatively low due to its geographical position as a peninsula in the Arabian Gulf, Qatar is bordered by a semi-enclosed sea rather than an open ocean, which limits wave energy and size compared to coastlines exposed to larger water bodies.

3. Results and Discussion

The AHP analysis clearly prioritizes variables related to coastal vulnerability, as evidenced by the pair-wise comparison matrix in Table 5 and Table 6 For instance, geomorphology is deemed three times more important than coastal slope reflected by a weight of 3, with the reciprocal value of 1/3 applied when comparing coastal slope to geomorphology. The AHP analysis of PVI variables yielded a consistency ratio (CR) of 0.098 indicates reliable AHP results, being below the 0.1 threshold [,]. Table 7 illustrates the percentage contributions of the six variables, with sea level rise (SLR) accounting for the largest share at 43.2%, geomorphology contributes 25.3%, and together, these top variables represent 68.5% of the total weight. The remaining factors, in descending order, are shoreline erosion (10.8%), coastal slope (9.2%), mean wave height (8.7%), and mean tide range (2.8%). Reciprocal values, as shown in Table 4, represent the inverse of the original comparison scores. The AHP analysis of SVI variables yielded a consistency ratio (CR) of 0.004 which is also indicates a reliable AHP result. Table 8 shows what each variable weighs with land use being the highest with 58.2%, followed by population density with 30.9, and lastly GDP per capita with 10.9%.
Table 5. Pair-wise comparison matrix of PVI.
Table 6. Pair-wise comparison matrix of SVI.
Table 7. Weighted criteria (%) of each physical variable.
Table 8. Weighted criteria (%) of each socio-economic variable.
In the analysis of the six variables, geomorphology remains constant across all calculations, as its impact on PVI is universally recognized regardless of other variables. For example, mudflats are consistently classified as high-risk features, irrespective of regional variations. In contrast, coastal slope exhibits significant disparities across studies, with notable variations observed in previous research [,,]. To ensure comparability, this study adopts the classification system used by [] for coastal slope assessments. Sea level rise (SLR) is included as a key variable, as it serves as the primary driving factor behind Qatar’s coastal vulnerability. Although it is a fixed value, comparing its impact to USGS standards [] highlights the devastating effects of high SLR rates. Similarly, shoreline accretion and erosion, along with mean tide range, and mean wave height, exhibit minor disparities in ranking values but are kept consistent with [] to enhance comparability. Unlike oceanic coastlines, Qatar’s semi-enclosed coastal environment experiences less dynamic wave activity. However, regional factors such as high salinity and extreme temperatures further influence PVI results []. These environmental conditions are intrinsically linked to the high regional SLR rate, which is assigned to an index level of 5, the highest global classification, whereas most countries fall within the high to moderate-risk categories. Table 9 presents the range wherein each index input with 0.40 being the lowest possible result given that all 6 variables are an index value of 1, and 51.03 being the highest possible result given that all variables are at an index value of 5, and finally by introducing the second scenario calculation results, which utilize their own adjusted range for direct comparison similarly to the modified range. This structured approach allows for a comprehensive evaluation of Qatar’s coastal vulnerability, considering both standard and regionally adapted methodologies.
Table 9. PVI range and results.
To effectively assess Qatar’s entire coastline despite limited resources and data, the coastline was divided into sections based on changes in a single factor. For the Physical Vulnerability Index (PVI) calculation, results were classified into four risk categories: very high, high, moderate, and low risk. The highest possible PVI value across all categories is 51.03, while the lowest possible value is 0.40. Based on the analysis, Qatar’s coastline falls within a PVI range of 2.23 to 27.38, ensuring comprehensive coverage of the entire coastal area, with particular emphasis on key locations of interest. Qatar has four major hubs and several smaller coastal regions.. The first major area of interest is Doha, where the PVI score is the lowest at 2.23. This low-risk classification is attributed to significant land reclamation projects completed over the past few decades, which have reinforced coastal resilience. The second major hub is Al Wakra City, with a PVI value of 11.54, making it the second-lowest risk area after Doha. Although Al Wakra’s PVI is significantly higher than Doha’s, it remains relatively low in comparison to other coastal areas. Mesaieed, which shares the same PVI ranking as Al Wakra (11.54), was not included in the major hub category but remains an important industrial region along the eastern coast. Further south, the Sealine area, a tourist destination with industrial significance, is dominated by coastal sand dunes. Here, PVI values rise slightly to 18.25 before decreasing again to 12.90 along the southernmost coastline. However, the direct impact of sand dunes on coastal vulnerability remains uncertain, increasing the margin of error for this section.
The second major hub is Al Wakra City, with a PVI value of 11.54, making it the second lowest risk area after Doha. However, despite both being classified as low risk, there is a considerable difference between Doha and Al Wakra in terms of coastal vulnerability. Mesaieed, which has the same PVI score (11.54) as Al Wakra, was not included as a major hub, but it remains an important industrial center along the eastern coastline. Moving further south along the coast, the Sealine area, known for its tourism and industrial significance, is predominantly composed of coastal dunes, with certain sections designated as inland sea. Here, PVI values increase slightly to 18.25 before gradually decreasing to 12.90 at the southernmost stretch of the coastline. However, the direct influence of sand dunes on coastal vulnerability remains uncertain, leading to a higher margin of error for PVI calculations in this region. Further detailed studies are required to assess the role of dunes in coastal resilience and long-term vulnerability.
The third hub is Al Khor city with a PVI total of 22.36. Ras Laffan, an area north of Al Khor, while not included in the major hub category is also a very important industrial coastal area for Qatar, it shares the same quality of variables with Al Khor and has a similar index of 21.21. The same applies to the small town of Sumaysimah south of Al Khor. The same trend continues south with a slight decrease until Lusail City where the index value reaches that of Doha.
The fourth and last major hub is Al Ruwais, which has the lowest population. It also has the highest PVI calculation with 27.38. It is the northern most point in Qatar with areas around it sharing the same variables until reaching Ras Laffan to the east and Alzubarah to the west. The only major difference between Al Ruwais and the whole western front is wave height. The western front has many known minor areas such as Alzubarah, Zekreet and Dukhan. Dukhan is the industrial western coastal area in Qatar. While these areas are less populated, they are always visited for sightseeing purposes, and the risk factor is considered very high across the whole western coast. Alzubarah has a PVI calculation of 22.36 with Zekreet, and Dukhan has a lower Index of 15.81.
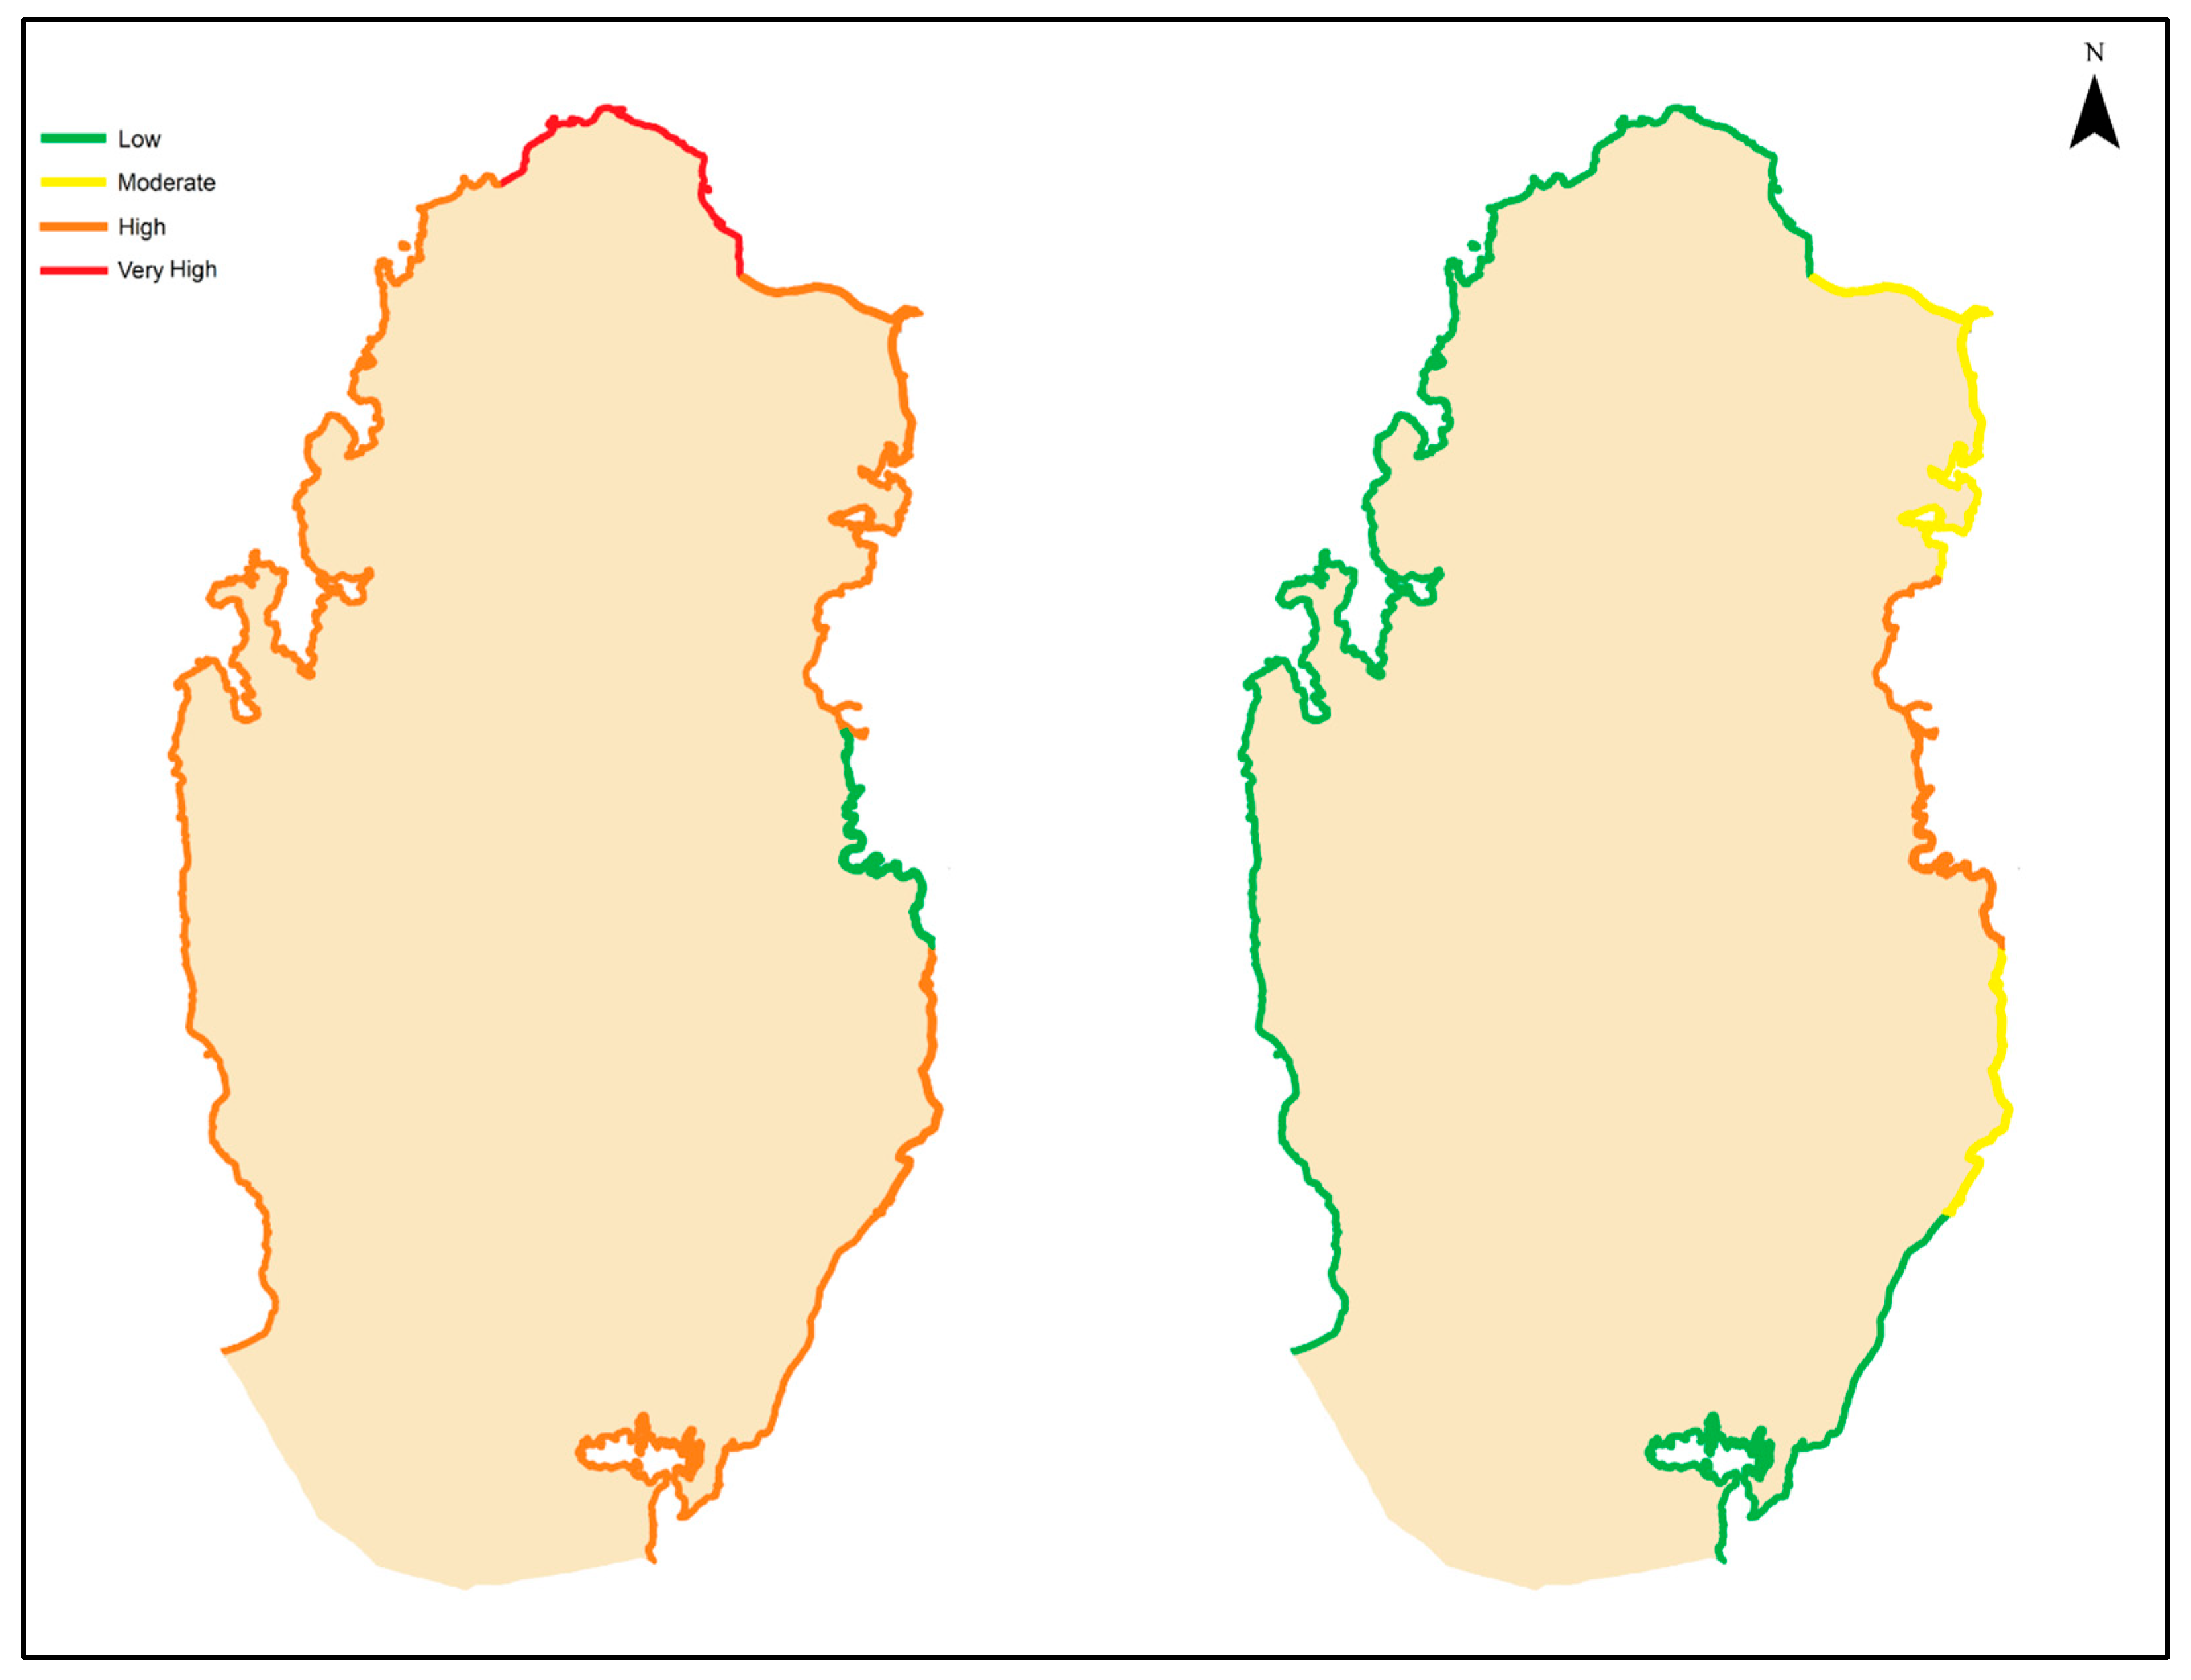
Each of the four risk categories is defined based on an average score distribution. The low-risk category is determined by taking the lowest index value (1) and multiplying it for all 6 variables and dividing the product by the number of variables used (6), where finally, the square root is taken to produce the lowest PVI possible (0.40). afterwards, the process is repeated for the second lowest value (2) which yields a PVI possible of (3.26), resulting in a range of 0.40–3.26. This process is repeated for the moderate-risk category, where the values range from 3.27 to 11.02, followed by the high-risk category with a range of 11.03 to 26.12, and finally, the very high-risk category, which spans 26.13 to 51.03. Under this classification, as illustrated in Table 9 and Figure 8, the very high-risk category shrinks from 520 km to 78 km, with the most vulnerable region being the northernmost coastline, stretching from Al Zubarah to Ras Laffan. The remaining coastal regions, totaling 448 km, shift to the high-risk category, with Doha remaining in the low-risk category due to extensive coastal protection measures. Although this alternative classification method presents a substantial difference in categorization, it does not negate Qatar’s overall vulnerability. The majority of the coastline still falls within high-risk classifications, emphasizing the need for continued monitoring, coastal adaptation strategies, and risk mitigation measures. The SVI is also shown in Figure 8, where a stark contrast is observed. This demonstrates the extent to which Qatar prioritizes vital infrastructure protection, however, this approach has also concentrated resources in specific areas, such as Doha.
Figure 8. PVI map of Qatar (left). SVI map of Qatar (right).
The results indicate that Qatar’s coastline falls predominantly within the high to very high-risk categories, with Doha being the only exception, classified as low risk due to extensive coastal protection measures. The findings can be further divided into eight distinct regions, each defined by its specific PVI values, allowing for a spatially comprehensive assessment of vulnerability across the coastline. The SVI results follow a much different pattern compared to the PVI results, with the whole western coastline in low risk up until the Ras Laffan where the index increases to moderate and continues to increase along the eastern coastline until it reaches very high risk at Doha. It drops to moderate as leaves the area of Hamad International Airport and fully transitions into low risk after Mesaieed. The final CVI calculation takes advantage of both the physical and socio-economic differing results, producing a much more accurate index as seen in Figure 9. The final CVI calculation provides a sensitivity analysis with varying PVI and SVI weightings. Starting from the left the weightings are as follows:
Figure 9. Final CVI calculation map sensitivity analysis; (a) represents 0.75 PVI & 0.25 SVI, (b) represents 0.50 PVI & 0.50 SVI, and (c) represents 0.25 PVI & 0.75 SVI.
  • PVI 75%, SVI 25%
  • PVI 50%, SVI 50%
  • PVI 25%, SVI 75%
Given that the socio-economic variables are lower in risk when compared to the physical variables, as this study focuses on SLR, it can be observed that socially and economically, Qatar has the power to lower the risk significantly in many regions such as the large unutilized west coast, and some areas in the east coast, mainly Doha and Al-Wakra. However, the only region increasing in risk with the additional weighing of SVI is the small region of Doha, where it shows how the area is resilient to physical coastal hazards, but due to the high population density and vital infrastructure is at higher risk from a socio-economic perspective.
CVI depicts the current state of risk; however, it can be improved as a major gap is the lack of data specific to conduct risk calculations. The data of the CVI in regard to population density are from [], giving the rapid state of development in the region; especially after many major events in Qatar, such as the World Cup, the socio-economic data should have changed significantly in 5 years. The other datasets are from [], which are more recent, so do not pose a problem.

4. Conclusions

Qatar’s location in the Arabian Gulf makes it highly vulnerable to sea-level rise (SLR), which is accelerating faster regionally than the global average. This study, the first of its kind in Qatar to incorporate both physical and socio-economic factors, reveals that over 90% of the coastline is at very high risk, primarily due to low elevation, unfavorable geomorphology, and erosion. While Doha currently ranks as low risk due to extensive coastal infrastructure and land reclamation, future SLR projections may place even protected areas at significant risk. The findings emphasize the need for proactive and region-specific adaptation measures. Solutions such as shoreline reinforcement, sea walls, and artificial slope adjustments may help reduce vulnerability, but they must be balanced with environmental sustainability. Current CVI scores reflect present-day conditions; however, with Qatar’s high regional SLR rate, these scores could rise sharply in coming decades. The study also identifies critical data gaps, particularly in socio-economic variables, which currently represent 25% of the CVI calculation. Even with only three socio-economic indicators, the SVI was enough to shift some regions into higher risk categories, underlining the importance of integrating physical and socio-economic datasets in future assessments. As Qatar continues rapid coastal development, improved data collection and governmental support are vital for refining vulnerability assessments. Long-term resilience depends on early intervention, sustainable planning, and enhanced understanding of the region’s evolving coastal risks. Further research across Gulf nations is essential to support regional adaptation efforts and to better understand the causes and impacts of accelerated sea-level rise in the Arabian Gulf.

Author Contributions

Conceptualization, A.N.A.A.B.-K. and T.A.-A.; methodology, A.N.A.A.B.-K.; software, A.N.A.A.B.-K.; validation, A.N.A.A.B.-K. and H.B.; formal analysis, A.N.A.A.B.-K.; investigation, A.N.A.A.B.-K.; resources, T.A.-A.; data curation, A.N.A.A.B.-K.; writing-original draft preparation, A.N.A.A.B.-K.; writing-review and editing, T.A.-A. and H.B.; visualization, A.N.A.A.B.-K.; supervision, T.A.-A.; project administration, T.A.-A.; funding acquisition, T.A.-A. All authors have read and agreed to the published version of the manuscript.

Funding

This research was funded by the National Priorities Research Program (NPRP) grant No. NPRP14C-0909-210008 from the Qatar National Research Fund (a member of Qatar Foundation).

Data Availability Statement

Data is available on request.

Acknowledgments

The authors acknowledge the support provided by Hamad bin Khalifa University, Doha, Qatar, a member of the Qatar Foundation. This publication was made possible by the National Priorities Research Program (NPRP) grant No. NPRP14C-0909-210008 from the Qatar National Research Fund (a member of Qatar Foundation). The findings herein reflect the work, and are solely the responsibility of the authors. The authors also thank the Qatar National Library for providing open-access funding.

Conflicts of Interest

The authors declare no conflict of interest.

References

  1. IPCC. Section 4: Near-Term Responses in a Changing Climate. In Climate Change 2023: Synthesis Report; IPCC: Geneva, Switzerland, 2023; pp. 42–66. [Google Scholar] [CrossRef]
  2. IPCC. Sea Level Rise and Implications for Low-Lying Islands, Coasts and Communities. In The Ocean and Cryosphere in a Changing Climate; Cambridge University Press: Cambridge, UK, 2022; pp. 321–446. [Google Scholar] [CrossRef]
  3. Fang, J.Y.; Zhu, J.L.; Wang, S.P.; Yue, C.; Shen, H.H. Global warming, human-induced carbon emissions, and their uncertainties. Sci. China Earth Sci. 2011, 54, 1458–1468. [Google Scholar] [CrossRef]
  4. Zhong, S.; Huang, C. Climate change and human health: Risks and responses. Kexue Tongbao/Chin. Sci. Bull. 2019, 64, 2002–2010. [Google Scholar] [CrossRef]
  5. Bakhamis, A.N.; Bilal, H.; Heggy, E.; Al-Kuwari, M.S.; Al-Ansari, T. On the drivers, forecasts, and uncertainties of relative sea level rise in the Eastern Arabian Peninsula: A review. Reg. Stud. Mar. Sci. 2024, 73, 103503. [Google Scholar] [CrossRef]
  6. Church, J.A.; White, N.J. Sea-Level Rise from the Late 19th to the Early 21st Century. Surv. Geophys. 2011, 32, 585–602. [Google Scholar] [CrossRef]
  7. Hay, C.C.; Morrow, E.; Kopp, R.E.; Mitrovica, J.X. Probabilistic reanalysis of twentieth-century sea-level rise. Nature 2015, 517, 481–484. [Google Scholar] [CrossRef]
  8. Frederikse, T.; Landerer, F.W.; Caron, L.; Adhikari, S.; Parkes, D.; Humphrey, V.; Dangendorf, S.; Hogarth, P.; Zanna, L.; Cheng, L.; et al. The causes of sea-level rise since 1900. Nature 2020, 584, 393–397. [Google Scholar] [CrossRef]
  9. Gornitz, V.; White, T.W.; Cushman, R.M. Vulnerability of the US to Future Sea Level Rise; Oak Ridge National Lab.: Oak Ridge, TN, USA, 1991. [Google Scholar]
  10. Ramieri, E.; Hartley, A.; Barbanti, A.; Santos, F.D.; Gomes, A.; Hilden, M.; Laihonen, P.; Marinova, N.; Santini, M. Methods for Assessing Coastal Vulnerability to Climate Change; European Environment Agency, European Topic Centre on Climate Change Impacts, Vulnerability and Adaptation: Copenhagen, Denmark, 2011; pp. 1–93. [Google Scholar]
  11. Pantusa, D.; D’aLessandro, F.; Frega, F.; Francone, A.; Tomasicchio, G.R. Improvement of a coastal vulnerability index and its application along the Calabria Coastline, Italy. Sci. Rep. 2022, 12, 21959. [Google Scholar] [CrossRef]
  12. Shah, M.A.R.; Wang, X. Assessing social-ecological vulnerability and risk to coastal flooding: A case study for Prince Edward Island, Canada. Int. J. Disaster Risk Reduct. 2024, 106, 104450. [Google Scholar] [CrossRef]
  13. Fajri, Z.; Beroho, M.; Lamhadri, S.; Ouallali, A.; Spalevic, V.; Aboumaria, K. Geomatics Assessment of Coastal Erosion Vulnerability: A Case Study of Agadir Bay, Morocco. J. Agric. For. 2024, 70, 185–201. [Google Scholar] [CrossRef]
  14. Sreelakshmi, M.; Balachandran, S.; Abdurazak, F.; Gopinath, G.; Joseph, S. From perils to preparedness: Decoding coastal hazard risks on Kerala’s central coast through the IPCC framework. Nat. Hazards 2024, 120, 8639–8666. [Google Scholar] [CrossRef]
  15. Das, T.; Shahfahad; Rahman, A. Assessing tropical cyclone risk for improving mitigation strategies in Coastal Odisha, India. Environ. Sci. Pollut. Res. 2024, 31, 53856–53876. [Google Scholar] [CrossRef]
  16. Xu, J.; Qiang, Y. Environmental justice implications of flood risk in the contiguous United States—A spatiotemporal assessment of flood exposure change from 2001 to 2019. Cartogr. Geogr. Inf. Sci. 2024, 51, 492–512. [Google Scholar] [CrossRef]
  17. Carbognin, L.; Teatini, P.; Tosi, L. Eustacy and land subsidence in the Venice Lagoon at the beginning of the new millennium. J. Mar. Syst. 2004, 51, 345–353. [Google Scholar] [CrossRef]
  18. Umgiesser, G.; Bajo, M.; Ferrarin, C.; Cucco, A.; Lionello, P.; Zanchettin, D.; Papa, A.; Tosoni, A.; Ferla, M.; Coraci, E.; et al. The prediction of floods in Venice: Methods, models and uncertainty (review article). Nat. Hazards Earth Syst. Sci. 2021, 21, 2679–2704. [Google Scholar] [CrossRef]
  19. VanKoningsveld, M.; Mulder, J.P.M.; Stive, M.J.F.; VanDerValk, L.; VanDerWeck, A.W. Living with Sea-Level Rise and Climate Change: A Case Study of the Netherlands. J. Coast. Res. 2008, 242, 367–379. [Google Scholar] [CrossRef]
  20. Jonkman, S.N.; Hillen, M.M.; Nicholls, R.J.; Kanning, W.; van Ledden, M. Costs of Adapting Coastal Defences to Sea-Level Rise—New Estimates and Their Implications. J. Coast. Res. 2013, 29, 1212–1226. [Google Scholar] [CrossRef]
  21. NOAA/NESDIS/STAR Laboratory. Center for Satellite Applications and Research—NOAA/NESDIS/STAR. Available online: https://www.star.nesdis.noaa.gov/socd/lsa/SeaLevelRise/LSA_SLR_timeseries_regional.php (accessed on 9 May 2022).
  22. Khan, A.A.; Ahmed, I.; Qamar, M.K.; Aqsa, T. Sea Level Rise and Tsunami in the Middle East. Asian Bull. Big Data Manag. 2024, 4, 66–87. [Google Scholar] [CrossRef]
  23. Saaty, T.L. A scaling method for priorities in hierarchical structures. J. Math. Psychol. 1977, 15, 234–281. [Google Scholar] [CrossRef]
  24. Sethuraman, S.; Alshahrani, H.M.; Tamizhselvi, A.; Sujaatha, A. Assessment of coastal vulnerability using AHP and machine learning techniques. J. South Am. Earth Sci. 2024, 147, 105107. [Google Scholar] [CrossRef]
  25. Sekovski, I.; Del Río, L.; Armaroli, C. Development of a coastal vulnerability index using analytical hierarchy process and application to Ravenna province (Italy). Ocean Coast. Manag. 2020, 183, 104982. [Google Scholar] [CrossRef]
  26. Rana, M.; Proshanto, B.; Bashirul, I.; Mostaq, H. A GIS-AHP Technique to Assess the Flood Susceptibility: A Case on Bhola District. In Proceedings of the 7th International Conference on Advances in Civil Engineering (ICACE2024), Chattogram, Bangladesh, 12–14 December 2024. [Google Scholar]
  27. Cruz-Ramírez, C.J.; Chávez, V.; Silva, R.; Muñoz-Perez, J.J.; Rivera-Arriaga, E. Coastal Management: A Review of Key Elements for Vulnerability Assessment. J. Mar. Sci. Eng. 2024, 12, 386. [Google Scholar] [CrossRef]
  28. Chang, H.-K.; Liou, J.-C.; Chen, W.-W. Protection Priority in the Coastal Environment Using a Hybrid AHP-TOPSIS Method on the Miaoli Coast, Taiwan. J. Coast. Res. 2012, 28, 369–374. [Google Scholar] [CrossRef]
  29. Mahapatra, M.; Ramakrishnan, R.; Rajawat, A.S. Coastal vulnerability assessment using analytical hierarchical process for South Gujarat coast, India. Nat. Hazards 2015, 76, 139–159. [Google Scholar] [CrossRef]
  30. Bera, R.; Maiti, R. Multi hazards risk assessment of Indian Sundarbans using GIS based Analytic Hierarchy Process (AHP). Reg. Stud. Mar. Sci. 2021, 44, 101766. [Google Scholar] [CrossRef]
  31. Ariffin, E.H.; Mathew, M.J.; Roslee, A.; Ismailluddin, A.; Yun, L.S.; Putra, A.B.; Yusof, K.M.K.K.; Menhat, M.; Ismail, I.; Shamsul, H.A.; et al. A multi-hazards coastal vulnerability index of the east coast of Peninsular Malaysia. Int. J. Disaster Risk Reduct. 2023, 84, 103484. [Google Scholar] [CrossRef]
  32. Neelamani, S.; Al-Houti, D.; Al-Ragum, A.; Al-Saleh, A.H.; Al-Salem, K. Coastal Vulnerability Index for Kuwaiti Coast. J. Eng. Res. 2022, 10, 1–22. [Google Scholar] [CrossRef]
  33. Rao, K.N.; Subraelu, P.; Rao, T.V.; Malini, B.H.; Ratheesh, R.; Bhattacharya, S.; Rajawat, A.S. Sea-level rise and coastal vulnerability: An assessment of UAE coast, through remote sensing and GIS. J. Coast. Conserv. 2021, 12, 195–207. [Google Scholar] [CrossRef]
  34. AR5 Climate Change 2013: The Physical Science Basis—IPCC. Available online: https://www.ipcc.ch/report/ar5/wg1/ (accessed on 6 November 2021).
  35. Han, W.; Meehl, G.A.; Rajagopalan, B.; Fasullo, J.T.; Hu, A.; Lin, J.; Large, W.G.; Wang, J.-W.; Quan, X.-W.; Trenary, L.L.; et al. Patterns of Indian Ocean sea-level change in a warming climate. Nat. Geosci. 2010, 3, 546–550. [Google Scholar] [CrossRef]
  36. Dawoud, M.A.; Al Mulla, M.M. Environmental Impacts of Seawater Desalination: Arabian Gulf Case Study. Int. J. Environ. Sustain. 2012, 1, 22–37. [Google Scholar] [CrossRef]
  37. Pendleton, E.A.; Barras, J.A.; Williams, S.J.; Twichell, D.C. Coastal vulnerability assessment of the Northern Gulf of Mexico to sea-level rise and coastal change. In Vulnerable U.S. Shorelines and Coasts: Select Assessments; US Geological Survey: Reston, VA, USA, 2012; pp. 95–125. [Google Scholar] [CrossRef]
  38. Al-Hinai, G.A.; Brook, S.S. Geomorphology of Qatar: A Comprehensive Overview. In Remote Sensing of Geomorphology; Springer: Berlin/Heidelberg, Germany, 2017; pp. 53–73. [Google Scholar]
  39. Bilal, H.; Govindan, R.; Zekri, S.; Al-Maktoumi, A.; Rajabi, M.M.; Triki, C. Geospatial techniques for identifying optimal rainwater harvesting sites to enhance agricultural productivity in hyper arid areas. Agric. Water Manag. 2025, 318, 109696. [Google Scholar] [CrossRef]
  40. Ministry of Development Planning and Statistics. Available online: https://www.mdps.gov.qa/en/statistics1/StatisticsSite/Pages/default.aspx (accessed on 24 October 2024).
  41. Gornitz, V.M.; White, T.W.; Daniels, R.C. A Coastal Hazards Data Base for the US East Coast; Carbon Dioxide Information; Oak Ridge National Lab.: Oak Ridge, TN, USA, 1992. [Google Scholar]
  42. Gornitz, V.M.; Beaty, T.W.; Daniels, R.C. A Coastal Hazards Data Base for the US West Coast. Oak Ridge, Tennessee: National Technical Information Service; Environmental Sciences Division Publication No. 4590, Report ORNL/CDIAC-81, NDP-043C.; Oak Ridge National Lab.: Oak Ridge, TN, USA, 1997. [Google Scholar]
  43. El-Hattab, M.M. Improving Coastal Vulnerability Index of the Nile Delta Coastal Zone, Egypt. J. Earth Sci. Clim. Change 2015, 6, 293. [Google Scholar] [CrossRef]
  44. Li, X.; Zhou, Y.; Tian, B.; Kuang, R.; Wang, L. GIS-based methodology for erosion risk assessment of the muddy coast in the Yangtze Delta. Ocean Coast. Manag. 2015, 108, 97–108. [Google Scholar] [CrossRef]
  45. Batzakis, D.-V.; Karymbalis, E.; Tsanakas, K. Assessing Coastal Vulnerability to Climate Change-Induced Hazards in the Eastern Mediterranean: A Comparative Review of Methodological Approaches; Elsevier Inc.: Amsterdam, The Netherlands, 2024. [Google Scholar] [CrossRef]
  46. Rivers, J.M.; Larson, K.P. The Cenozoic kinematics of Qatar: Evidence for high-angle faulting along the Dukhan ‘anticline’. Mar. Pet. Geol. 2018, 92, 953–961. [Google Scholar] [CrossRef]
  47. Aloui, D.; Benkraiem, R.; Guesmi, K.; Mzoughi, H. Managing natural resource prices in a geopolitical risk environment. Resour. Policy 2023, 83, 103628. [Google Scholar] [CrossRef]
  48. Qatar. Planning and Statistics Authority, Main Results of the General Census of Population, Housing and Establishments. 2020. Available online: https://www.npc.qa/ar/pages/default.aspxReleases/General/Census/Census_2020_Res_Summary_En.pdf (accessed on 24 October 2024).
  49. Qatar Statistics Authority. Window on Economic Statistics of Qatar; National Planning Council: Doha, Qatar, 2023; Available online: https://www.npc.qa/en/statistics/Statistical%20Releases/Economic/General%20Economic%20Statistics/windowonstatistics/Windows_47th_Issue_Q4_2023_AE.pdf (accessed on 24 October 2024).
  50. Aloui, S.; Zghibi, A.; Mazzoni, A.; Elomri, A.; Triki, C. Groundwater resources in Qatar: A comprehensive review and informative recommendations for research, governance, and management in support of sustainability. J. Hydrol. Reg. Stud. 2023, 50, 101564. [Google Scholar] [CrossRef]
  51. Bilal, H.; Govindan, R.; Zekri, S.; Al-Maktoumi, A.; Rajabi, M.M.; Triki, C.; Harrathi, W. Identification of potential managed aquifer recharge sites in hyper-arid environment using GIS and analytical hierarchy process. Appl. Water Sci. 2025, 15, 99. [Google Scholar] [CrossRef]
  52. Emil, M.K.; Sultan, M.; Alakhras, K.; Sataer, G.; Gozi, S.; Al-Marri, M.; Gebremichael, E. Countrywide monitoring of ground deformation using insar time series: A case study from Qatar. Remote Sens. 2021, 13, 702. [Google Scholar] [CrossRef]
  53. Engel, M.; Strohmenger, C.J.; Peis, K.T.; Pint, A.; Brill, D.; Brückner, H.; Eberli, G. High-resolution facies analysis of a coastal sabkha in the eastern Gulf of Salwa (Qatar): A spatio-temporal reconstruction. Sedimentology 2022, 69, 1119–1150. [Google Scholar] [CrossRef]
  54. Carolina, N.; Barzehkar, M.; Parnell, K.; Soomere, T. Incorporating a Machine Learning Approach into an Established Decision Support System for Coastal Vulnerability in the Eastern Baltic Sea. J. Coast. Res. 2024, 113, 58–62. [Google Scholar] [CrossRef]
  55. Koroglu, A.; Ranasinghe, R.; Jiménez, J.A.; Dastgheib, A. Comparison of Coastal Vulnerability Index applications for Barcelona Province. Ocean Coast. Manag. 2019, 178, 104799. [Google Scholar] [CrossRef]
  56. Šimac, Z.; Lončar, N.; Faivre, S. Overview of Coastal Vulnerability Indices with Reference to Physical Characteristics of the Croatian Coast of Istria. Hydrology 2023, 10, 14. [Google Scholar] [CrossRef]
Disclaimer/Publisher’s Note: The statements, opinions and data contained in all publications are solely those of the individual author(s) and contributor(s) and not of MDPI and/or the editor(s). MDPI and/or the editor(s) disclaim responsibility for any injury to people or property resulting from any ideas, methods, instructions or products referred to in the content.

Article Metrics

Citations

Article Access Statistics

Article metric data becomes available approximately 24 hours after publication online.