Abstract
In view of global climate change, studies on long-term changes in Near-Surface Air Temperature (NSAT) in the Brazil region are highly relevant. Climate warming requires the government to develop various adaptation strategies to these changes in order to maintain marine and terrestrial ecosystems in a stable state. Pearson correlation analysis, with significance assessment of the obtained results, was used to analyze NSAT data from 39 weather stations, along with the ERA5 reanalysis dataset and 33 CMIP6 models, for the different SSP scenarios of greenhouse gas emissions in the Brazil region (10° N–40° S; 75–25° W). The increase in NSAT of the Brazil region for 1964–2023 was 0.4 ± 0.2 °C based on meteorological stations and 0.3 ± 0.1 °C based on the ERA5 reanalysis. NSAT by ERA5 data changed little from 1940 to 1970, after which a relatively rapid increase began at a rate of +0.18 °C/10 years. The increase in NSAT for the period 1940–2023 was 0.66 ± 0.17 °C based on the CMIP6 model ensemble. The CMIP6 models show the increase in the average NSAT across the region of 0.75–1.08 °C from 1994–2023 to 2024–2053. The average NSAT in the region under the SSP1-2.6, SSP2-4.5, SSP3-7.0, and SSP5-8.5 scenarios shows an increase of 1.05, 1.89, 2.75, and 3.53 °C by the end of the 21st century, respectively. Moreover, NSAT over land in the study region is increasing faster than over the ocean. According to the CMIP6 ensemble, NSAT over land in the Brazil region increased by an average of 0.6–1.0 °C from 1940–1969 to 1994–2023, while over the ocean near the Brazilian coastline it increased by approximately 0.5 °C. From 1994–2023 to 2070–2099, the projected warming over land is expected to be 1.0–1.4, 1.6–2.6, 2.4–3.8, and 3.2–5.0 °C for the SSP1-2.6, SSP2-4.5, SSP3-7.0, and SSP5-8.5 scenarios, respectively. Over the ocean, however, the estimated warming is substantially smaller—from 0.8 to 2.8 °C, depending on the SSP scenario, which may be explained by the stabilizing role of the ocean.
1. Introduction
Global climate change stands as one of the most pressing challenges confronting humanity today, affecting, in some measure, every nation and population on the planet. Consequently, the Earth sciences are increasingly focused on the imperative of predicting climate changes across timescales ranging from the near-term decades to a century and beyond.
The Intergovernmental Panel on Climate Change (IPCC) has addressed this need by creating an ensemble of Earth System Models (CMIP6 MME) []. This CMIP6 MME incorporates not only the conventional atmospheric and oceanic modules, but also representations of the cryosphere, the uppermost soil layer, and biota. This enables the CMIP6 MME to generate physically robust climate projections spanning decades to centuries, contingent on diverse potential pathways for the socio-economic evolution of human society.
Contemporary climate change is predominantly driven (forced) by anthropogenic emissions of greenhouse gases, with carbon dioxide (CO2) being the primary contributor, as has been presented by climate studies over the last few decades [,,,,]. These emissions absorb outgoing longwave radiation from the Earth, thereby altering the planet’s radiative balance and causing a net accumulation of heat within the climate system. Consequently, CMIP6 MME incorporate anthropogenic radiative forcing, alongside natural drivers of climate variability such as fluctuations in solar irradiance and volcanic activity. This forcing is implemented across a range of emissions scenarios, from low to high, representing plausible trajectories of future climate change as defined by the Shared Socio-economic Pathways (SSPs) [].
Coastal zones represent vulnerable and intricately dynamic systems, facing growing threats from the synergistic effects of anthropogenic pressures and climate change []. The ocean-atmosphere interaction constitutes a critical process underpinning the global climate. The atmosphere exerts influence on the ocean through momentum, heat, and moisture fluxes, while the ocean serves to modulate the climate system by transferring heat and moisture back to the atmosphere. A comprehensive understanding of this interplay and its repercussions is essential for accurate climate change prediction [,,].
Rising air temperatures trigger ecosystem responses, manifested in changes to matter and energy transformation processes—that is, altered ecosystem functioning—leading to the development of various adaptation strategies. Projections of coastal environment states are essential for the effective management of these regions, both as reservoirs of natural resources and as critical zones for human habitation [,,].
The intensification of global warming amplifies the incidence of extreme climatic events, accompanied by pronounced alterations in their extension, frequency, duration, and severity []. Projections indicate that a mean air temperature increase of only 1 °C within the 21st century could lead to a reduction of up to 30% in annual precipitation []. Furthermore, investigations have examined the relationships between monthly mean sea surface temperature anomalies in the tropical Atlantic and associated precipitation anomalies [,,].
Global climate models that couple ocean and atmospheric processes have been devised for the purpose of generating climate projections [,]. Models from the CMIP5 and CMIP6 projects enable the assessment of coupled climate-carbon cycle feedbacks [], and further allow for the evaluation of multi-annual land climate change [].
Within the scope of ongoing research, scientists conduct comparisons of classifications and methodological approaches, which contribute to enhancing the accuracy of derived data and to refining existing models and indices []. Several investigations focus on evaluating global climate models contributing to the CMIP6 initiative [,,,]. In tropical regions, and especially in Central and South America, emphasis is placed on projections of seasonal variations in air temperature [,,].
At the global scale, the IPCC provides comprehensive climate projections articulated within its Sixth Assessment Report []. The SSPs represent climate change scenarios predicated on projected global socio-economic developments through the year 2100 []. This framework enables the utilization of CMIP-derived projections of temperature variability for forecasting alterations in the landscape environment [,].
Climate change analysis using CMIP6 models has been carried out for specific areas within Brazil []. Brazil is located across several climatic zones, namely equatorial, subequatorial, tropical, and subtropical. The northern regions are classified as equatorial, featuring a humid tropical climate. Central Brazil experiences a subequatorial climate marked by distinct wet and dry seasons. The southern parts of the country are subtropical, characterized by mild winters and warm summers. The primary climate types identified are: humid tropical (in the Amazon and coastal areas), tropical monsoon, tropical savanna (between the Amazon and the south), warm steppe climate in the inland eastern regions, and a warm maritime climate in the south. Temperature gradients are significant: average annual temperatures in the northern and central regions are around 28–33 °C, with nighttime temperatures typically above 20 °C. The southern regions exhibit lower temperatures, with summer averages of 20–28 °C and winter temperatures that can descend to 5–10 °C, occasionally below freezing in high-altitude zones.
Meteorological stations in Brazil suitable for analyzing long-term Near-Surface Air Temperature (NSAT) variations are scarce, predominantly found in coastal regions and major urban centers. This spatial bias in instrumentation leads to a pattern in Brazilian research publications, where studies overwhelmingly focus on the most densely populated areas, like the coast and large cities. These works are often regionally specific, linked to the authors’ home universities and institutes, and primarily address the concerns of these developed and populous regions. Sparsely populated natural areas are consequently underrepresented, with the exception of the Amazonian forests.
To overcome the lack of meteorological stations in Brazil, reanalysis and satellite data are often employed. Verification against ERA5 data produced favorable results, confirming their utility in situations where station data is absent []. Simulated precipitation and evapotranspiration (1961–1990) were compared with observed data, showing a strong correlation (R2 = 0.99) [].
The significant growth in publications related to this field in Brazil is also noteworthy, highlighting the topicality of climate change research. A sharp increase in publications during 2019 is associated with record deforestation and Amazonian rainforest fires, incidents that significantly heightened international awareness of climate issues in Brazil [].
A large part of Brazil faces extreme vulnerability to the climate changes forecast for the end of the 21st century. Climate change analysis, using CMIP6 scenarios, has been performed for individual Brazilian states []. Highlighting vulnerabilities is especially critical for the agricultural sector, as Brazil stands as one of the global leaders in agricultural production [].
Several publications focus on reducing carbon emissions to mitigate their impact on the climate, as well as discussing management strategies for implementation and the study of significant urban heat islands [,,,]. Moreover, successful climate governance practices are found in other sectors of public administration, such as municipal climate plans that demonstrate alignment with scientific research [,,].
Research into climatic and atmospheric phenomena is vital for building the foundation upon which all other investigations are based. These studies are fundamental to modeling techniques employed for understanding climate change and analyzing phenomena across larger spatial scales []. A multitude of models exist, each designed for specific climatic indicators and adapted to different global areas []. Among these is the CNRM-Cerfacs Climate Prediction System (C3PS), which specializes in reanalysis and provides seasonal-to-interannual predictions for a broad spectrum of system variables [].
The primary objective of this research is to generate the most robust possible estimation of NSAT variations across the Brazilian region through a comparative analysis of data derived from multiple sources spanning the period of reliable instrumental records. By leveraging the output of CMIP6 models, we seek to elucidate the underlying drivers of observed NSAT changes through the deconvolution of processes operating at diverse scales. Furthermore, utilizing the CMIP6 model ensemble, we intend to analyze projections of future NSAT evolution within the study region extending to the close of the 21st century, contingent upon a range of scenarios concerning global economic trajectories and greenhouse gas emission pathways. An additional task of the study was to conduct a verification of the ERA5 reanalysis data.
2. Materials and Methods
To obtain the most reliable assessment of NSAT (°C) changes in the Brazilian region (10° N–40° S; 75–25° W), data from various sources were used. Primarily, NSAT data from meteorological stations located in the study region were analyzed [] (Figure 1). Unfortunately, the meteorological stations available are unevenly distributed, their time series begin in different years, have gaps, and many of them are quite short. To mitigate these shortcomings, reanalysis data were used, the results of which are tied to the nodes of a regular grid and have no gaps, but have peculiarities of the models used in their production. One of the most modern reanalyses currently available, the European Centre for Medium-Range Weather Forecasts (ECMWF) ERA5, was chosen as the primary source. ERA5 has a fairly high spatial resolution (0.25° × 0.25°) and covers a sufficiently long-spanning time interval (from 1940) for climate change analysis []. Within the scope of this investigation, climate change is defined as variations in NSAT occurring across multi-decadal temporal scales. To explore the association between interannual fluctuations in air temperature, as measured by meteorological stations and represented in the ERA5 reanalysis, correlation coefficients were computed, with statistical significance (p = 0.05) determined through application of Student’s t-test []. Recognizing that ERA5 incorporates information derived from meteorological stations, the NASA MERRA2 reanalysis, which is primarily grounded in satellite-based observations, was employed to independently validate the ERA5 dataset []. It is important to note, however, that the MERRA2 record spans a comparatively limited timeframe (commencing in 1980—coinciding with the advent of initial satellite-derived temperature measurements), thus constraining its utility for long-term climate change studies. Moreover, MERRA2 exhibits a lower spatial resolution (0.5° × 0.625°) than that of ERA5. Complementing these analyses, the NCEP/NCAR Reanalysis dataset was incorporated, characterized by an even coarser spatial resolution (2.5° × 2.5°), but offering a longer temporal coverage, beginning in 1948, and a well-established validation history [].
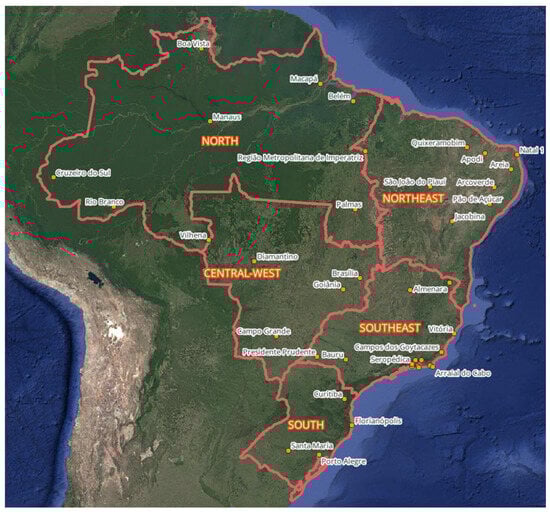
Figure 1.
Location of analyzed meteorological stations in the Brazil region.
To ascertain the drivers behind the observed NSAT variations, we used output from the Historical experiment of 33 global models participating in CMIP6. This ensemble-based methodology was implemented considering findings by [], demonstrating that the ensemble mean calculated across a sufficiently large model set is generally superior to, or at a minimum, equivalent to, the performance of any individual model, irrespective of its perceived skill. The CMIP6 models incorporate diverse parameterizations for representing identical sub-grid-scale processes, with each parameterization deemed equally credible [], precluding the identification of a single, unequivocally optimal model configuration. Within individual simulations of a given CMIP6 model, the phases associated with a particular mode of natural climate variability may exhibit discrepancies both across different realizations and in relation to the empirically derived phases of that mode obtained from observational records [,]. Furthermore, even in instances where these phases demonstrate concordance during the period of instrumental observations, their continued alignment in the future cannot be assured, particularly given the substantial alterations anticipated in the physical properties of the climate system under the influence of global warming. These considerations collectively underscore the advantage of employing an ensemble-based approach as opposed to relying on the output of a singular CMIP6 model, irrespective of its perceived performance.
Given that the periods and phases characterizing specific modes of natural climate variability may vary across different CMIP6 models [], the process of averaging results across a sufficiently large ensemble (exceeding ~30 models) serves to attenuate the influence of natural climate variability, thereby isolating NSAT changes attributable to variations in the external forcing. This external forcing, which represents a common input across all models, is well-characterized for the instrumental observation period under consideration and is explicitly prescribed as a forcing factor within the CMIP6 Historical experiment framework []. These external forcing factors encompass: fluctuations in solar irradiance; eruptions of major volcanoes; and alterations in the atmospheric concentrations of anthropogenic aerosols and greenhouse gases. Capitalizing on the aforementioned characteristics, a comparison between the ensemble-averaged output from the CMIP6 Historical experiment and observational datasets enables the partitioning of influences. Specifically, it allows for the separation of the impact attributable to external forcing, which is manifested in both the model simulations and the observational records, from the impact of modes of natural climate variability, which are evident solely within the observational data and associated reanalyses, but are attenuated within the CMIP6 MME mean.
The global CMIP6 models under consideration are classified as CMIP6 MME, owing to their comprehensive representation of the Earth’s climate system. These models incorporate not only atmospheric and oceanic modules, but also modules simulating the dynamics of the upper soil layer, ice, and vegetation, thereby enabling the generation of projections pertaining to future climate change. These projections are based on the application of varying radiative forcing scenarios (expressed in W/m2) reflecting potential future shifts in atmospheric greenhouse gas concentrations. Within the CMIP6 framework, such model experiments are designated as SSPs, with the nomenclature of each SSP indicating the projected magnitude of radiative forcing by the close of the 21st century []. The present work analyzes the results derived from four specific SSP experiments: SSP1-2.6, SSP2-4.5, SSP3-7.0, and SSP5-8.5, characterized by radiative forcing magnitudes ranging from 2.6 to 8.5 W/m2, respectively. The Historical experiment results span the temporal interval from 1850 to 2014, while the SSP experiments cover the period from 2015 to 2099. Utilizing these datasets, continuous time series of NSAT, spanning the years 1940 to 2099, were constructed for each grid point and for a consistent simulation run across each of the 33 CMIP6 models examined. These synthesized time series served as the basis for comparison against NSAT variations documented in observational data and reanalysis products, as well as for the development of projections forecasting NSAT changes through the culmination of the 21st century.
Monthly mean NSAT data were selected for the analysis, recognizing that monthly temporal resolution is adequate for examining interannual (year-on-year) and longer-term multi-decadal (climatic) variations in NSAT. From the monthly mean NSAT values at each grid point within the analyzed datasets, the average annual NSAT cycle was computed, utilizing the 30-year period from 1940 to 1969 as a baseline reference. This approach is consistent with the World Meteorological Organization’s (WMO) guidelines advocating the use of 30-year temporal intervals for establishing climate normals. Subsequently, monthly NSAT anomalies were derived by subtracting this mean annual cycle from the original nominal NSAT values at each grid point location. These monthly NSAT anomalies were then averaged across each year to generate annual mean NSAT anomalies, which subsequently served as the primary data for the analysis. This transformation from nominal NSAT values to NSAT anomalies contributed to a partial attenuation of systematic errors (biases inherent in the nominal values) arising from the specific characteristics of individual CMIP6 models [].
To evaluate the observed changes in NSAT, averaging was conducted across 30-year intervals: 1940–1969, 1994–2023, 2024–2053, and 2070–2099. Subsequently, differences between these averaged values were computed. The selection of a 30-year averaging period is predicated on its alignment with the WMO’s recommendation to adopt average values spanning 30-year intervals as climate normals, as well as its correspondence to approximately half of the 60–80-year cycle observed in global climate oscillations []. Assessments of NSAT changes were also performed using linear trends, which confirmed the results obtained from the 30-year period differences. The significance of the obtained linear trends was assessed using the Mann–Kendall test (p < 0.05). These linear trend assessments are not used as the main results, however, because the NSAT changes under investigation are non-linear, and also because of the sensitivity of the least squares method to edge values, which are affected by strong interannual NSAT variability.
To analyze the NSAT data, Pearson correlation analysis was conducted to compare the NSAT data from meteorological stations against ERA5 reanalysis data. The significance of the resulting correlation coefficients was determined using Student’s t-test.
3. Results
Meteorological station observations within the Brazilian region predominantly span the period from 2000 to 2023. Multi-year means NSAT values and associated standard deviations for the 2000–2023 period, as derived from meteorological station data and the ERA5 reanalysis, are presented in Table 1 and Figure 2. The highest mean NSAT values were observed in the Northeastern region of Brazil, reaching 28.3 ± 0.5 °C for São João do Piauí meteorological station and 28.1 ± 1.3 °C for the ERA5 reanalysis. Conversely, the lowest mean NSAT values were recorded in the Southern region, registering 17.6 ± 0.4 °C and 17.6 ± 2.4 °C, as indicated by both Curitiba meteorological station data and the ERA5 reanalysis for the period 2000–2023.

Table 1.
Characteristics of NSAT (Ta, °C) data, including mean values and their standard deviations (±σ), derived from meteorological station observations and ERA5 reanalysis for the Brazil region across various observation periods.
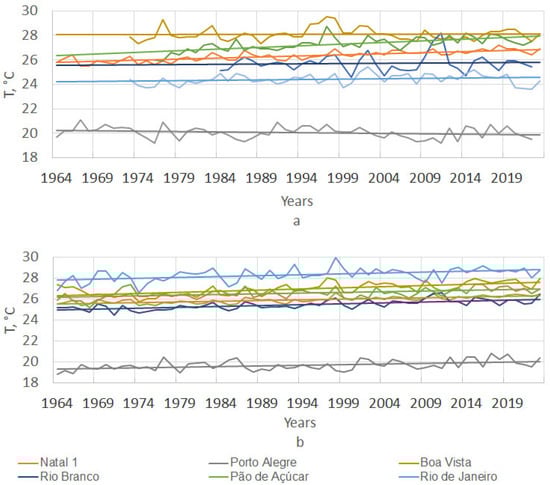
Figure 2.
Interannual variability of NSAT in the Brazil region (a) at meteorological stations for 1962–2023 and (b) from ERA5 reanalysis at the coordinates of the meteorological stations for 1964–2023. Straight lines are linear trends.
A comparison of NSAT data derived from meteorological stations and the ERA5 reanalysis for the period 2000–2023 revealed a strong concordance in both the mean values (Table 1) and their interannual variability patterns across the Brazilian region. Pearson correlation analysis demonstrated a statistically significant positive relationship between NSAT data obtained from the Natal1, Porto Alegre meteorological stations and the ERA5 reanalysis for the period 1964–2023 (r = 0.9, r = 0.4) (Figure 2a,b, Table 2).
Table 2.
Correlation matrix (Pearson (n − 1)): NSAT (Ta, °C) data, derived from meteorological station observations (Ta_Weather station, °C) and ERA5 reanalysis (Ta_ERA5, °C) for the Brazil region for the 1964–2023. Values in bold are different from 0 with a significance level alpha = 0.05.
The meteorological station data exhibited positive trends in NSAT for the period 1964–2023 (Figure 2a). The ERA5 reanalysis revealed positive trends in NSAT at all meteorological station locations over the same period (Figure 2b). The Porto Alegre weather station is an exception, showing a slight decrease in NSAT, in contrast to the ERA5 reanalysis. However, the resulting negative trend was statistically significant. All positive NSAT trends at the weather stations and upon ERA5 reanalysis, as shown in Figure 2a,b, turned out to be statistically significant according to the Mann–Kendall test (p < 0.05). A phenomenon attributed to the specific locations of the stations and the influence of the Brazilian region’s topography.
Thus, differences were identified between the ERA5 reanalysis temperature data at meteorological stations in the southern, northern, and northeastern regions (Table 3). Meteorological stations in the southern and northern regions show insignificant or negative correlations, while high correlations were found between meteorological stations in the northern and northeastern regions. The trends at meteorological stations in the northern and northeastern regions also coincide, with a negative trend observed in the southern region.
Table 3.
Mean NSAT values for different periods and their standard deviations, multi-year change in NSAT (ΔTa ± σ, °C) according to meteorological station data and ERA5 reanalysis in the Brazil region for the specified observation periods.
Table 3 presents a comparison of long-term NSAT change trends across the 30-year periods of 1964–1993 and 1994–2023—quasi-thirty-year periods designated with an asterisk (*)—derived from meteorological station data, the ERA5 reanalysis, and their corresponding increments (ΔTa). Specifically, at Porto Alegre station, NSAT exhibited a decreasing trend concurrently with an increase in interannual variability, characterized by the value of the standard deviation. Conversely, at Natal 1 station NSAT displayed an increasing significant trend (p < 0.05) obtained by the Mann–Kendall test for the 1964–2023 period in association with a decrease in interannual variability. Across the northeastern portion of the Brazilian region (Pão de Açúcar), the data from the meteorological stations indicates that the increase in NSAT is most pronounced (0.7 °C) when comparing the periods of 1994–2023 and 1964–1993. In contrast, the increment in NSAT across southern Brazil (Porto Alegre) can assume negative values (−0.1 °C), indicating a decrease in NSAT on a multi-year timescale, a trend that aligns with the findings from the ERA5 reanalysis, also presented in Table 3. The overall long-term increase in NSAT, as determined from meteorological station data encompassing the entirety of the Brazilian region for the years 1964–2023, is 0.4 ± 0.2 °C, while the corresponding figure derived from the ERA5 reanalysis is 0.3 ± 0.1 °C.
The average NSAT across the Brazilian region, as indicated by ERA5 data, underwent substantial changes between 1940 and 2023, with these changes exhibiting temporal non-uniformity (Figure 3, black line). Specifically, from 1940 until the mid-1970s, NSAT demonstrated only modest variations on multi-decadal timescales, after which a relatively rapid increase commenced, proceeding at a rate of approximately 0.18 °C per decade.
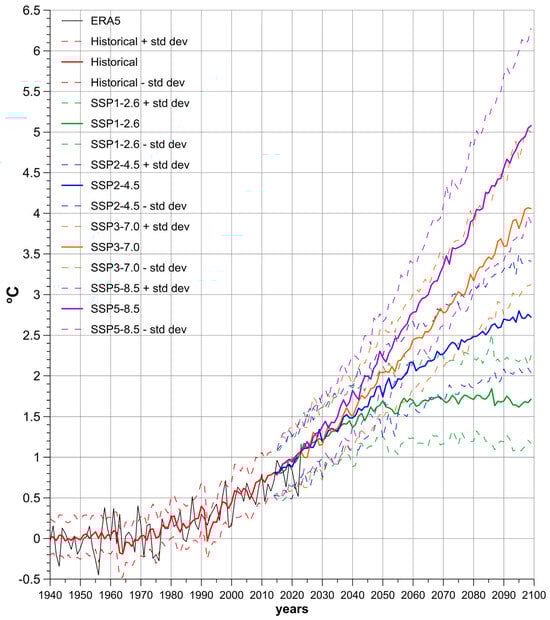
Figure 3.
Graphs of changes in annual anomalies of average NSAT of the Brazilian region (10° N–40° S) × (75–25° W) according to ERA5 data (black) for 1940–2023 and according to the results of CMIP6 model experiments for scenarios: Historical (red) for 1940–2014, SSP1-2.6 (green), SSP2-4.5 (blue), SSP3-7.0 (orange), and SSP5-8.5 (purple) for 2015–2099. The boundaries of the variability ranges of 33 CMIP6 models (standard deviation) are represented by dashed lines.
When averaged over the CMIP6 MME (Figure 3, red line), natural climate variability is suppressed, as evidenced by the root mean square spread of NSAT anomalies (~0.3 °C for the Historical experiment) (Figure 3, dashed lines). Despite differences on interannual scales, in general, the time series of average NSAT from ERA5 data and Historical—SSP experiments for the period 1940–2023 agree with each other on multi-decadal scales (Figure 3), which is also indicated by the high values of Pearson correlations between them (Table 4), thus justifying the consideration of CMIP6 MME-based projections of NSAT changes within the Brazilian region. The correlations between the regional averages at the weather stations also show significant links with the ERA5 reanalysis and the ensemble of CMIP6 models for the period 1964–2023 (Table 4). The totality of scenarios projecting potential future changes in NSAT across the study region indicates a trend toward warming. This warming is evident not only in the CMIP6 MME mean but also within the simulations of individual models. As anticipated, the rate of NSAT increase is positively correlated with elevated CO2 emissions (Figure 3, Table 5). Nevertheless, until approximately 2040, all SSP scenarios show a similar increase in average NSAT, with a difference between 2024–2053 and 1994–2023 of 0.75–1.08 °C depending on the scenario (Table 5). The SSP1-2.6 scenario is predicated on the prompt and substantial curtailment of emissions, with complete net-zero emissions achieved by 2075. This leads to NSAT stabilization in the latter half of the 21st century, both on a global scale [] and specifically within the Brazilian region (Figure 3). The SSP2-4.5 scenario involves a gradual reduction in emissions throughout the 21st century. Under the SSP3-7.0 scenario, emissions increase, doubling by the century’s end, while the SSP5-8.5 scenario projects a tripling of emissions. Concurrently, the projected increase in average NSAT across the Brazilian region between the periods 2070–2099 and 1994–2023 is estimated to be 1.05, 1.89, 2.75, and 3.53 °C, respectively, corresponding to the radiative forcing levels in the SSP scenarios. Individual CMIP6 models yield comparable results (Table 5). It should be noted that individual CMIP6 models do not always correctly reproduce natural modes of climate oscillations (their periods and phases may differ), which is expressed in weak interannual fluctuations of the average CMIP6 MME graphs in Figure 3. Because of this, the influence of such multi-decadal modes of natural climate variability, such as the Interdecadal Pacific Oscillation (IPO), is not taken into account in the NSAT projections for the CMIP6 MME.
Table 4.
Correlation matrix (Pearson (n − 1)): NSAT by averaged data of meteostations (Ta_Ave Weather stations), ERA5 reanalysis, and Historical experiment models, and different scenarios SSP CMIP6 models in the Brazilian region (10° N–40° S) × (75–25° W). Significant correlations are highlighted in bold.
Table 5.
Average NSAT (°C) changes in the Brazilian region (10° N–40° S) × (75–25° W) under various scenarios and the 33 CMIP6 models.
The increase in average NSAT between the periods of 1940–1969 (Figure 4a) and 1994–2023 (Figure 4b) exhibited non-uniformity not only temporally but also spatially (Figure 4c). Specifically, over the continent, there are areas characterized by both a decrease and the most significant increase in NSAT. Conversely, over the ocean along the entire Brazilian coast, only an increase in NSAT is observed, and this increase is distributed more evenly compared to the land surface. For comparative purposes, Figure 4d presents a field analogous to that in Figure 4c, but derived from the results of CMIP6 MME (Historical and SSP2-4.5 experiments). The spatial pattern based on these data corresponds to that obtained from ERA5 reanalysis, except for small-scale details that are not reproduced due to the insufficient spatial resolution of the CMIP6 models. Thus, according to the CMIP6 MME, NSAT increased more strongly over the continent (0.6–1.0 °C) than over the ocean along the Brazilian coastline (~0.5 °C). This similarity justifies the assessment of future changes in NSAT in the study region based on SSP model projections from CMIP6 MME.
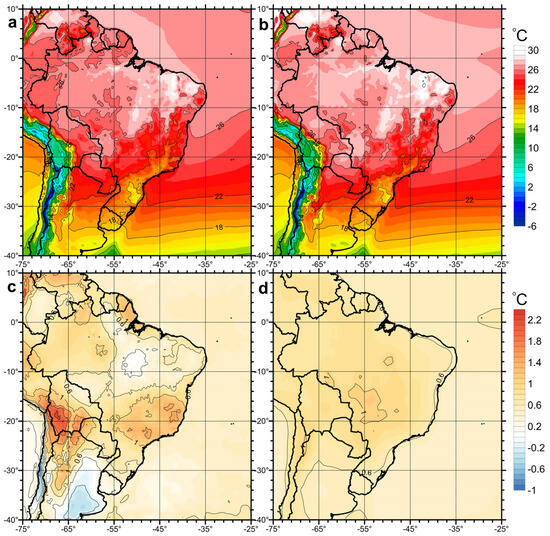
Figure 4.
Spatial distributions of average NSAT: (a) ERA5 reanalysis for 1940–1969, (b) for 1994–2023, (c) difference in NSAT between 1994–2023 and 1940–1969 based on ERA5, (d) average difference in NSAT between 1994–2023 and 1940–1969 as simulated by the 33-member CMIP6 MME (Historical and SSP2-4.5 experiments).
Figure 5 presents fields analogous to those in Figure 4d, but depicting projections of NSAT changes in the Brazilian region through the end of the 21st century. Specifically, these fields represent differences in average NSAT between the periods 2070–2099 and 1994–2023, averaged across the CMIP6 MME for the four considered SSP scenarios. It is important to reiterate that NSAT for the period 1994–2023 is a composite of results from the Historical experiment spanning 1994–2014 and the four SSP scenarios under consideration for 2015–2023. A qualitative correspondence exists between the fields of projected NSAT changes (Figure 5) and a comparable field of NSAT changes, but comparing previous periods (Figure 4d), with NSAT increasing more rapidly over land than over the ocean.
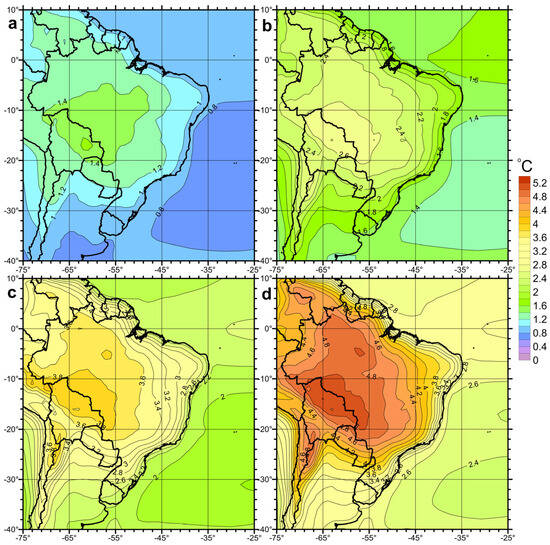
Figure 5.
Spatial patterns of NSAT average change, as simulated by the 33-member CMIP6 ensemble between 1994–2023 and 2070–2099, under the following experiments: Historical and SSP1-2.6 (a), SSP2-4.5 (b), SSP3-7.0 (c), SSP5-8.5 (d).
As anticipated, the projections presented in Figure 5 indicate a substantial warming trend from the period 1994–2023 to 2070–2099. Specifically, NSAT is projected to increase over land by 1.0–1.4 °C, 1.6–2.6 °C, 2.4–3.8 °C, and 3.2–5.0 °C for the SSP1-2.6, SSP2-4.5, SSP3-7.0, and SSP5-8.5 scenarios, respectively. The most pronounced warming within the study region, according to the CMIP6 MME, is projected to occur over land in the central–west and northern region of Brazil (Amazon Region) (Figure 5). Estimates of warming over the ocean near the Brazilian coast are substantially lower in magnitude compared to those over land, ranging from 0.8 to 2.8 °C depending on the SSP scenario. This disparity may be attributed to the stabilizing influence of the ocean. Overall, the projected increase in average NSAT across the Brazilian region by the end of the 21st century, dependent upon the specific SSP scenario, is estimated to range from 1.05 ± 0.39 °C to 3.53 ± 0.83 °C (Table 5). It is important to note that the intermodel variability increases in accordance with elevated levels of radiative forcing and, furthermore, exhibits a non-uniform distribution across the area of the study region. The largest standard deviations of CMIP6 MME are observed in the central region of South America, which coincides with the area where the most significant increase in NSAT is anticipated (Figure 6).
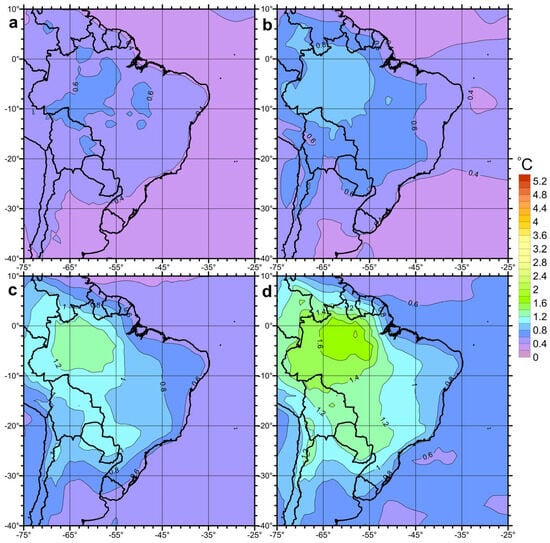
Figure 6.
Spatial patterns of CMIP6 MME standard deviations corresponding to the average NSAT change fields presented in Figure 5: Historical and SSP1-2.6 (a), SSP2-4.5 (b), SSP3-7.0 (c), SSP5-8.5 (d).
In addition, fields representing changes in average NSAT were generated using 33 CMIP6 models for the period between 1994–2023 and 2024–2053, considering the analyzed SSP scenarios (Figure 7). These fields indicate that, over the next 30 years, the average NSAT across the Brazilian region is projected to increase by approximately 0.6–1.4 °C. Specifically, over land within the study region, the increase in NSAT may surpass 1 °C, while over the ocean, it is estimated to be around 0.8 °C. Moreover, a significant disparity in the changes in average NSAT across the Brazilian region within the next 30 years is not observed between the various SSP scenarios (Figure 3 and Figure 7, Table 5). Under all SSP scenarios, the projected by CMIP6 MME warming ranges from 0.75 ± 0.21 °C to 1.08 ± 0.24 °C.
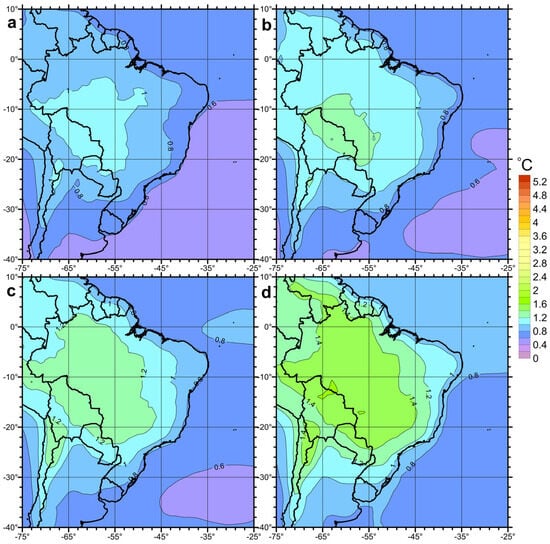
Figure 7.
Spatial patterns of NSAT average change, as simulated by the 33-member CMIP6 ensemble between 1994–2023 and 2024–2053, under the following experiments: Historical and SSP1-2.6 (a), SSP2-4.5 (b), SSP3-7.0 (c), SSP5-8.5 (d).
4. Discussion
Based on the estimates presented in this study, NSAT in the Brazil region, as determined by meteorological station data and ERA5 reanalysis, increased between the periods of 1964–1993 and 1994–2023 by 0.4 ± 0.2 °C and 0.3 ± 0.1 °C, respectively. The increase in NSAT between the periods of 1940–1969 and 1994–2023 was 0.5 ± 0.3 and 0.66 ± 0.17 °C based on the ERA5 reanalysis and the CMIP6 models ensemble, respectively. The results generated from the ensemble of 33 CMIP6 models indicated that, from 1994–2023 to 2070–2099, the projected increase in NSAT would be 1.0–1.4 °C, 1.6–2.6 °C, 2.4–3.8 °C, and 3.2–5.0 °C for the SSP1-2.6, SSP2-4.5, SSP3-7.0, and SSP5-8.5 scenarios. In the Brazil region, changes in NSAT under present-day conditions and those projected for the period 2041–2070 were investigated using the HadCM3 climate model. The model also suggests that the average NSAT in the state will increase by 2070 by a minimum of 1.1–1.4 °C and a maximum of 2.0–3.5 °C [].
This study demonstrates that NSAT increased between the periods 1964–1993 and 1994–2023 across nearly the entirety of the Brazilian region. An exception is observed in the southern part of Brazil, where a minor decrease in temperature of 0.1 °C was documented based on meteorological station data; however, this finding was not corroborated by the reanalysis. The results of the Historical CMIP6 MME experiment indicated an increase in NSAT of 0.66 ± 0.17 °C between the 1940–1969 and 1994–2023 period (Table 5), which aligns with the ERA5 reanalysis data for the same periods (by 0.5 ± 0.3 °C) (Table 3). The projected increase in NSAT for four distinct greenhouse gas emission scenarios (SSP1-2.6, SSP2-4.5, SSP3-7.0, and SSP5-8.5) between the periods 1994–2023 and 2024–2053 was estimated at 0.75 ± 0.21 °C, 0.86 ± 0.22 °C, and 0.92 ± 0.23 °C, respectively. Between the periods 1994–2023 and 2070–2099 the projected increases were 1.05 ± 0.39 °C, 1.89 ± 0.48 °C, 2.75 ± 0.63 °C, and 3.53 ± 0.83 °C for SSP1-2.6, SSP2-4.5, SSP3-7.0, and SSP5-8.5. These findings are supported by NSAT projections derived from individual CMIP6 models spanning the Brazilian region for the period 2021–2040 [].
An analysis of long-term changes and seasonal variability in NSAT across South America throughout the twenty-first century, employing an ensemble of 22 models from the CMIP6 project, was conducted in []. The study highlights the dependence of these results on the socio-economic pathway assumed for each country (SSP1-2.6, SSP2-4.5, and SSP5-8.5) []. The analysis identified positive trends in all models, with values ranging from 0.45 ± 0.05 to 2.05 ± 0.31 °C within the historical experiment. However, the most substantial trends were observed for the projected periods, with values ranging from 0.9 ± 0.8 to 2.9 ± 0.6 °C (SSP1-2.6), from 1.4 ± 0.9 to 5.3 ± 0.8 °C (SSP2-4.5), and from 4.8 ± 0.6 to 8.8 ± 0.7 °C (SSP5-8.5). Maximum values were noted in Bolivia, Brazil, Paraguay, and Venezuela, while minimum values were found in Argentina and Uruguay, irrespective of the specific SSP scenario considered.
In the context of global air temperature changes, examining climate sensitivity while describing the response of Surface Air Temperature (SAT) to radiative forcing necessitates consideration of feedback within the climate system. This feedback can either amplify or attenuate the temperature response [].
This study establishes that during the period of 1940–1970, NSAT exhibited minimal changes on multi-decadal scales. Subsequently, a relatively rapid increase in NSAT commenced (~0.18 °C/10 years). It is difficult to more accurately determine the moment in the 1970s of the beginning of this increase due to the strong interannual variability of NSAT, some of the local maxima and minima of which are most likely associated with El Niño and La Niña events. For example, the maxima of 1998 (Figure 2a,b) may be associated with strong El Niño events that began a year earlier. The minima of 1976 and 1999 have strong and prolonged La Niña events.
We observed weak multi-decadal changes in average NSAT in the study region in the 1940–1970 period, followed by gradually increasing growth, qualitatively repeating the changes in global NSAT during this period [], and apparently, other values are closely related to them. According to the prevailing theory at present, the primary driver of contemporary global warming is the anthropogenic increase in the concentration of greenhouse gases in the atmosphere []. Moreover, the IPO [], a mode of natural climate variability, may exert influence on multi-decadal changes in NSAT across the Brazilian region.
The suppression of natural climate variability upon ensemble averaging is further substantiated by the reproduction of cooling events in 1963–1964, 1982–1983, and 1992–1993 within the ensemble-averaged NSAT anomalies from the Historical experiment (Figure 3, red line). These cooling periods are attributed to the eruptions of volcanoes Agung, El Chichón, and Pinatubo in 1963, 1982, and 1991, respectively. These volcanic events led to substantial aerosol emissions into the atmosphere and a subsequent decrease in the incoming solar radiation. The impact of volcanic eruptions is incorporated into the Historical experiment as a consistent external radiative forcing applied to all models. Consequently, the aforementioned volcanic eruptions are evident in the averaged values of CMIP6 MME. In contrast, ERA5 data (Figure 3, black line) reveal that these volcano-induced NSAT minima are obscured by significant interannual variability linked to El Niño—Southern Oscillation (ENSO) [,]. This ENSO-related variability is attenuated in the averaged values of CMIP6 MME, thus allowing the influence of volcanic eruptions to be more clearly observed.
Brazil has enacted a National Adaptation Plan, a collaborative effort involving federal, regional, and municipal governments, alongside dedicated environmental institutes. This plan adheres to the guidance of the IPCC and specifically addresses the vulnerabilities of key populations and economic sectors, including agriculture and water resources. The policy’s objective is to diminish the environmental, social, and economic repercussions of climate change, implementing measures for the preservation of biological and aquatic resources. Central to Brazil’s National Adaptation Plan is the Low-Carbon Agriculture Plan (ABC+ Plan), which seeks to adapt agriculture to climate change with a low carbon footprint by encouraging conservation technologies and integrated management of soil, water, and biodiversity. Crucially, successful adaptation depends on scientific backing to delineate new agro-climatic zones and advise on the selection of heat- and drought-resilient crop varieties [].
Heatwaves, droughts, and floods are set to become more severe across Brazil. As land warms at a faster rate than the ocean, more intense temperature gradients are emerging, which can affect atmospheric circulation and the frequency of extreme events []. For agricultural adaptation, the focus is on implementing conservation technologies and integrated systems for managing soil, water, and biodiversity. This strategy aims to bolster the resilience of agroecosystems against droughts and the increased frequency and intensity of precipitation variability driven by warming. The projected droughts in the southern regions and the overall temperature increase necessitate shifts in agro-ecological practices and the adoption of sustainable production models.
Climate warming requires a transformative approach to Brazil’s national adaptation policy. The asynchronous warming of land and ocean, which dictates regional climate patterns, emphasizes the importance of scientifically informed, multi-sectoral planning derived from CMIP6 regional climate projections. Climate change research within Brazil aids in advancing the global comprehension of the climate system, particularly in understanding the ocean’s contribution to climate stabilization and the feedback loops between anthropogenic activities (e.g., deforestation) and climate dynamics. The National Adaptation Plan of Brazil, fortified by scientific data and inter-sectoral collaboration, represents a viable model for other developing countries grappling with climate risks, illustrating that adaptation is feasible given political will and sufficient financial investment [,].
5. Conclusions
An analysis of changes in NSAT within the Brazil region (defined by 10° N–40° S; 75–25° W) was carried out. This analysis involved comparing data from 39 meteorological stations, the ERA5 reanalysis dataset (spanning 1940–2023), and an ensemble of 33 models from the CMIP6 project. The datasets cover the Historical experiment period (1850–2014) and SSP experiments periods (2015–2099) under scenarios SSP1-2.6, SSP2-4.5, SSP3-7.0, and SSP5-8.5. An estimation of potential changes in the average annual NSAT for the Brazilian region up to the year 2099 was conducted. This estimation utilized averaged values from 33 CMIP6 MME, generated under the aforementioned four SSP scenarios, which represent varying levels of anthropogenic radiative forcing (i.e., CO2 emissions resulting from human economic activities). The analysis of long-term climate changes relies on the comparison of NSAT anomalies averaged over 30-year periods.
Average NSAT values peaked at 28.3 ± 0.5 °C and 28.1 ± 1.3 °C in the Amazon River valley region and the central–west part of the Brazil region, respectively. Minimum values of 17.6 ± 0.4 °C and 17.6 ± 2.4 °C were recorded in the southern part of Brazil during the period of 2000–2023, based on weather station data and ERA5 reanalysis, respectively. High Pearson correlations were found between the NSAT values of weather stations in the northern and northeastern regions, while for the southern region, they were insignificant and negative. A high positive correlation was obtained between the average NSAT values from meteorological stations, reanalysis values, and CMIP6 model ensemble values for the whole Brazil region for the period 1964–2023.
The trends between weather stations in the northern and northeastern regions also coincided with a negative trend observed in the southern region. All NSAT trends at the weather stations and via ERA5 reanalysis turned out to be statistically significant according to the Mann–Kendall test (p < 0.05). An increase in NSAT was observed across the entire Brazil region from 1964 to 2023, amounting to 0.4 ± 0.2 °C according to meteorological station data and 0.3 ± 0.1 °C according to ERA5 reanalysis.
Over multi-decadal scales, NSAT exhibited weak changes between 1940 and 1970, followed by a relatively rapid increase at a rate of approximately 0.18 °C per decade. The NSAT peaks observed in 1987 and 1998 might be associated with strong El Niño events that commenced the preceding year, while the minima in 1976 and 1999 could be linked to strong and persistent La Niña events. The reductions in NSAT during the 1963–1964, 1982–1983, and 1992–1993 periods are attributed to the eruptions of volcanoes, namely Mount Agung, El Chichón, and Mount Pinatubo. ERA5 reanalysis data indicate that between the periods 1940–1969 and 1994–2023, the average NSAT in the region increased by 0.5 ± 0.3 °C. CMIP6 MME analysis provided comparable average NSAT increase rates (0.66 ± 0.17 °C), thereby validating the application of the projected estimates in this study. SSP scenarios encompassing weak, moderate, and significant radiative forcing (due to anthropogenic CO2 emissions) yield similar outcomes, projecting an increase in average regional NSAT of 0.75–1.08 °C from 1994–2023 to 2024–2053. Conversely, by the close of the 21st century, the average NSAT in the region is projected to rise by 1.05, 1.89, 2.75, and 3.53 °C, corresponding to the specified changes in atmospheric greenhouse gas concentrations outlined in the SSP1-2.6, SSP2-4.5, SSP3-7.0, and SSP5-8.5 scenarios.
This study indicates that NSAT over continental areas experiences a more rapid increase compared to oceanic regions. Specifically, the CMIP6 MME reveal that NSAT in the study territory rose by an average of 0.6–1.0 °C between 1940–1969 and 1994–2023, whereas over the ocean, the increase was approximately 0.5 °C. Projecting forward from 1994–2023 to 2070–2099, land warming is anticipated to range from 1.0–1.4 °C for SSP1-2.6 (characterized by rapid emission reductions), 1.6–2.6 °C for SSP2-4.5 (with gradual emission reductions), 2.4–3.8 °C for SSP3-7.0 (involving a doubling of emissions by century’s end), and 3.2–5.0 °C for SSP5-8.5 (featuring a tripling of emissions by century’s end). In contrast, NSAT warming estimates over the ocean exhibit considerably lower magnitudes, ranging from 0.8 to 2.8 °C depending on the SSP scenario, a phenomenon likely attributable to the ocean’s moderating influence. These projections can serve as a valuable initial approximation for characterizing the future state of the region’s climate system. Furthermore, the potential influence of natural climate processes, such as the IPO and ENSO, is not explicitly considered in this analysis due to their inherent suppression during the ensemble averaging process of the CMIP6 MME.
Author Contributions
Conceptualization, I.S., S.K. and T.G.; methodology, I.S. and S.K.; software, I.S.; validation, I.S., S.K., M.S., T.G. and F.M.; formal analysis, I.S., S.K., M.S., T.G., R.G., F.M., F.L.P.K. and O.M.R.; investigation, I.S., S.K., M.S., T.G., R.G., F.M., F.L.P.K. and O.M.R.; resources, I.S., M.S., F.M., F.L.P.K. and O.M.R.; data curation, I.S., M.S., R.G. and S.K.; writing—original draft preparation, I.S., S.K., M.S., T.G., R.G. and F.L.P.K.; writing—review and editing, I.S., S.K., T.G., F.M. and O.M.R.; visualization, I.S., S.K., R.G., F.M. and O.M.R.; supervision, T.G. and F.L.P.K.; project administration, T.G. and F.L.P.K.; funding acquisition, T.G. and F.L.P.K. All authors have read and agreed to the published version of the manuscript.
Funding
This research was funded by the MSHE under project No. 075-15-2024-657 and CNPq under project No. 440048/2024-9.
Data Availability Statement
Dataset available on request from the authors.
Conflicts of Interest
The authors declare no conflicts of interest. The funders had no role in the design of the study; in the collection, analyses, or interpretation of data; in the writing of the manuscript; or in the decision to publish the results.
Abbreviations
The following abbreviations are used in this manuscript:
| CMIP6 | Coupled Model Intercomparison Project phase 6 |
| ECMWF | European Centre for Medium-Range Weather Forecasts |
| ENSO | El Niño—Southern Oscillation |
| IPCC | Intergovernmental Panel on Climate Change |
| IPO | Interdecadal Pacific Oscillation |
| NSAT | Near-Surface Air Temperature |
| SSPs | Shared Socio-economic Pathways |
| WMO | World Meteorological Organization |
References
- Intergovernmental Panel on Climate Change. Climate Change 2023: Synthesis Report. Contribution of Working Groups I, II and III to the Sixth Assessment Report of the Intergovernmental Panel on Climate Change; Core Writing Team, Lee, H., Romero, J., Eds.; IPCC: Geneva, Switzerland, 2023; pp. 35–115. [Google Scholar] [CrossRef]
- Santer, B.D.; Taylor, K.E.; Wigley, T.M.L.; Johns, T.C.; Jones, P.D.; Karoly, D.J.; Mitchell, J.F.B.; Oort, A.H.; Penner, J.E.; Ramaswamy, V.; et al. A search for human influences on the thermal structure of the atmosphere. Nature 1996, 382, 39–46. [Google Scholar] [CrossRef]
- Stott, P.A.; Tett, S.F.B.; Jones, G.S.; Allen, M.R.; Mitchell, J.F.B.; Jenkins, G.J. External control of 20th century temperature by natural and anthropogenic forcings. Science 2000, 290, 2133–2137. [Google Scholar] [CrossRef] [PubMed]
- Hegerl, G.C.; Zwiers, F.W. Use of models in detection and attribution of climate change. Wiley Interdiscip. Rev. Clim. Change 2011, 2, 570–591. [Google Scholar] [CrossRef]
- Gillett, N.P.; Kirchmeier-Young, M.; Ribes, A.; Shiogama, H.; Hegerl, G.C.; Knutti, R.; Gastineau, G.; John, J.G.; Li, L.; Nazarenko, L.; et al. Constraining human contributions to observed warming since the pre-industrial period. Nat. Clim. Change 2021, 11, 207–212. [Google Scholar] [CrossRef]
- Intergovernmental Panel on Climate Change. Climate Change 2021: The Physical Science Basis. Contribution of Working Group I to the Sixth Assessment Report of the Intergovernmental Panel on Climate Change; Masson-Delmotte, V., Zhai, P., Pirani, A., Conners, S.L., Péan, C., Berger, S., Caud, N., Chen, Y., Goldfarb, L., Gomis, M.I., et al., Eds.; Cambridge University Press: Cambridge, UK, 2021. [Google Scholar] [CrossRef]
- Riahi, K.; van Vuuren, D.P.; Kriegler, E.; Edmonds, J.; O’Neill, B.C.; Fujimori, S.; Bauer, N.; Calvin, K.; Dellink, R.; Fricko, O.; et al. The Shared Socioeconomic Pathways and their energy, land use, and greenhouse gas emissions implications: An overview. Glob. Environ. Change 2017, 42, 153–168. [Google Scholar] [CrossRef]
- Almar, R.; Boucharel, J.; Graffin, M.; Ondoa Abessolo, G.; Thoumyre, G.; Papa, F.; Ranasinghe, R.; Montano, J.; Bergsma, E.W.J.; Baba, M.W.; et al. Influence of El Niño on the variability of global shoreline position. Nat. Commun. 2023, 14, 3133. [Google Scholar] [CrossRef]
- Chelton, D.B.; Xie, S.P. Coupled ocean-atmosphere interaction at oceanic mesoscales. Oceanography 2010, 23, 52–69. [Google Scholar] [CrossRef]
- Miller, A.; Collins, M.; Gualdi, S.; Jensen, T.; Misra, V.; Pezzi, L.; Pierce, D.; Putrasahan, D.; Seo, H.; Tseng, Y.-H. Coupled ocean–atmosphere modeling and predictions. J. Mar. Res. 2017, 75, 361–402. [Google Scholar] [CrossRef]
- Xue, P.; Malanotte-Rizzoli, P.; Wei, J.; Eltahir, E.A.B. Coupled Ocean-Atmosphere Modeling Over the Maritime Continent: A Review. J. Geophys. Res. Oceans 2020, 125, e2019JC014978. [Google Scholar] [CrossRef]
- Bhardwaj, R.K. Application of GIS technology for Coastal Zone Management: A hydrographer perspective. Geospat. World 2009, 211–277. [Google Scholar]
- Fedra, K.; Feoli, E. GIS technology and spatial analysis in coastal zone management. EEZ Technol. 1998, 3, 171–179. [Google Scholar]
- Mummery, J. Available data, datasets and derived information to support coastal hazard assessment and adaptation planning. In Coast Adapt Information Manual 3; National Climate Change Adaptation Research Facility NCCARF, Griffith University: Southport, Australia, 2016; p. 66. [Google Scholar]
- Dantas, L.; dos Santos, C.A.C.; Santos, C.A.G.; Martins, E.; Alves, L.M. Future Changes in Temperature and Precipitation over Northeastern Brazil by CMIP6 Model. Water 2022, 14, 4118. [Google Scholar] [CrossRef]
- Moura, A.D.; Shukla, J. On the dynamics of droughts in northeast Brazil: Observations, theory and numerical experiments with a general circulation model. J. Atmos. Sci. 1981, 38, 2653–2675. [Google Scholar] [CrossRef]
- Turner, K.J.; Burls, N.J.; von Brandis, A.; Lübbecke, J.; Claus, M. Seasonality in the relationship between equatorial-mean heat content and interannual eastern equatorial Atlantic sea surface temperature variability. Clim. Dyn. 2022, 59, 61–75. [Google Scholar] [CrossRef]
- Lian, Y.; Zheng, J.; Li, Y.; Wang, C.; Li, X. Record-breaking rainfall in the northern Amazon in spring 2022 tied to the Pacific and Atlantic sea surface temperatures. Ocean-Land-Atmos. Res. 2024, 3, 62. [Google Scholar] [CrossRef]
- Salas y Melia, D.; Sanchez, E.; Decharme, B.; Fernandez, E.; Cassou, C.; Chevallier, M.; Geoffroy, O.; Senesi, S.; Voldoire, A. Contributing to CMIP5 with CNRM-CM5: Model evaluation and simulated climate future climate change. In Proceedings of the AGU Fall Meeting Abstracts, San Francisco, CA, USA, 5–9 December 2011; p. 881. [Google Scholar]
- Saint-Martin, D.; Geoffroy, O.; Voldoire, A.; Cattiaux, J.; Brient, F.; Chauvin, F.; Chevallier, M.; Colin, J.; Decharme, B.; Delire, C.; et al. Tracking Changes in Climate Sensitivity in CNRM Climate Models. J. Adv. Model. Earth Syst. 2021, 13, e2020MS002190. [Google Scholar] [CrossRef]
- Lovato, T.; Peano, D.; Butenschön, M.; Materia, S.; Iovino, D.; Scoccimarro, E.; Fogli, P.G.; Cherchi, A.; Bellucci, A.; Gualdi, S.; et al. CMIP6 simulations with the CMCC Earth System Model (CMCC-ESM2). J. Adv. Model. Earth Syst. 2022, 14, e2021MS002814. [Google Scholar] [CrossRef]
- Nicolì, D.; Bellucci, A.; Ruggieri, P.; Athanasiadis, P.; Materia, S.; Peano, D.; Fedele, G.; Hénin, R.; Gualdi, S. The Euro-Mediterranean Center on Climate Change (CMCC) decadal prediction system. Geosci. Model Dev. 2023, 16, 179–197. [Google Scholar] [CrossRef]
- Sales, E.G.S.; Matsunaga, W.K.; Braga, C.C.; Sakamoto, M.S.; Lucena, D.; de Brito, J.I.B. Climate classification for Northeast Brazil using reanalysis data and the Absolute Aridity Index. Rev. Bras. De Geogr. Física 2024, 17, 1478–1500. [Google Scholar] [CrossRef]
- Bustos Usta, D.F.; Teymouri, M.; Chatterjee, U. Projections of temperature changes over South America during the twenty-first century using CMIP6 models. Geo J. 2021, 87, 739–763. [Google Scholar] [CrossRef]
- Díaz, L.B.; Saurral, R.I.; Vera, C.S. Assessment of South America summer rainfall climatology and trends in a set of global climate models large ensembles. Int. J. Climatol. 2021, 41, E59–E77. [Google Scholar] [CrossRef]
- Kim, Y.-H.; Min, S.-K.; Zhang, X.; Sillmann, J.; Sandstad, M. Evaluation of the CMIP6 multi-model ensemble for climate extreme indices. Weather Clim. Extrem. 2020, 29, 100269. [Google Scholar] [CrossRef]
- Francisco, P.R.M.; de Sousa, J.H.S.; Ribeiro, G.N.; Silva, J.N. Projeção Climática da Pluviosidade e Temperatura do ar Da Região Continental Brasileira Entre 2021 a 2040 Simulada por Modelos do CMIP6-SSP126/245/370. Rev. Biol. Ciências Terra 2025, 25, 27–42. [Google Scholar]
- Almazroui, M.; Ashfaq, M.; Islam, M.N.; Rashid, I.U.; Kamil, S.; Abid, M.A.; O’Brien, E.; Ismail, M.; Reboita, M.S.; Sörensson, A.A.; et al. Assessment of CMIP6 Performance and Projected Temperature and Precipitation Changes over South America. Earth Syst. Environ. 2021, 5, 155–183. [Google Scholar] [CrossRef]
- Ortega, G.; Arias, P.O.; Villegas, J.C.; Marquet, P.A.; Nobre, P. Present-day and future climate over central and South America according to CMIP5/CMIP6 models. Int. J. Climatol. 2021, 41, 6713–6735. [Google Scholar] [CrossRef]
- IPCC. Climate Change 2022: Impacts, Adaptation and Vulnerability. In Contribution of Working Group II to the Sixth Assessment Report of the Intergovernmental Panel on Climate Change; Pörtner, H.-O., Roberts, D.C., Tignor, M., Poloczanska, E.S., Mintenbeck, K., Alegría, A., Craig, M., Langsdorf, S., Löschke, S., Möller, V., et al., Eds.; Cambridge University Press: Cambridge, UK; New York, NY, USA, 2022; p. 3056. [Google Scholar] [CrossRef]
- O’Neill, S.; Williams, H.T.P.; Kurz, T.; Wiersma, B.; Boykoff, M. Dominant frames in legacy and social media coverage of the IPCC Fifth Assessment Report. Nat. Clim. Change 2015, 5, 380–385. [Google Scholar] [CrossRef]
- van Vuuren, D.P.; Batlle-Bayer, L.; Chuwah, C.; Ganzeveld, L.; Hazeleger, W.; van den Hurk, B.; van Noije, T.; O’Neill, B.; Strengers, B.J. A comprehensive view on climate change: Coupling of Earth system and integrated assessment models. Environ. Res. Lett. 2012, 7, 024012. [Google Scholar] [CrossRef]
- Aparecido, L.E.O.; de Meneses, K.C.; Lorençone, P.A.; Rolim, G.d.S. Climate Classification by Thornthwaite (1948) Humidity Index in Future Scenarios for Maranhão State, Brazil. Environ. Dev. Sustain. 2022, 25, 855–878. [Google Scholar] [CrossRef]
- Freitas, A.; Carvalho, V.S.B.; Reboita, M.S. Extreme Precipitation Events During the Wet Season of the South America Monsoon: A Historical Analysis over Three Major Brazilian Watersheds. Climate 2024, 12, 188. [Google Scholar] [CrossRef]
- Santos, C.A.M.; Lyra, G.B.; Rodriguez, D.A. Impact of Climate Change on Cassava Yield in Guapimirim, State of Rio de Janeiro, Southeast Brazil. Anu. Inst. Geocienc. 2022, 45, 1–16. [Google Scholar] [CrossRef]
- Chiquetto, J.; Nolasco, M.A. New Insights on Climate Change and Adaptation Research in Brazil: A Bibliometric and Bibliographic Review. Discov. Environ. 2024, 2, 36. [Google Scholar] [CrossRef]
- Borges, R.C.; Brito, R.M.; Imperatriz-Fonseca, V.L.; Giannini, T.C. The Value of Crop Production and Pollination Services in the Eastern Amazon. Neotrop. Entomol. 2020, 49, 545–556. [Google Scholar] [CrossRef]
- Werneck, D.R.; Romero, M.A.B.; Celuppi, M.C.; Gobo, J.P.A. Urban Expansion Coupled with Climate Change: The Scenario of Federal District of Brazil. In Climate Change and Regional Socio-Economic Systems in the Global South; Mishra, M., de Lucena, A.J., Maharaj, B., Eds.; Springer: Singapore, 2024. [Google Scholar] [CrossRef]
- Silva, T.B.d.; Baptista, P.; Silva, C.A.S.; Santos, L. Climate Change Mitigation Policies in the Transportation Sector in Rio de Janeiro, Brazil. Environments 2020, 7, 99. [Google Scholar] [CrossRef]
- Andrade, A.L.C. Governing Climate Change in Brazil—A Governance Gap Analysis of Selected Cases; University of Potsdam: Potsdam, Germany, 2023. [Google Scholar] [CrossRef]
- Serrao-Neumann, S.; Di Giulio, G.; Choy, D.L. When Salient Science Is Not Enough to Advance Climate Change Adaptation: Lessons from Brazil and Australia. Environ. Sci. Policy 2020, 109, 73–82. [Google Scholar] [CrossRef]
- Carvalho, W.K.M.; Silva, A.O.D.; Bon, F.P.; Fernandes, R.A.S. Mudanças climáticas na metrópole paulista: Uma análise de planos diretores e leis urbanísticas. Ambiente Construído 2020, 20, 143–156. [Google Scholar] [CrossRef]
- Sotto, D.; Philippi, A., Jr.; Yigitcanlar, T.; Kamruzzaman, M. Aligning Urban Policy with Climate Action in the Global South: Are Brazilian Cities Considering Climate Emergency in Local Planning Practice? Energies 2019, 12, 3418. [Google Scholar] [CrossRef]
- Lampis, A.; Pavanelli, J.M.M.; Guerrero, A.L.D.V.; Bermann, C. Possibilidades e limites da transição energética: Uma análise à luz da ciência pós-normal. Estud. Avanç. 2021, 35, 183–200. [Google Scholar] [CrossRef]
- Braz, D.F.; Ambrizzi, T.; Da Rocha, R.P.; Algarra, I.; Nieto, R.; Gimeno, L. Assessing the Moisture Transports Associated with Nocturnal Low-Level Jets in Continental South America. Front. Environ. Sci. 2021, 9, 657764. [Google Scholar] [CrossRef]
- Cherchi, A.; Fogli, P.G.; Lovato, T.; Navarra, A. Global Mean Climate and Main Patterns of Variability in the CMCC-CM2 Coupled Model. J. Adv. Model. Earth Syst. 2019, 11, 185–209. [Google Scholar] [CrossRef]
- Gómez, E.S.; Séférian, R.; Batté, L.; Voldoire, A. Description and Evaluation of the CNRM-Cerfacs Climate Prediction System (C3PS). J. Adv. Model. Earth Syst. 2024, 16, e2023MS004193. [Google Scholar] [CrossRef]
- INMET—Instituto Nacional de Meteorologia. (n.d.). Meteorological Stations Map. Available online: https://mapas.inmet.gov.br/ (accessed on 25 April 2025).
- Hersbach, H.; Bell, B.; Berrisford, P.; Hirahara, S.; Horányi, A.; Muñoz-Sabater, J.; Nicolas, J.; Peubey, C.; Radu, R.; Schepers, D.; et al. The ERA5 Global Reanalysis. Q. J. R. Meteorol. Soc. 2020, 146, 1999–2049. [Google Scholar] [CrossRef]
- Müller, P.H.; Neuman, P.; Storm, R. Tafeln der Mathematischen Statistik; VEB Fachbuchverlag: Leipzig, Germany, 1979; p. 274. [Google Scholar]
- Gelaro, R.; McCarty, W.; Suárez, M.J.; Todling, R.; Molod, A.; Takacs, L.; Randles, C.; Darmenov, A.; Bosilovich, M.G.; Reichle, R.; et al. The modern-era retrospective analysis for research and applications, Version 2 (MERRA-2). J. Clim. 2017, 30, 5419–5454. [Google Scholar] [CrossRef]
- Kalnay, E.; Kanamitsu, M.; Kistler, R.; Collins, W.; Deaven, D.; Gandin, L.; Iredell, M.; Saha, S.; White, G.; Woollen, J.; et al. The NCEP/NCAR 40-year reanalysis project. Bull. Amer. Meteor. Soc. 1996, 77, 437–471. [Google Scholar] [CrossRef]
- Reichler, T.; Kim, J. How Well Do Coupled Models Simulate Today’s Climate? Bull. Amer. Meteor. Soc. 2008, 89, 303–312. [Google Scholar] [CrossRef]
- Serykh, I.V.; Sonechkin, D.M. Global El Niño–Southern Oscillation Teleconnections in CMIP6 Models. Atmosphere 2024, 15, 500. [Google Scholar] [CrossRef]
- Serykh, I.V. El Niño–Southern Oscillation Prediction Based on the Global Atmospheric Oscillation in CMIP6 Models. Climate 2025, 13, 25. [Google Scholar] [CrossRef]
- Eyring, V.; Bony, S.; Meehl, G.A.; Senior, C.A.; Stevens, B.; Stouffer, R.J.; Taylor, K.E. Overview of the Coupled Model Intercomparison Project Phase 6 (CMIP6) experimental design and organization. Geosci. Model Dev. 2016, 9, 1937–1958. [Google Scholar] [CrossRef]
- O’Neill, B.C.; Tebaldi, C.; van Vuuren, D.P.; Eyring, V.; Friedlingstein, P.; Hurtt, G.; Knutti, R.; Kriegler, E.; Lamarque, J.-F.; Lowe, J.; et al. The Scenario Model Intercomparison Project (ScenarioMIP) for CMIP6. Geosci. Model Dev. 2016, 9, 3461–3482. [Google Scholar] [CrossRef]
- Lehner, F.; Deser, C.; Maher, N.; Marotzke, J.; Fischer, E.M.; Brunner, L.; Knutti, R.; Hawkins, E. Partitioning climate projection uncertainty with multiple large ensembles and CMIP5/6. Earth Syst. Dynam. 2020, 11, 491–508. [Google Scholar] [CrossRef]
- Pokrovsky, O.M.; Pokrovsky, I.O. Coherence of Fluctuations of Components of the Global Climate System with Slow Fluctuations of Solar Activity according to Ground-Based and Satellite Observations. Izv. Atmos. Ocean. Phys. 2022, 58, 1131–1142. [Google Scholar] [CrossRef]
- Silva, W.L.; Dereczynski, C.P.; Chou, S.C.; Cavalcanti, I.F. de A. Future Changes in Temperature and Precipitation Extremes in the State of Rio de Janeiro (Brazil). Am. J. Clim. Change 2014, 3, 353–365. [Google Scholar] [CrossRef]
- Salinger, M.J.; Renwick, J.A.; Mullan, A.B. Interdecadal Pacific Oscillation and South Pacific Climate. Int. J. Climatol. 2001, 21, 1705–1721. [Google Scholar] [CrossRef]
- Cai, W.; McPhaden, M.J.; Grimm, A.M.; Rodrigues, R.R.; Taschetto, A.S.; Garreaud, R.D.; Dewitte, B.; Poveda, G.; Ham, Y.-G.; Santoso, A.; et al. Climate impacts of the El Niño–Southern Oscillation on South America. Nat. Rev. Earth Environ. 2020, 1, 215–231. [Google Scholar] [CrossRef]
- Gulizia, C.; Pirotte, M.N. Characterization of simulated extreme El Niño events and projected impacts on South American climate extremes by a set of Coupled Model Intercomparison Project Phase 5 global climate models. Int. J. Climatol. 2022, 42, 48–62. [Google Scholar] [CrossRef]
- BRAZIL’S NDC. National Determination to Contribute and Transform. Available online: https://unfccc.int/sites/default/files/2024-11/Brazil_Second%20Nationally%20Determined%20Contribution%20(NDC)_November2024.pdf (accessed on 26 October 2025).
- Climate Crisis: Severe Drought in the Amazon Is Worsened by Deforestation and Fire. Available online: https://www.wwf.org.br/?87020%2FClimate-crisis-severe-drought-in-the-Amazon-is-worsened-by-deforestation-and-fire (accessed on 26 October 2025).
- International Climate Initiative. Building Climate Adaptation Across Brazil: From National to Local Action. Available online: https://www.international-climate-initiative.com/en/iki-media/news/building-climate-adaptation-across-brazil-from-national-to-local-action/ (accessed on 26 October 2025).
- Brazil: National Adaptation Plan to Climate Change—Volume I: General Strategy 2016. Available online: https://www.preventionweb.net/publication/brazil-national-adaptation-plan-climate-change-volume-i-general-strategy-2016 (accessed on 26 October 2025).
Disclaimer/Publisher’s Note: The statements, opinions and data contained in all publications are solely those of the individual author(s) and contributor(s) and not of MDPI and/or the editor(s). MDPI and/or the editor(s) disclaim responsibility for any injury to people or property resulting from any ideas, methods, instructions or products referred to in the content. |
© 2025 by the authors. Licensee MDPI, Basel, Switzerland. This article is an open access article distributed under the terms and conditions of the Creative Commons Attribution (CC BY) license (https://creativecommons.org/licenses/by/4.0/).