Article

Projected Convective Storm Environment in the Australian Region from Two Downscaling Ensemble Systems Under the SRES-A2/RCP8.5 Scenarios

1
School of Emergency Management, Nanjing University of Information Science and Technology, Nanjing 210044, China
2
Climate and Atmospheric Science, NSW Department of Climate Change, Energy, The Environment and Water, Sydney, NSW 2124, Australia
3
Australian Research Council Centre of Excellence for Climate Extremes, University of New South Wales, Sydney, NSW 2052, Australia
4
Australian Research Council Centre of Excellence for 21st Century Weather, University of New South Wales, Sydney, NSW 2052, Australia
5
Climate Change Research Centre, University of New South Wales, Sydney, NSW 2052, Australia
6
Applied Climate Science Pty Ltd., Adelaide, SA 5052, Australia
7
Climate Future Research Group, School of Geography, Planning and Spatial Sciences, University of Tasmania, Hobart, TAS 7005, Australia
*
Authors to whom correspondence should be addressed.
Climate 2025, 13(11), 229; https://doi.org/10.3390/cli13110229
Submission received: 8 October 2025 / Revised: 31 October 2025 / Accepted: 2 November 2025 / Published: 4 November 2025
(This article belongs to the Special Issue Recent Climate Change Impacts in Australia)

Abstract

Local thunderstorms are among the major meteorological hazards in the Australian region. These storms inherently have compound impacts, including hail, flash floods, and wind gusts, and consistently cause some of the highest insured losses. Studies on the climate change impact on local storms face the challenges of unreliable storm climatology and uncertainties in the numerical modeling of physical processes. In this study we have adopted an approach to examining the ingredients of severe storm development based on regional climate simulations. We examined two generations of NARCliM datasets (NSW and Australian Regional Climate Modeling). Projected changes in convective indices for the latter half of the twenty-first century indicate an environment more conducive to thunderstorm development, primarily due to enhanced atmospheric instability, despite a concurrent increase in convective inhibition. A measure that combines the dynamic factor of vertical wind shear further shows that the potential storm days will increase substantially, such as a doubling of days with storms during summer, under the influence of climate change over tropical, eastern, and southeastern Australia. The storm season in a year is also expected to elongate. These projections imply increasing thunderstorm-related hazards in the future, including hail, flood, and high winds.

1. Introduction

Convective storms are one of the most hazardous environmental impacts in Australia. According to the Australian State of the Climate report [1], the intensity of short-duration extreme rainfall events, which are often caused by thunderstorms, has increased by around 10% since 1979 and the daily total rainfall associated with thunderstorms has also increased. Impacts from convective storms are also among the most costly, such as those from hailstorms [2], among other flooding and cyclone events. Based on hail proxy applied to re-analysis data, Raupach et al. [3] estimated that although annual hail-prone days decreased during 1979–2021 over much of Australia, the number of days increased substantially (up to ~40%) over metropolitan areas such as Sydney (southeast Australia) and Perth (southwest Australia), mainly driven by atmospheric instability. Thus, it is critical to have reliable estimates of the future behavior of convective storms under the warming climate conditions.
The climatology of severe thunderstorms, including those that generate hail, in Australia has been reviewed in Allen and Allen [4]. Based on the period of 1979–2012, storms frequently concentrate over tropical Australia (Northern Territory and north Queensland) and extend to almost all the coastal regions of Queensland and eastern New South Wales (NSW). While instability is a key driver of severe storms over tropical Australia, the topography of the Great Dividing Range also plays a critical role in storms over southeast Queensland and northeast NSW. This is especially true when the hot spots of hails are examined, which concentrate at southeast Queensland and the NSW Sydney metropolitan region in the topographical vicinity [5]. Most of the severe storms are warm-season storms with peak activity in late November. There are also the cold-season storms and east-coast lows that often develop over south and southeast Australia when the necessary synoptic drivers, such as cold fronts, pass by. On inter-annual timescale, severe storm activity is known to have a certain degree of correlation with El Niño Southern Oscillation [4]; however, no definite conclusions exist in the literature and severe weather in Australia is well known to be influenced by various modes of climate variability such as the Southern Annular Mode [6,7] and even the far-field Indian Ocean Dipole events [8,9].
Given the small spatial and temporal scale of thunderstorm occurrence, there are different approaches to studying the impact of climate change on storm activity and intensity. First, there are observed variability and trends of storms based on the longest climatology available [10]. With in situ observations, changing storm characteristics can also be analyzed. With advances in numerical models, explicit simulations of storm structure and even impacts are possible from models that can resolve convection [11,12,13]. However, convection-permitting modeling is still very expensive computationally and extensive model validation is necessary before this type of model can be applied to project the various aspects of local storms [14]. Here we adopted the approach similar to Trapp et al. [15], in which the simulated environments from regional climate models (RCMs) are used to indicate whether the frequency of thunderstorms will increase or decrease in a warmed climate, and how the storm distribution may change spatially and temporally. For the Australian region, the projection of storm environments was performed by coarse-resolution global climate models (GCMs) in Allen et al. [16,17]. Recently, Zhu et al. [18] applied downscaled products to estimate future extreme storm activities based on precipitation and surface pressure, rather than atmospheric instability. The high-resolution downscaling products we used are from the New South Wales (NSW) and Australian Regional Climate Modeling (NARCliM) projects [19,20].
Here, we utilized a concept in Trapp et al. [15] that was based on an environmental metric or discriminant that can separate the less-severe and more-severe thunderstorm developments [21] when re-analysis data or model simulations with coarser-than-convection-permitting resolution is analyzed. Such a discriminant consists of a combination of convective available potential energy (CAPE) and low-to-mid-level vertical wind shear (VWS). Allen et al. [22] and Allen and Karoly [23] applied such a discriminant to Australian storms and identified thresholds for severe storms and significant (or extremely) severe storms. In our dynamically downscaled simulations, we identified the annual number of days in which the environment discriminant exceeds the specific thresholds. This is similar to the so-called Number of Days of Severe Storm Environment (NDSEV) in Trapp et al. [15]. We focus on summer, in which convective activities are most severe, while seasonal projections will also be discussed and included in the Supplementary Information.

2. Methods

2.1. The NARCliM Regional Downscaling System

The NARCliM project generates high-resolution climate information and projections for stakeholders, decision-makers, and impact assessment researchers in southeast Australia. The NARCliM project has delivered three generations of downscaled products (NARCliM1.0 and NARCliM1.5, hereafter N1.0 and N1.5, respectively [19,20]) based on the third and fifth Climate Modeling Intercomparison Project (CMIP3 and CMIP5), respectively. The latest generation, NARCliM2.0, which is based on selected global climate models (GCMs) from CMIP6, was just recently released [24]. Thus, we examine climate projections from the first two generations, here serving as the baseline reference to the CMIP6-driven regional climate models (RCMs).
The Weather Research and Forecasting (WRF) model was used as the regional model for downscaling. Extensive experiments were conducted to select a set of three (two) WRF model configurations for downscaling activities in N1.0 (N1.5), with the setting of criteria for model accuracy for the region, and at the same time retaining as much independent information as possible [25,26]. The downscaling from GCMs was conducted for both the COrdinated Regional Downscaling Experiment (CORDEX)-Australasia region and the NARCliM 10 km domain focusing on southeast Australia (Figure 1). The model configurations (including the 30 model levels up to 50 hPa) and physical parameterization schemes of these RCMs can be found in Appendix A.
In this paper, we report results from both the outer and inner domain of NARCliM, with 50 km and 10 km resolution, respectively. We focus on the difference between the projected climate for 2060–2079 (the far-future period) and the simulated climatology for 1990–2009 (the historical period). In N1.0, there is a 12-member ensemble (4 GCMs combined with 3 RCMs), while that for N1.5 is a 6-member ensemble (3 GCMs combined with 2 RCMs). Projection was performed with forcing under the Intergovernmental Panel of Climate Change (IPCC) Special Report on Emission Scenarios (SRESs) scenario A2 for N1.0 [27] and the Representative Concentration Pathway [28] RCP8.5 (high-emission) and RCP4.5 (medium-emission) for N1.5. The SRES-A2 scenario represents a high-emission future consistent with continuous population and economic growth. As RCP8.5 is broadly comparable to SRES A2, we focus on comparing future projections of storm environments between these two high-emission scenarios. A list of these models, details in projections, and previous evaluation of both generations of downscaling can be found in the Supplementary Information, Table S1 and Cheung et al. [29].

2.2. Convective Parameters

We focus on the major factors for convective storm development, which include the lifting condensation level (LCL), level of free convection (LFC), CAPE, and Convective Inhibition (CIN). For CAPE, the most unstable value (known as MUCAPE or MCAPE; see Cheung et al. [29] for a discussion on the algorithm of computation) was identified. Note that CIN is reported as a positive value in this study; therefore, a positive change in CIN indicates a stronger convective inhibition (more negative buoyancy energy).
The convective environment would be most accurately measured by radiosonde soundings [30,31]; however, these are available only at selected stations and at synoptic times. Moreover, although lightning activity and high-intensity rainfall provide more direct measures of convective activity, such datasets were not available within the modeling framework used here (e.g., [10]). Future studies integrating lightning observations or convection-permitting simulations could provide a more complete assessment of convective changes under future climates. On the other hand, this study does not explicitly account for aerosol–cloud interactions, as the regional climate model experiments used here did not include fully interactive aerosol schemes. Aerosols can affect convection through both microphysical and radiative pathways, potentially modifying storm initiation and intensity. Future studies incorporating interactive aerosol–convection processes or convection-permitting simulations coupled with aerosol modules would be valuable to better understand these effects under warming climate conditions.
To assess the spatial and temporal variability of storm-conducive environments, one approach is to apply proximity soundings based on re-analysis datasets [21,22,23]. To obtain even higher spatial resolution, model simulations can be applied to assess the convective storm environment after evaluations and project into the future, which is the approach of the current study. Besides CAPE, which measures the instability of the atmosphere, another critical factor for thunderstorm development is vertical wind shear (VWS) [32]. Many aspects of VWS are relevant to storm development. The magnitude of the 0–6 km or deep-layer VWS (S06) was found to indicate the longevity and organization mode of severe storms. In mesoscale dynamics, VWS is able to separate the major convective updraft and downdraft associated with precipitation, enhance the possible mid-level outflow and sustain the cold pool. If specific storms are considered, such as hail and tornadoes, variations in VWS should be examined. For example, rotational updraft is critical for hailstones to generate [33] and, within this context, directional shear and storm-relative helicity are relevant. Similarly, low-level shear such as that within 0–3 km is also important when modeling hailstorms [34]. Since the general convective environment is the focus of this study rather than the specific forms of storms, we only present the results based on convective indices (CAPE/CIN/LCL/LFC) and S06.
Both CAPE and S06 relate to the severity and sustainability of convection. Accordingly, in the phase-space spanned by these two parameters (more precisely by the log of CAPE and S06), the region with large values of CAPE and S06 would represent the occurrence of severe storms well. A discriminant line is in the following form:
C A P E × S 06 τ = β
in which CAPE and S06 have the units J kg−1 and m s−1, respectively, and the τ and β constants are able to separate the region of higher potential of storm development (when the right-hand side of equation 1 is equal to or larger than the left-hand side, which we term TSTORM). The slope τ adjusts the relative importance of CAPE versus S06. Such an environment discriminant for convective storms was first developed in Brooks et al. [35] for the significant severe thunderstorms in North America based on the National Centre for Environmental Prediction re-analysis. The significant severe thunderstorms refer to those that produced hail at least 5 cm in diameter, wind gusts at least 120 km h−1, or tornadoes of at least Fujita-scale F2 damage. Later, Allen et al. [22] and Allen and Karoly [23] applied this discriminant for storms in Australia and identified the slope τ = 1.67 (1.6 in Brooks et al. [35]). The threshold β depends on what environmental dataset or model analysis to apply and its spatial resolution. Allen et al. [22] analyzed the mesoLAPS model with 12.5 km resolution and identified a value of β over 100,000. With consideration of the overestimation of CAPE in mesoLAPS, Allen and Karoly [23] adjusted this to 68,000 for the significant severe storms in Australia, while a lower value of 25,000 is suitable for severe storms (hail larger than 2 cm, heavy rainfall, and/or wind gust of at least 90 km h−1).

2.3. Threshold Adjustment

The evaluation of N1.0 and N1.5 in Cheung et al. [29] indicated that, over land, both ensembles simulated the climatology of MUCAPE quite well, including its distribution in the 20-year evaluation period. However, S06 has been overestimated in the ensembles. Thus, potential storm days based on a TSTORM value larger than the β thresholds (i.e., 25,000 and 68,000) have also been overestimated in the historical period, which would influence climate projections.
In this study, we apply a simple threshold adjustment method such that the potential storm days in the historical simulations of N1.0 and N1.5 match with those derived from the ERA5/ECMWF re-analysis, which was also the reference dataset in Cheung et al. [29] to derive storm days. The adjustment has been performed for the two ensembles separately, and also for each of the four seasons. Technically, the threshold adjustment process was to modify the values of the two thresholds such that the ratio of land grid points with TSTORM values equal to or larger than the threshold (counted within a season) matches with that derived from the ERA5 re-analysis. The adjusted thresholds are then applied to estimate future potential storm days. Since the TSTORM value in equation 1 represents a nonlinear relationship between MUCAPE and S06, our adjustment preserves such a relationship for future climate projections, instead of performing bias correction separately for each of the convective parameters, which would mean that the simulated storm environment must be re-evaluated against observations.

2.4. Statistical Significance and Model Agreement

The statistical significance of the projected change for each grid cell was calculated using the Mann–Whitney U test with a 95% confidence level. As in Nishant et al. [20], we also identified regions of statistically significant change with model agreement, which assessed the degree of consensus between models on the significance of change. For each grid cell, when 50% or more of the model ensemble (i.e., more than 6 (3) members in N1.0 (N1.5)) shows significant change and at least 80% of those models agree on the direction of change, the difference in that grid cell is considered significant.

3. Results

3.1. Projected Changes in Convective Environments

Future projections of storm environments were calculated as the differences between the future and historical periods for each simulation. Ensemble means for N1.0 and N1.5 were then derived from the 12 simulations in N1.0 and the 6 simulations in N1.5, respectively.
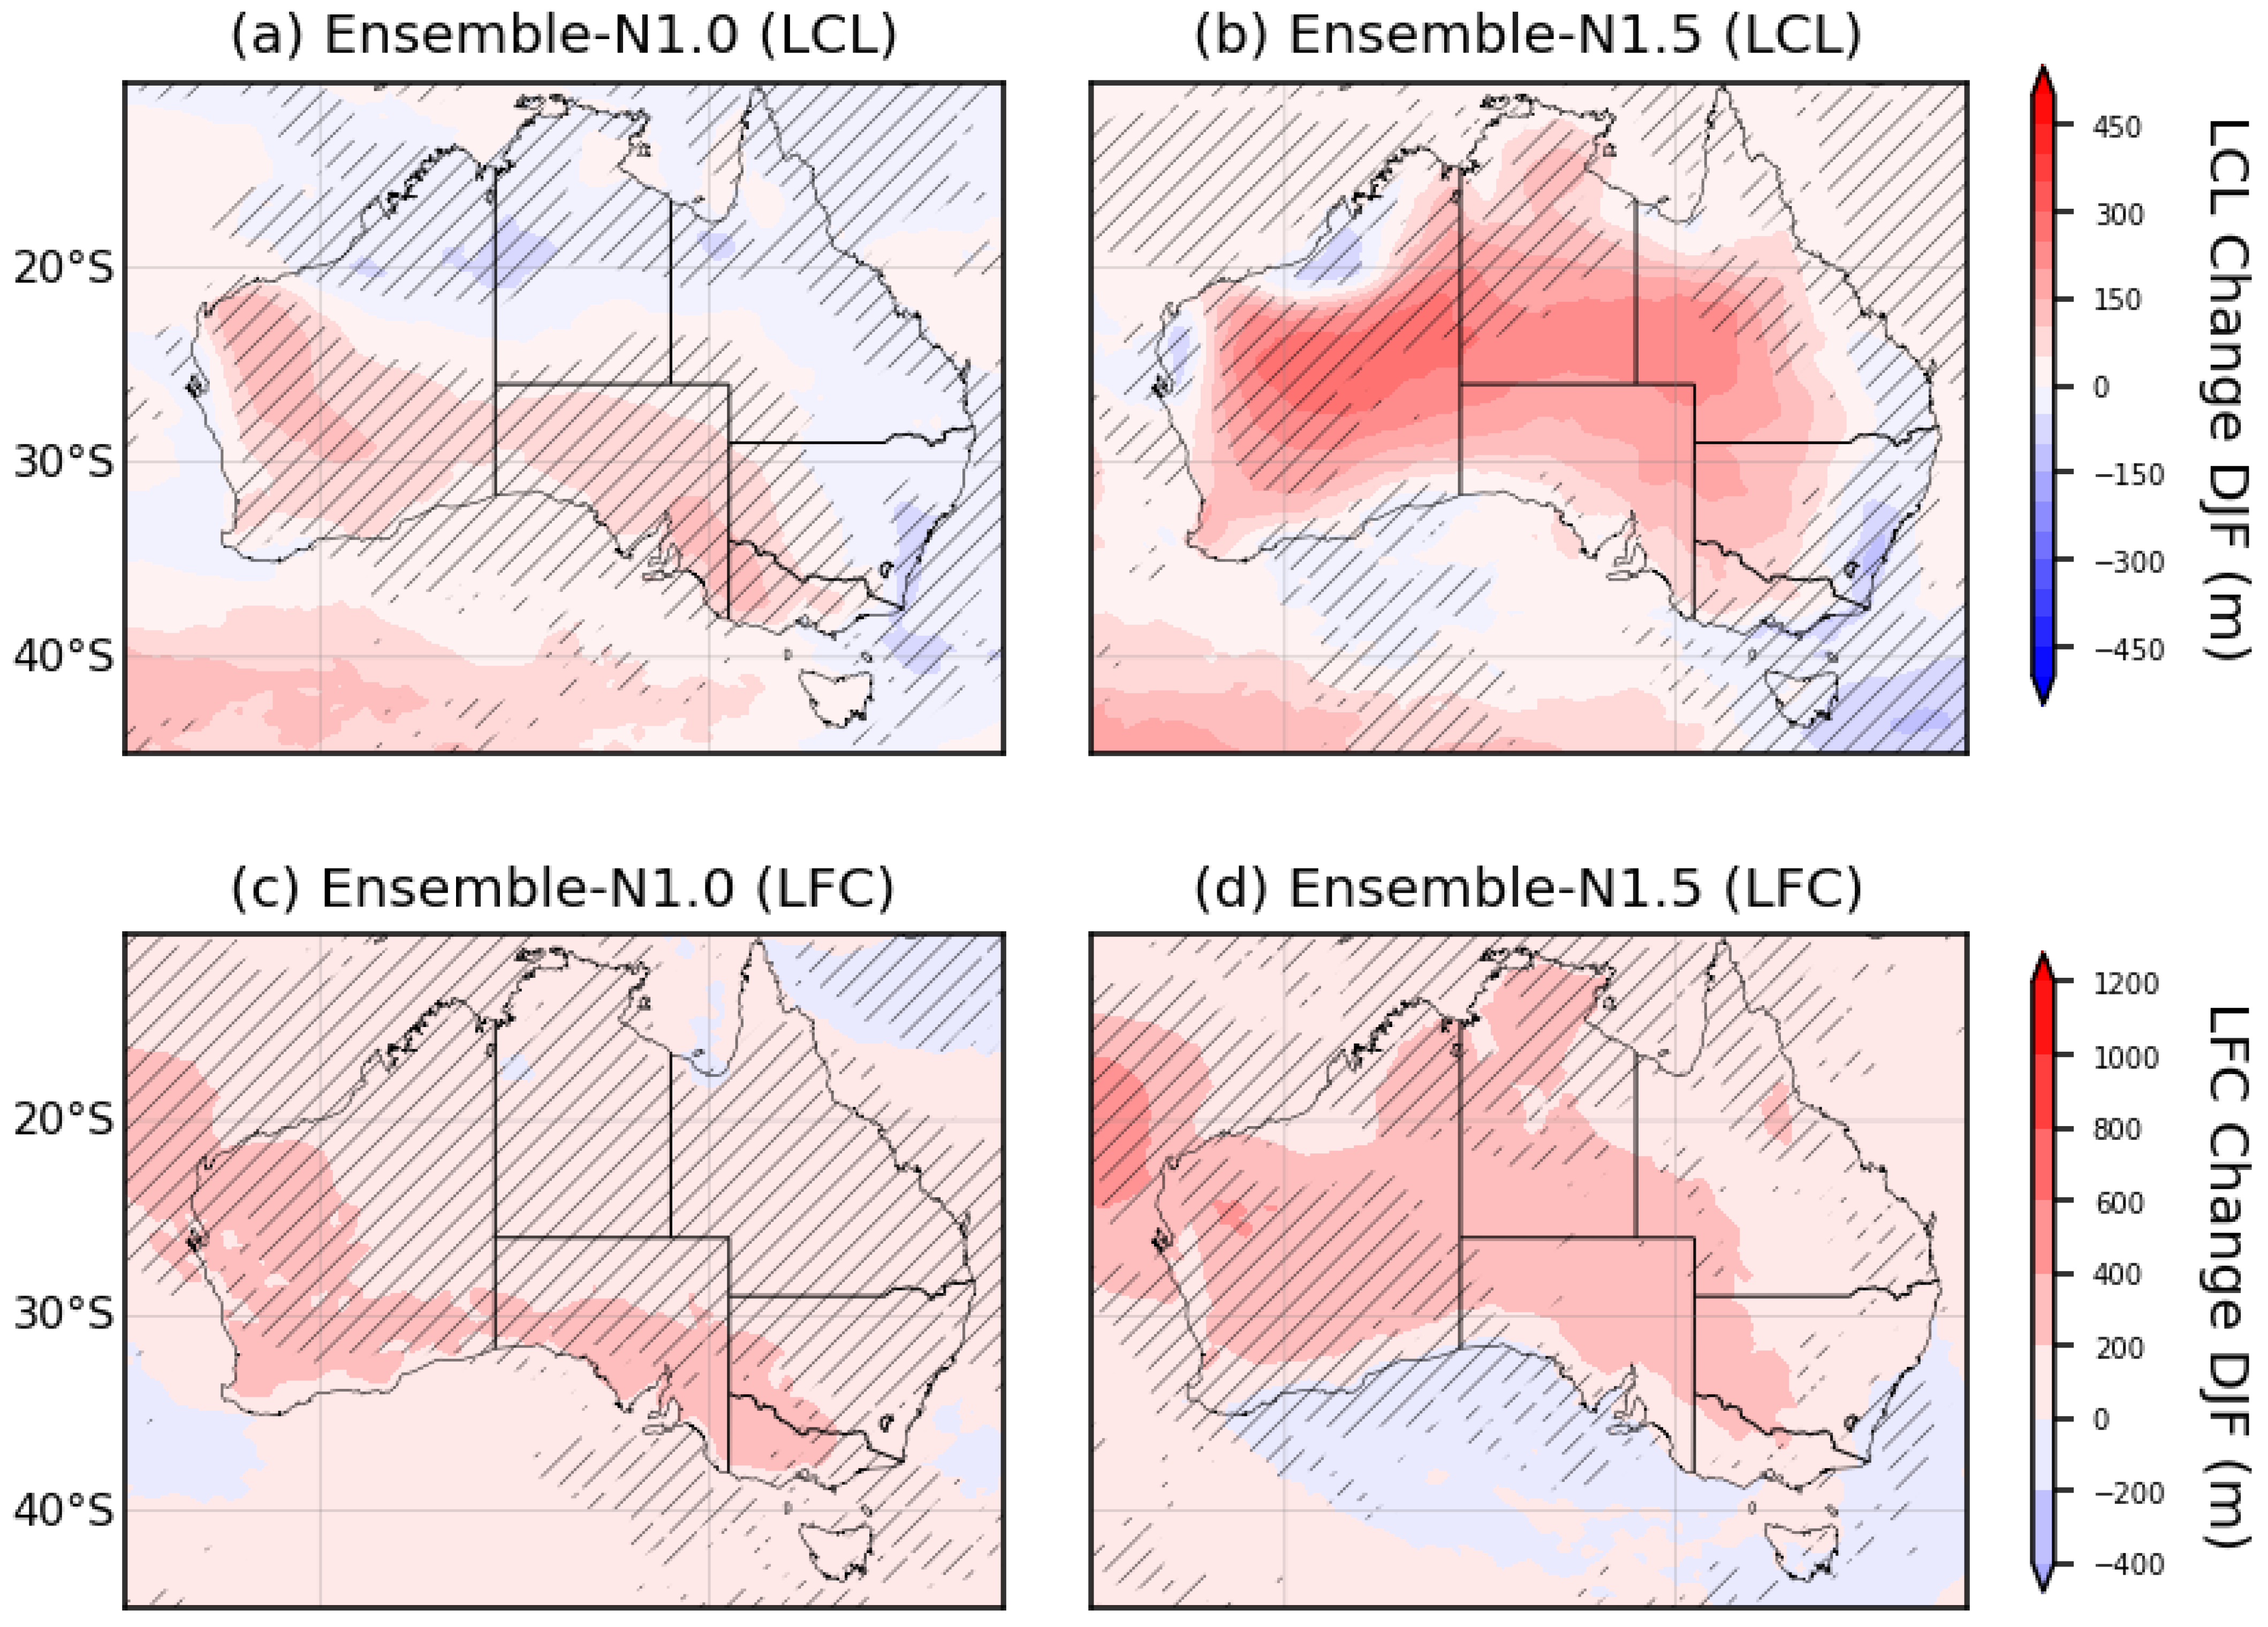
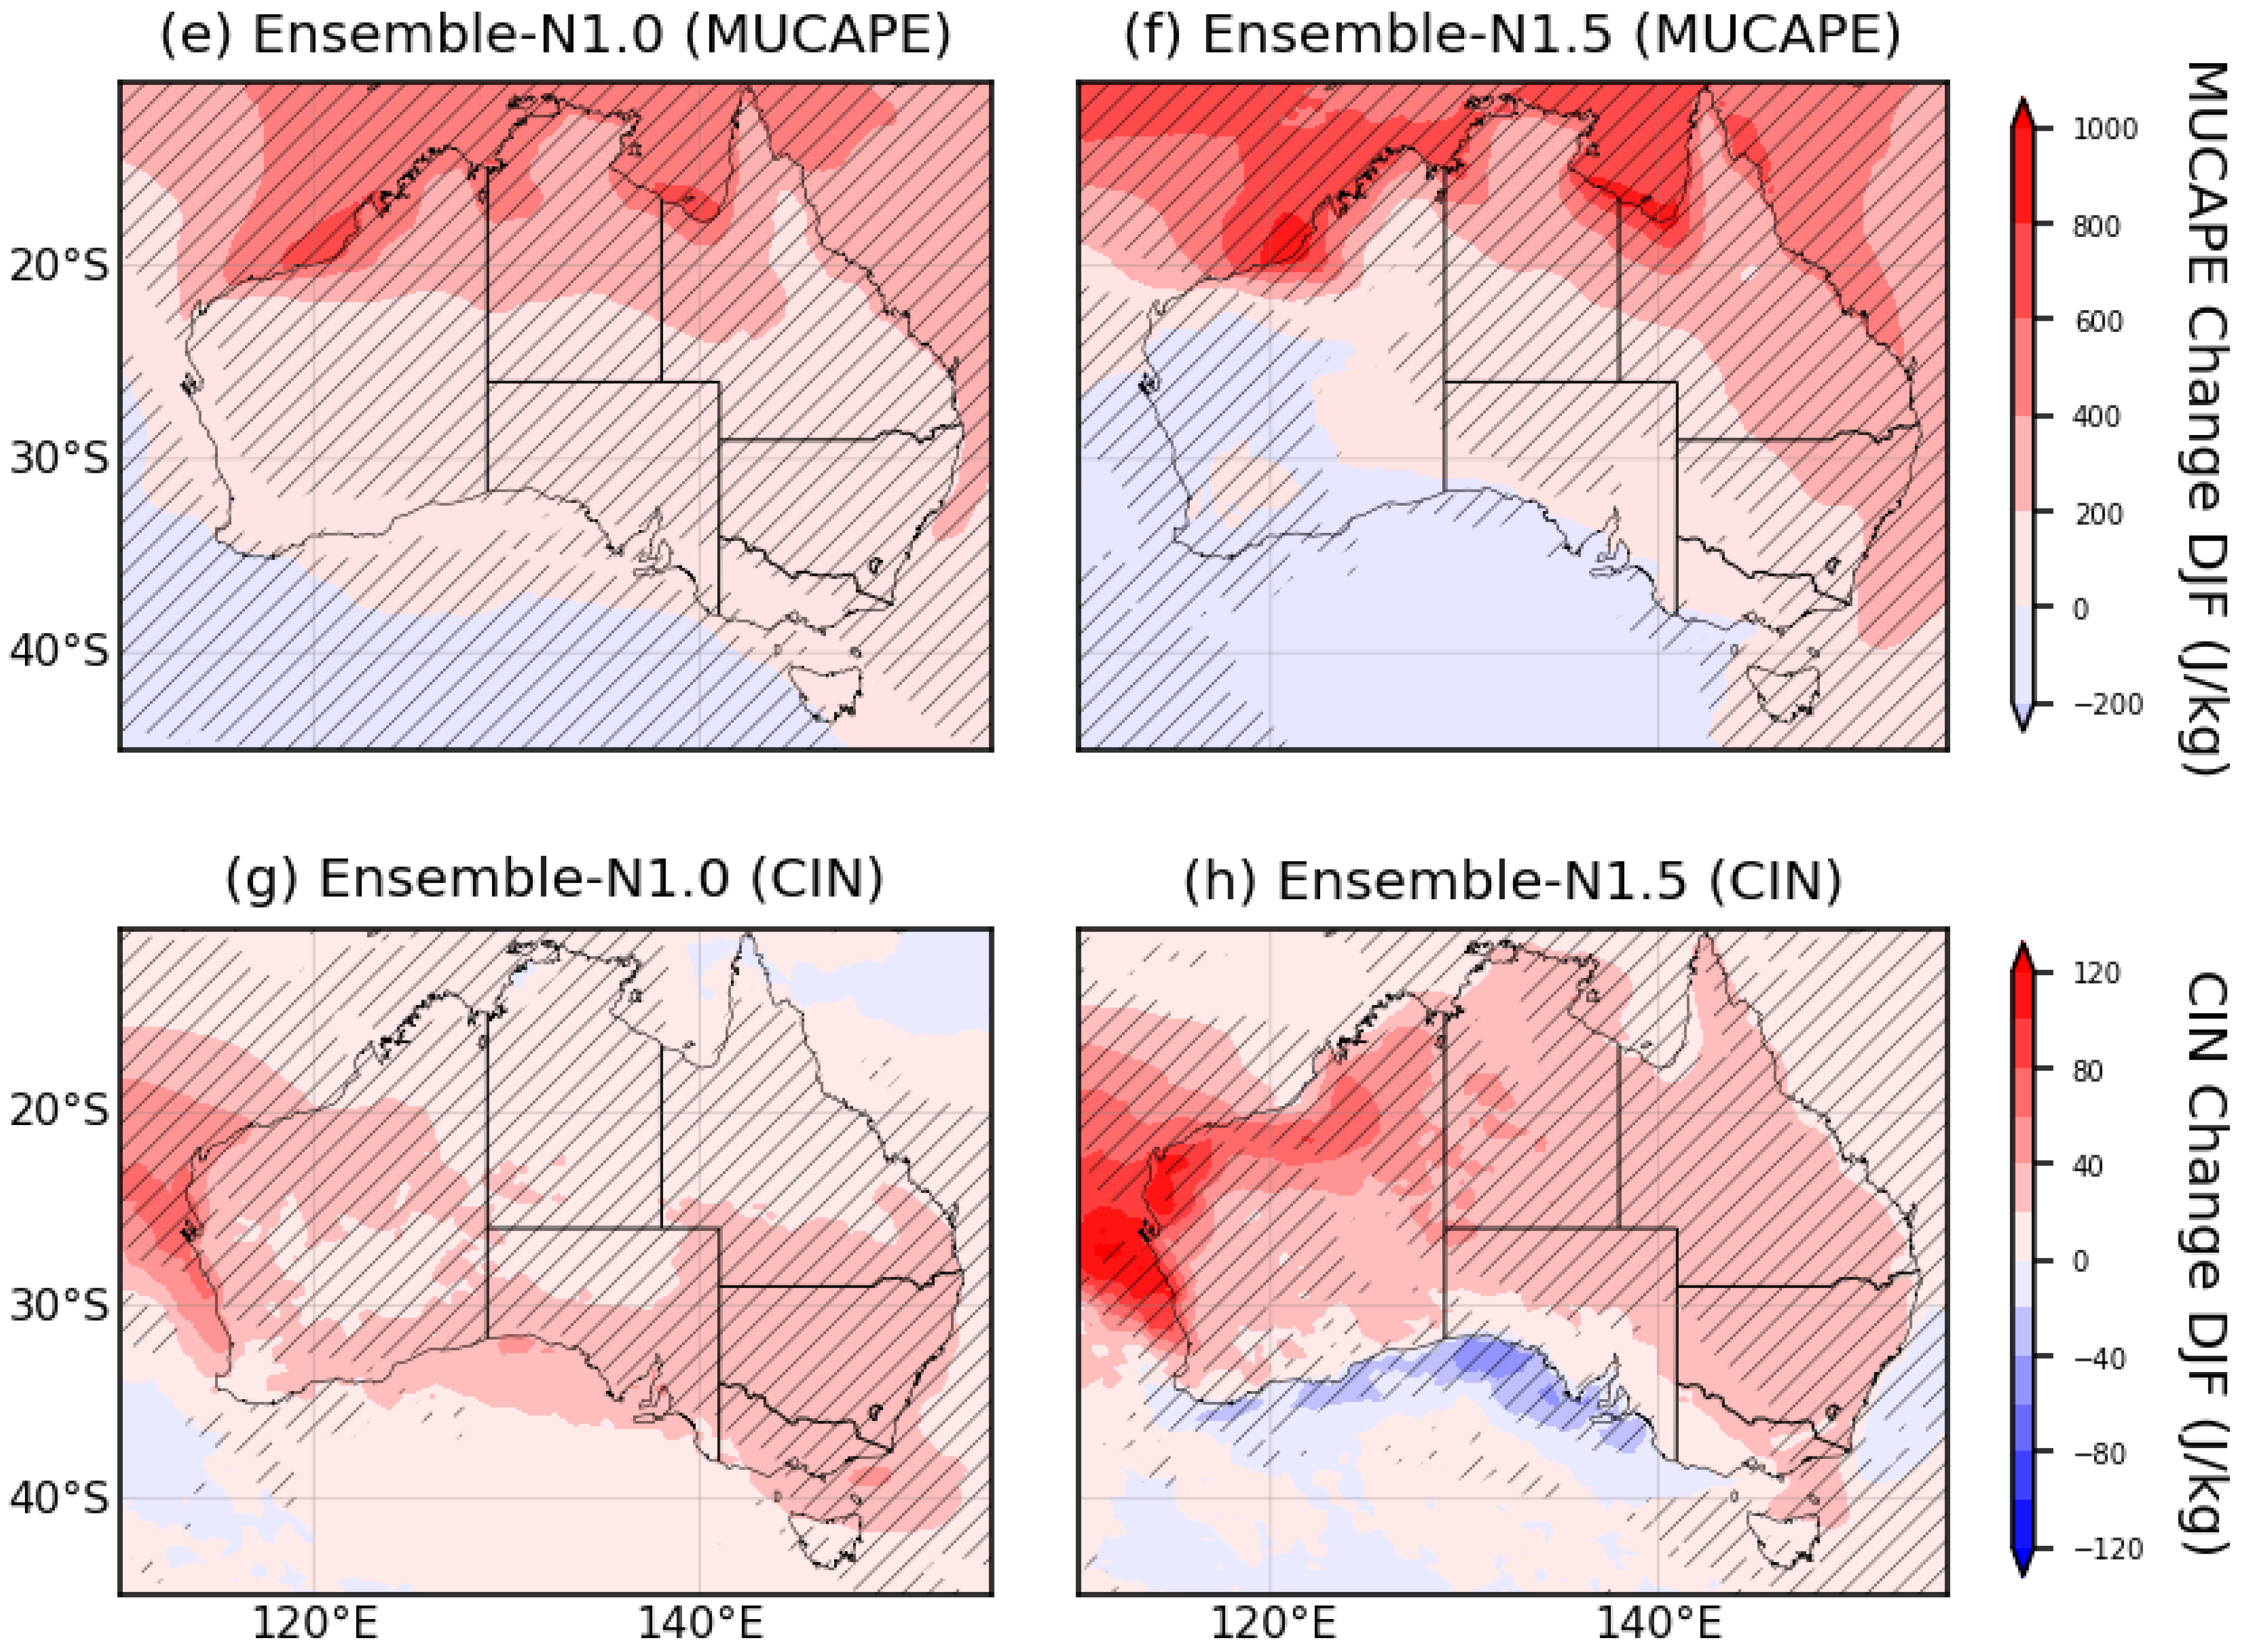
Globally, CAPE is highest in the tropics, with particular maxima over the Indo-China warm pool region [36]. In both N1.0 and N1.5 projections, CAPE will increase substantially over the entire tropics, extending to southeast Australia during summer (Figure 2). The only region with a decrease in CAPE is the Southern Ocean, southwest of Australia. For other convective indices, CIN has a unique projection pattern with a substantial increase (i.e., more negative buoyancy energy) over the South Indian Ocean (west coast of Australia) and overall moderate increase over the continent. In oceanic regions south to southwest of Australia, LCL and LFC are seen to increase in the future over many areas. Over land, LCL and LFC will increase in altitude in many regions, especially that simulated by N1.5. Both ensembles agree on the decreases in LCL over coastal regions such as southeast Australia. Simulated changes in these parameters in the NARCliM domain have similar patterns over southeast Australia (Figure S1).
The annual patterns of change in the convective indices, shown in Figure 2, are primarily attributable to changes in spring and summer (Figures S2–S9 with individual models). For example, the change pattern in CAPE is quite consistent throughout the year, however, only in summer is the large change in CAPE extended to southeast Australia. The change in CIN has about the same pattern during spring and summer and is similar to that for the entire year. On the other hand, the change in LCL during summer is actually smaller than that annually, and the north–south pattern in the LFC change extends almost throughout the year. Overall, projected increases in LCL and LFC from N1.5 are larger than those from N1.0. There is indeed quite large variability across the 18 models. Inheritance of projection patterns from the driving GCMs can also be identified.
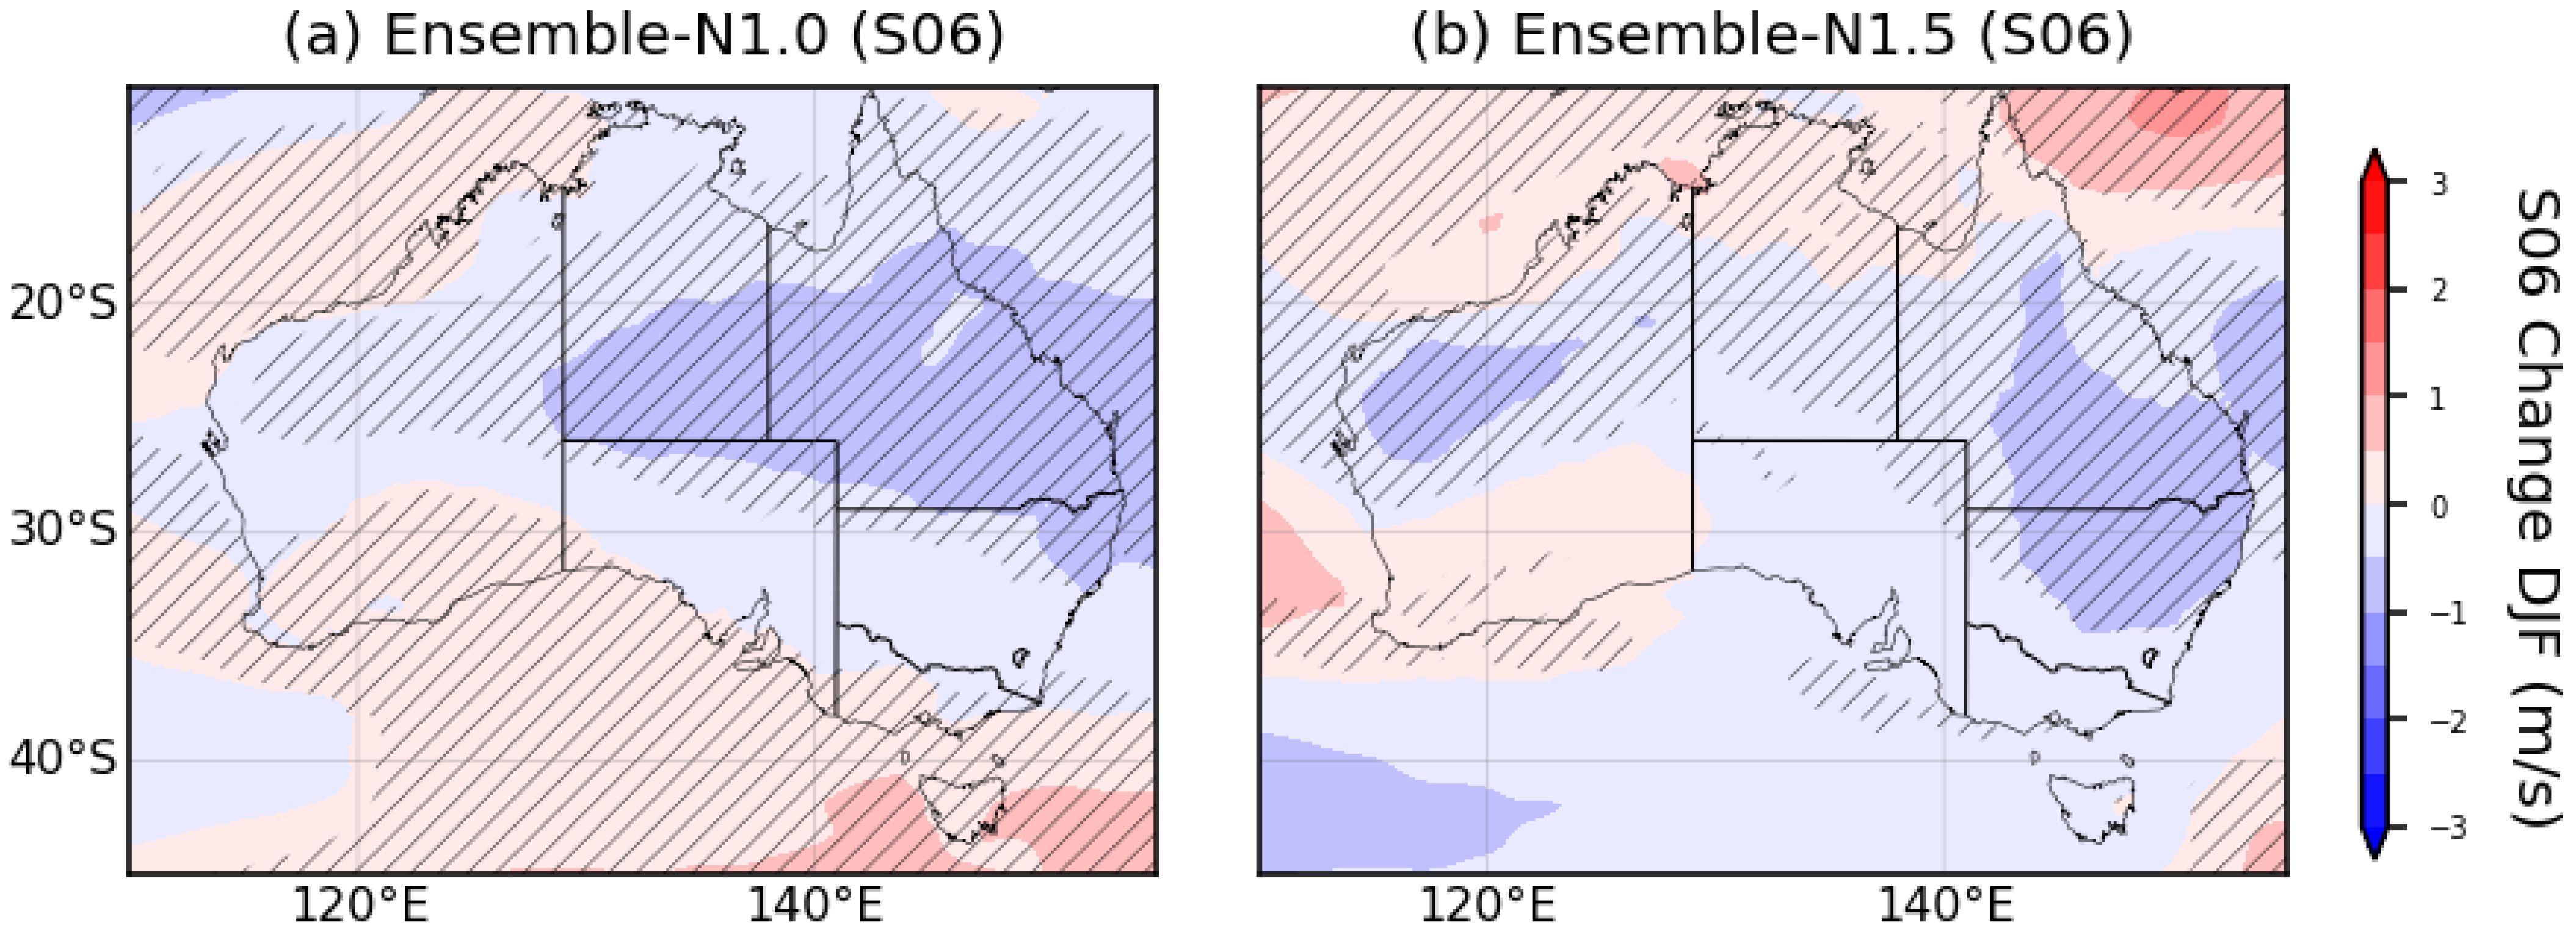
Storm development is not only determined by the convective indices; the dynamic factor of VWS also plays a critical role. S06 is consistently projected to decrease at mid-latitudes by both ensembles (Figure 3). The agreement of such a pattern among the individual models is quite high, except for two models in N1.5 that projected a decrease in VWS over the Southern Ocean during summer (Figures S10 and S11). Larger decreases (about 1 m s−1) are projected at east and southeast Australia, where many historical storm activities concentrated. In other words, the dynamic factors that drive convective storms are projected to weaken in the future. Similar to the thermodynamic parameters, simulated changes in S06 over the NARCliM domain have the same patterns as in the outer domain (Figure S12).

3.2. Change Space in Convective Indices

In the following section, we first examine future statistical changes in the convective indices before projected storm days are analyzed. The historical and future changes in the two-dimensional histogram of MUCAPE-CIN, focusing on land areas, are shown in Figure 4. Historically, in the CORDEX domain, MUCAPE has a low-value and a high-value regime in the histograms for both ensembles (Figure 4a,b). In the future, the high-value regime will shift to even higher MUCAPE values, which is likely due to increases over tropical and southeast Australia. In the NARCliM domain that focuses on southeast Australia, changes in the histogram are towards a higher MUCAPE and also a higher CIN (Figure 4c,d). In other words, while convection initialization will be more difficult, the potential energy for convection will increase once convection commences.
For the change spaces in MUCAPE and S06, which are related to the TSTORM values in equation 1, the corresponding histograms are shown in Figure 5. In the historical histograms simulated by both ensembles in the CORDEX domain, besides a low-MUCAPE regime, there is a concentrated regime with MUCAPE at about 1000–2000 J kg−1 and S06 at about 5–10 m s−1 (Figure 5a,b). In the future period, there is a clear shift in the high-MUCAPE regime to values over 2000 J kg−1. Comparatively, there are small changes in S06 simulated by N1.0, while N1.5 simulated simultaneous increases in MUCAPE and S06, although increases in S06 are not clear in the spatial map of the ensemble mean (see also Figure S9 for individual models). In the NARCliM domain, the shift to a higher MUCAPE regime is similar in both ensembles (Figure 5c,d). Thus, in both the larger Australian region as well as the southeast Australia sub-region, increases in MUCAPE will be the main driver of future increases in convective storm activities.

3.3. Projected Changes in Storm Days

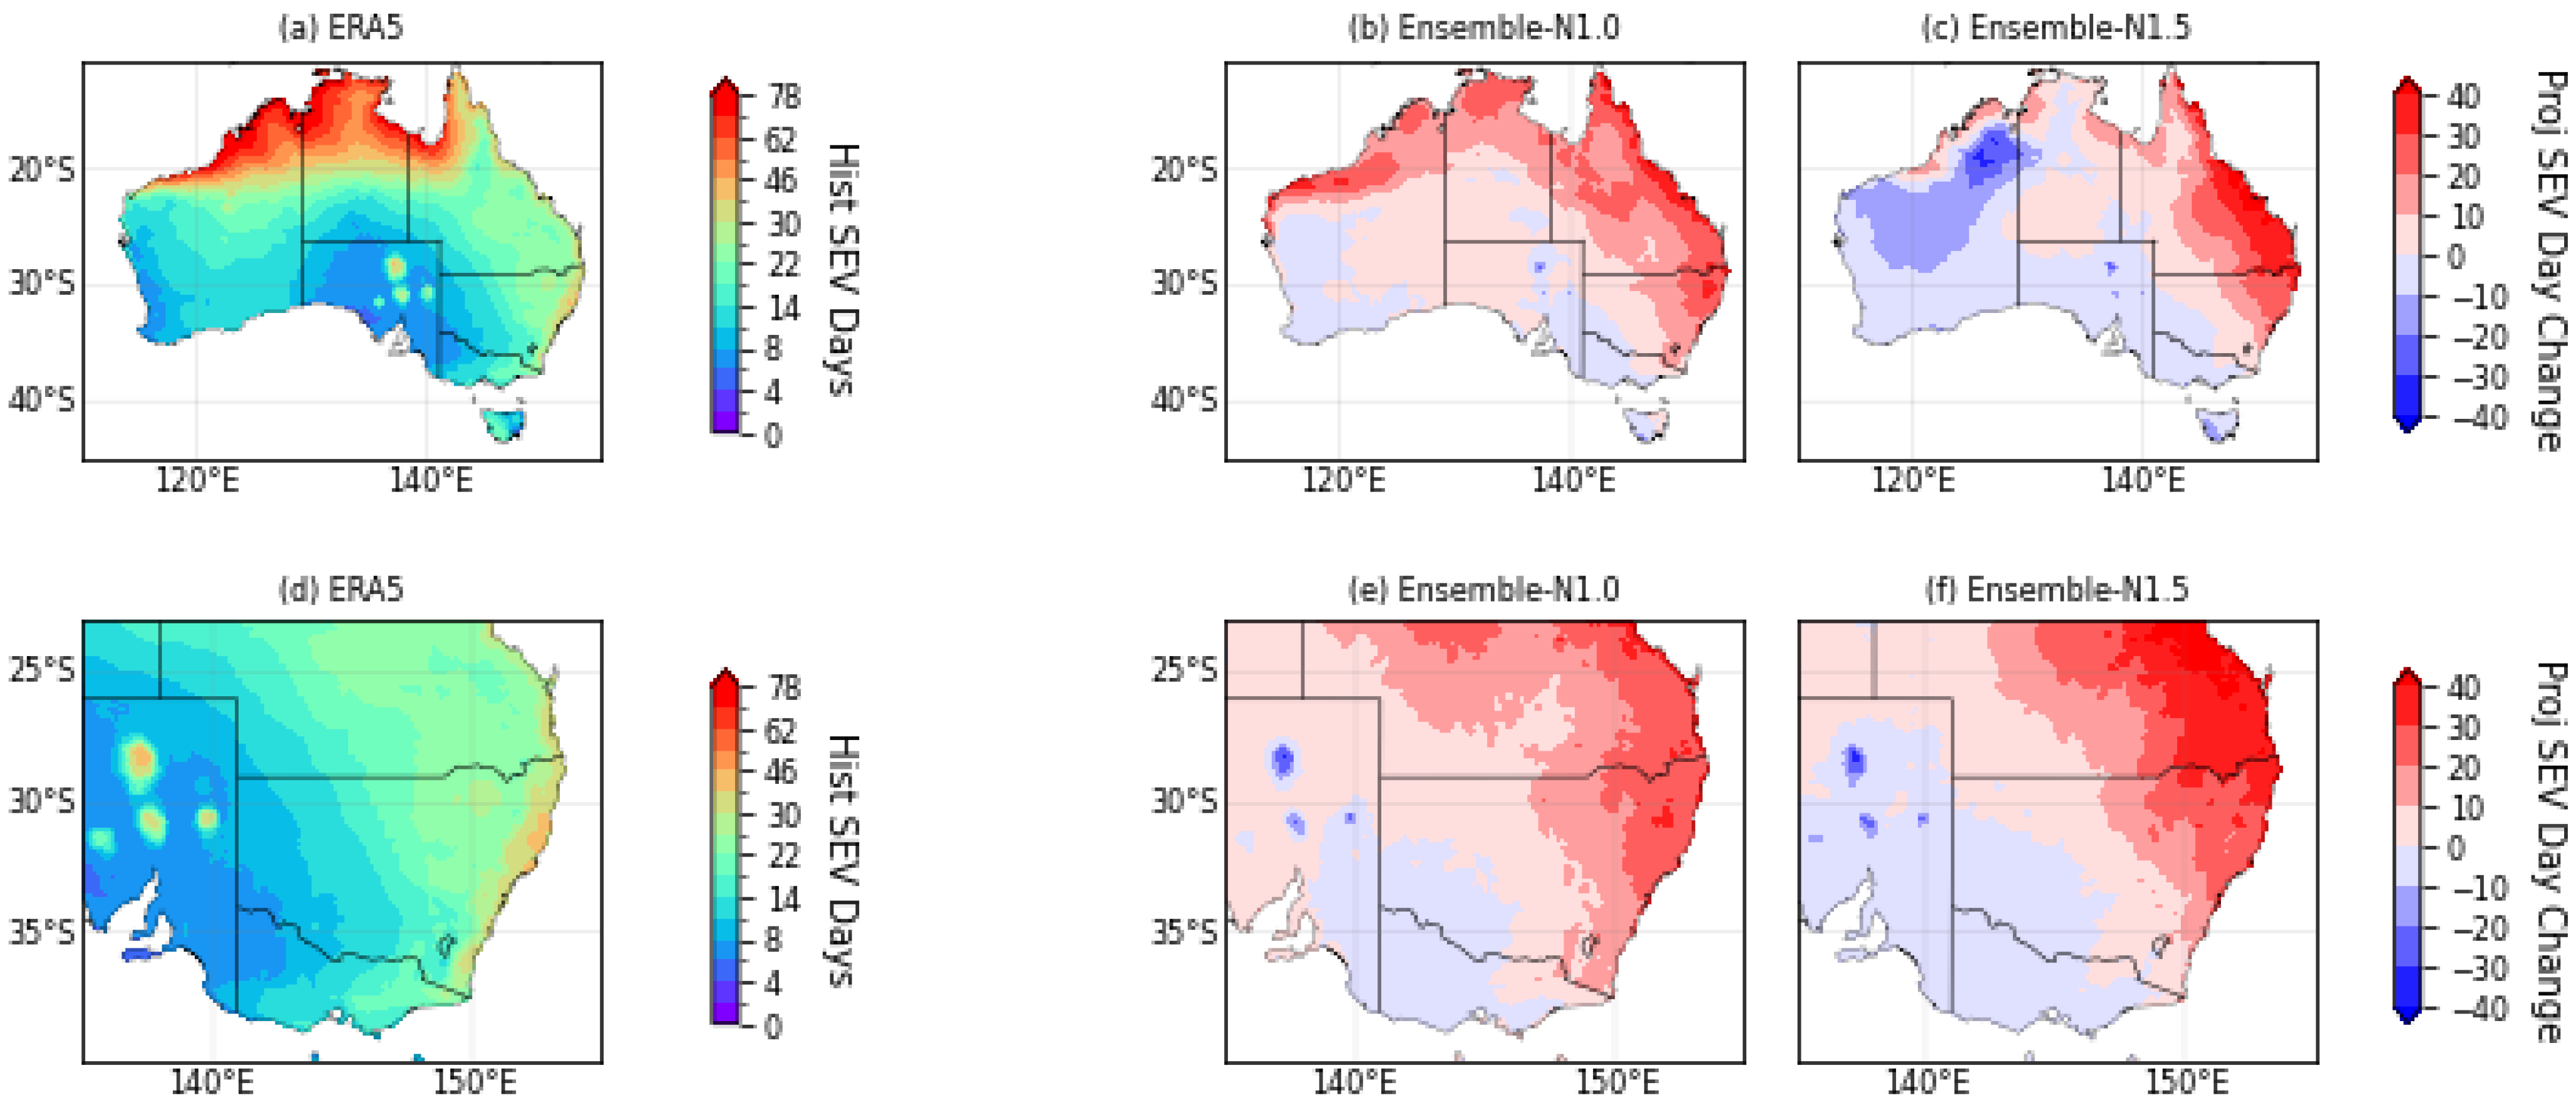
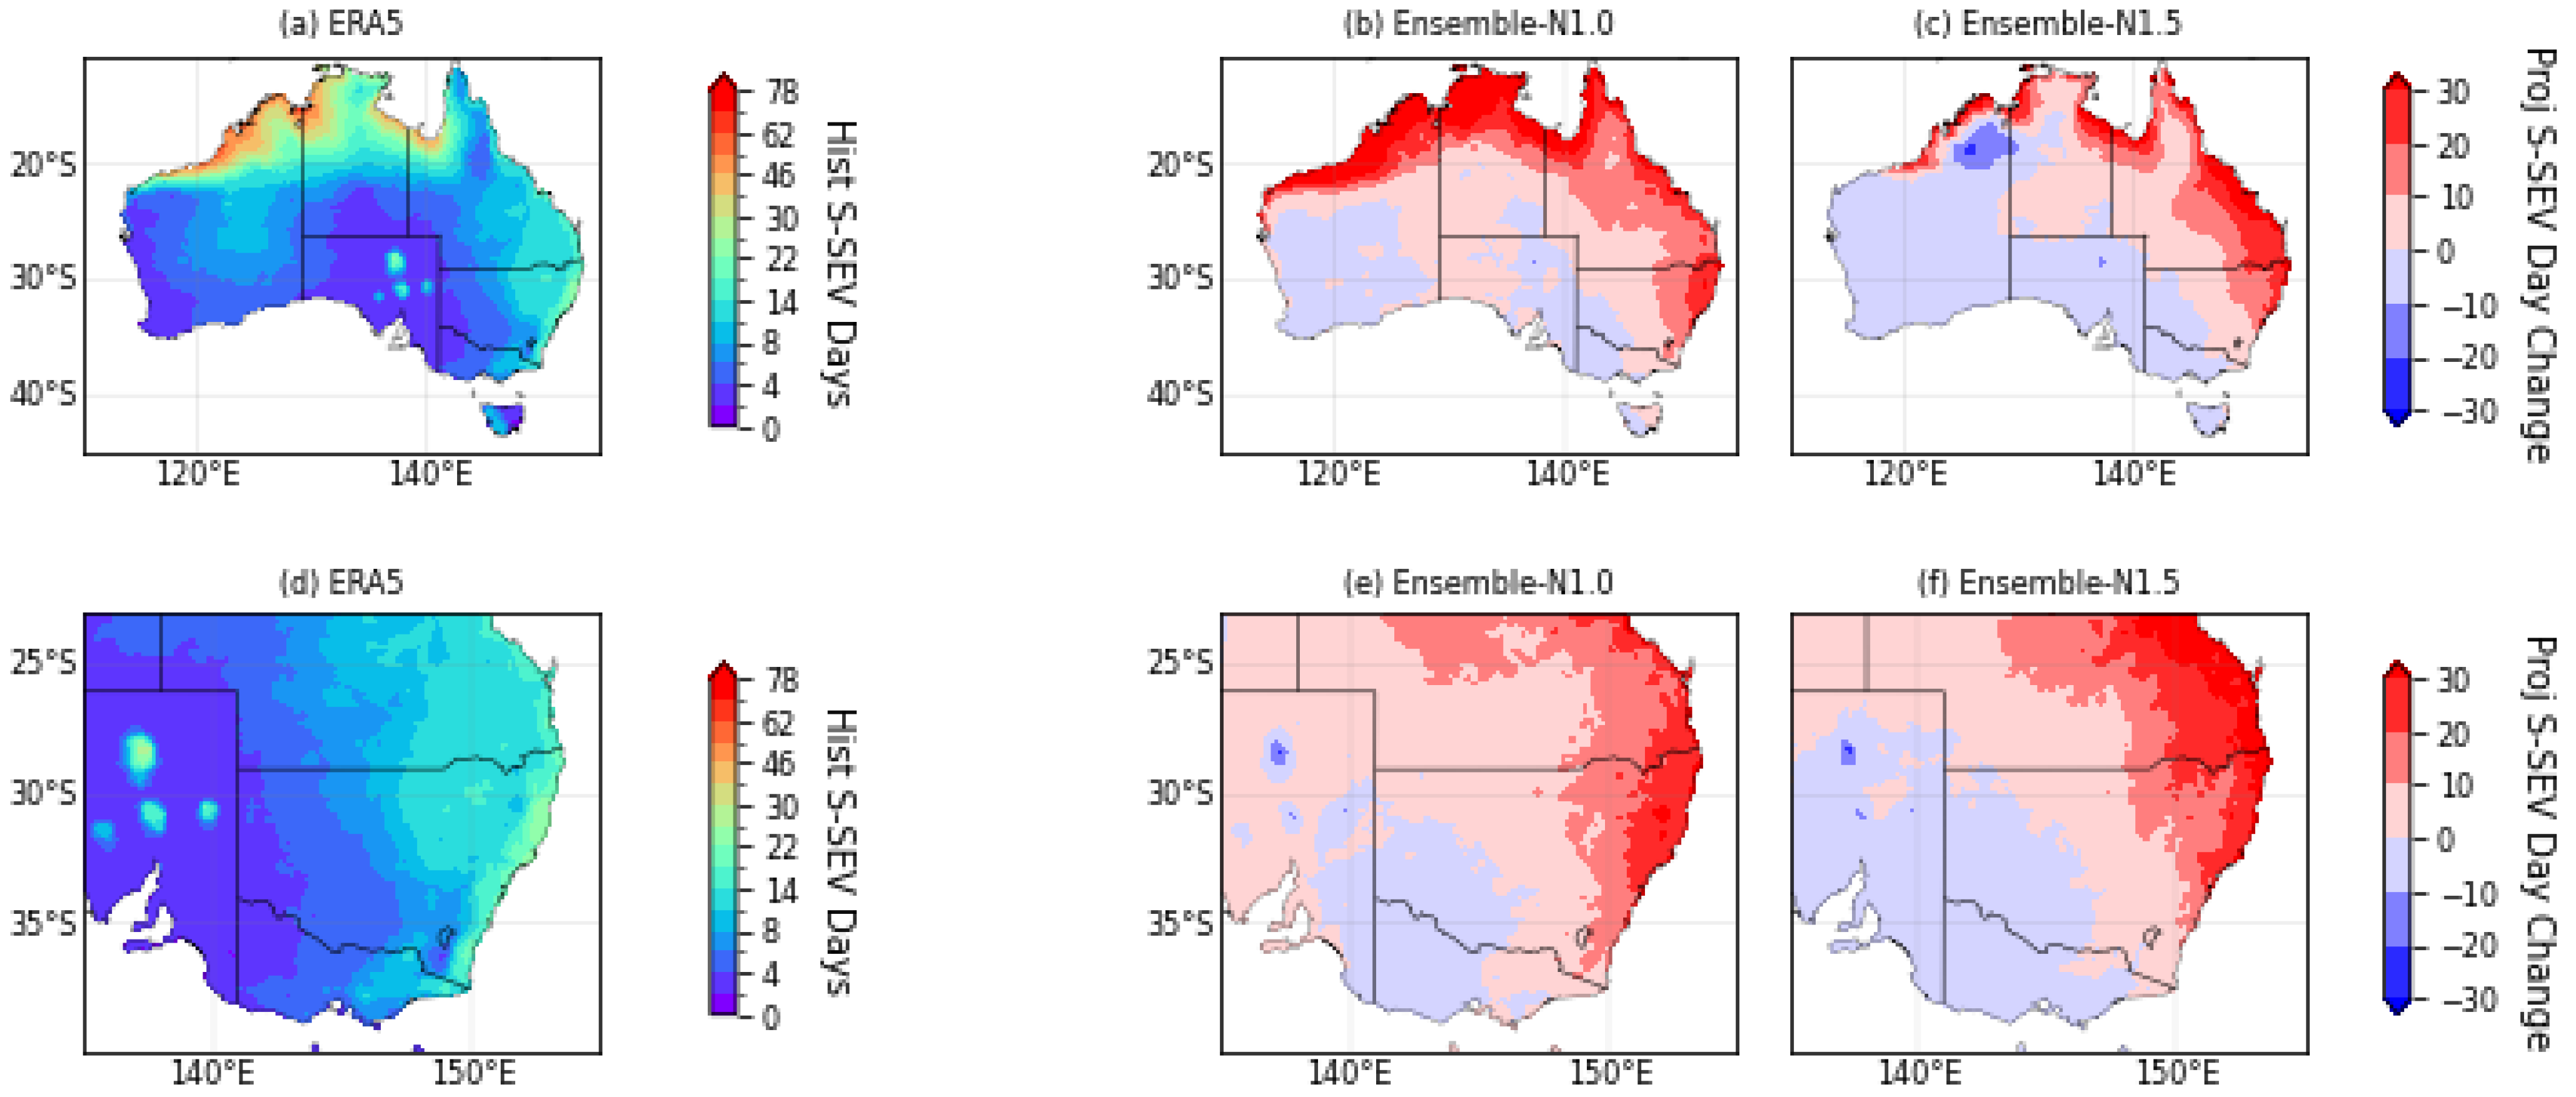
According to our threshold adjustment scheme for TSTORM (Section 2.3), potential storm days in the future period are projected for severe thunderstorm and significant severe thunderstorm, respectively. We count the increase in the number of days in a season where the adjusted threshold has been met or exceeded. It is found that during summer, there will be major increases in tropical Australia extending to southeast Australia, as projected by N1.0 (Figure 6). N1.5 projects a decrease over a region in northwest Australia, likely due to decrease in S06 there, while increases in other tropical Australian regions and east to southeast Australia are similar to those in N1.0. As discussed in the changes in the MUCAPE-S06 histograms, the change patterns of storm days are similar to that of MUCAPE. For example, over the east coast, the potential storm days is around 20 historically. This number will be doubled in the future period according to the simulations, which are also clearly revealed in the NARCliM domain simulations. In some regions over tropical Australia, potential storm development will be almost throughout the season.
It is worth comparing the projections here with those without the threshold adjustment (Figure S13). Because S06 has been generally overestimated in both ensembles [29], regions with projected increase in S06 will likely have TSTORM values exceeding the threshold. This is why in the projections without threshold adjustment, many inland regions will have large increases in storm days but, comparatively, increases over the coasts are only moderate, which is not reasonable according to the patterns of increase in atmospheric instability.
When the adjusted threshold for significant severe storm is applied, the increase in potential storm days has a similar spatial pattern as for severe storm (Figure 7). The increases concentrate near the coasts. Again, a doubling of the potential significant severe storm days may occur at the eastern coasts, with N1.5 projecting more inland increases, for example over Queensland, than N1.0.

3.4. Seasonal Variations

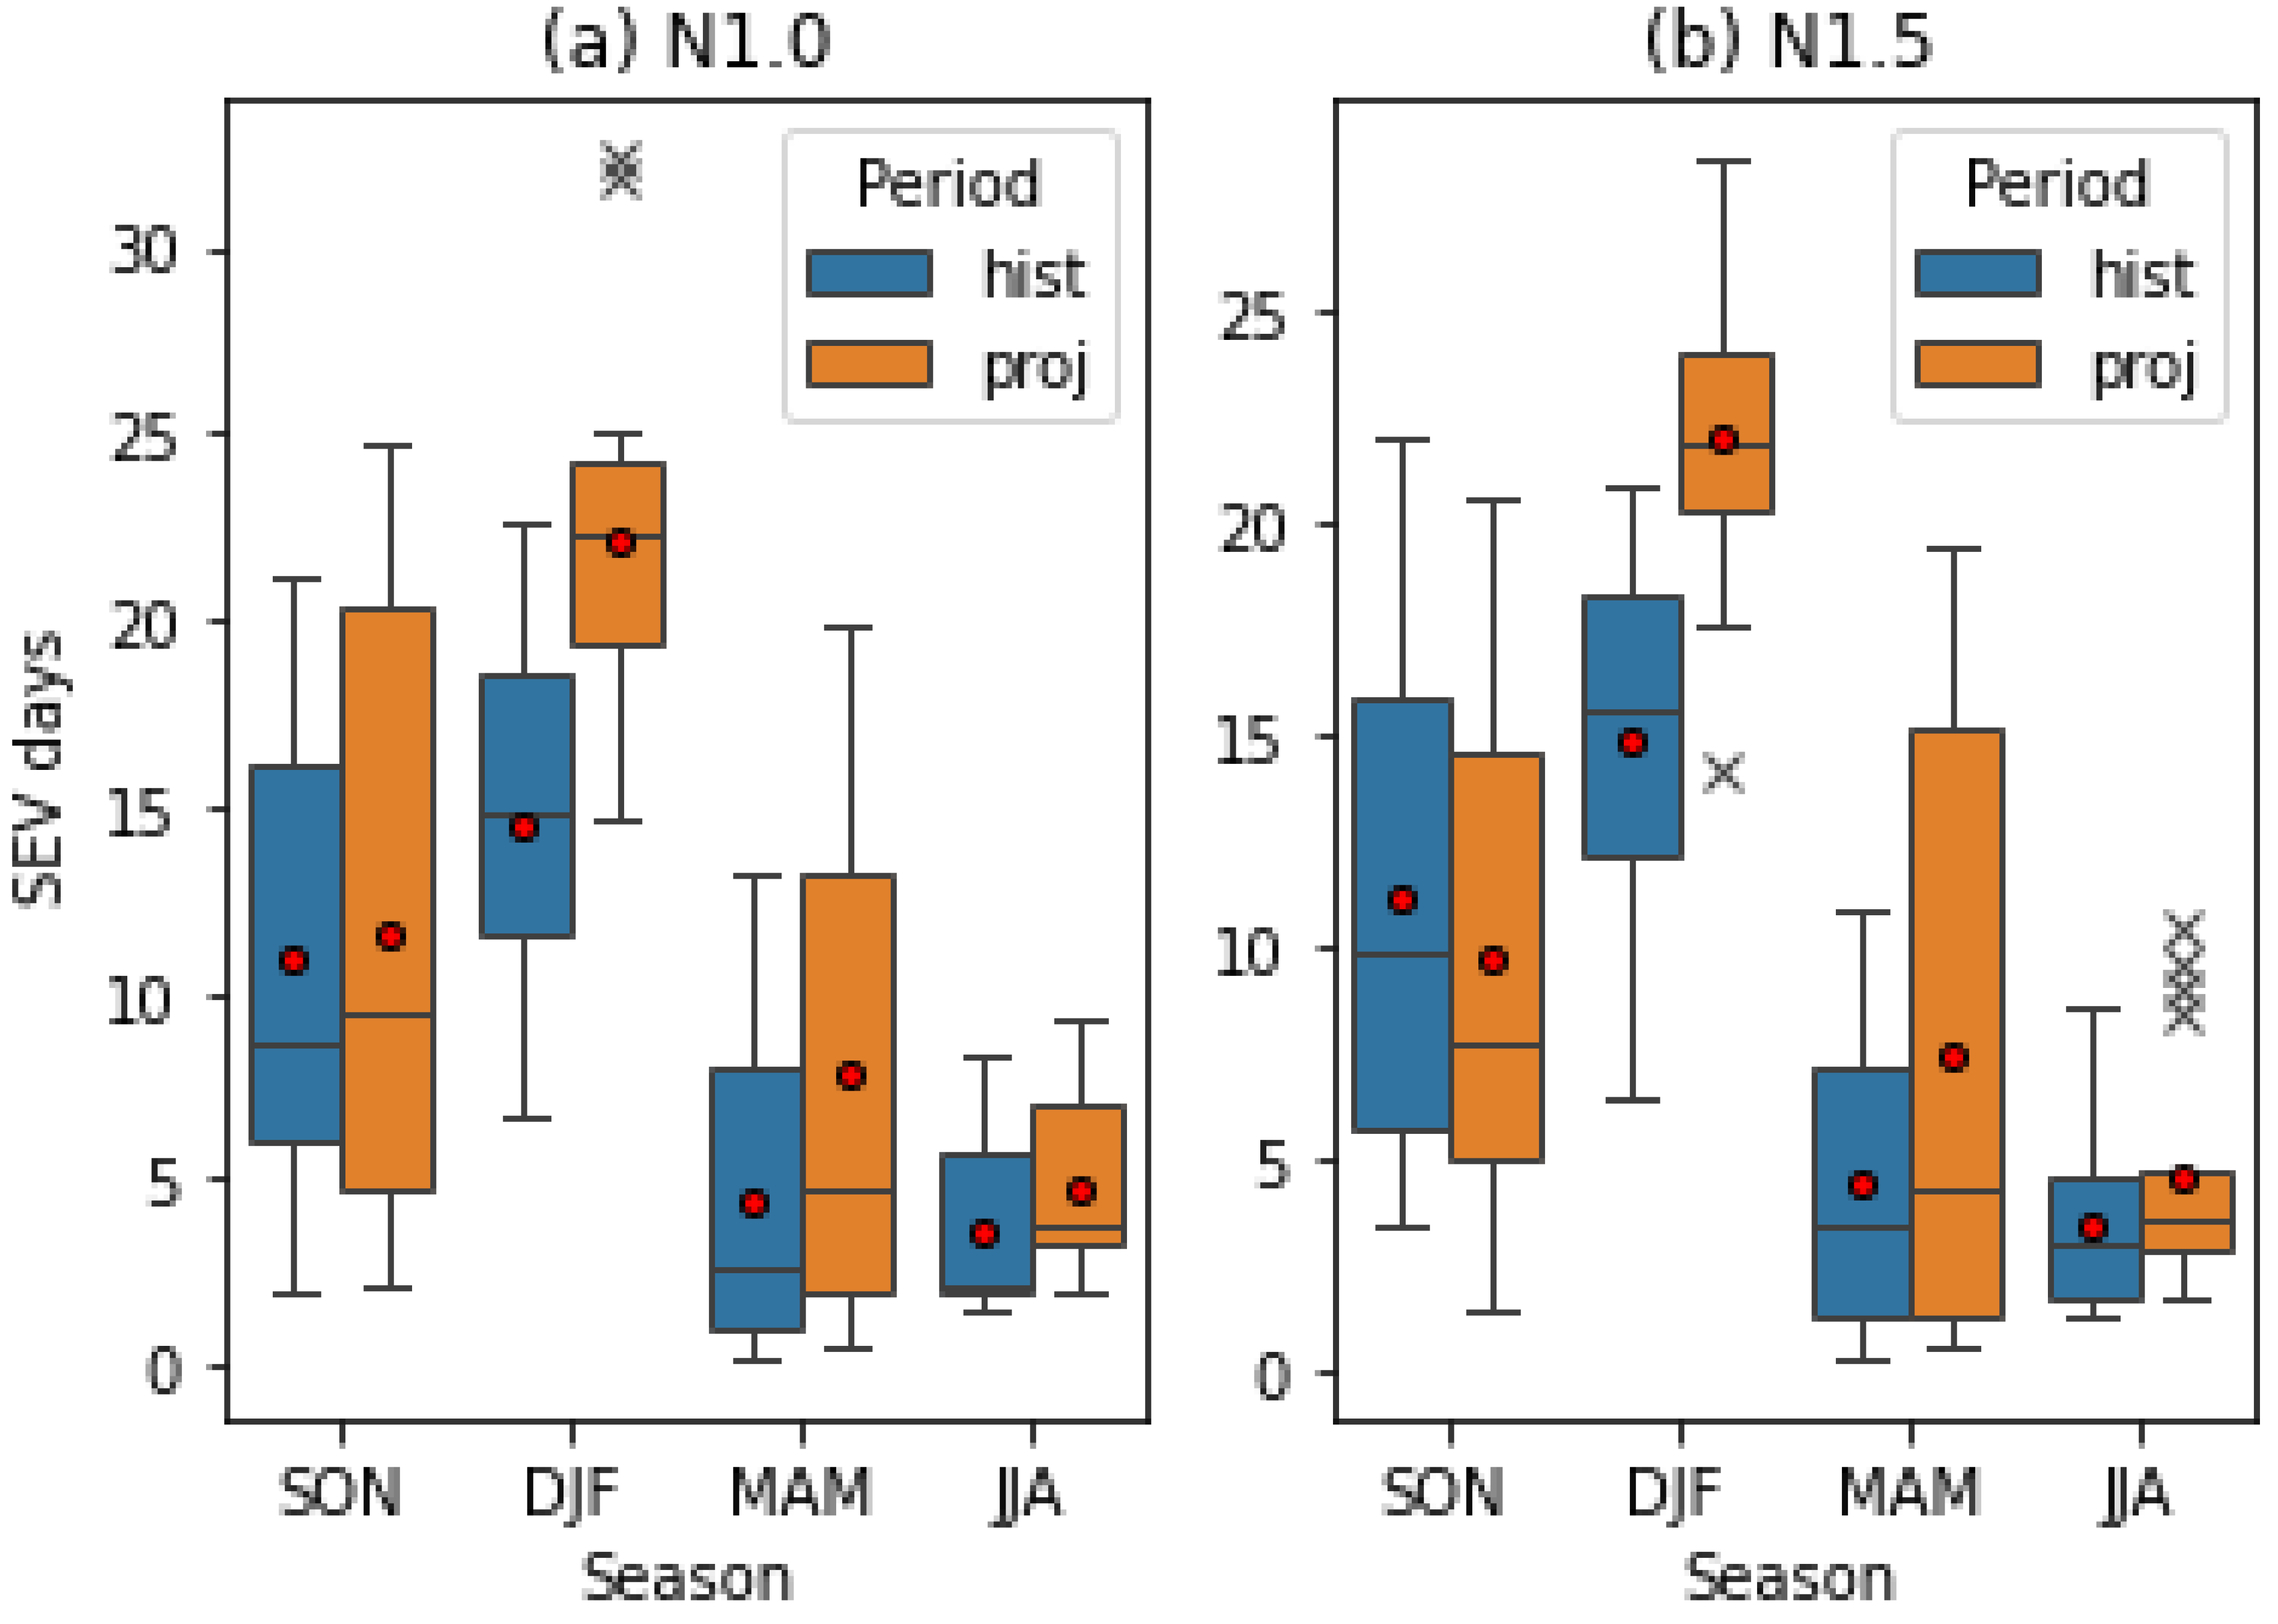
The projected changes in potential storm days, as have been indicated in the last section, are repeated for the other seasons and with the range of projection within the 20-year period depicted (Figure 8). The focus here is the NARCliM domain (southeast Australia). As has been shown in the spatial maps of projections, increases during summer are substantial, with the projected 25–75% percentile ranges totally separated from those in the historical period from both ensembles. Comparatively, both the mean severe storm days and its range are projected to increase during spring (SON) and autumn (MAM). Historically, there were smaller numbers of potential storm days during autumn. However, under future climate conditions, a much higher number of storm days could be encountered. The mean storm days is also expected to increase during winter (JJA), although the range is similar to that historically. Given the changes across the four seasons, it can be said that the duration of storm season will be much more elongated in future climate conditions, with more events starting from spring and lasting until autumn. The change pattern across the four seasons for significant severe storm is similar, including the implication for the duration of storm seasons.

4. Discussion

The projected changes in the convective indices examined here, especially over land, are consistent with global patterns estimated by GCMs [36]. Namely, LFC and CIN will be higher and CAPE will also increase. However, we have seen different impacts of such changes in convective environment on storm activities. For example, Taszarek et al. [37] reported that increased convective inhibition has caused a decline in thunderstorm frequency over southern U.S. On the other hand, increased atmospheric instability led to more tornadoes over southeastern U.S and more thunderstorms in Europe. Our findings here are consistent with previous studies for other regions in that future increases in thunderstorm activities are mainly driven by CAPE, and that can overcome the barrier to convection initialization due to the increased CIN [11,38]. For the Australian region, our downscaled simulations further support previous projections by coarse-resolution GCMs [17] for changes in CAPE/CIN, and our larger ensembles give higher robustness in future decreases in vertical wind shear over the major storm development areas.
Chen et al. [36] has discussed in detail the dependency of the changes in convective indices on temperature and moisture. For the oceanic region south to southwest of Australia, temperature warming is the dominating factor (not shown). Specific humidity does not change much over the ocean surface and thus relative humidity (RH) would decrease during warming. Such changes would lead to higher altitudes of LCL and LFC, a subsequently larger magnitude of CIN, and lower/less changes in CAPE. Further diagnoses should be performed for land region, especially on whether the specific humidity increase effect is more than that of temperature increase. In this scenario, RH would increase, lowering the LCL and LFC, leading to CIN not changing too much while CAPE would still increase.
The projections of convective environments by N1.0 and N1.5 mostly agree with each other in terms of change direction. However, they do differ in the magnitude of changes in the convective parameters, which may be traced back to influences from the driving GCMs. The GCMs driving N1.5 are drier and hotter than those driving N1.0 [20], and such differences in temperature and humidity may determine the projected storm environment to a certain extent. Nevertheless, both ensembles agree on the fact that besides summer, days with severe storms and significant severe storms will also likely increase in autumn and spring.
Due to the localized nature of convective storms, long and reliable climatologies are unavailable for most regions of the world. It is only in recent decades that local storm climatology has been improving in quality through enhanced observations, citizen science [39], and radar technologies [40]. As such, the detection of trends in storm climatology is difficult, and it is even more difficult to attribute these trends to climate change [41]. Mahoney [14] has discussed a similar situation for hail and climate change. One approach is to search for the ‘storm ingredients’ in coarse-resolution climate models, which we have applied in this study based on our regional downscaling. It should be noted that thunderstorm formation is influenced by small-scale processes that are not explicitly represented in regional climate models. The environmental indices used in this study (e.g., CAPE, CIN, vertical wind shear) serve as proxies for large-scale conditions conducive to convection, but they may not capture the full variability of individual convective events. Therefore, the projected changes in storm environments should be interpreted as changes in the potential for thunderstorm activity, rather than direct changes in storm frequency or intensity. Given the recent advances in the microphysical representation of storm structures (e.g., [42]), another approach would be to conduct convection-permitting numerical simulations and identify the storm activity explicitly [43]. Computational cost and available observations for model validation would be the major challenges facing this approach.
There are several aspects for extension from this study, some of which we have been conducting and will be reported separately. First, the mechanisms for changes in convective environments need clarification. Preliminary analysis depicts different warming patterns within the troposphere at northern and southeast Australia, leading to different pathways to increase CAPE (e.g., lowering in LCL). Since all our simulations possess hourly data, diurnal variation in the convective indices can be examined to reveal future timings of severe thunderstorm occurrences. The new phase of NARCliM2.0 [24], which is convection-permitting and currently being released, applies the CMIP6 models as driver of our RCMs. We will update the storm environment projection when the new projections are analyzed, especially regarding whether they would agree on the projections based on the CMIP6 GCMs only [44]. Given that the new ensemble has 4 km spatial resolution, an approach would be to explicitly identify local storms in the models and compare them with the environment-based storm metrics we examined in this study.

5. Conclusions

This study highlights the significant impact of climate change on the convective storm environments in the Australian region, based on projections using the NARCliM regional climate modeling systems. Our examination of the convective indices and essential ingredients for local storm development showed that in the second half of the twenty-first century, the atmospheric environments in the Australian region will be more conducive to severe storm development. More specifically, the increase in CAPE over tropical and southeastern Australia will provide higher potential for a higher frequency of severe storms. We have found that the summer spatial pattern dominates that for the entire year, and in many Australian regions, peak frequency in local storms has been in the summer climatologically; this implies that the peak frequency of local summer storms will likely further increase. In contrast, S06 is projected by both ensembles to decrease in many regions, especially east and southeast Australia. Thus, vertical wind shear environments will be less conducive and future storm activities in these regions will be mostly driven by atmospheric instability, a situation similar to that projected for Europe [38].
Based on adjusted environmental discriminants to separate less- and more-severe storm development, we found increases in the number of days the thresholds for severe and extremely severe storm will be exceeded under the conditions of climate change over many regions. For tropical Australia and for east/southeast Australia, the increase can be at around a month during the summer. For the other seasons, there is larger variability in the projection of storm days than in summer, but the mean storm days increases in all seasons. The consequence will likely be an elongated period within a year in which the environment is conducive to severe storms, and thus an expanded temporal window for potential impacts. These conditions are expected to exacerbate risks associated with thunderstorm-related hazards, including hail, flash floods, and damaging winds.

Supplementary Materials

The following supporting information can be downloaded at https://www.mdpi.com/article/10.3390/cli13110229/s1.

Author Contributions

Conceptualization, K.K.W.C., F.J., J.P.E., N.N., N.H. and G.d.V.; methodology, K.K.W.C., J.P.E., N.N. and N.H.; software, K.K.W.C., N.N. and N.H.; validation, K.K.W.C., F.J. and N.N.; formal analysis, K.K.W.C. and F.J.; investigation, K.K.W.C., F.J. and N.N.; resources, N.N. and G.d.V.; data curation, F.J., N.N. and N.H.; writing—original draft preparation, K.K.W.C.; writing—review and editing, all authors; visualization, K.K.W.C. and F.J.; supervision, J.P.E., G.d.V., K.B. and M.L.R.; project administration, K.B. and M.L.R.; funding acquisition, K.B. and M.L.R. All authors have read and agreed to the published version of the manuscript.

Funding

This research was partially supported by a contracted project (Doc3066326830) from the Climate and Atmospheric Science branch, NSW Department of Planning and Environment (currently Department of Climate Change, Energy, the Environment and Water, Australia).

Data Availability Statement

NARCliM1.0 and NARCliM1.5 data are available publicly via the NSW Climate Data Portal (https://climatedata-beta.environment.nsw.gov.au/, last accessed on 22 September 2025).

Acknowledgments

KKWC acknowledges support from The Startup Foundation for Introducing Talent of the Nanjing University of Information Science and Technology. The NARCliM project was funded by the NSW Climate Change Fund. The modeling work was undertaken on the National Computational Infrastructure (NCI) high-performance computers in Canberra, Australia, which is supported by the Australian Commonwealth Government. The authors thank the three anonymous reviewers for their insightful and constructive comments that have improved our manuscript substantially.

Conflicts of Interest

Author Nicholas Herold was employed by the Applied Climate Science Pty Ltd. The remaining authors declare that the research was conducted in the absence of any commercial or financial relationships that could be construed as a potential conflict of interest.

Appendix A

In this appendix, the model configurations and physics schemes of the three regional WRF-based regional models (R1, R2, and R3), used for downscaling in N1.0 and N1.5, are listed for reference. Only R1 and R2 were applied in N1.5. The three RCMs simulated in the CORDEX (outer, with boundary conditions taken from the driving GCMs) and NARCliM (inner) domain with 50 km and 10 km horizontal resolution, respectively (Figure 1). Vertically, the models possess 30 levels that extend to 50 hPa. For climate projection, N1.0 simulated three separated periods (1990–2009, 2020–2039, and 2060–2079) and N1.5 simulated continuously from 1950 to 2100. Thus, the common “far-future” period is 2060–2079, which is the projection period in this study. The information in this appendix is used to support the discussion in Section 2.1.
Table A1. The model configuration for the three independent RCMs. Here, the planetary boundary layer schemes include the Yonsei University (YSU) and the Mellor–Yamada–Janjic (MYJ) schemes. The cumulus physics schemes include the Kain–Fritsch (KF) and the Betts–Miller–Janiac (BMJ) parameterization. The radiation schemes include the Dudhia shortwave scheme, Rapid Radiative Transfer Model (RRTM) longwave scheme and the Community Atmospheric Model (CAM) radiation scheme. The cloud microphysics applies the double-moment five-class (WDM5) scheme.
NARCliM
Ensemble Member
Planetary
Boundary Layer Physics
Cumulus PhysicsSurface Layer PhysicsCloud
Microphysics
Shortwave/Longwave Radiation Physics
R1MYJKFEta similarityWDM 5 classDudhia/RRTM
R2MYJBMJEta similarityWDM 5 classDudhia/RRTM
R3YSUKFMM5 similarityWDM 5 classCAM/CAM

References

  1. State of the Climate; The Bureau of Meteorology and Commonwealth Science and Industrial Research Organization, Commonwealth of Australia: Melbourne, Australia, 2024; 32p.
  2. McAneney, J.; Sandercock, B.; Crompton, R.; Mortlock, T.; Musulin, R.; Pielke, R.; Gissing, A. Normalised insurance losses from Australian natural disasters: 1966–2017. Environ. Hazards 2019, 18, 414–433. [Google Scholar] [CrossRef]
  3. Raupach, T.H.; Soderholm, J.S.; Warren, R.A.; Sherwood, S.C. Changes in hail hazard across Australia: 1979–2021. NPJ Clim. Atmos. Sci. 2023, 6, 143. [Google Scholar] [CrossRef]
  4. Allen, J.T.; Allen, E.R. A review of severe thunderstorms in Australia. Atmos. Res. 2016, 178–179, 347–366. [Google Scholar] [CrossRef]
  5. Rasuly, A.; Cheung, K.; McBurney, B. Hail events across the greater metropolitan severe thunderstorm warning area. Nat. Haz. Earth Syst. Sci. 2015, 15, 973–984. [Google Scholar] [CrossRef]
  6. Cai, W.; Purich, A.; Cowan, T.; Van Rensch, P.; Weller, E. Did climate change-induced rainfall trends contribute to the Australian millennium drought? J. Clim. 2014, 27, 3145–3168. [Google Scholar] [CrossRef]
  7. Raut, B.A.; Jakob, C.; Reeder, M.J. Rainfall Changes over Southwestern Australia and Their Relationship to the Southern Annular Mode and ENSO. J. Clim. 2014, 27, 5801–5814. [Google Scholar] [CrossRef]
  8. Dowdy, A.J. Seasonal forecasting of lightning and thunderstorm activity in tropical and temperate regions of the world. Sci. Rep. 2016, 6, 20874. [Google Scholar] [CrossRef]
  9. King, A.D.; Pitman, A.J.; Henley, B.J.; Ukkola, A.M.; Brown, J.R. The role of climate variability in Australian drought. Nat. Clim. Change 2020, 10, 177–179. [Google Scholar] [CrossRef]
  10. Dowdy, A.J.; Soderholm, J.; Brook, J.; Brown, A.; McGowan, H. Quantifying Hail and Lightning Risk Factors Using Long-Term Observations Around Australia. J. Geophys. Res. Atmos. 2020, 125, 2020JD033101. [Google Scholar] [CrossRef]
  11. Rasmussen, K.L.; Prein, A.F.; Rasmussen, R.M.; Ikeda, K.; Liu, C. Changes in the convective population and thermodynamic environments in convection-permitting regional climate simulations over the United States. Clim. Dyn. 2020, 55, 383–408. [Google Scholar] [CrossRef]
  12. Kendon, E.J.; Ban, N.; Roberts, N.M.; Fowler, H.J.; Roberts, M.J.; Chan, S.C.; Evans, J.P.; Fosser, G.; Wilkinson, J.M. Do Convection-Permitting Regional Climate Models Improve Projections of Future Precipitation Change? Bull. Amer. Meteorol. Soc. 2017, 98, 79–93. [Google Scholar] [CrossRef]
  13. Kendon, E.J.; Prein, A.F.; Senior, C.A.; Stirling, A. Challenges and outlook for convection-permitting climate modelling. Phil. Trans. Roy. Soc. A 2021, 379, 20190547. [Google Scholar] [CrossRef]
  14. Mahoney, K. Extreme hail storms and climate change: Foretelling the future in tiny, turbulent crystal balls? Bull. Amer. Meteor. Soc. 2020, 101, S17–S22. [Google Scholar] [CrossRef]
  15. Trapp, R.J.; Diffenbaugh, N.S.; Brooks, H.E.; Baldwin, M.E.; Robinson, E.D.; Pal, J.S. Changes in severe thunderstorm environment frequency during the 21st century caused by anthropogenically enhanced global radiative forcing. Proc. Natl. Acad. Sci. USA 2007, 104, 19719–19723. [Google Scholar] [CrossRef]
  16. Allen, J.T.; Karoly, D.J.; Walsh, K.J. Future Australian severe thunderstorm environments. Part I: A novel evaluation and climatology of convective parameters from two climate models for the late twentieth century. J. Clim. 2014, 27, 3827–3847. [Google Scholar] [CrossRef]
  17. Allen, J.T.; Karoly, D.J.; Walsh, K.J. Future Australian severe thunderstorm environments. Part II: The influence of a strongly warming climate on convective environments. J. Clim. 2014, 27, 3848–3868. [Google Scholar] [CrossRef]
  18. Zhu, W.; Wang, X.H.; Peirson, W.; Salcedo-Castro, J. Assessment of model projections of climate-change induced extreme storms on the south-east coast of Australia. Int. J. Climatol. 2024, 44, 2139–2159. [Google Scholar] [CrossRef]
  19. Evans, J.P.; Ji, F.; Lee, C.; Smith, P.; Argüeso, D.; Fita, L. Design of a regional climate modelling projection ensemble experiment—NARCliM. Geosci. Model Dev. 2014, 7, 621–629. [Google Scholar] [CrossRef]
  20. Nishant, N.; Evans, J.P.; Di Virgilio, G.; Downes, S.M.; Ji, F.; Cheung, K.K.W.; Tam, E.; Miller, J.; Beyer, K.; Riley, M.L. Introducing NARCliM1.5: Evaluating the Performance of Regional Climate Projections for Southeast Australia for 1950–2100. Earths Future 2021, 9, e2020EF001833. [Google Scholar] [CrossRef]
  21. Brooks, H.E. Proximity soundings for severe convection for Europe and the United States from reanalysis data. Atmos. Res. 2009, 93, 546–553. [Google Scholar] [CrossRef]
  22. Allen, J.T.; Karoly, D.J.; Mills, G.A. A severe thunderstorm climatology for Australia and associated thunderstorm environments. Aust. Meteorol. Oceanogr. J. 2011, 61, 143–158. [Google Scholar] [CrossRef]
  23. Allen, J.T.; Karoly, D.J. A climatology of Australian severe thunderstorm environments 1979–2011: Inter-annual variability and ENSO influence. Int. J. Climatol. 2014, 34, 81–97. [Google Scholar] [CrossRef]
  24. Di Virgilio, G.; Evans, J.P.; Ji, F.; Tam, E.; Kala, J.; Andrys, J.; Thomas, C.; Choudhury, D.; Rocha, C.; White, S.; et al. Design, evaluation, and future projections of the NARCliM2.0 CORDEX-CMIP6 Australasia regional climate ensemble. Geosci. Model Dev. 2025, 18, 671–702. [Google Scholar] [CrossRef]
  25. Evans, J.P.; Ekström, M.; Ji, F. Evaluating the performance of a WRF physics ensemble over South-East Australia. Clim. Dyn. 2012, 39, 1241–1258. [Google Scholar] [CrossRef]
  26. Ji, F.; Ekström, M.; Evans, J.P.; Teng, J. Evaluating rainfall patterns using physics scheme ensembles from a regional atmospheric model. Theor. Appl. Climatol. 2014, 115, 297–304. [Google Scholar] [CrossRef]
  27. Nakicenovic, N.J.; Swart, R. Special Report on Emissions Scenarios—A Special Report of Working Group III of the Intergovernmental Panel on Climate Change; Cambridge University Press: Cambridge, UK, 2000; 608p. [Google Scholar]
  28. Van Vuuren, D.P.; Edmonds, J.; Kainuma, M.; Riahi, K.; Thomson, A.; Hibbard, K.; Hurtt, G.C.; Kram, T.; Krey, V.; Lamarque, J.-F.; et al. The representative concentration pathways: An overview. Clim. Change 2011, 109, 5–31. [Google Scholar] [CrossRef]
  29. Cheung, K.K.W.; Ji, F.; Nishant, N.; Herold, N.; Cook, K. Evaluation of Convective Environments in the NARCliM Regional Climate Modeling System for Australia. Atmosphere 2023, 14, 690. [Google Scholar] [CrossRef]
  30. Taszarek, M.; Pilguj, N.; Allen, J.T.; Gensini, V.; Brooks, H.E.; Szuster, P. Comparison of convective parameters derived from ERA5 and MERRA2 with rawinsonde data over Europe and North America. J. Clim. 2020, 34, 3211–3237. [Google Scholar] [CrossRef]
  31. Taszarek, M.; Allen, J.T.; Marchio, M.; Brooks, H.E. Global climatology and trends in convective environments from ERA5 and rawinsonde data. NPJ Clim. Atmos. Sci. 2021, 4, 35. [Google Scholar] [CrossRef]
  32. Weisman, M.L.; Klemp, J.B. The Dependence of Numerically Simulated Convective Storms on Vertical Wind Shear and Buoyancy. Mon. Weather Rev. 1982, 110, 504–520. [Google Scholar] [CrossRef]
  33. Allen, J.T.; Tippett, M.K.; Sobel, A.H. An empirical model relating U.S. monthly hail occurrence to large-scale meteorological environment. J. Adv. Model. Earth Syst. 2015, 7, 226–243. [Google Scholar] [CrossRef]
  34. Prein, A.F.; Holland, G.J. Global estimates of damaging hail hazard. Weather Clim. Extrem. 2018, 22, 10–23. [Google Scholar] [CrossRef]
  35. Brooks, H.E.; Lee, J.W.; Craven, J.P. The spatial distribution of severe thunderstorm and tornado environments from global reanalysis data. Atmos. Res. 2003, 67–68, 73–94. [Google Scholar] [CrossRef]
  36. Chen, J.; Dai, A.; Zhang, Y.; Rasmussen, K.L. Changes in Convective Available Potential Energy and Convective Inhibition under Global Warming. J. Clim. 2020, 33, 2025–2050. [Google Scholar] [CrossRef]
  37. Taszarek, M.; Allen, J.T.; Brooks, H.E.; Pilguj, N.; Czernecki, B. Differing trends in United States and European severe thunderstorm environments in a warming climate. Bull. Amer. Meteorol. Soc. 2020, 102, E296–E322. [Google Scholar] [CrossRef]
  38. Púčik, T.; Groenemeijer, P.; Rädler, A.T.; Tijssen, L.; Nikulin, G.; Prein, A.F.; van Meijgaard, E.; Fealy, R.; Jacob, D.; Teichmann, C. Future Changes in European Severe Convection Environments in a Regional Climate Model Ensemble. J. Clim. 2017, 30, 6771–6794. [Google Scholar] [CrossRef]
  39. Barras, H.; Hering, A.; Martynov, A.; Noti, P.A.; Germann, U.; Martius, O. Experiences with >50,000 crowdsourced hail reports in Switzerland. Bull. Amer. Meteor. Soc. 2019, 100, 1429–1440. [Google Scholar] [CrossRef]
  40. Warren, R.A.; Ramsay, H.A.; Siems, S.T.; Manton, M.J.; Peter, J.R.; Protat, A.; Pillalamarri, A. Radar-based climatology of damaging hailstorms in Brisbane and Sydney, Australia. Quart. J. Roy. Meteorol. Soc. 2020, 146, 505–530. [Google Scholar] [CrossRef]
  41. Seeley, J.T.; Romps, D.M. The effect of global warming on severe thunderstorms in the United States. J. Clim. 2015, 28, 2443–2458. [Google Scholar] [CrossRef]
  42. Labriola, J.; Snook, N.; Jung, Y.; Xue, M. Evaluating Ensemble Kalman Filter Analyses of Severe Hailstorms on 8 May 2017 in Colorado: Effects of State Variable Updating and Multi-Moment Microphysics Schemes on State Variable Cross-Covariances. Mon. Weather Rev. 2020, 148, 2365–2389. [Google Scholar] [CrossRef]
  43. Trapp, R.J.; Hoogewind, K.A.; Lasher-Trapp, S. Future changes in hail occurrence in the United States determined through convection-permitting dynamical downscaling. J. Clim. 2019, 32, 5493–5509. [Google Scholar] [CrossRef]
  44. Lepore, C.; Abernathey, R.; Henderson, N.; Allen, J.T.; Tippett, M.K. Future global convective environments in CMIP6 models. Earth’s Future 2021, 9, e2021EF002277. [Google Scholar] [CrossRef]
Figure 1. Weather Research and Forecasting (WRF) model domains with grid spacing of about 50 km (outer CORDEX domain shown as map extent) and 10 km (inner NARCliM domain shown with red outline). The topography is shown as shading.
Climate 13 00229 g001
Figure 2. Future changes during summer (DJF) in lifted condensation level (LCL, m), level of free convection (LFC, m), convective available potential energy (CAPE, J kg−1), and convective inhibition (CIN, J kg−1) derived from the N1.0 and N1.5 ensembles. Stippling indicates areas that have statistically significant changes and model agreement within the ensemble.
Climate 13 00229 g002aClimate 13 00229 g002b
Figure 3. Future changes during summer (DJF) in 0–6 km vertical wind shear (S06, m s−1) derived from the N1.0 and N1.5 ensembles. Stippling indicates areas that have statistically significant changes and model agreement within the ensemble.
Climate 13 00229 g003
Figure 4. Change (2060–2079 minus 1990–2009) in the 2-dimensional histogram spanned by MUCAPE and CIN (shaded) from the (a) N1.0 ensemble mean and (b) N1.5 ensemble mean during summer (DJF) for the CORDEX domain. Only land grid points are considered. For ease of interpretation, the frequencies have been scaled (from the total number of grid-point counts) as equivalent to number of days in a season. Dashed contours represent the historical distribution. (c,d) are the corresponding changes in the NARCliM domain. The panels thus illustrate how the historical histograms of MUCAPE-CIN would change in the future.
Climate 13 00229 g004
Figure 5. As in Figure 4, except for the 2-dimensional histograms spanned by MUCAPE and S06.
Climate 13 00229 g005
Figure 6. (a) Climatological number of days during summer (DJF) with TSTORM exceeding the adjusted severe thunderstorm threshold, (b) projected difference (2060–2079 minus 1990–2009) in severe storm days by (b) N1.0 ensemble mean and (c) N1.5 ensemble mean for the CORDEX domain. (df) are the corresponding figures for the NARCliM domain.
Climate 13 00229 g006
Figure 7. As in Figure 6, except for the adjusted significant severe thunderstorm threshold.
Climate 13 00229 g007
Figure 8. Box and whisker plots of the number of days with severe thunderstorm potential (NARCliM domain) in the historical (blue) and projection (orange) period from the (a) N1.0 ensemble mean and (b) N1.5 ensemble mean for the four seasons (SON, DJF, MAM, and JJA), respectively. In each box, the black horizonal line is the median and the red dot is the mean within the 20-year period. The crosses indicate outliers. (c,d) are the corresponding figures for significant severe thunderstorm potential.
Climate 13 00229 g008aClimate 13 00229 g008b
Disclaimer/Publisher’s Note: The statements, opinions and data contained in all publications are solely those of the individual author(s) and contributor(s) and not of MDPI and/or the editor(s). MDPI and/or the editor(s) disclaim responsibility for any injury to people or property resulting from any ideas, methods, instructions or products referred to in the content.