Article

Impact of Climate Change on Drought Dynamics in the Ganale Dawa River Basin, Ethiopia

by
Mohammed Mussa Abdulahi
1,
Pascal E. Egli
2,*,
Anteneh Belayneh
3,
Yazidhi Bamutaze
4 and
Sintayehu W. Dejene
5
1
Africa Center of Excellence in Climate Smart Agriculture and Biodiversity Conservation, Haramaya University, Dire Dawa P.O. Box 138, Ethiopia
2
Department of Geography, Norwegian University of Science and Technology, NO-7049 Trondheim, Norway
3
School of Biological Science and Biotechnology, College of Natural and Computational Science, Haramaya University, Dire Dawa P.O. Box 138, Ethiopia
4
Department of Geography, Geo-Informatics and Climatic Sciences, Makerere University, Makerere, Kampala P.O. Box 7062, Uganda
5
The International Center for Tropical Agriculture, Addis Ababa P.O. Box 5689, Ethiopia
*
Author to whom correspondence should be addressed.
Climate 2025, 13(11), 231; https://doi.org/10.3390/cli13110231
Submission received: 6 August 2025 / Revised: 1 November 2025 / Accepted: 4 November 2025 / Published: 11 November 2025
(This article belongs to the Topic Disaster Risk Management and Resilience)

Abstract

Understanding how climate change will reshape drought dynamics is essential for planning sustainable water and agricultural systems in tropical regions. However, large uncertainties in existing projections limit effective adaptation. To address this, we applied machine learning-enhanced climate projections and satellite-based drought indices to assess drought dynamics in Ethiopia’s Ganale Dawa Basin as a case study. Agricultural and hydrological droughts were analyzed for a historical baseline (1982–2014) and three future periods (2015–2040, 2041–2070, 2071–2100) under SSP2-4.5 (a moderate-emission pathway) and SSP5-8.5 (a high-emission pathway) scenarios. Results show that agricultural droughts occurred 34 times during the historical baseline. Under SSP2-4.5, their frequency declined to 10 in the mid-future, before rising to 16 events in the far future. In contrast, SSP5-8.5 projected increased variability with 33 events in the near future, dropping to 2 in the mid-future, and increasing again to 19 in the far future. Hydrological droughts were more persistent, with a baseline frequency of 31 events, and 26–36 events over future periods under both scenarios. These findings reveal increasing variability in agricultural drought and continued recurrence of hydrological drought. The findings emphasize a dual adaptation approach combining immediate agricultural responses with sustained water management and climate mitigation.

Graphical Abstract

1. Introduction

Drought is one of the most widespread and damaging climate hazards. It puts great pressure on ecosystems, water supplies, and people’s livelihoods [1]. Climate change has made droughts more frequent and severe. They disrupt farming, degrade land, and deepen poverty, especially in developing regions with low coping capacity. A 2 °C rise in global mean temperature could raise drought risk by nearly 50% [2]. Over the past century, droughts have killed over 10 million people and caused hundreds of billions of dollars in damage [3]. More than 90% of these deaths occurred in developing and tropical countries [4]. Understanding how global drought patterns appear at regional and basin levels is essential for designing local adaptation and resilience strategies.
In East Africa, droughts occur often and last for a long time, making them a key part of the region’s climate pattern. Ethiopia regularly faces severe droughts that lower water supply, reduce crop yields, and threaten rural communities. These events hit vulnerable groups the hardest—especially women, children, and the elderly—by worsening food and water shortages, health problems, and displacement [5]. Drought also harms the environment. It speeds up land degradation, reduces biodiversity, and strengthens local climate feedbacks that make the area hotter and drier [6]. By 2050, about 5.7 billion people worldwide may face water scarcity [7]. Studying drought-prone regions such as East Africa helps improve global understanding of drought behavior and supports better adaptation planning.
Drought dynamics are governed by complex interactions among precipitation, evapotranspiration, soil moisture, and land–atmosphere feedbacks. However, large uncertainties remain in projecting future drought patterns, particularly in tropical regions, due to the coarse resolution of global models and discrepancies among climate simulations [8]. Several studies have projected increased drought frequency and intensity under high-emission scenarios [9,10,11], whereas others suggest possible reductions in certain humid or highland regions [12,13]. These inconsistencies arise from differences in model structure, regional climate drivers, and sparse observational data across Sub-Saharan Africa [14,15].
To overcome limitations of earlier projections, the latest generation of climate models (CMIP6) provides enhanced capability for simulating past and future climate extremes [16,17]. CMIP6 incorporates improved physics, higher spatial resolution, and the Shared Socioeconomic Pathways (SSPs), which integrate socioeconomic development trajectories and emission scenarios. Recent global-scale studies using CMIP6 [10,18] have advanced understanding of future drought evolution and its sensitivity to greenhouse gas forcing. For instance, analyses over Asia, the Mediterranean, and Africa consistently reveal that droughts are projected to become longer, more intense, and spatially extensive under higher emission scenarios [17,19,20]. These studies confirm CMIP6’s robustness in reproducing key drought features, yet they also highlight those projections remain highly region-specific and dependent on topography and data resolution.
Within Africa, CMIP6-based assessments show consistent warming trends of 1.2–4.4 °C and precipitation increases of 4.8–15.2% by the late 21st century, although spatial variations remain pronounced [20]. Similarly, regional studies indicate that future droughts in Sub-Saharan Africa will be characterized by higher severity, longer duration, and greater recurrence [21,22]. However, rainfall and temperature changes vary widely across the continent. Regional studies project that Sub-Saharan Africa will face droughts that last longer, occur more often, and cause greater damage. Even so, few studies have examined how agricultural and hydrological droughts evolve together at the basin scale. This limits effective planning for climate adaptation and water management, especially in transboundary river basins such as the Ganale Dawa. By addressing these limitations at the basin level, this study contributes to the growing body of evidence needed to refine drought projections and management strategies in other data-scarce regions worldwide.
In Ethiopia, most previous studies have concentrated on meteorological droughts using rainfall-based indices and coarse-resolution datasets [13,23,24]. Only a few have explored the relationship between agricultural and hydrological droughts or quantified their temporal evolution using high-resolution, downscaled CMIP6 projections. Traditional statistical methods also struggle to capture the nonlinear and dynamic feedbacks that drive drought formation and propagation [25]. However, recent progress in data-driven modeling and machine learning provides powerful tools to reveal complex relationships among climatic and hydrological variables, improving both drought prediction and spatial representation [26,27].
Given these gaps, this study investigates how climate change influences agricultural and hydrological droughts in Ethiopia’s Ganale Dawa River Basin. The basin is highly climate-sensitive and critical for agriculture, hydropower, and transboundary water resources. We combine satellite-based drought indices, machine learning, and downscaled CMIP6 projections to analyze historical drought frequency, duration, and intensity) (1982–2014) and future changes (2015–2100) under SSP2-4.5 (a moderate-emission pathway) and SSP5-8.5 (a high-emission pathway) scenarios. This study provides evidence-based insights for adaptation and water management in the Ganale Dawa Basin, across East Africa, and in other drought-vulnerable landscapes globally.

2. Materials and Methods

2.1. Study Area

The study area is the Ganale Dawa River Basin in southeast Ethiopia (3°30′ N–7°20′ N, 37°05′ E–43°20′ E) (Figure 1). The basin covers ~171,050 km2 and features varied topography with slopes ranging from 0° to 81° [28]. The topographic setting accounts for the diverse ecological and livelihood systems found in the basin. The basin’s agro-ecology follows Ethiopia’s traditional elevation-based classification: Lowland (157–1500 m), Mid-altitude (1500–2300 m), Highland (2300–3200 m), and Alpine (3200–4387 m).
The study area receives an average of 823 mm of rainfall annually, over 70% of which falls between June and September [29]. Temperatures range from 15 °C to 36 °C [30], with seasonal variation driving high evapotranspiration in dry months [31]. Predominant soils include sandy clay loam (64%), clay loam (28%), and clay (6%) [32]. Land cover is dominated by shrubland (64%), followed by forest (16%), grassland (14%), and cropland (5%) [33].

2.2. Data Sources

Multiple observational, reanalysis, and climate model datasets were used (Table 1). Historical hydro-climatic data were obtained from Famine Early Warning Systems Network Land Data Assimilation System (FLDAS) [34] and ERA5-Land datasets [35]. Precipitation and temperature validation data came from Climate Hazards Group InfraRed Precipitation with Station data (CHIRPS) [29] and the Climate Hazards Center InfraRed Temperature with Station data (CHIRTS) [30]. Future climate projections were derived from 22 NASA Earth Exchange Global Daily Downscaled Projections (NEX-GDDP-CMIP6) models covering 1982–2100 (Supplementary Table S1; [36,37,38]). CHIRPS and CHIRTS provided high-resolution observational datasets for precipitation and temperature, used for validating the CMIP6 climate models [36].

2.3. Preprocessing and Model Selection

All datasets were harmonized to a common 0.1° resolution and aggregated to monthly scale. A comprehensive ranking index (CRI) was applied to evaluate the performance of 22 GCMs against CHIRPS and CHIRTS [39,40]. Performance metrics, including correlation, bias, and RMSE, were computed to assess their ability to reproduce historical climate conditions (Table A1 and Table A2). A Comprehensive Ranking Index (CRI) was then applied to integrate these metrics and identify the most skillful models [40]. For detailed calculation procedures and additional references, please refer [40]. The Python code for CMIP6 model evaluation and selection is openly available at Zenodo [41].
Based on the CRI, ten top-performing GCMs (CNRM-CM6-1, CNRM-ESM2-1, CanESM5, EC-Earth3, FGOALS-g3, GISS-E2-1-G, HadGEM3-GC31-LL, INM-CM4-8, INM-CM5-0, KACE-1-0-G) were selected. These models exhibited lower biases, reduced RMSE, and stronger correlations compared to other candidates. Their multi-model ensemble mean (MME) was subsequently constructed and employed for future climate and drought projections, thereby improving robustness and minimizing uncertainties [8].

2.4. Variables and Indicators

Drought was assessed using two indices: the Standardized Soil Moisture Index (SSMI) and the Standardized Runoff Index (SRI). SSMI was derived from RFM predicted monthly soil moisture, while SRI was computed from predicted runoff_sum. Both SSMI and SRI were computed using the methodology adapted from the Standardized Precipitation Index (SPI) framework, similar to that described by [42]. For a broader review of soil moisture and runoff-based drought indices, please refer to [43,44].
Predictor variables included monthly precipitation, maximum temperature, minimum temperature, mean temperature, downward shortwave and longwave radiation, relative humidity, and wind speed. A correlation and VIF (Variance Inflation Factor) analysis was implemented to select the most valuable feature for forecasting the drought indicators [27,45]. The Python code used to assess multicollinearity and compute VIF values is openly available at Zenodo [46]. Variables exhibiting strong pairwise correlations (|r| > 0.8), particularly among temperature-related and longwave radiation variables, were excluded to avoid multicollinearity. Accordingly, mean temperature (mean_tas), precipitation (mean_pr), wind speed (mean_sfcWind), downward shortwave radiation (mean_rsds), and relative humidity (mean_hurs) were retained as final predictors. As shown in Figure 2, the retained variables showed no strong intercorrelation, and all had VIF values less than 3 (Table 2), confirming an acceptable level of multicollinearity. The high VIF for the intercept term is expected and does not affect model interpretation.

2.5. Machine Learning Models

Both traditional and deep learning models were tested: Random Forest (RF), Light Gradient Boosting Machine (LightGBM), Extreme Gradient Boosting (XGBoost), and Categorical Boosting (CatBoost), Long Short-Term Memory (LSTM) and Multilayer Perceptron (MLP). The selection of machine learning algorithms followed the framework described by Bonjer et al. [27], Mohammed et al. [47] and Seka et al. [48], who demonstrated the effectiveness of RF, LightGBM, XGBoost, CatBoost, LSTM, and MLP for drought prediction in Ethiopia. In line with their findings, we applied tree-based ensemble methods to capture nonlinear relationships and deep learning models (LSTM, MLP) to address temporal dependencies.
The model development focused on simulating drought conditions using two indicators: SSMI and SRI. Monthly climate variables were used as predictors, while the corresponding drought indicators served as response variables. In total, the dataset consisted of 2772 monthly observations. To operationalize the model, the dataset covering 1982–2014 was compiled as monthly series of input and output variables (n = 2772). These were then stochastically partitioned into training (70%) and testing (30%) [27]. The model was used to forecast drought from historical data and future projections (2015–2100) based on the ensemble mean of 10 CMIP6 GCMs under SSP2-4.5 and SSP5-8.5 scenarios.
The Python code for data preparation, model training, and evaluation is openly available on Zenodo [49]. Specifically, the Random Forest model applied for the analysis of agricultural and hydrological drought is provided at [50].

2.6. Model Evaluation

Three statistical indicators including a coefficient of determination (R2), the Root Mean Square Error (RMSE), and the Mean Absolute Error (MAE) were used to evaluate the performance of models. R2 measures how well the model explains the variability in drought indices, while RMSE and MAE quantify the magnitude of prediction errors [27]. The equations and interpretation for these and additional metrics are detailed in [47]. The best-performing model was used to simulate monthly drought conditions from 2015 to 2100.

2.7. Drought Event Identification and Characterization

Drought events were identified using run theory, as described by Yevjevich (1967, as cited in [8]), which detects consecutive periods when SSI or SRI values fall below a predefined threshold. A drought was initiated when the index dropped below −1.0 (moderate drought), similar to the procedure outlined by [8,48]. We defined every drought occurrence by duration, frequency, severity and intensity of drought. The period is proportional to the number of consecutive months that the drought occurs. Severity is the cumulative deficit of index values in that period. Intensity is the ratio between severity and duration. Frequency is the number of droughts that took place in the course of the study [8,12].

2.8. Trend Analysis

In order to determine the changes in drought index with time, we applied the non-parametric Mann–Kendall (MK) test, which is an appropriate test when the time series are non-normally distributed [27]. Serial autocorrelation of the data was verified before the analysis was done. In case autocorrelation was observed, a revised trend-free pre-whitening process was used to correct the process [51,52]. The significance was considered to be reached at a p-value of less than 0.05. The slope estimator by Sen slopes was used in order to measure the magnitude and direction of trends [40]. A negative slope was also taken to mean that drought severity was increasing. On the other hand, an increase in conditions was denoted by a positive slope [51].

3. Results

3.1. Model Performance and Simulation

Among the tested algorithms, the Random Forest (RF) model performed best, achieving the highest accuracy (R2 > 0.9580 for SSMI and 0.873 for SRI; Table A3). Therefore, the RF model was selected for subsequent drought projections due to its superior accuracy and stability.
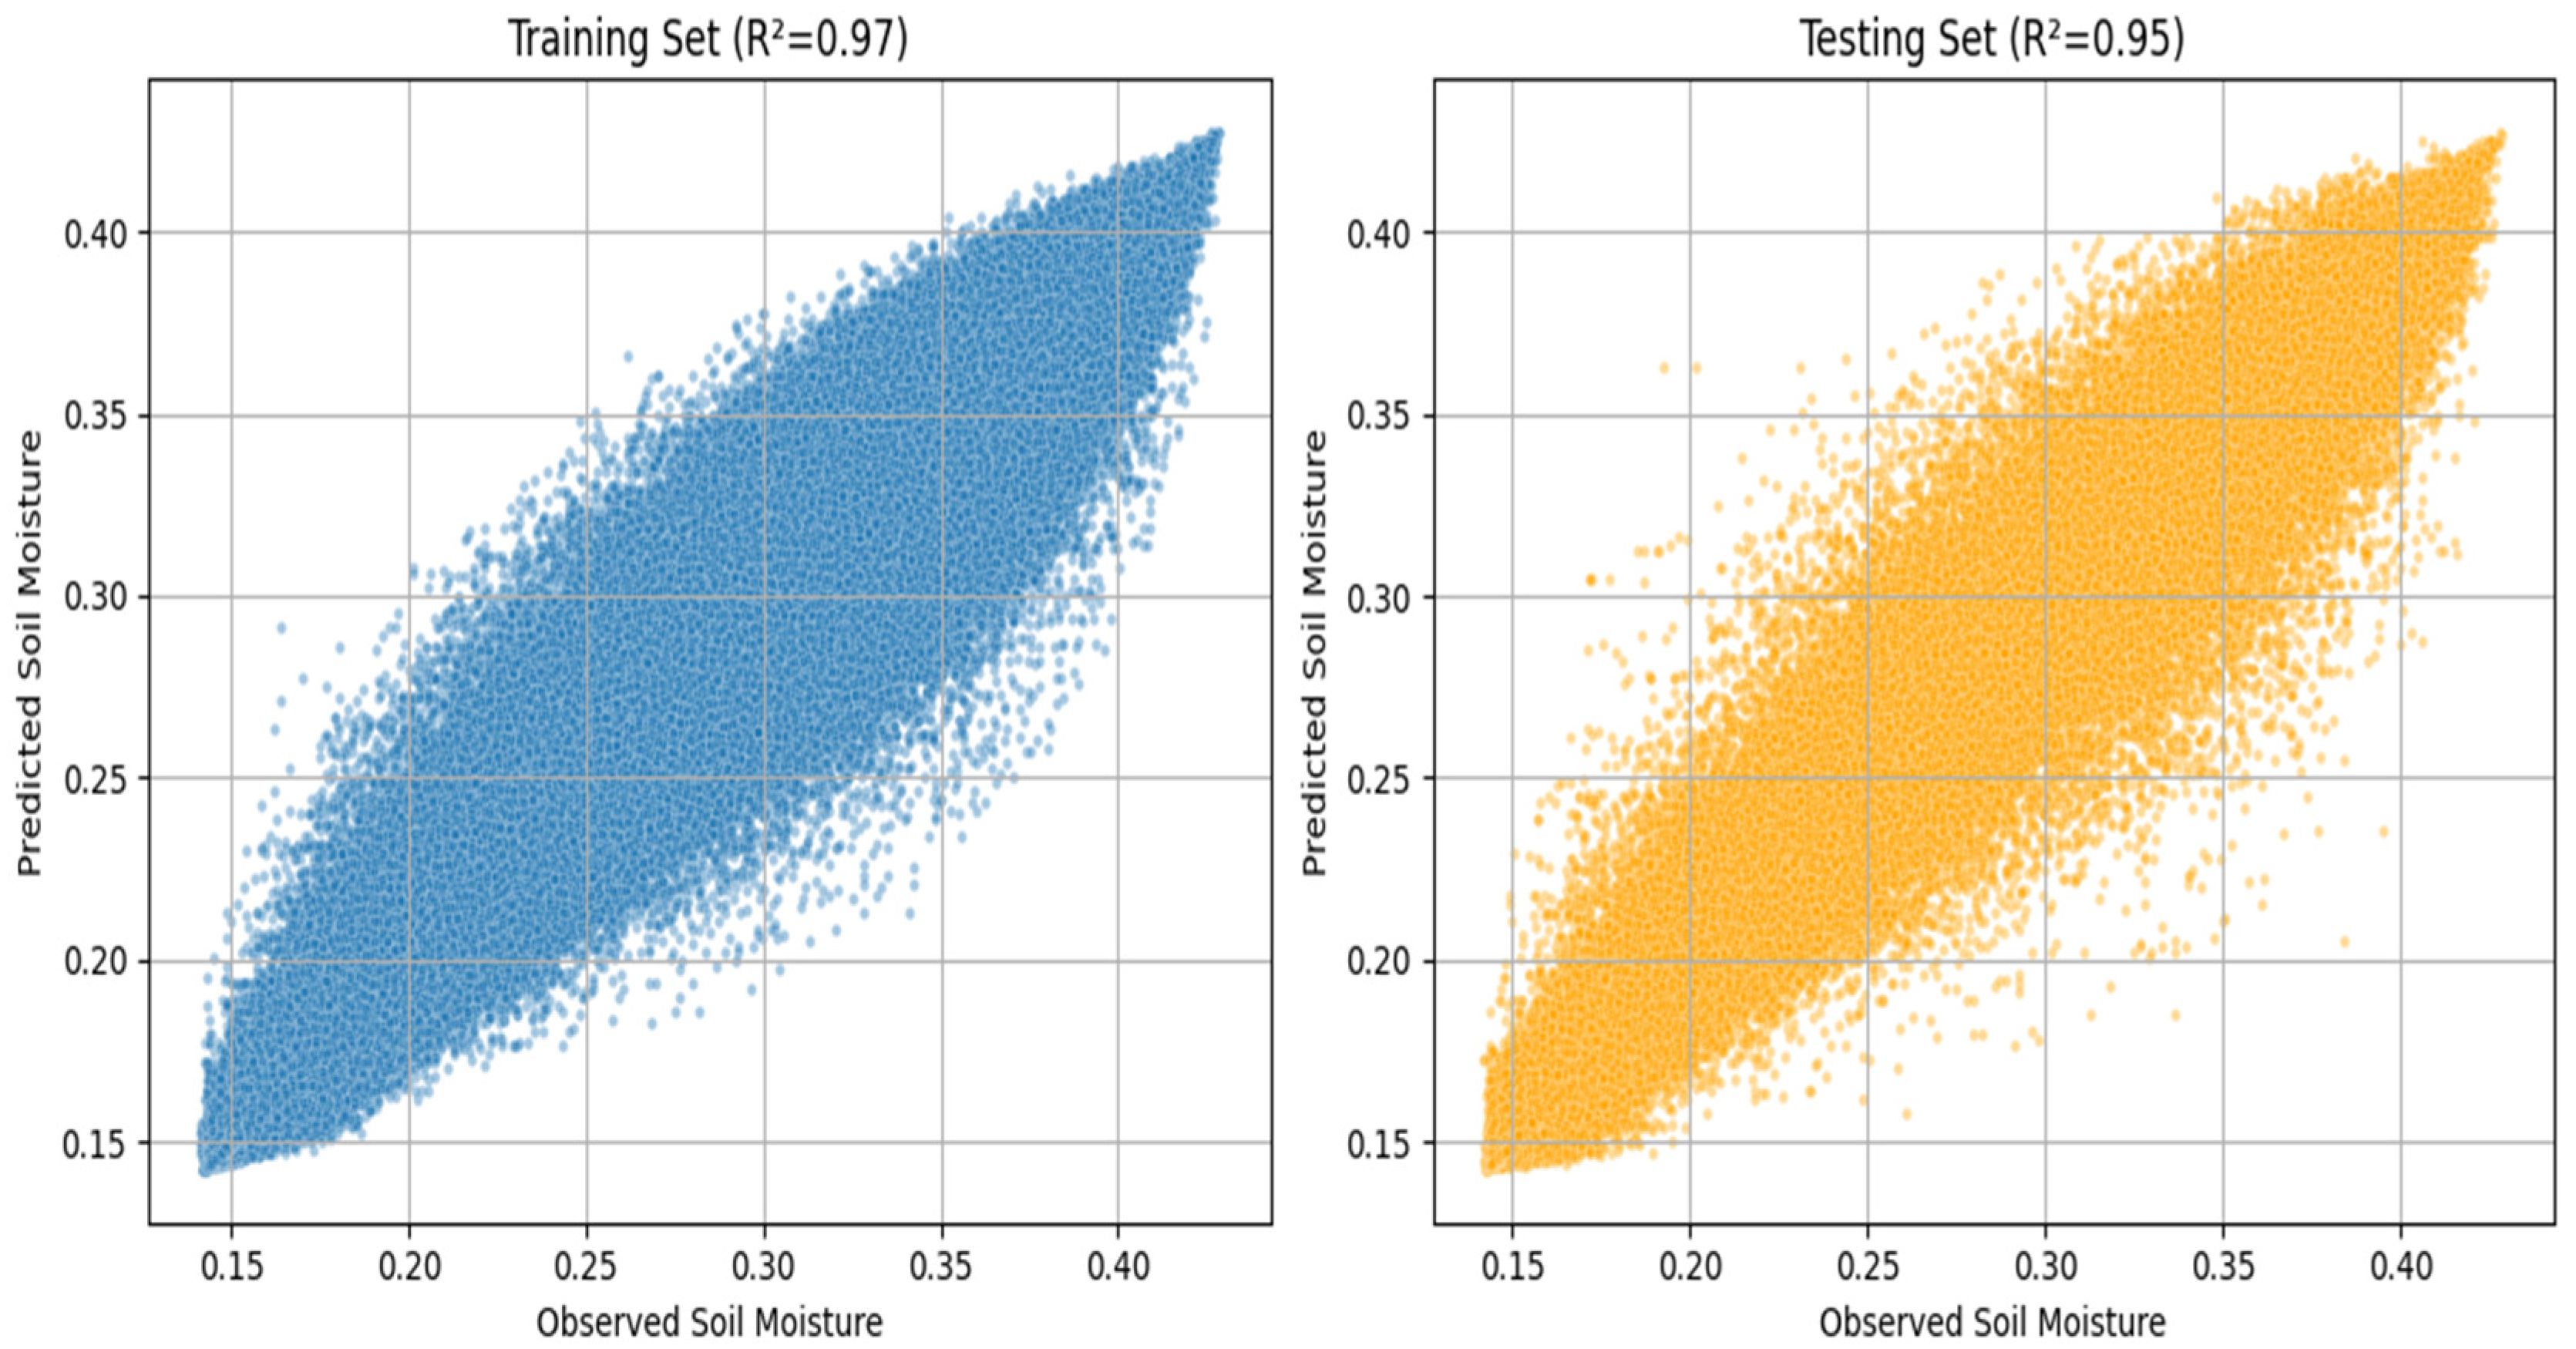
The RF model showed consistently high predictive accuracy across independent training and testing datasets (Table 3). Strong agreement between observed and predicted values, supported by scatter plots (Figure A1 and Figure A2), confirmed its stable and reliable performance.

3.2. Feature Importance Analysis of Drought Drivers

The results of the analyzed relative importance of predictor variables are presented in Table 4. The analysis revealed a distinct difference in the key drivers of agricultural versus hydrological drought. For agricultural drought, precipitation was the dominant predictor, with an importance score of 0.602, which was substantially higher than all other variables. Relative humidity was the second most important variable (0.150), followed by air temperature (0.098), surface wind speed (0.081), and shortwave radiation (0.070).
In contrast, for hydrological drought, air temperature was the most important predictor, with an importance score of 0.411. Precipitation had a moderate influence (0.186), with surface wind speed (0.148) and relative humidity (0.139) showing similar, lower levels of importance. Shortwave radiation was the least important variable for hydrological drought (0.115).

3.3. Trends of Agricultural Drought Event Under Changing Climate

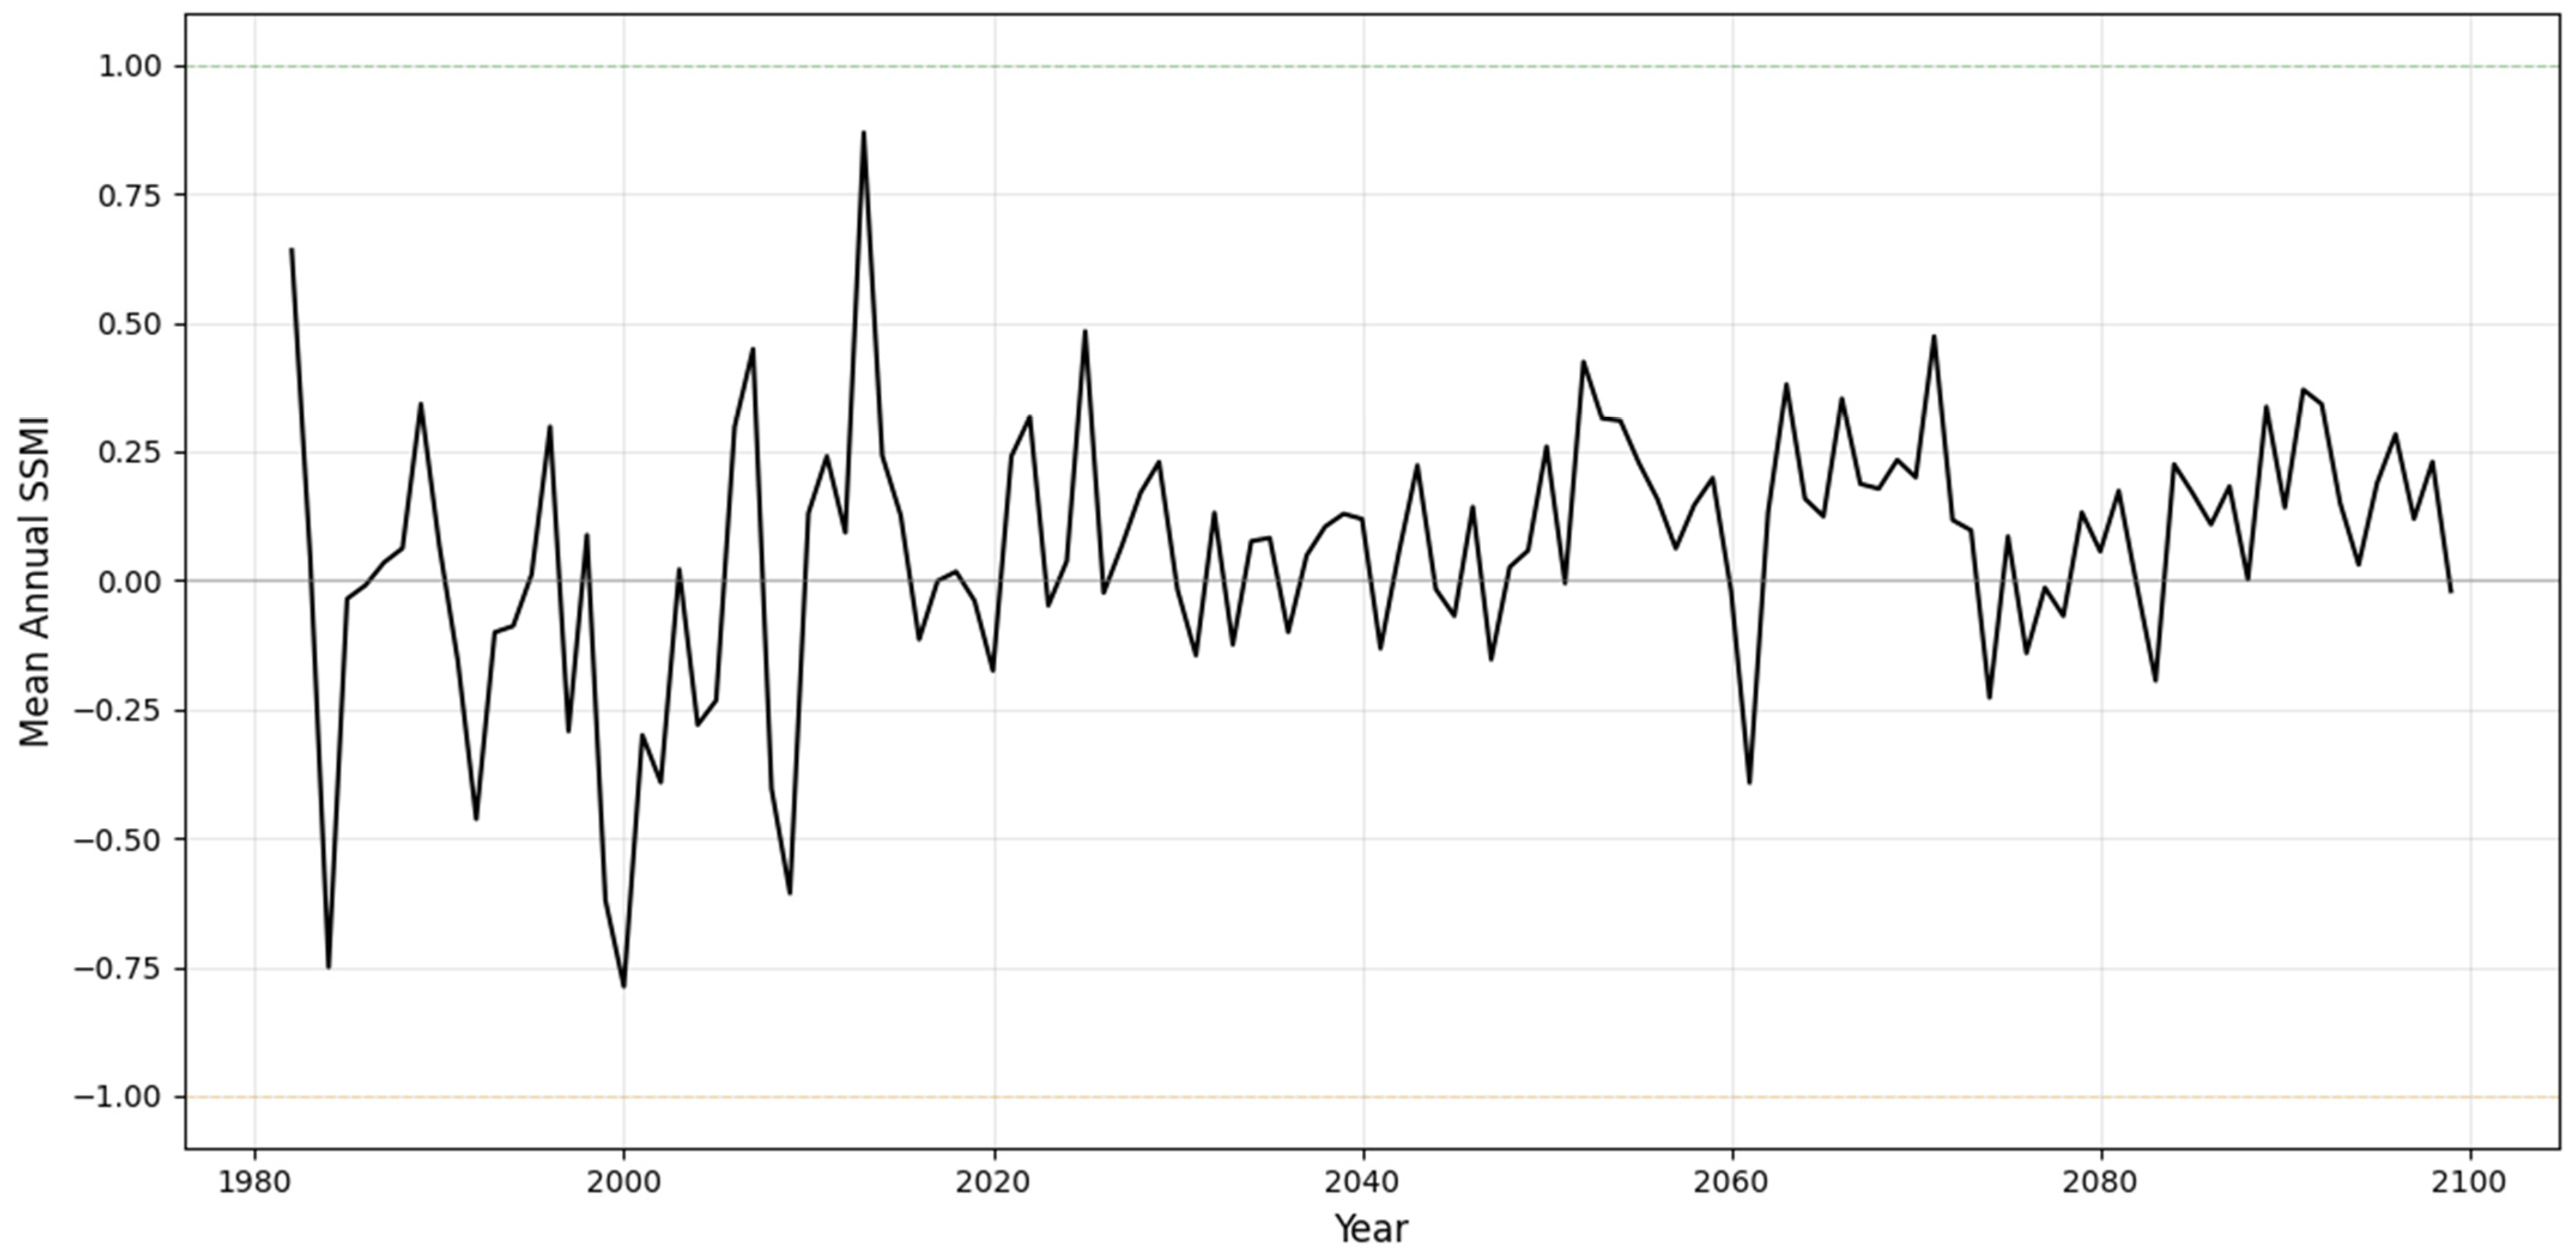
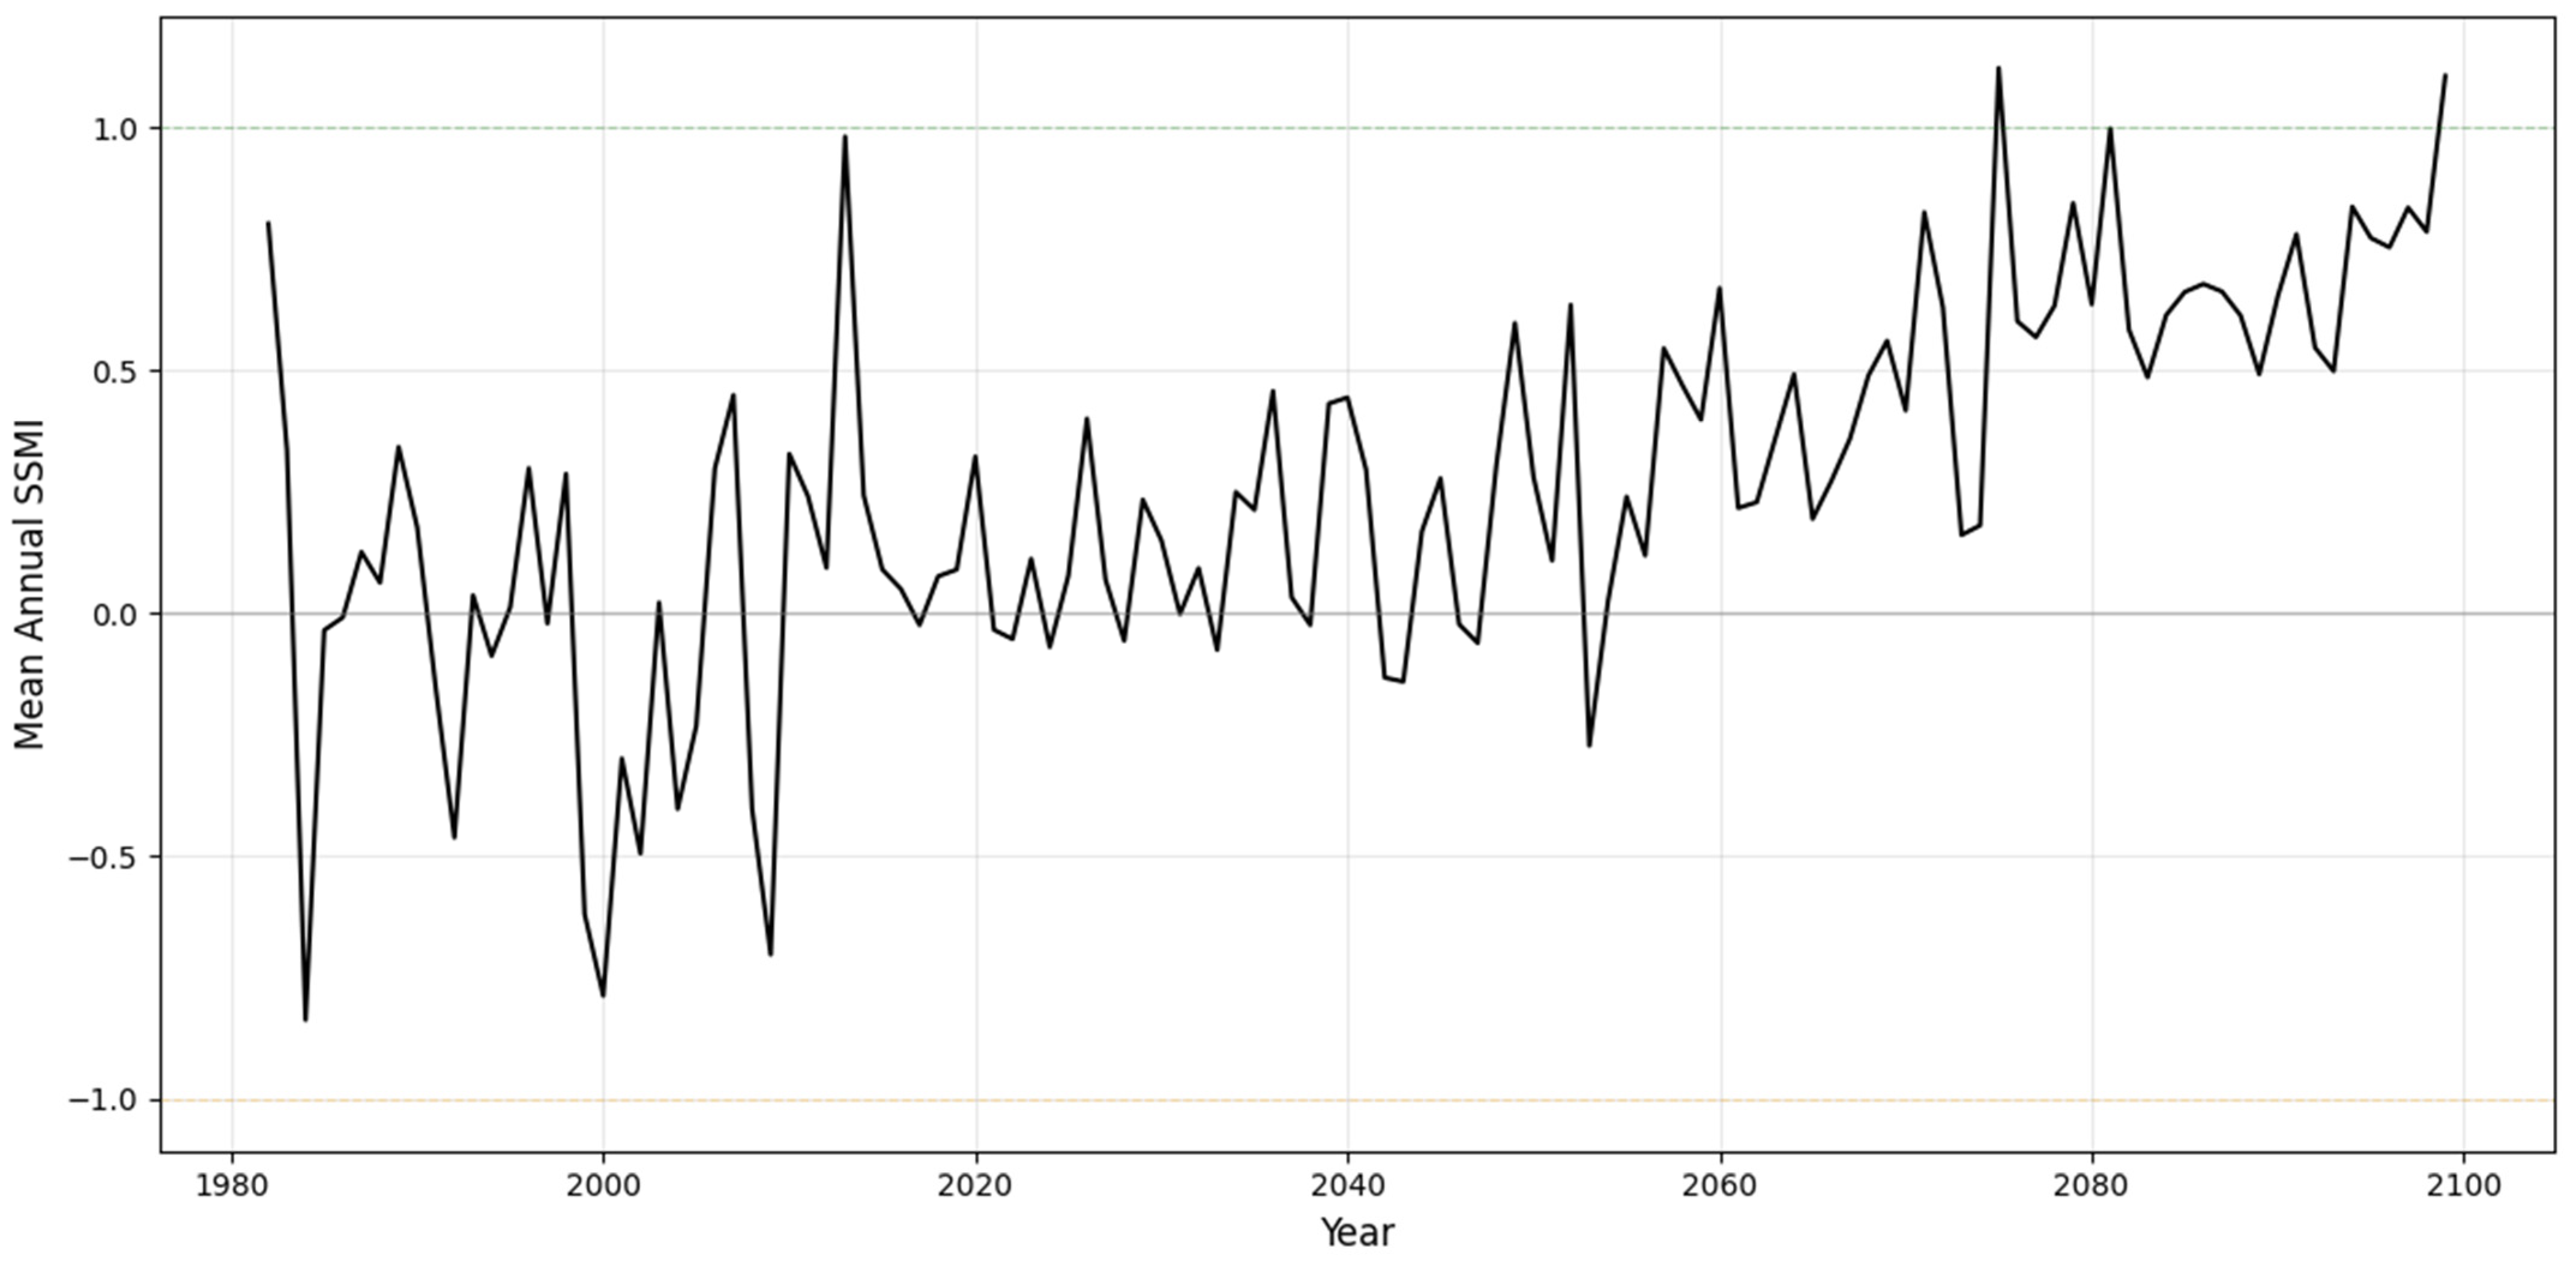
Trend analysis of the SSMI was conducted for the historical baseline (1982–2014) and future periods (2015–2100). Mann–Kendall trend and Sen’s slope analysis indicated no significant trend during the baseline period (Table 5). Under SSP2-4.5, a significant increasing trend in SSMI values (decrease of droughts) was detected in the mid-future, while the near- and far-future periods showed increasing but non-significant trends. The mean annual SSMI analysis conducted for historical and future periods under SSP2.45 climate scenario also showed this trend (Figure A3). Under SSP5-8.5, the mid-future exhibited a stronger significant increasing trend, whereas the near- and far-future trends were positive but not statistically significant. The mean annual SSMI analysis for both the historical and future periods under the SSP5-8.5 climate scenario revealed a similar trend (Figure A4).
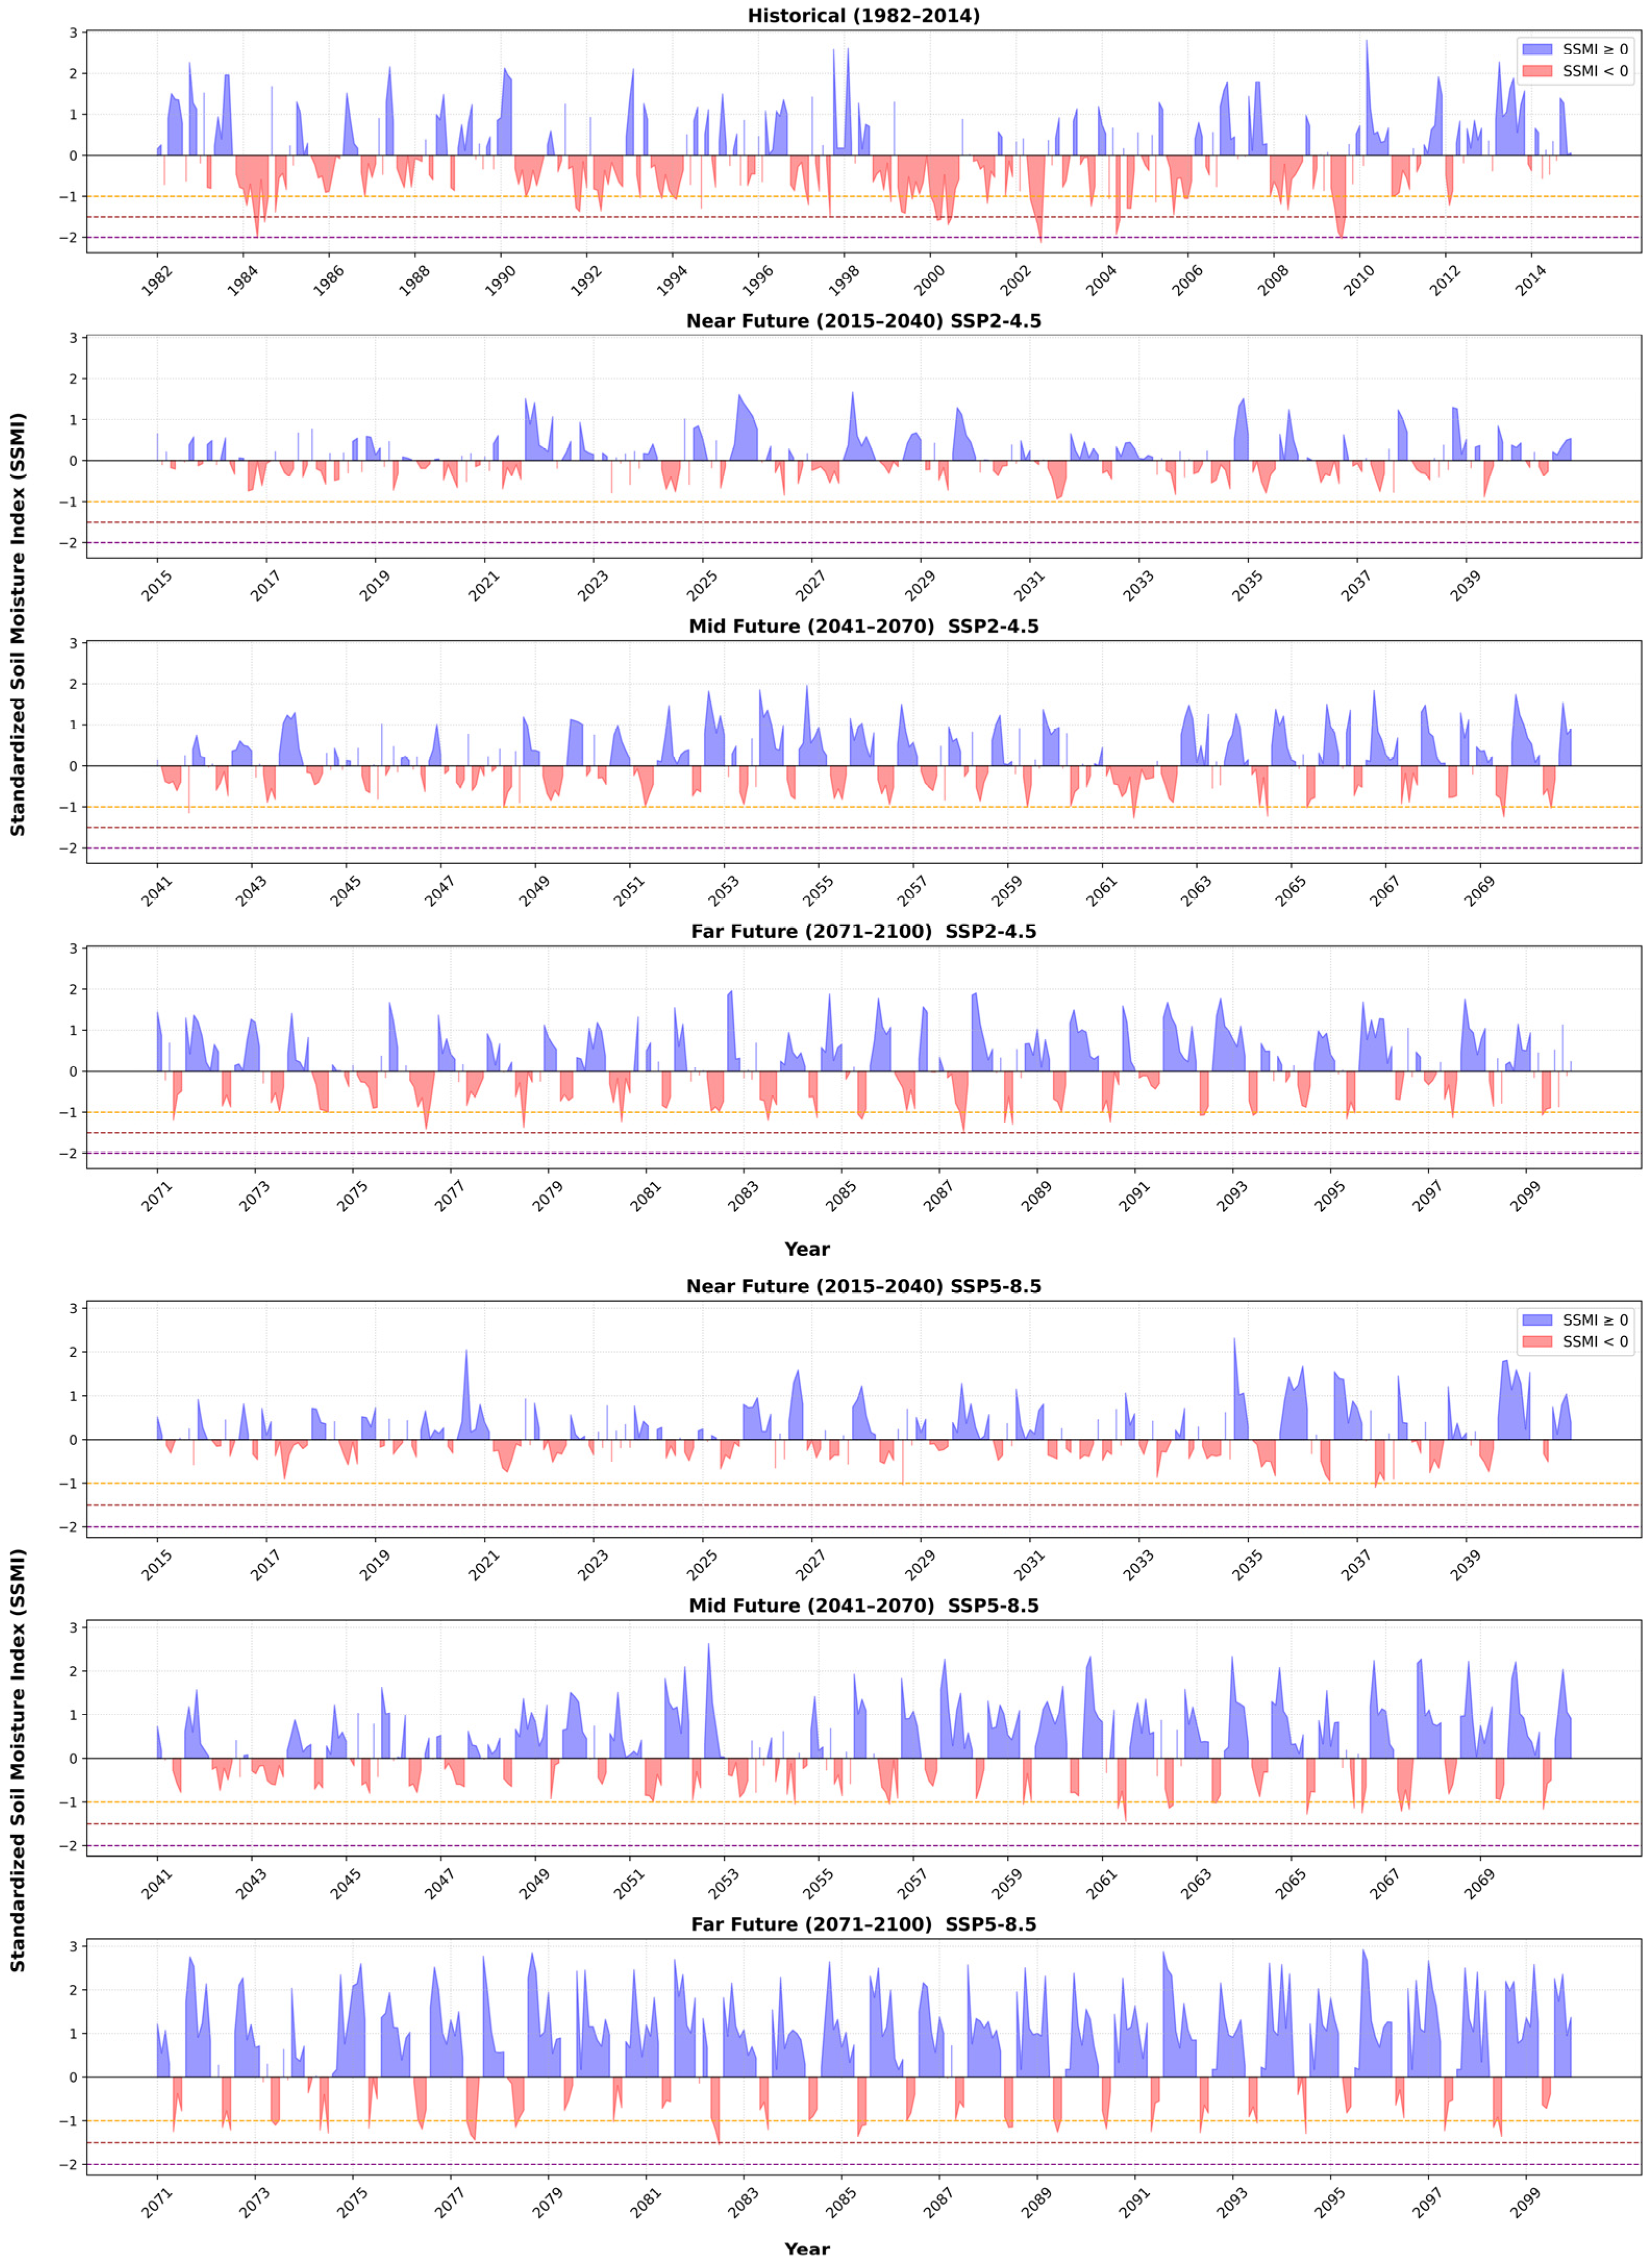
As illustrated in Figure 3, the baseline period recorded frequent negative SSMI values, with several events exceeding the moderate drought threshold (SSMI ≤ −1). Under SSP2-4.5, drought frequency decreased in the near future, increased again in the mid-future, and intensified further in the far future, with more events reaching severe thresholds (SSMI ≤ −1.5). Under SSP5-8.5, drought frequency remained high in the near future with multiple severe events, declined in the mid-future, and rose again in the far future with an increased recurrence of severe and extreme droughts.
Drought event characteristics summarized in Table 6, which are based on the ensemble mean of the 10 best-performing GCMs, showed clear differences between scenarios and periods (additional details in Supplementary Materials Tables S2 and S3). During the baseline, 34 events were detected with a mean duration of 1.3 months and mean severity of 1.7. Under SSP2-4.5, no events occurred in the near future, while 10 events were observed in the mid-future and 16 in the far future, with slightly higher severity and duration compared to the baseline. In contrast, SSP5-8.5 projected 33 events in the near future with greater severity (mean 2.0) and intensity (mean 1.3). Drought frequency declined to 2 events in the mid-future but increased to 19 in the far future, with longer durations and higher severity than under SSP2-4.5.
Overall, SSP5-8.5 projected higher drought activity and persistence than SSP2-4.5, particularly in the mid- and far-future periods, while drought intensities remained within the moderate range across all scenarios.
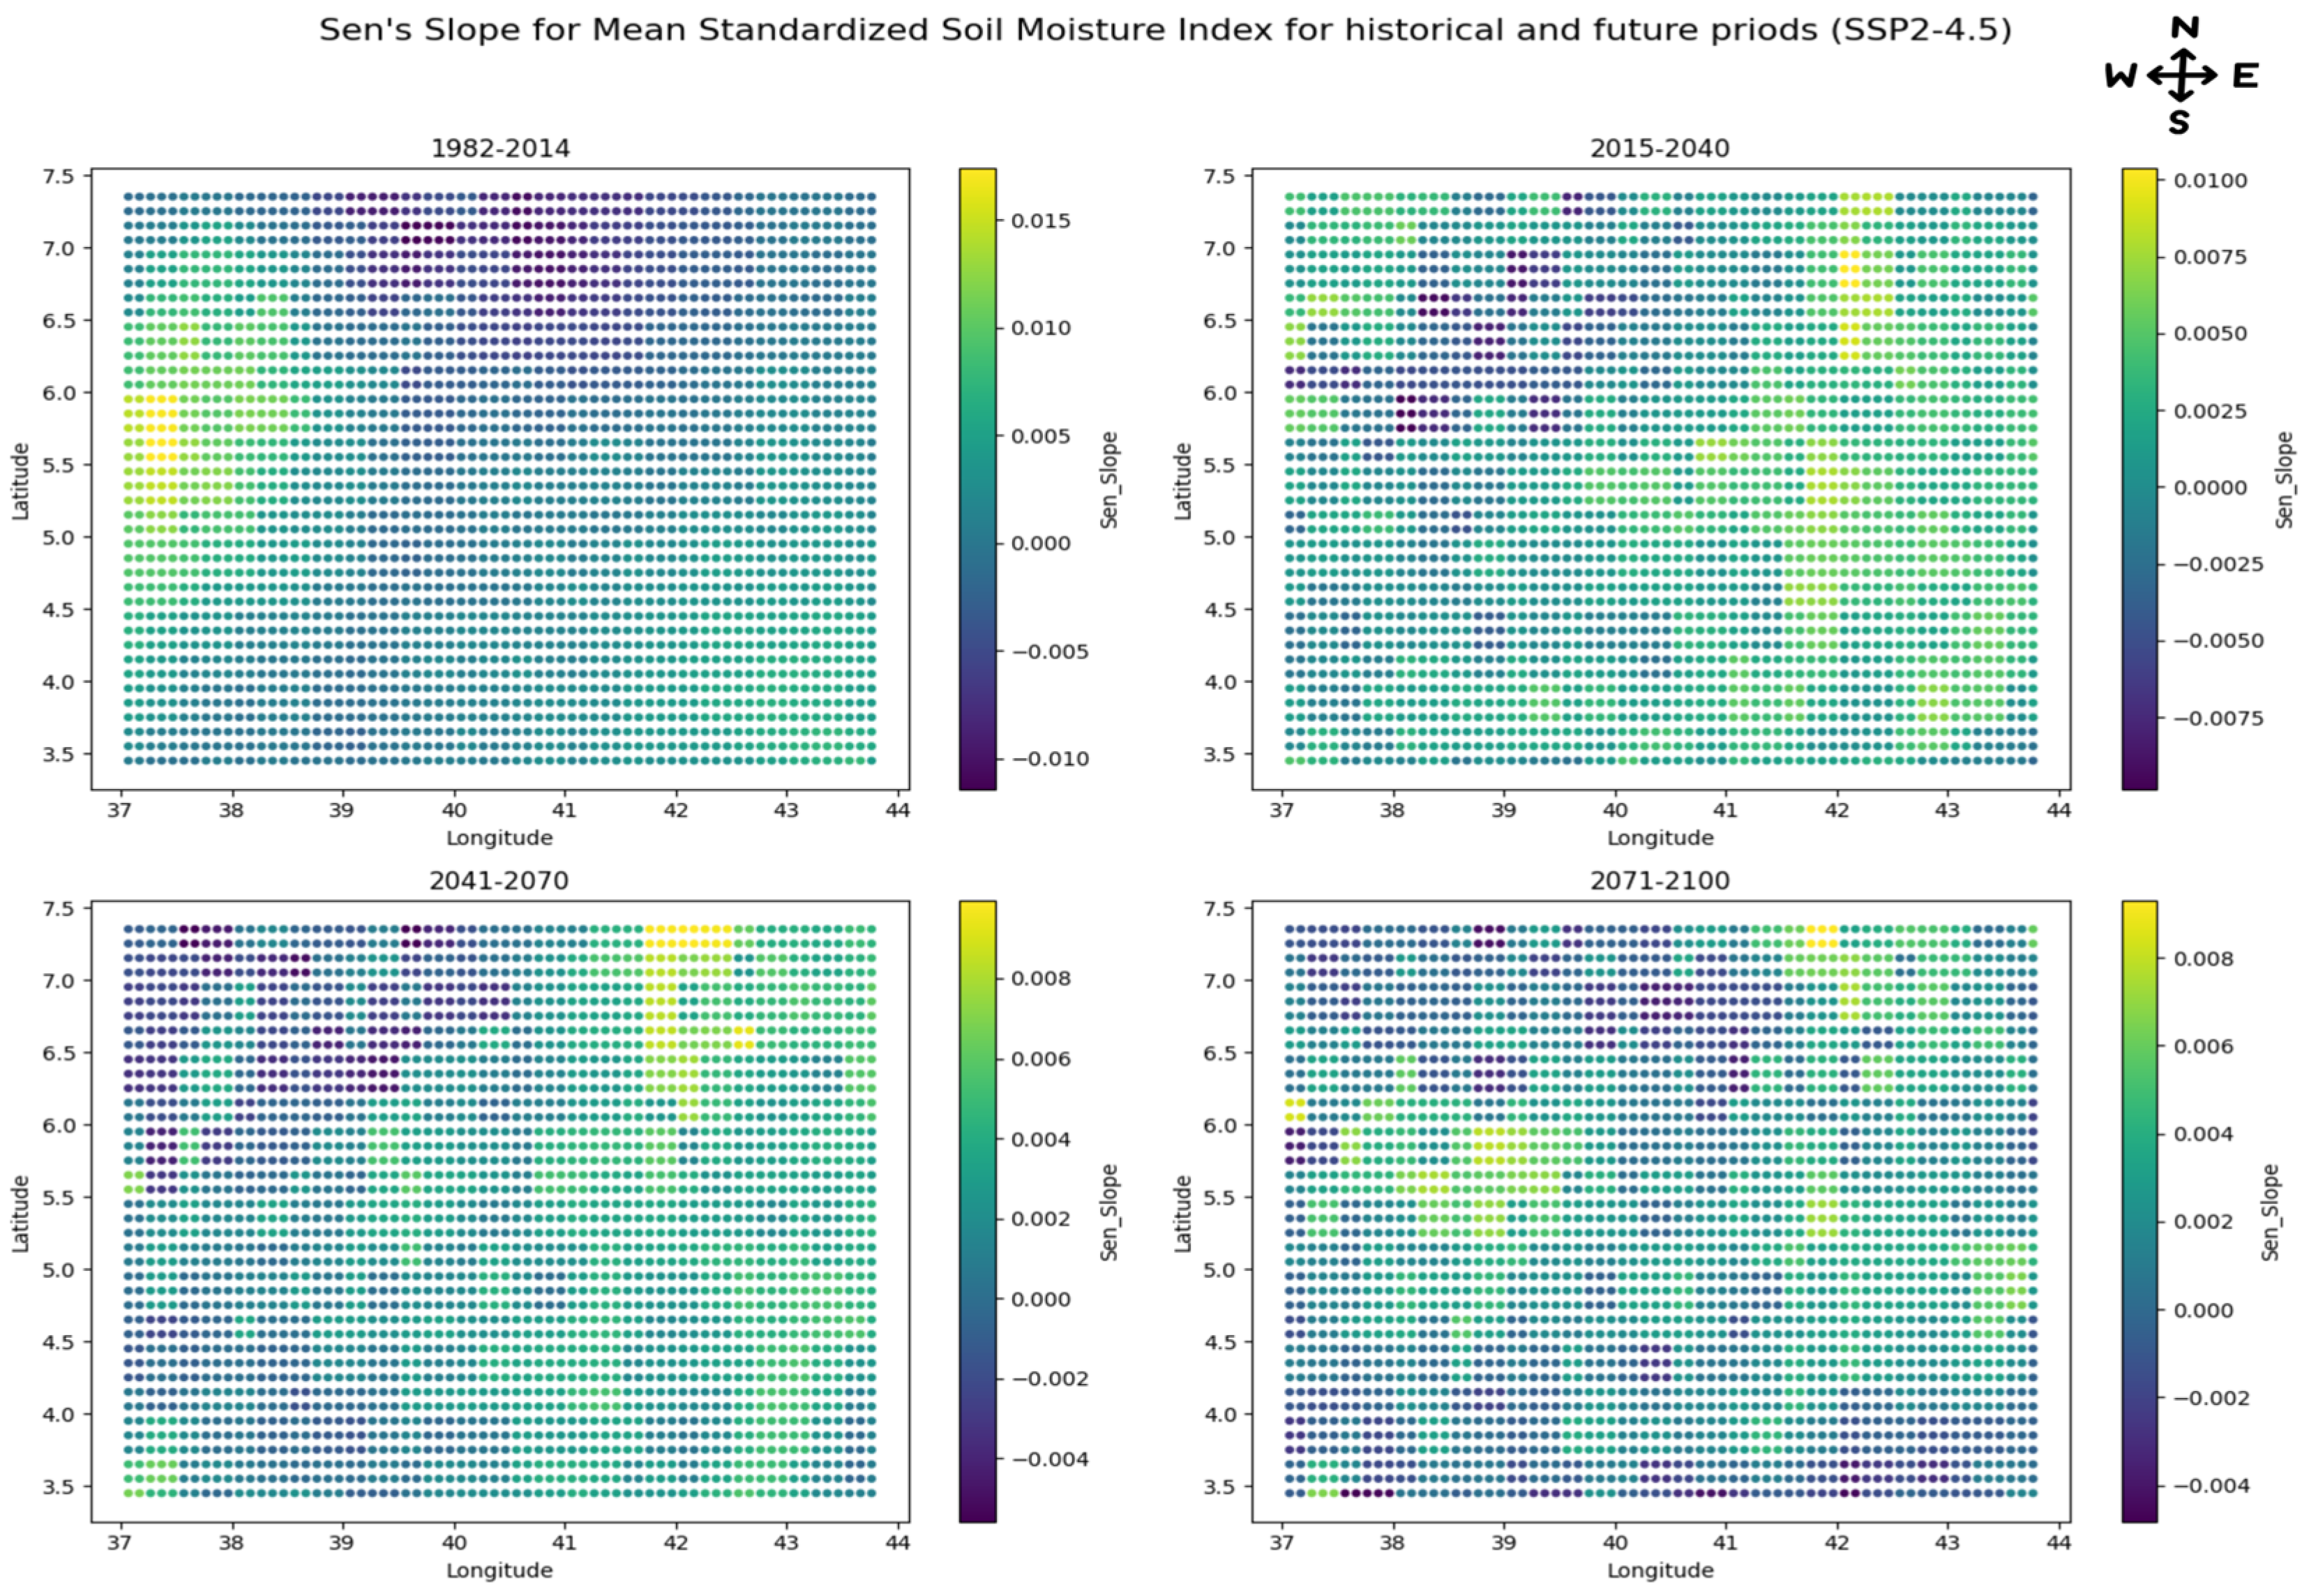
Trend analysis using Sen’s slope estimator revealed distinct spatial variations in the agricultural drought determined using mean annual SSMI across the historical and future climate scenarios for SSP2-4.5 (Figure 4). During the historical period, both positive and negative Sen’s slopes were observed across the basin. Regions in the western and northwestern parts showed predominantly positive slopes, indicating a gradual increase in SSMI and thus a wetter trend. In contrast, negative slopes were detected in the central and northeastern zones, reflecting a decline in soil moisture and a drier tendency.
In the near-future period, spatial patterns remained heterogeneous. Patches of positive slopes appeared along the western and southeastern boundaries, while negative slopes became more widespread in the central and northern portions. Overall, the spatial distribution suggested a slight drying tendency compared to the historical period.
The mid-future period exhibited a mixed pattern, with weakly positive slopes across most areas and localized negative zones mainly in the southern and eastern sectors. The generally low magnitude of Sen’s slopes indicated mild spatial variability in SSMI trends during this time. By the far-future period, a noticeable shift toward positive slopes was observed, especially across the central and western parts of the basin. Only a few isolated areas in the northeast showed negative trends. This pattern indicated that soil moisture conditions were projected to improve, with a dominance of increasing SSMI values across large portions of the basin.
Overall, spatial trend analysis based on Sen’s slope demonstrated that historical soil moisture conditions exhibited both wetting and drying tendencies, while future projections under SSP58.5 showed a gradual shift toward wetter conditions, particularly in the mid- to late-century periods.
The Sen’s slope analysis revealed distinct spatial variations in the agricultural drought intensity across the historical and projected periods under the SSP5-8.5 scenario (Figure 5). During the historical period, positive Sen’s slope values dominated the western and central parts of the study area, indicating increasing soil moisture and a wetter tendency. In contrast, localized negative slopes appeared in the northern and northeastern zones, reflecting areas of decreasing soil moisture. In the near-future period, the spatial distribution exhibited a mixture of positive and negative slopes. Moderate increases in SSMI were observed in the western and southeastern parts, while central and northern regions showed negative slopes, indicating localized drying conditions. The spatial pattern appeared more heterogeneous compared with the historical baseline.
During the mid-future period, most areas displayed positive Sen’s slope values, particularly across the southern and northwestern parts of the study region. Only limited portions of the northeast exhibited negative slopes, suggesting isolated drying trends. By the far-future period, the distribution of Sen’s slope values remained largely positive, with the western, southern, and eastern parts showing consistent wetting trends. However, the magnitude of positive slopes slightly decreased in some central areas, indicating moderate spatial variability in future soil moisture changes.
Overall, the spatial patterns under SSP5-8.5 showed that soil moisture conditions were projected to remain relatively stable or wetter in most regions throughout the century, with minor drying tendencies confined mainly to the northern and central zones.
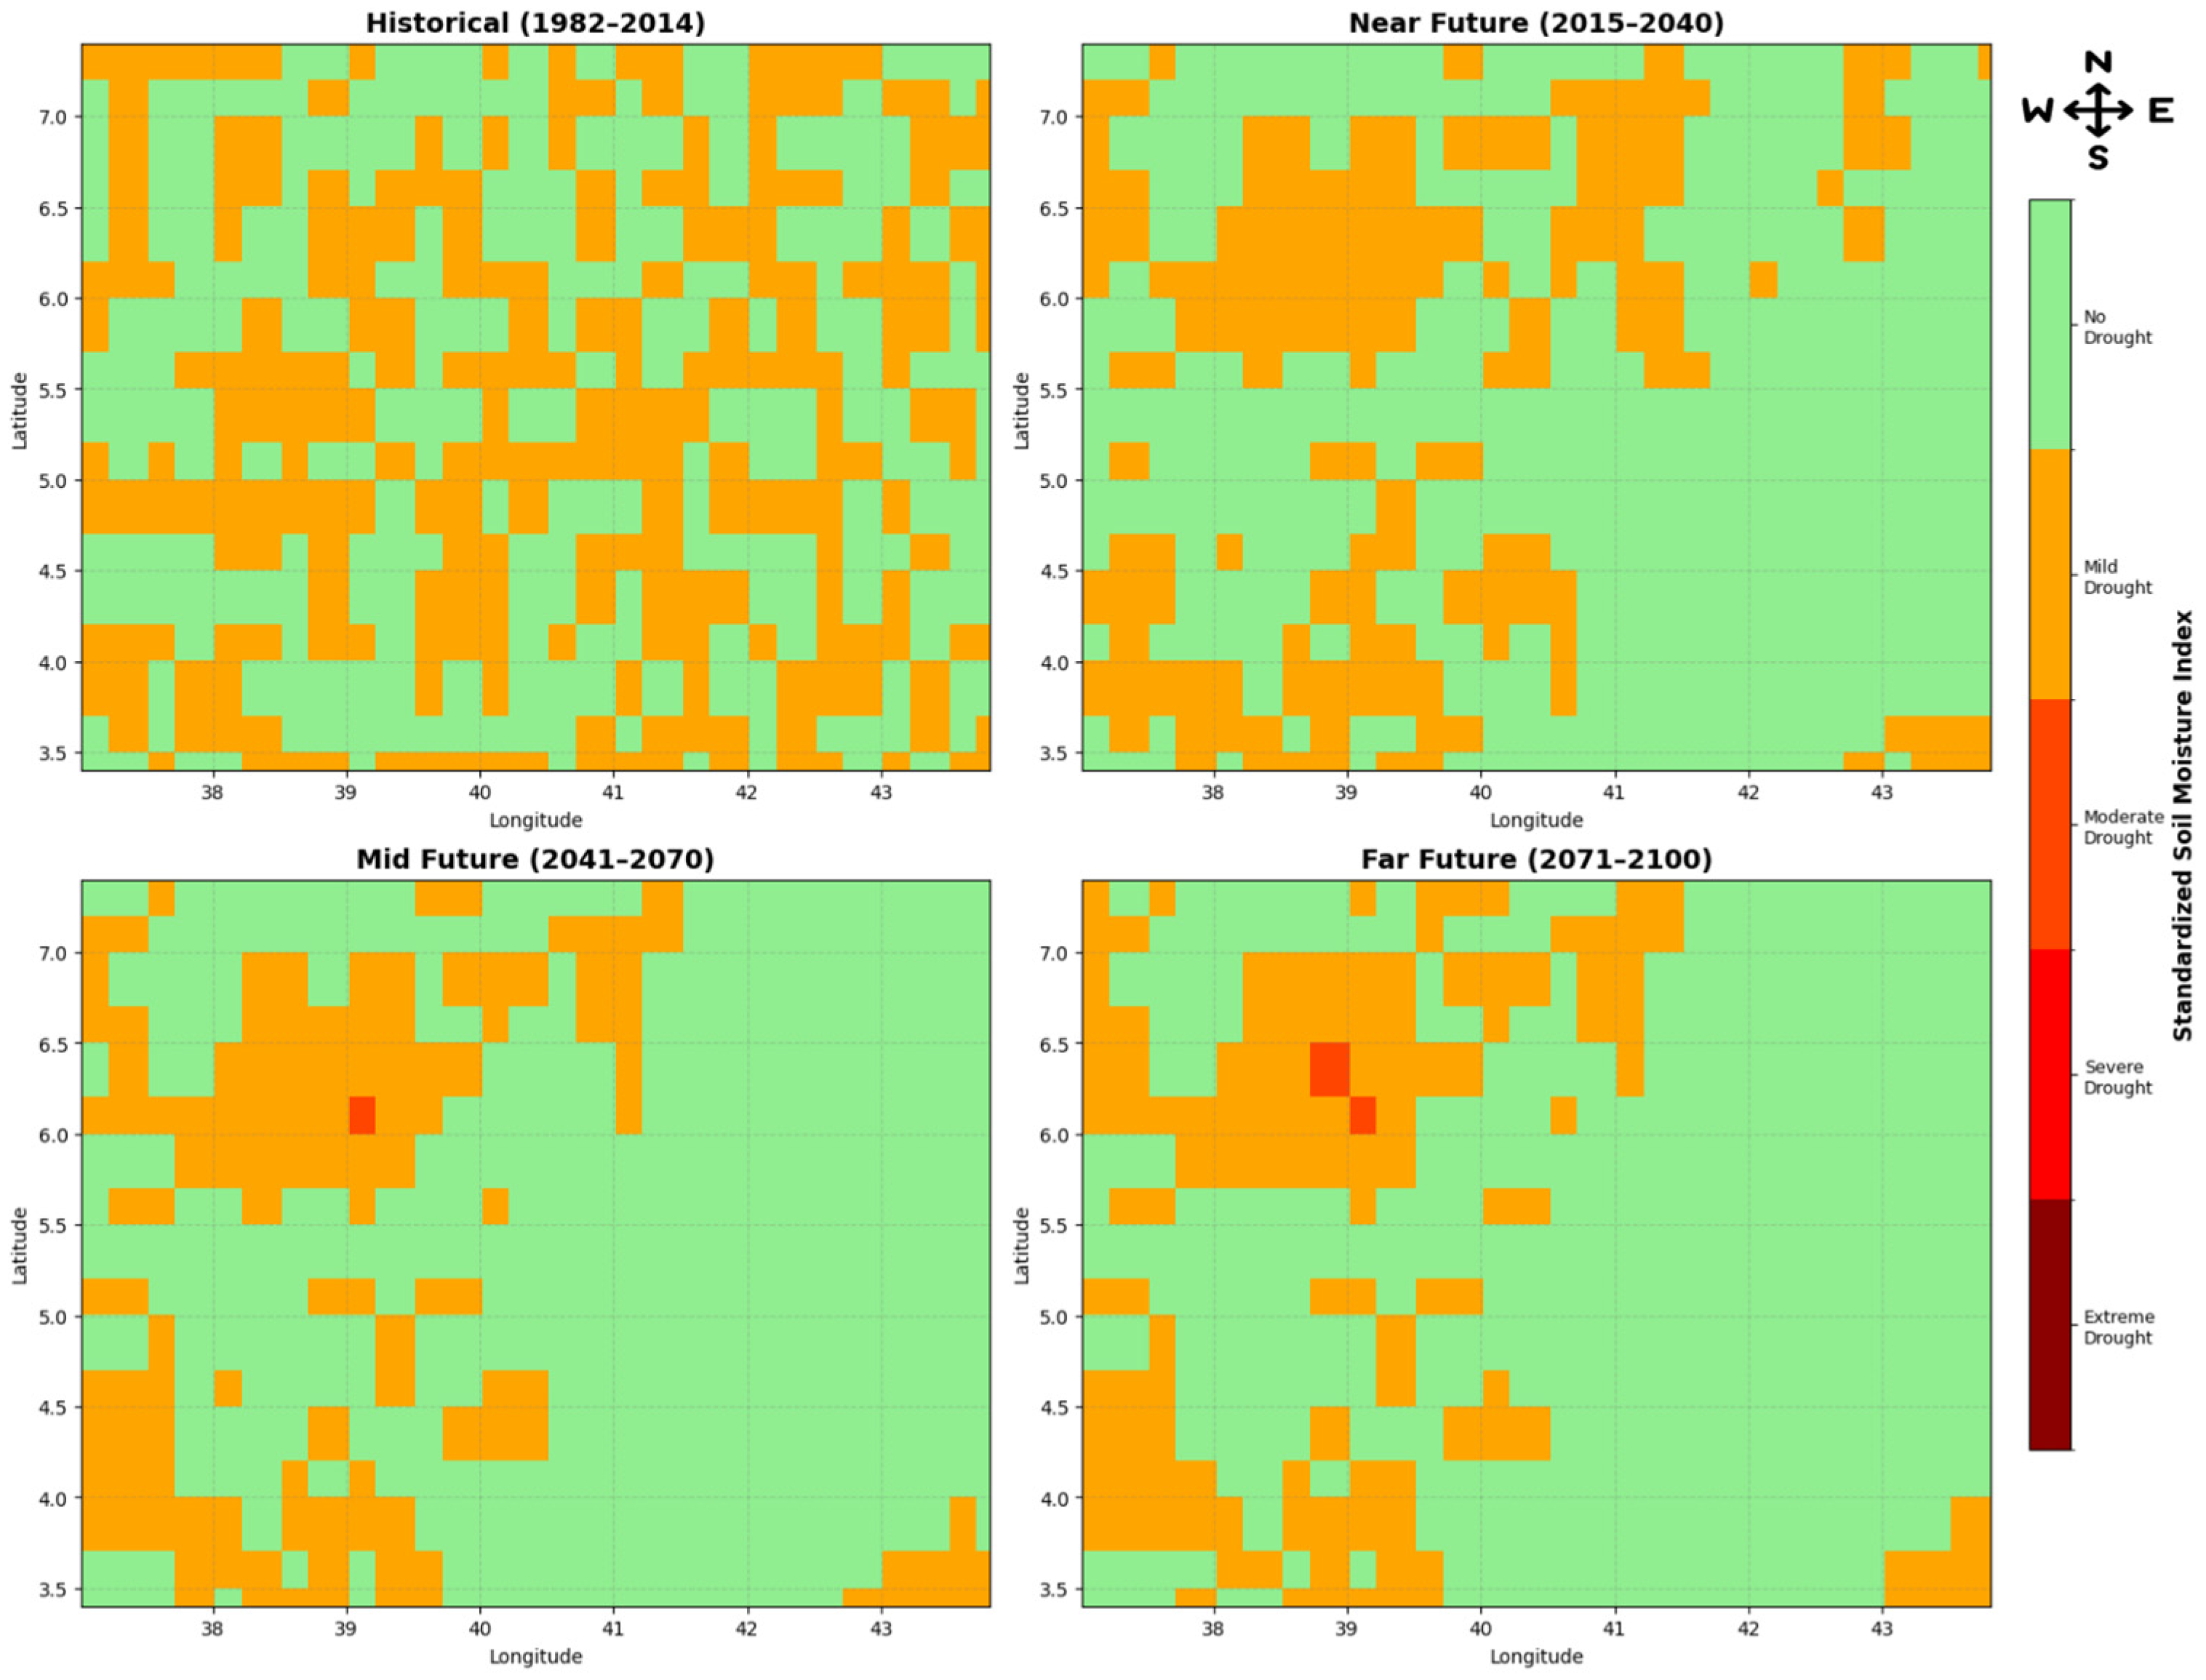
Figure 6 shows the spatial distribution of drought classes for the historical and projected future periods under the SSP2-4.5 scenario. In the historical period, mild drought occurred across much of the region, while large portions remained drought-free. Moderate drought was limited and localized. In the near future, drought-free areas expanded, although mild drought persisted in the central and eastern zones with isolated moderate drought patches. In the mid-future, no-drought conditions dominated, but mild drought pockets and small clusters of moderate droughts were present, particularly in the northwest. In the far future, most of the region remained free from drought, but localized hotspots of moderate to severe drought developed in the central and northern areas, with extreme drought emerging only in very limited zones. Overall, the SSP2-4.5 scenario showed a predominance of no-drought and mild drought conditions, with increasing spatial concentration of moderate to severe drought in later periods.
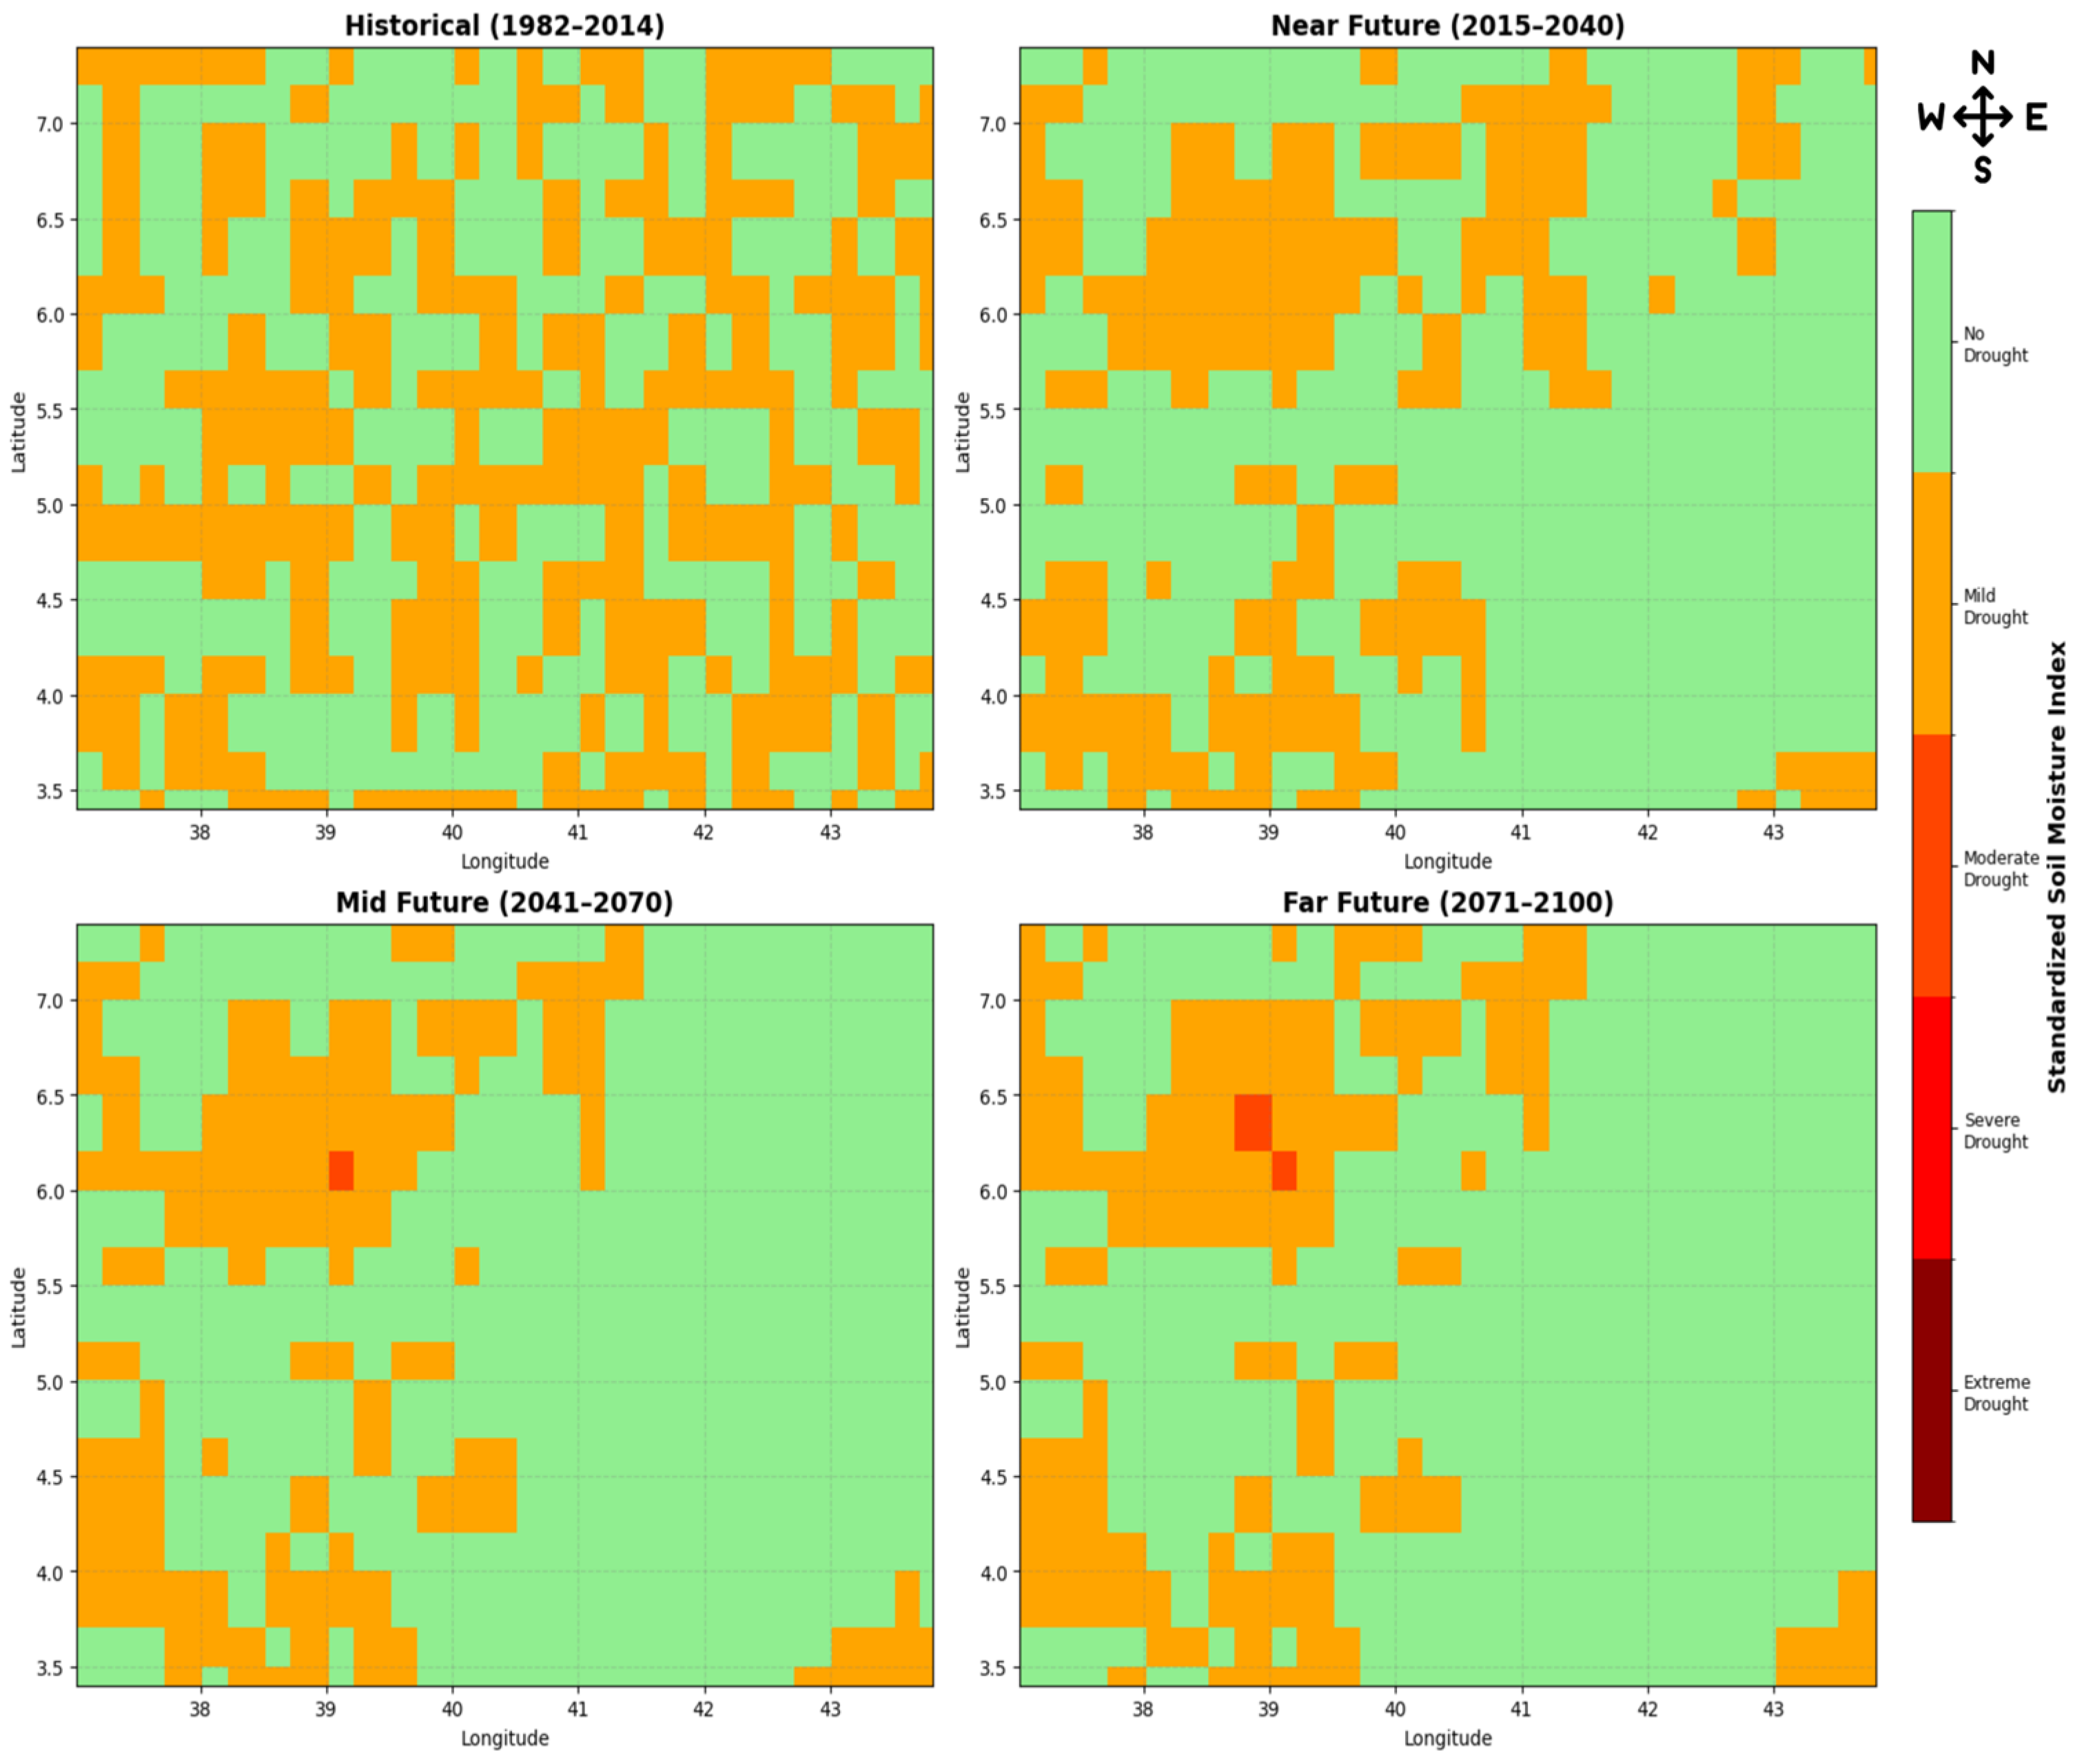
Figure 7 illustrates the spatial distribution of drought classes derived from the SSMI for the historical and projected periods under the SSP5-8.5 scenario. In the historical period, mild drought was widespread across the region, with no-drought conditions covering substantial portions and only a few scattered moderate drought patches. In the near future, mild drought expands across the northern and eastern zones, while moderate drought appears more frequently compared to the baseline. By the mid-future, the region shows a clear intensification of drought conditions, with larger areas experiencing moderate drought and localized occurrences of severe drought, especially in the north-central sector. In the far future, drought severity is projected to increase further, with mild drought still dominant but with expanded patches of moderate to severe drought, and isolated hotspots of extreme drought emerging. Overall, under SSP5-8.5, the region shows a progression toward more severe drought conditions with time, contrasting with the baseline where drought was mostly mild and scattered.

3.4. Trends of Hydrological Drought Event Under Changing Climate

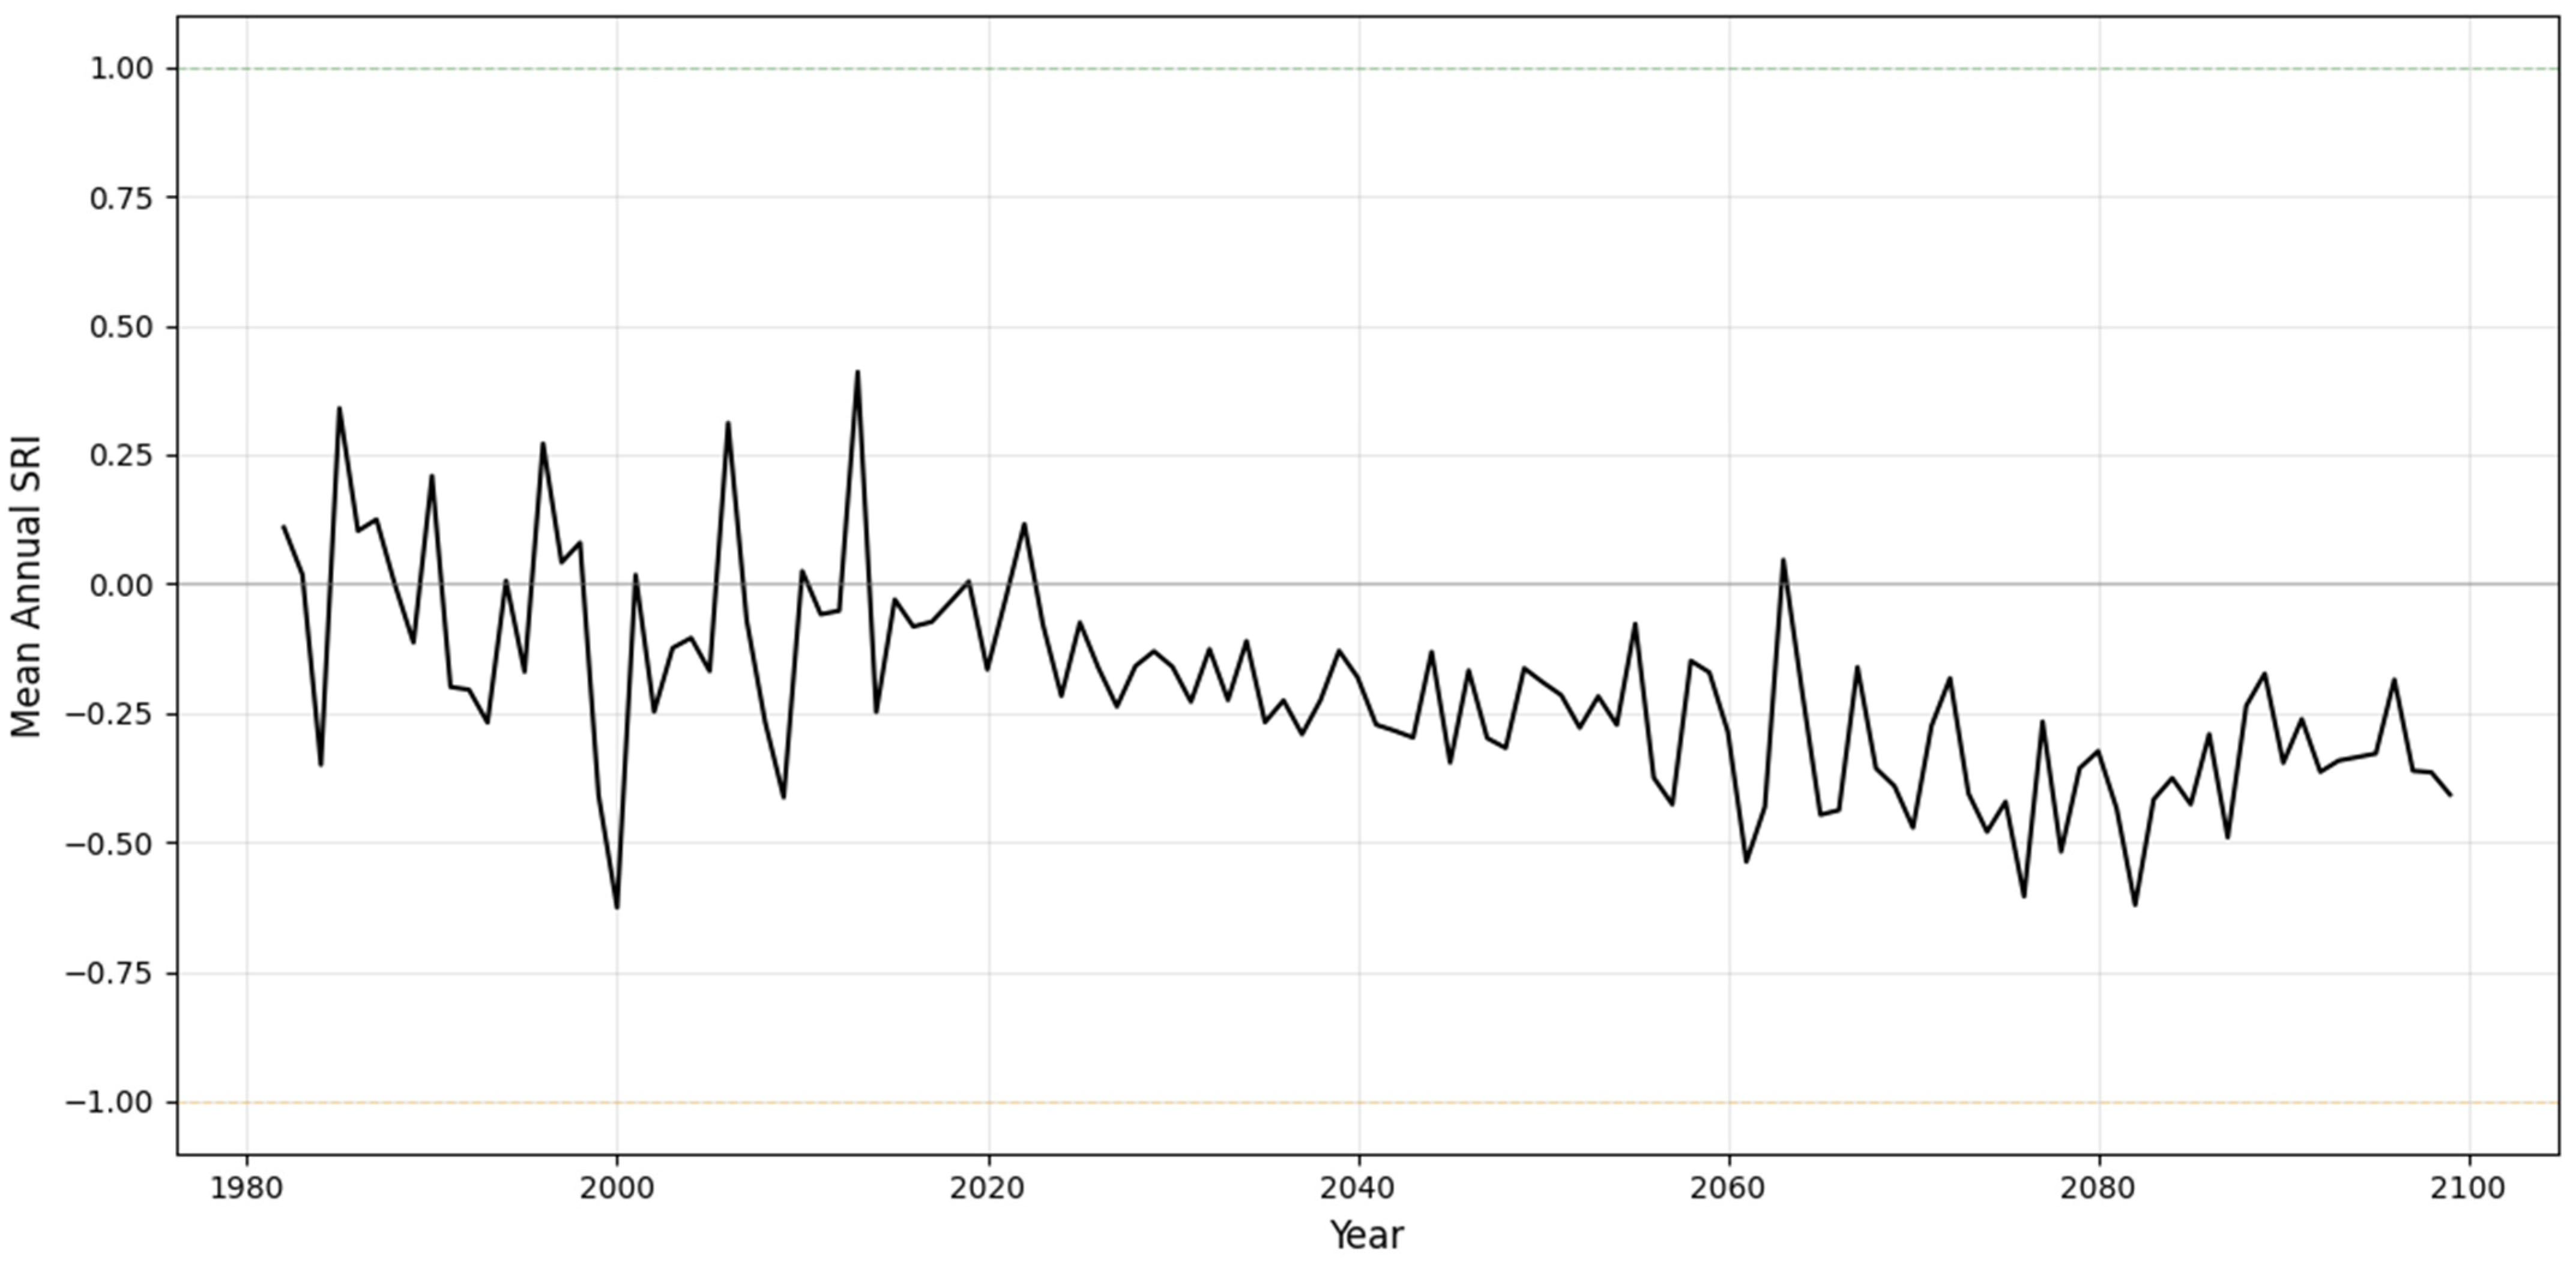
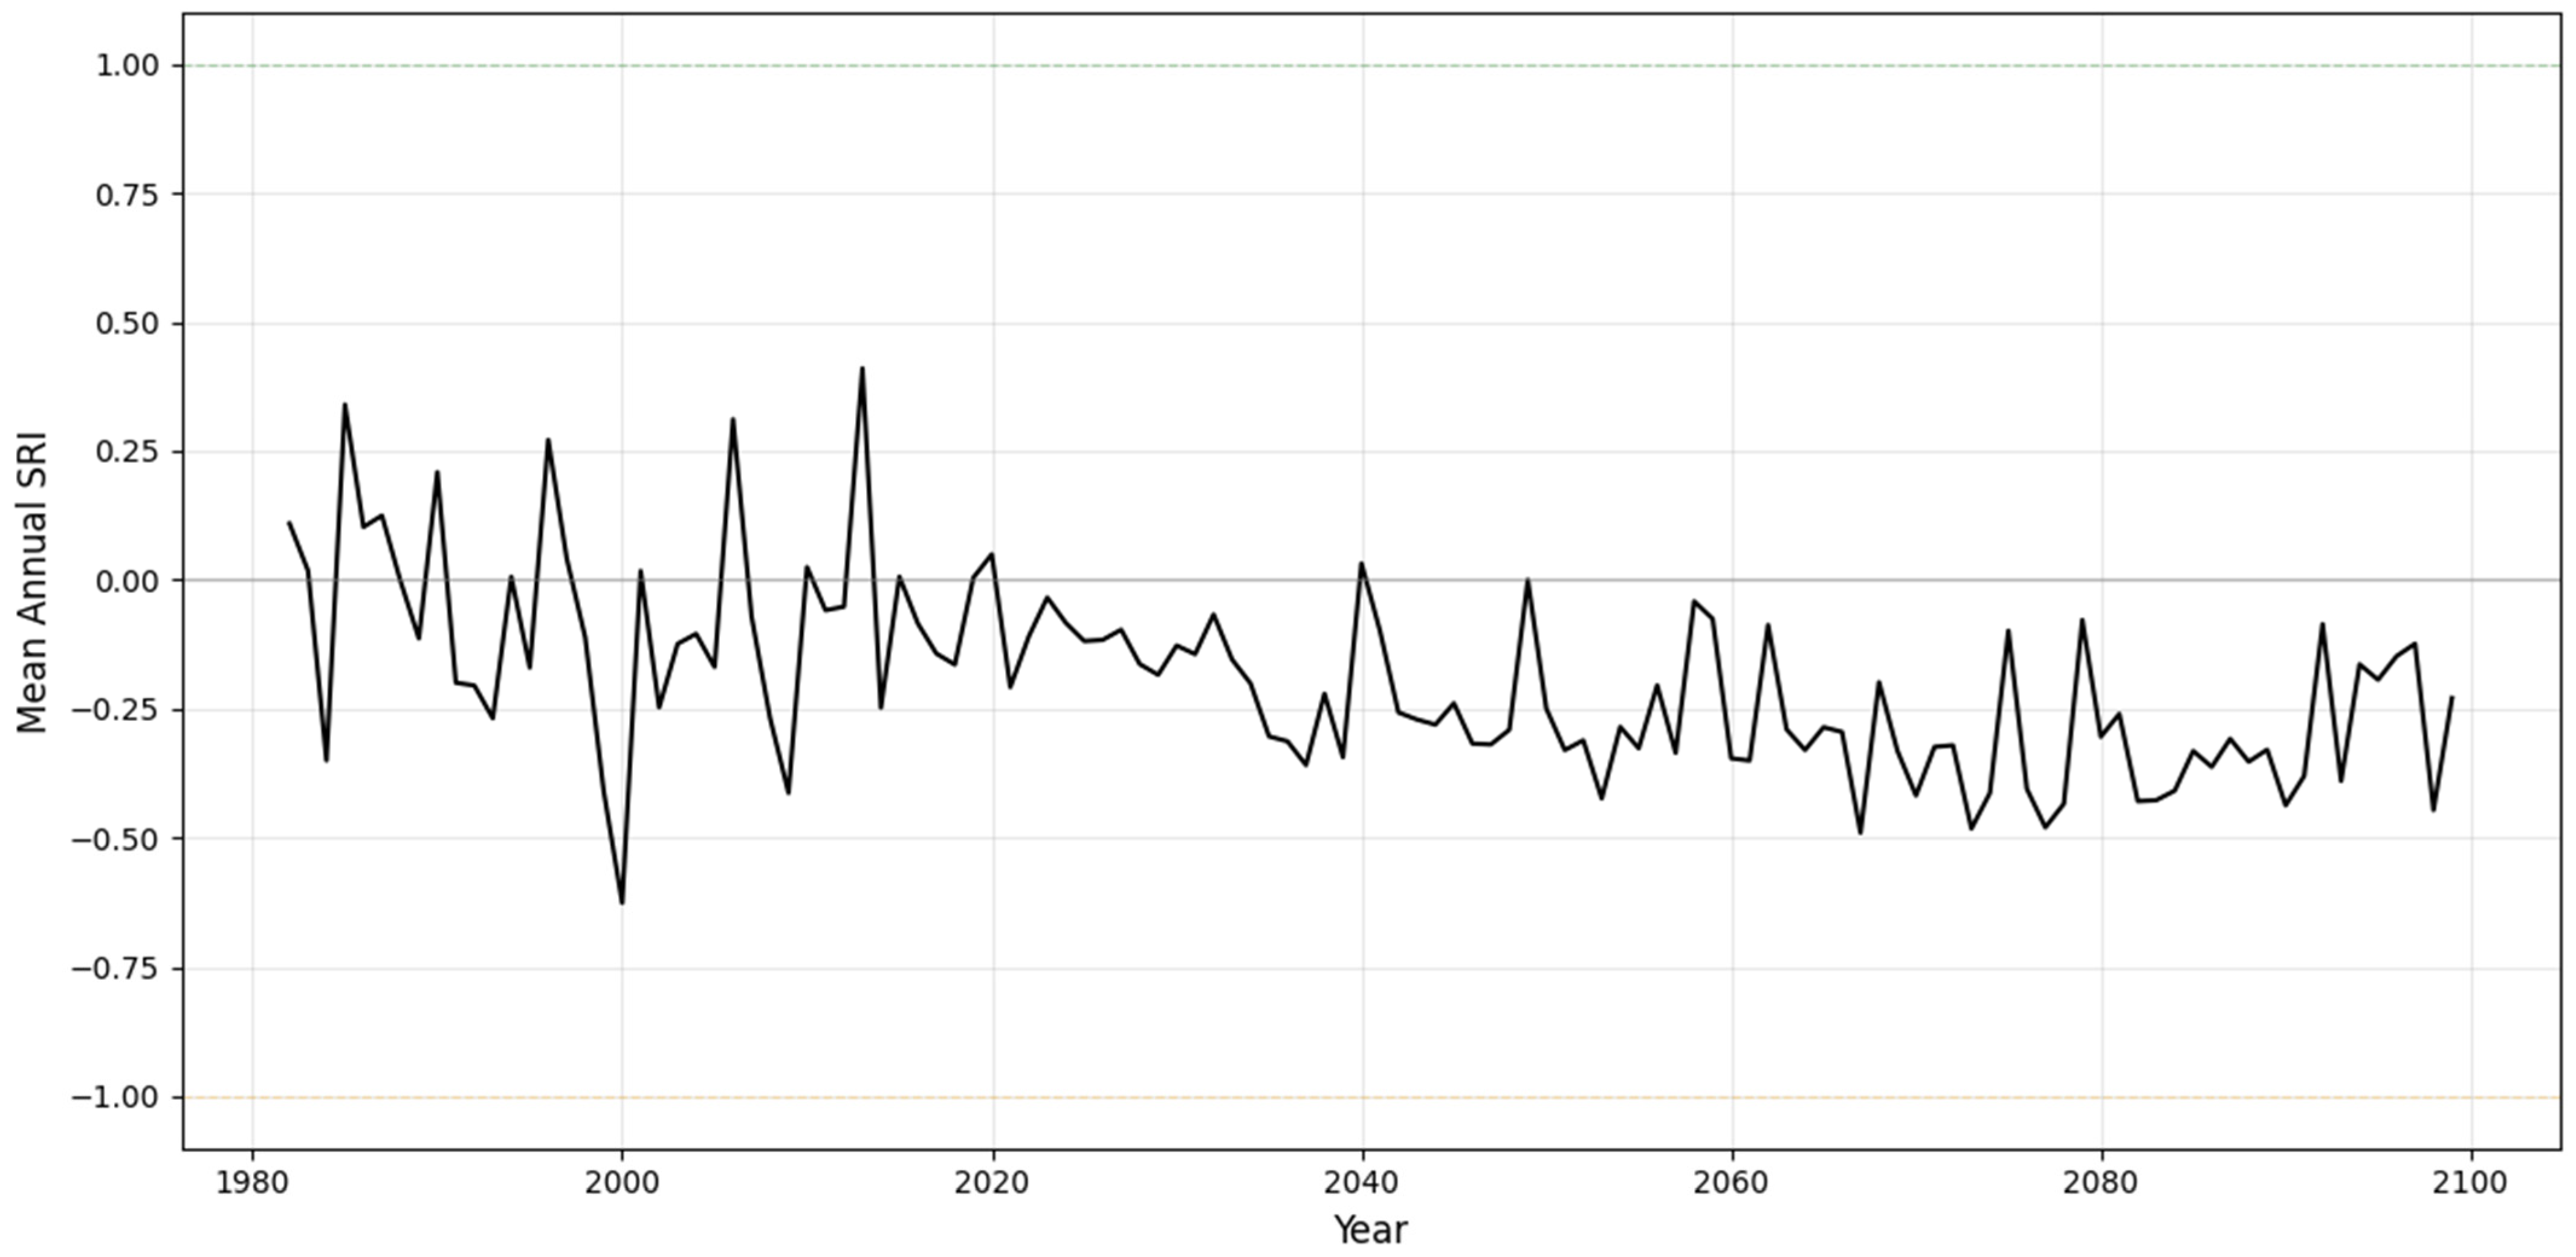
Hydrological drought was assessed using the SRI under the historical (1982–2014) and future periods (2015–2100). The Mann–Kendall trend and Sen’s slope analysis showed no significant trend during the historical baseline (Table 7). Under SSP2-4.5, a significant decreasing trend in SRI (increasing drought) was detected in the near future, while mid- and far-future periods showed non-significant trends. The mean annual SRI analysis conducted for historical and future periods under SSP2.45 climate scenario also showed this trend (Figure A5). Similarly, SSP5-8.5 projected a significant negative trend in the near future, with mid- and far-future trends remaining non-significant. The mean annual SSMI analysis for both the historical and future periods under the SSP5-8.5 climate scenario revealed a similar trend (Figure A6).
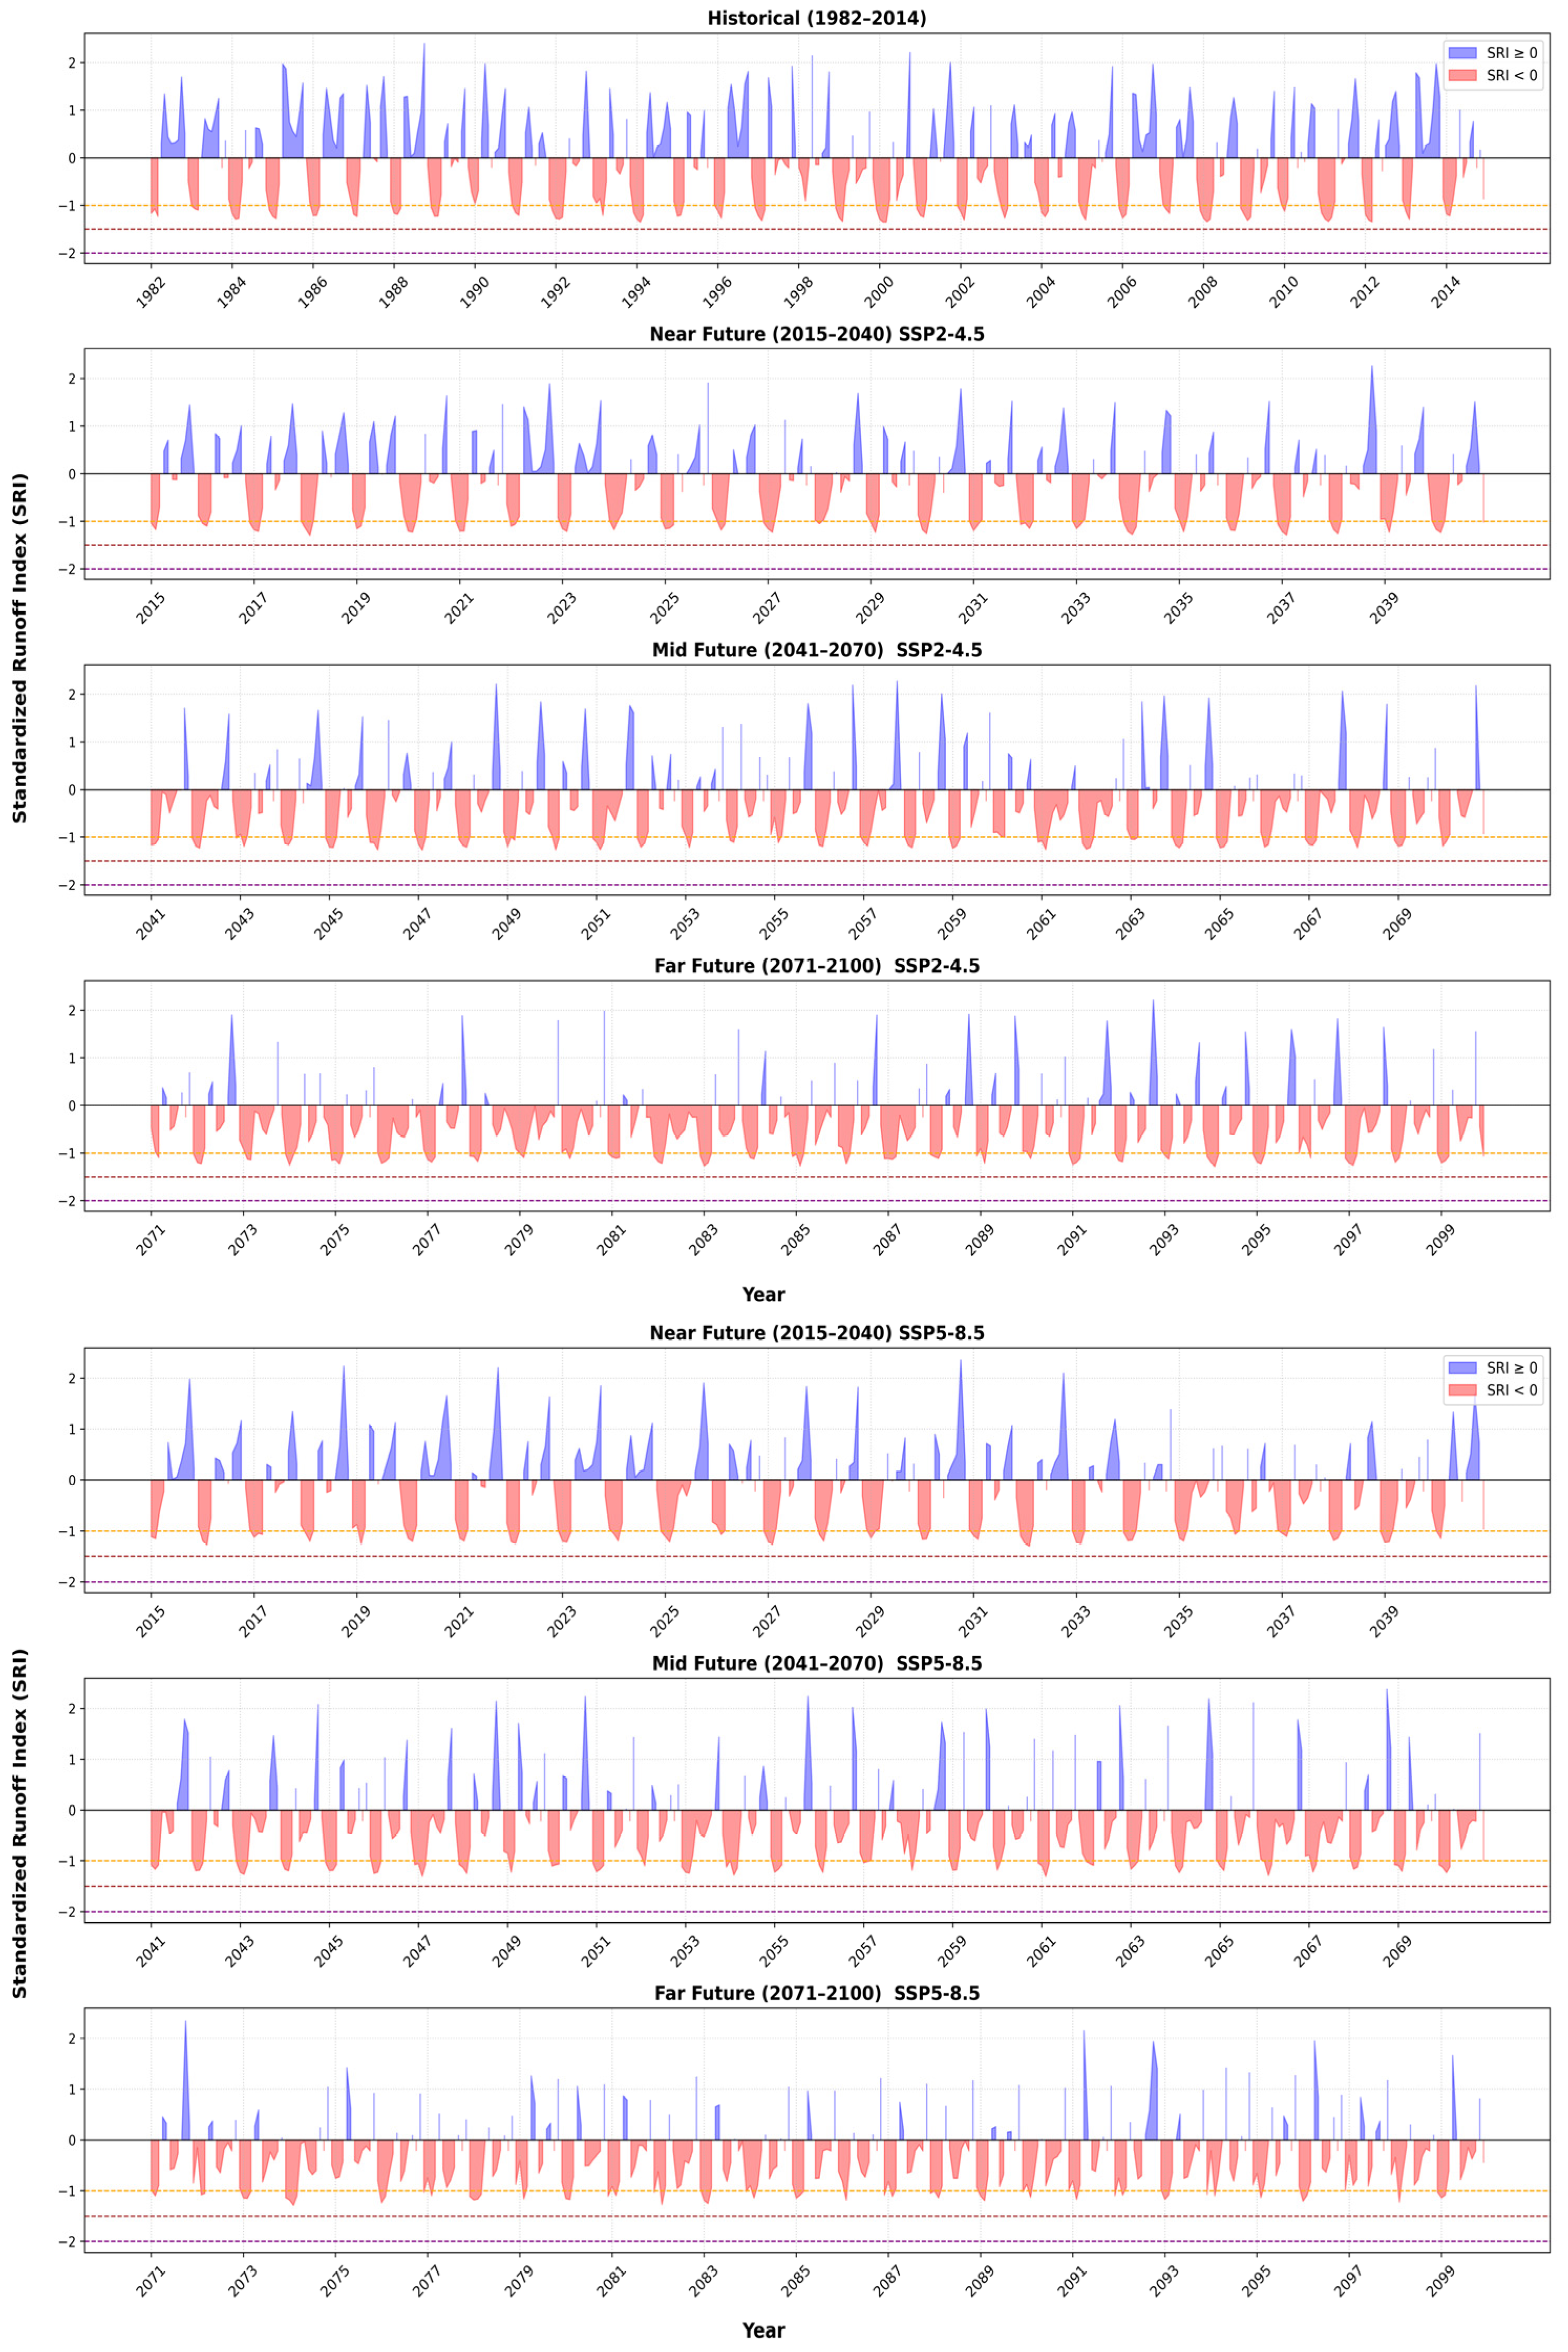
Temporal evolution of SRI is shown in Figure 8. During the baseline, frequent negative values were observed, including several moderate to severe drought episodes (SRI ≤ −1.5). Under SSP2-4.5, drought activity was reduced in the near future, intensified in the mid-future, and remained moderate in the far future. Under SSP5-8.5, strong negative SRI values appeared in the near future, followed by reduced activity in the mid-future and increased frequency and persistence in the far future.
Drought characteristics derived from event-based analysis are presented in Table 8, with further detailed statistics provided in Tables S4 and S5 of the Supplementary Materials. These values represent ensemble mean outcomes. The baseline period recorded 31 events with a mean duration of 2.8 months and severity of 3.4. Under SSP2-4.5, drought frequency decreased in the near future (26 events) but increased in the mid-future (35 events), followed by stabilization in the far future (26 events). Under SSP5-8.5, frequency was stable in the near future (31 events), declined in the mid-future (26 events), and rose to 36 events in the far future. Across both scenarios, average severity ranged between 2.4 and 3.4, with intensity values close to 1.1–1.2. Overall, SSP5-8.5 projected higher drought frequency in the far future compared to SSP2-4.5, while both scenarios showed significant near-future declines in runoff conditions.
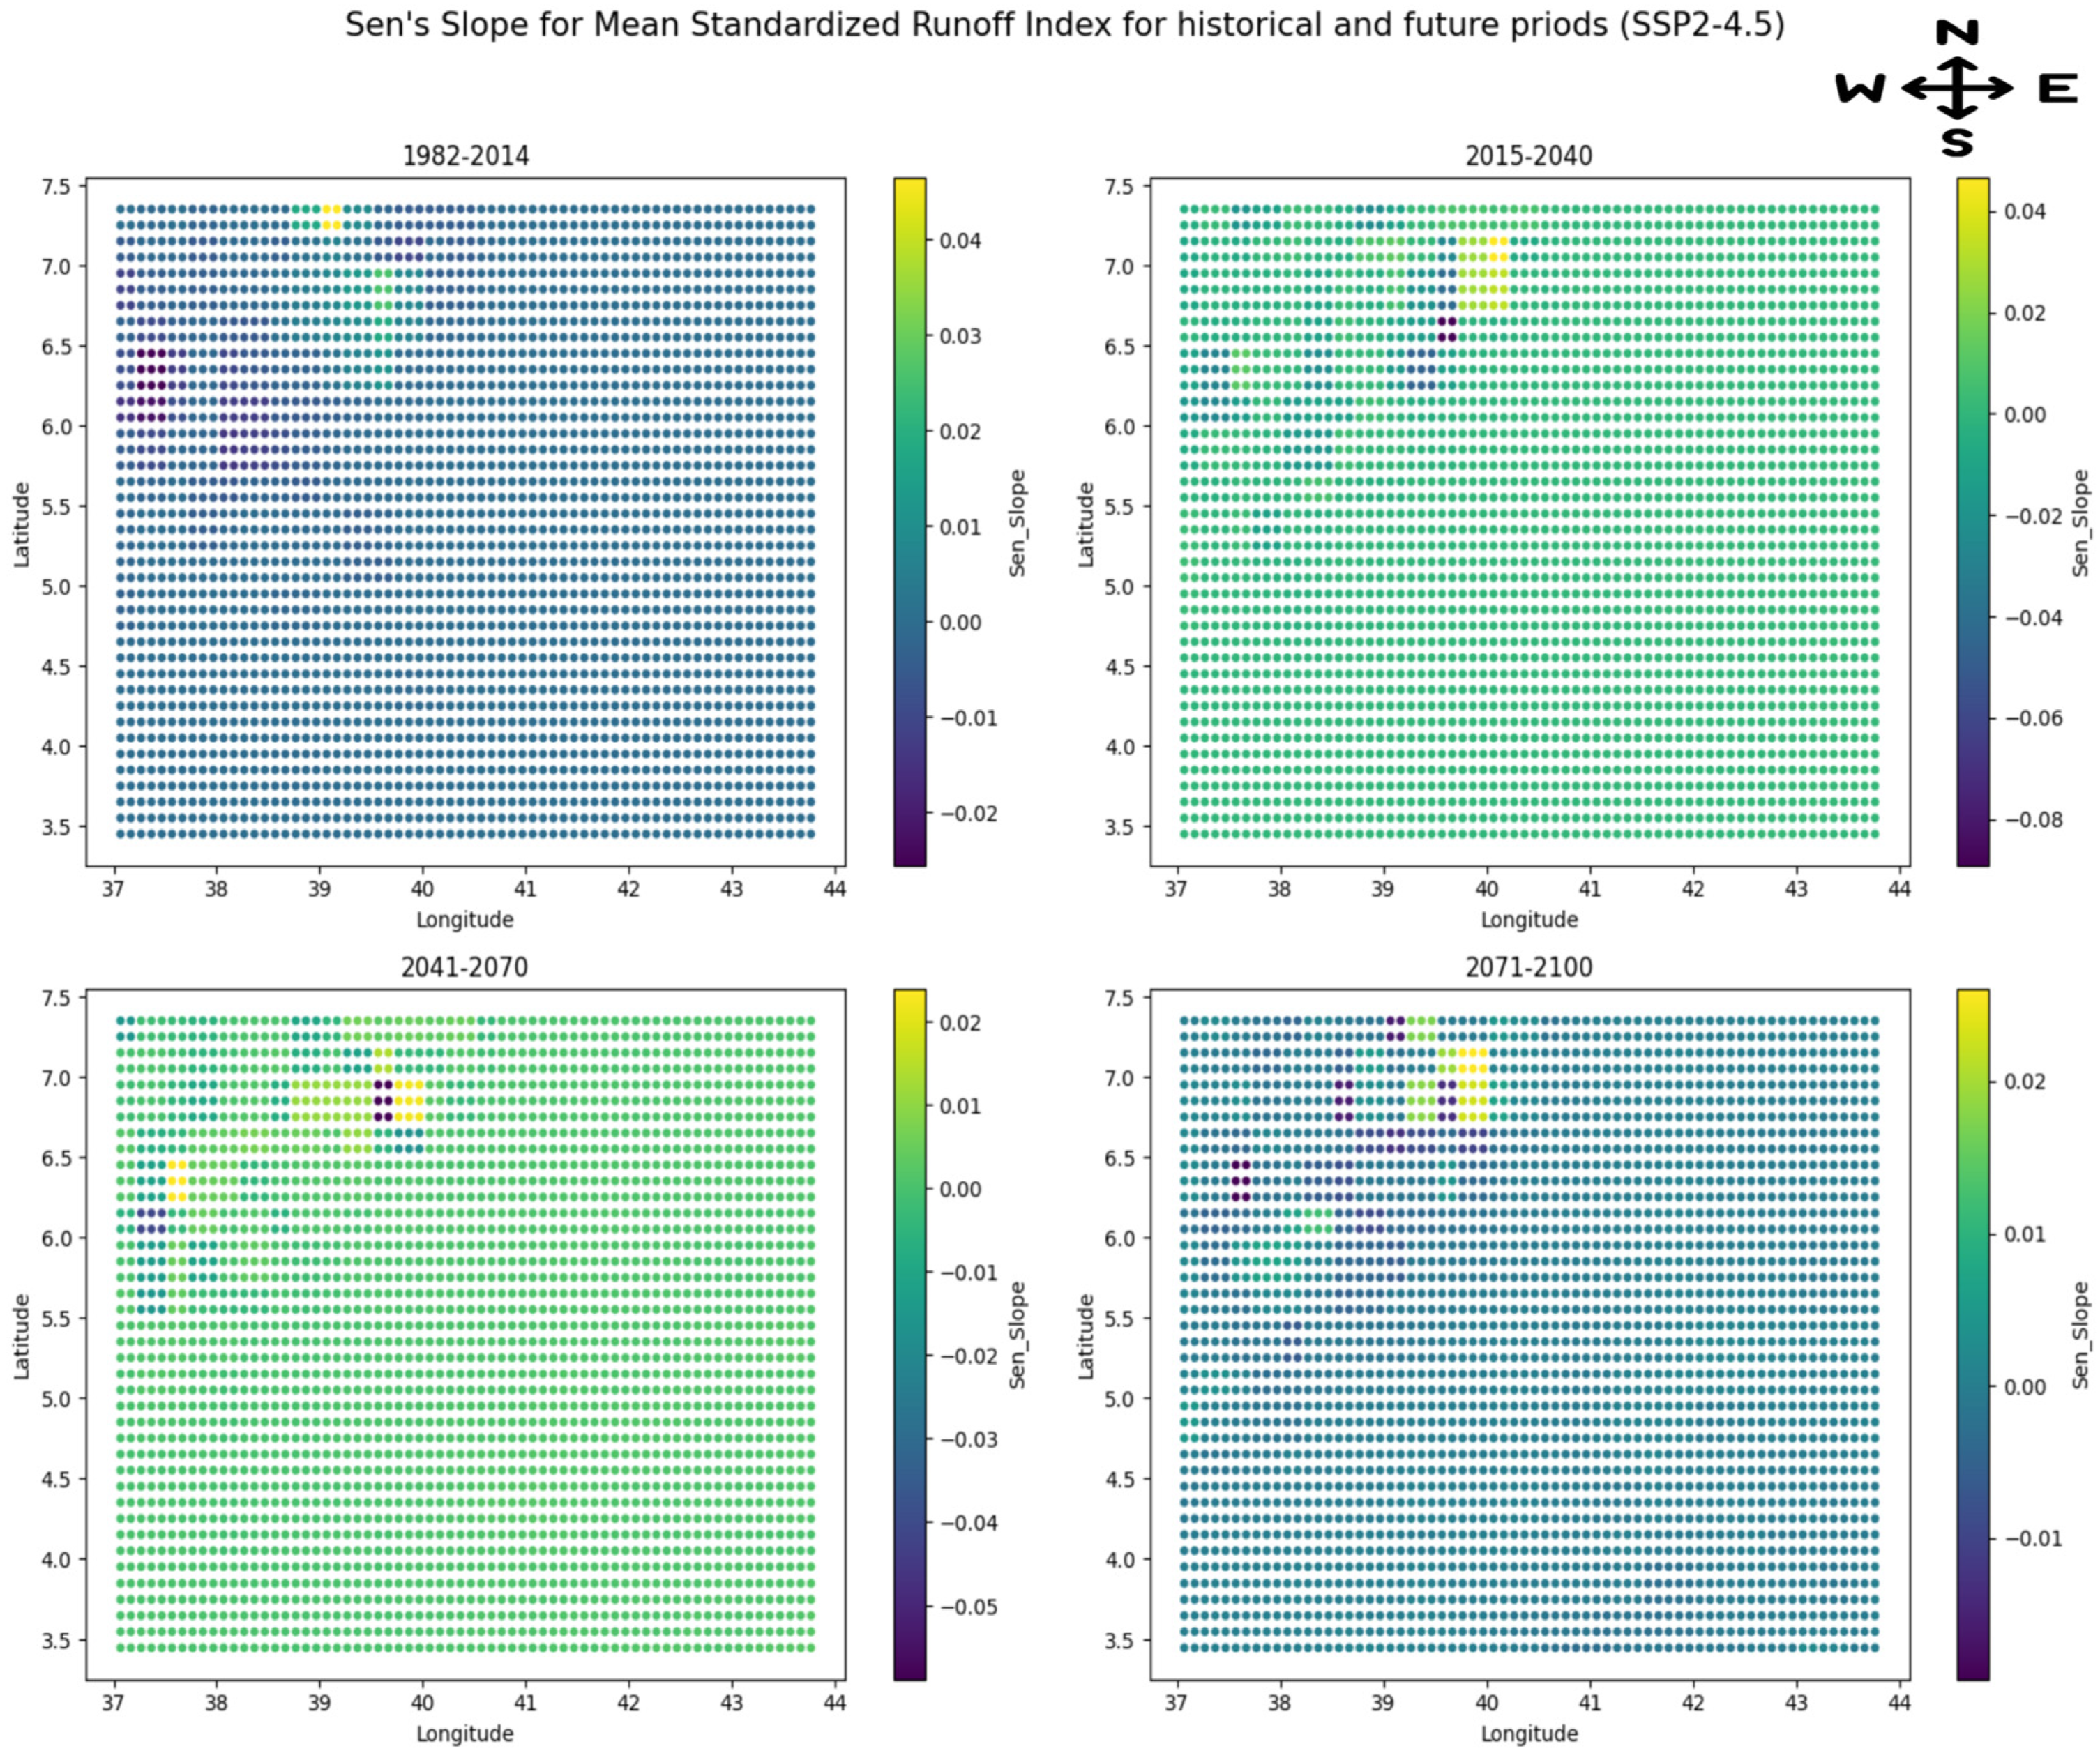
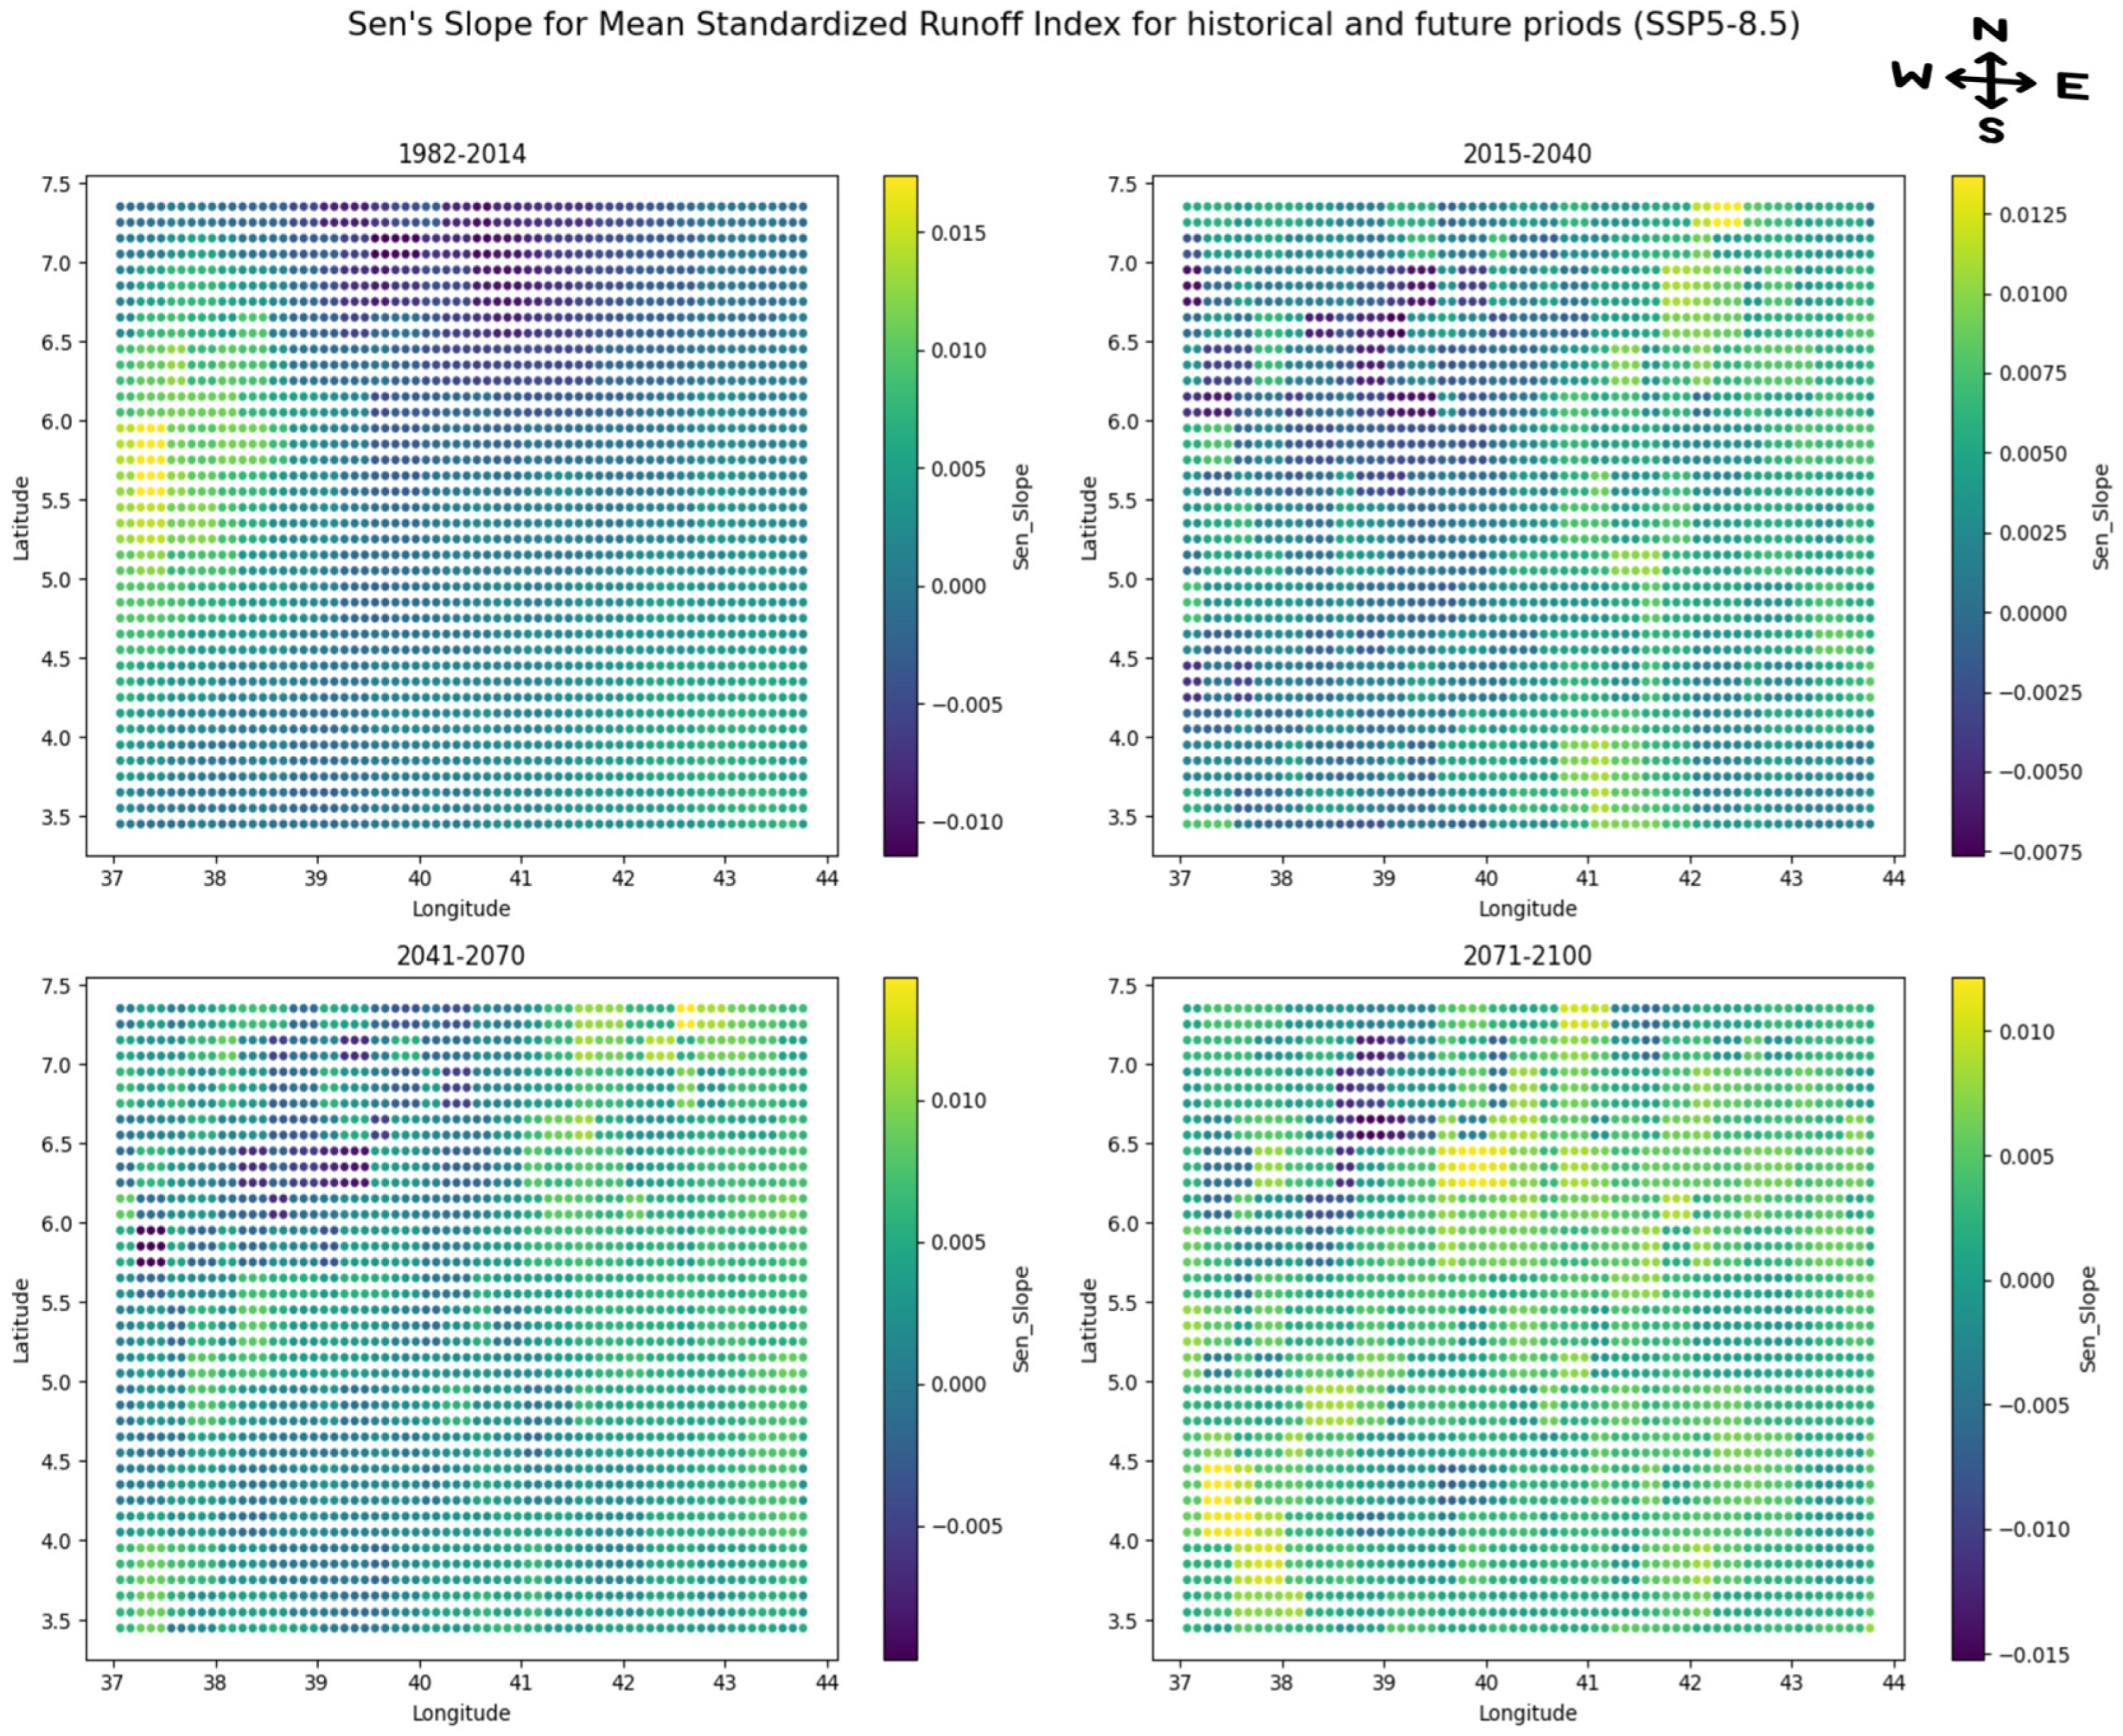
Trend analysis using the Sen’s slope estimator revealed distinct spatial patterns in the drought intensity calculated using mean annual SRI across historical and future periods under both emission scenarios (SSP2-4.5 and SSP5-8.5). Positive Sen’s slopes indicate increasing SRI values corresponding to wetter trends, while negative slopes denote decreasing SRI and increasing drought intensity.
Under the SSP2-4.5 pathway (Figure 9), the historical period showed largely neutral to slightly positive SRI trends across most grid cells, with localized increases in the north-central region and small pockets of decline in the west. During the near-future period, the spatial pattern remained mostly stable, though minor negative slopes appeared in the northern part, suggesting emerging dry tendencies.
In the mid-future period, the majority of the study area exhibited weakly positive Sen’s slopes, indicating a modest increase in runoff conditions. However, isolated patches of negative slopes persisted in some western and central locations. In the far-future period, mixed spatial behavior was observed, with small clusters of positive slopes in the north and a few negative cells scattered throughout the domain. Overall, the SSP2-4.5 scenario displayed a largely stable to slightly wetter trend over time, with no extensive spatial dominance of drying trends.
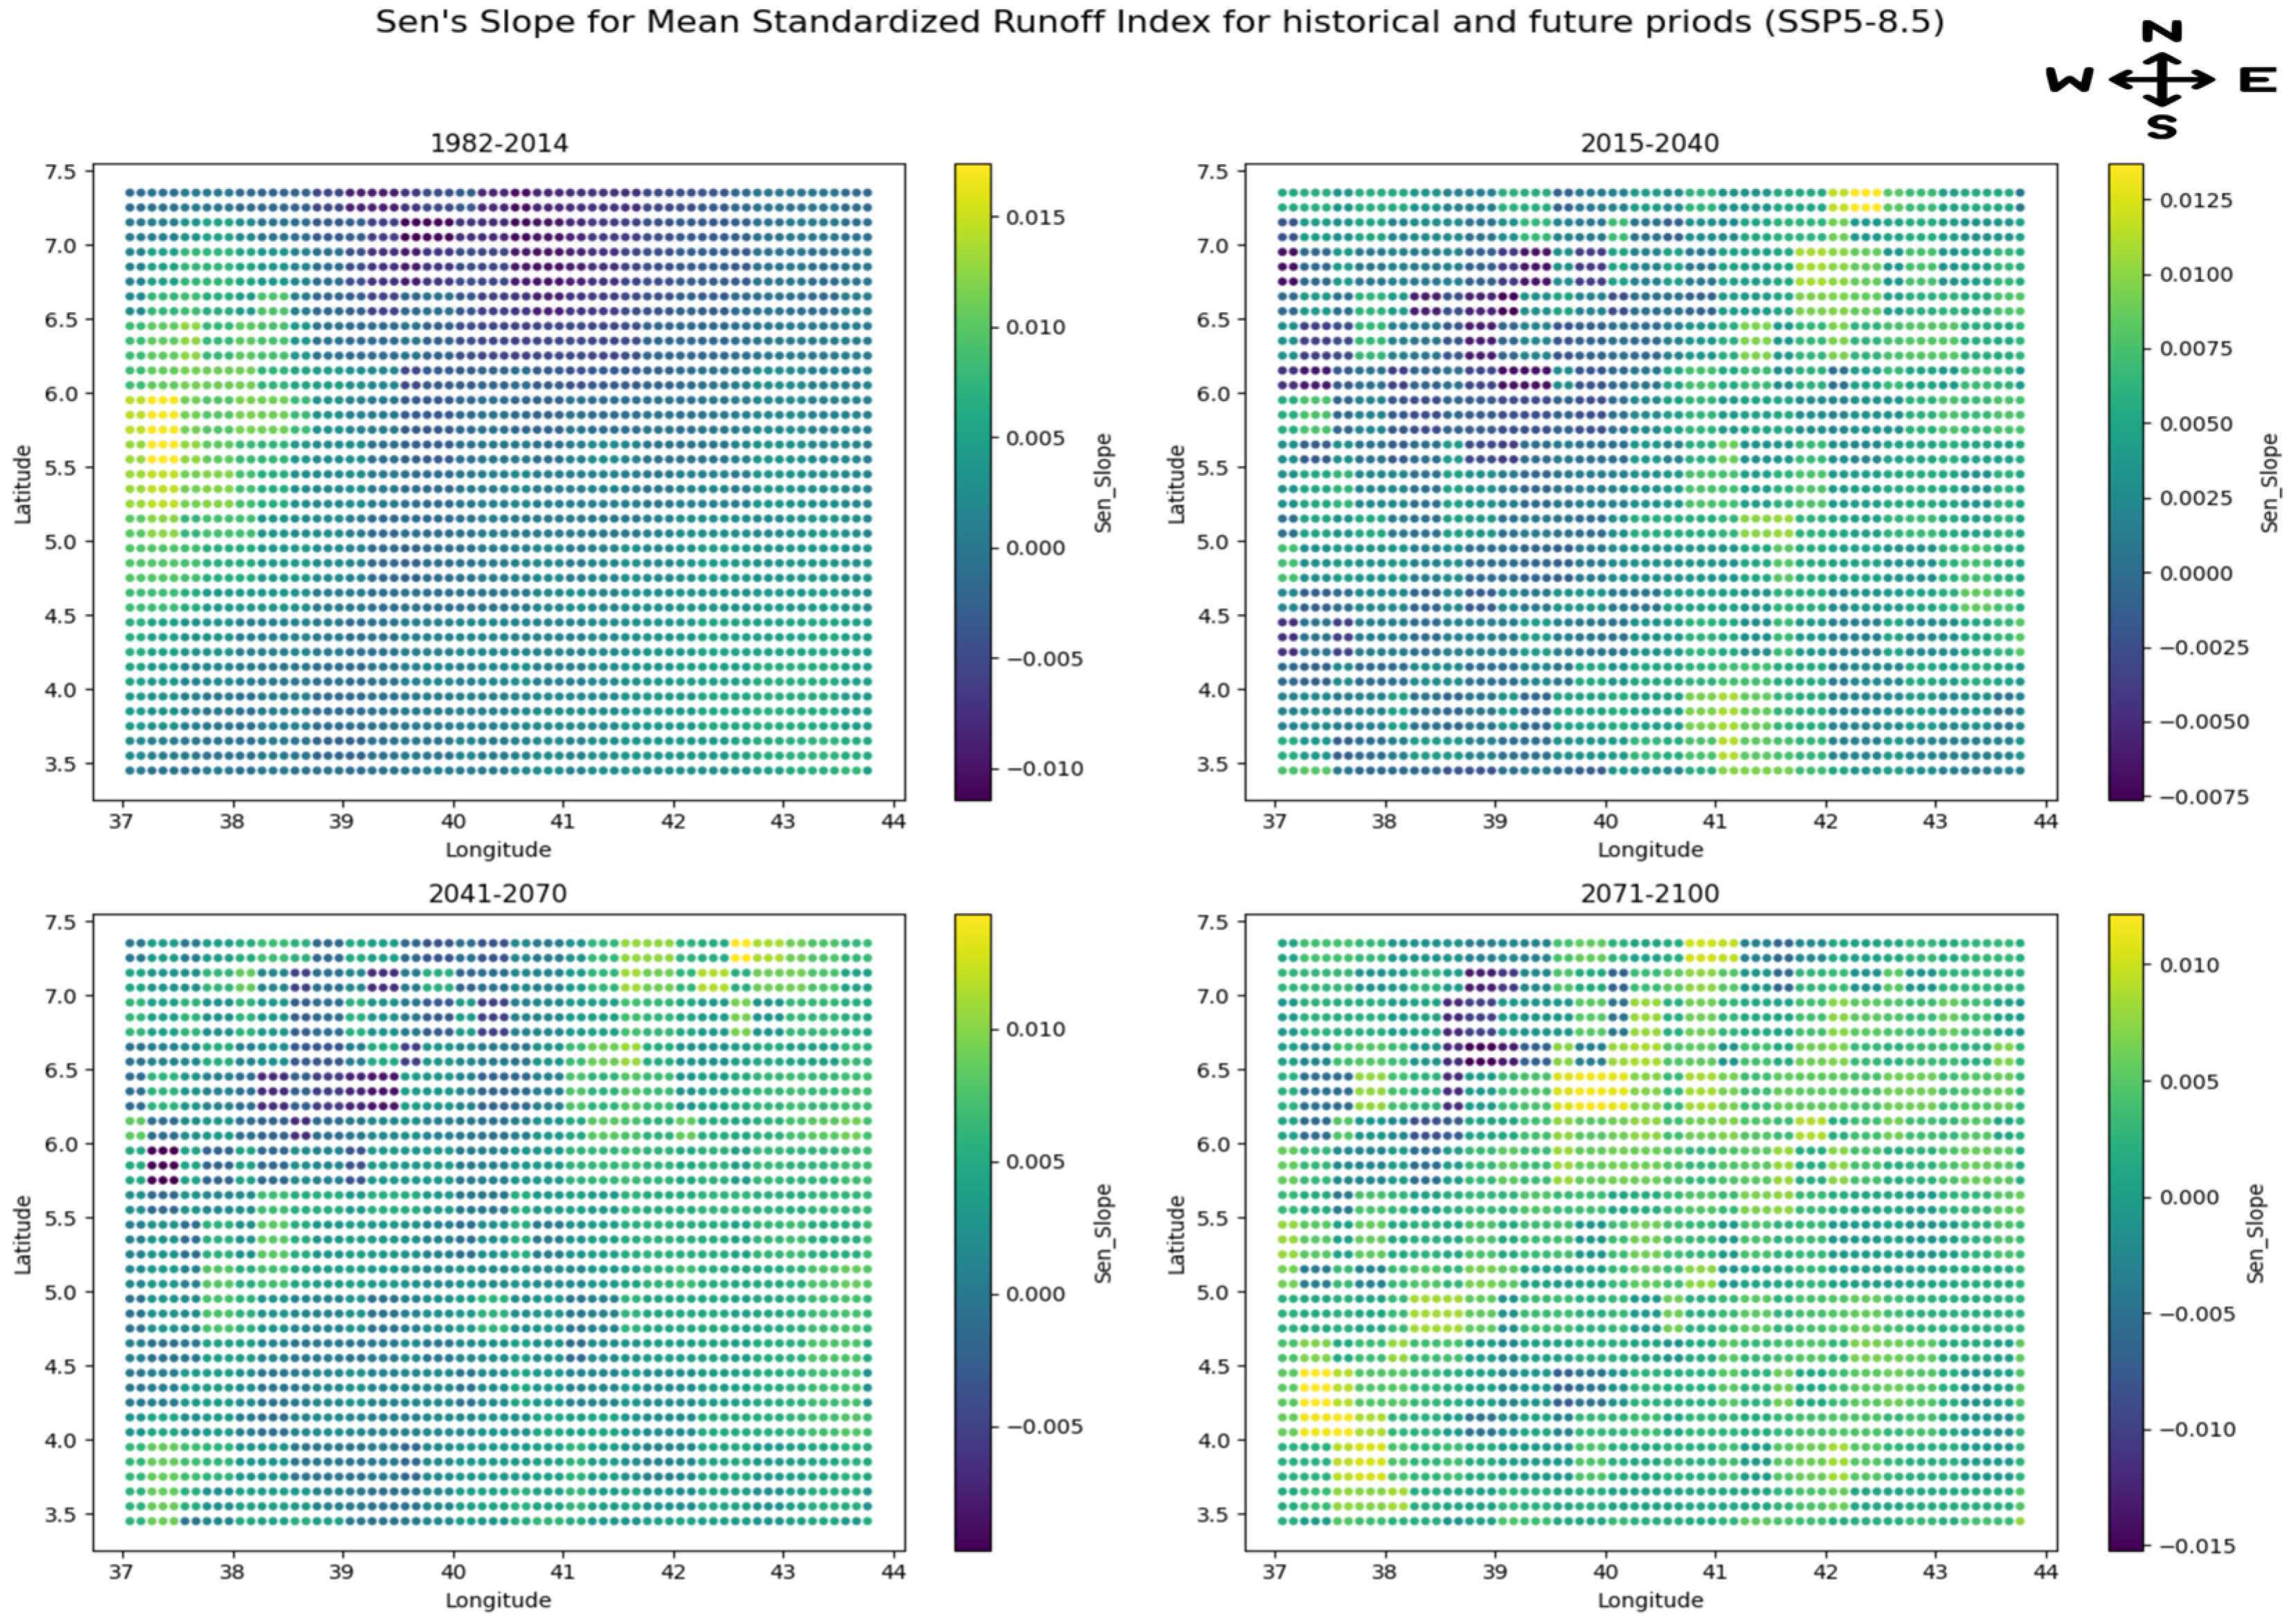
Spatial SRI trends under the SSP5-8.5 scenario (Figure 10) differed notably from SSP2-4.5. In the historical period, both positive and negative slopes were distributed across the area, with stronger positive values in the southwest and localized drying patterns in the north. During the near-future period, more negative Sen’s slopes appeared, particularly across northern and eastern sections, indicating increasing drought intensity.
In the mid-future period, the spatial distribution showed a mix of weak positive and negative slopes, with wetter conditions in parts of the southwest and drier conditions in northern zones. By the far-future period, the pattern became more spatially variable, with increasing positive slopes over central and southern areas, while some northern locations continued to show minor negative values. Overall, SSP5-8.5 presented stronger spatial variability and a tendency toward more pronounced changes, both wetting and drying, compared with SSP2-4.5.
Comparative assessment indicated that both scenarios showed mixed spatial patterns of runoff trends, though SSP2-4.5 exhibited relatively stable conditions, while SSP5-8.5 reflected greater spatial heterogeneity and stronger slope magnitudes. Across all periods, most areas displayed weak Sen’s slopes, suggesting that large-scale shifts in mean runoff were limited, but regional contrasts between wetting and drying zones became more evident in the high-emission scenario.
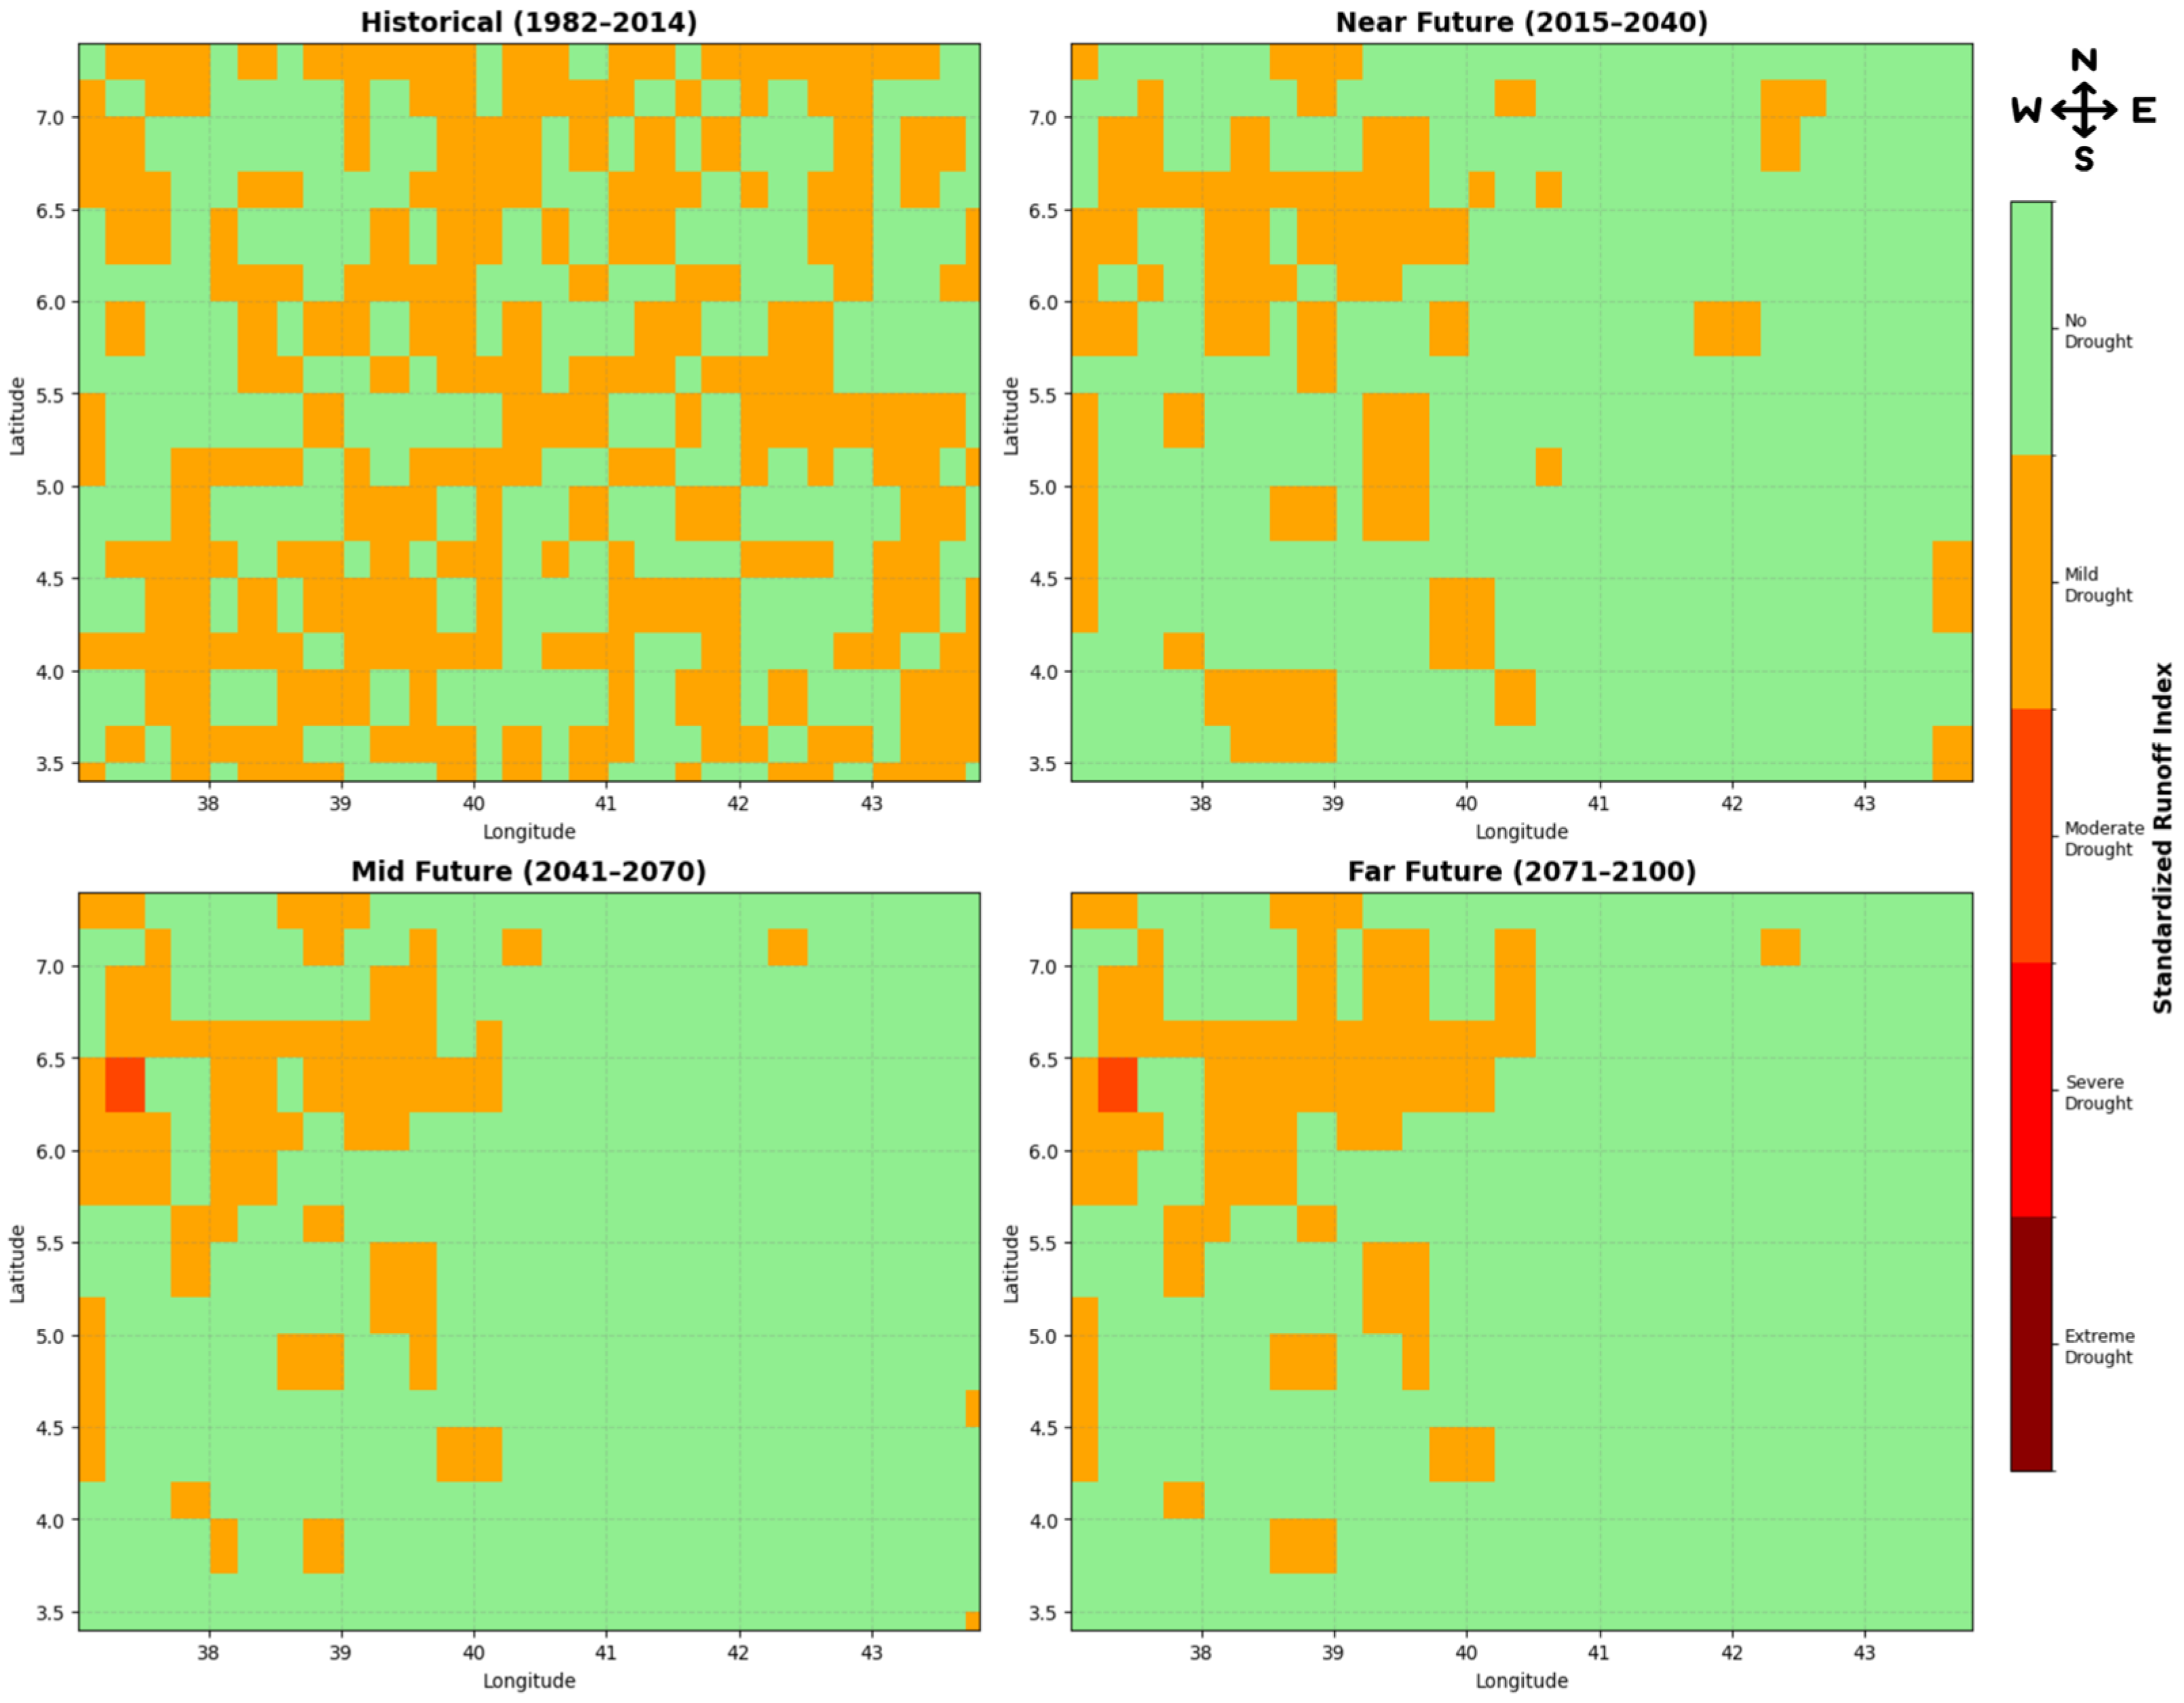
Figure 11 illustrates the spatial distribution of drought classes during the historical and projected future periods under SSP2-4.5. In the historical period, most of the area was drought-free, with widespread mild drought patches and localized moderate drought zones. In the near future, drought-free areas expanded, while mild drought was confined mainly to the northern and eastern sections, with few moderate drought patches. In the mid-future, no-drought conditions dominated the region, but mild drought appeared in scattered clusters, and small patches of moderate to severe drought emerged, particularly in the northwest. In the far future, drought-free areas again covered most of the region, although mild drought persisted across central and northern zones, with localized pockets of moderate and severe drought. Overall, SSP2-4.5 projected predominance of drought-free and mild drought conditions, with moderate to severe drought limited to specific localized areas.
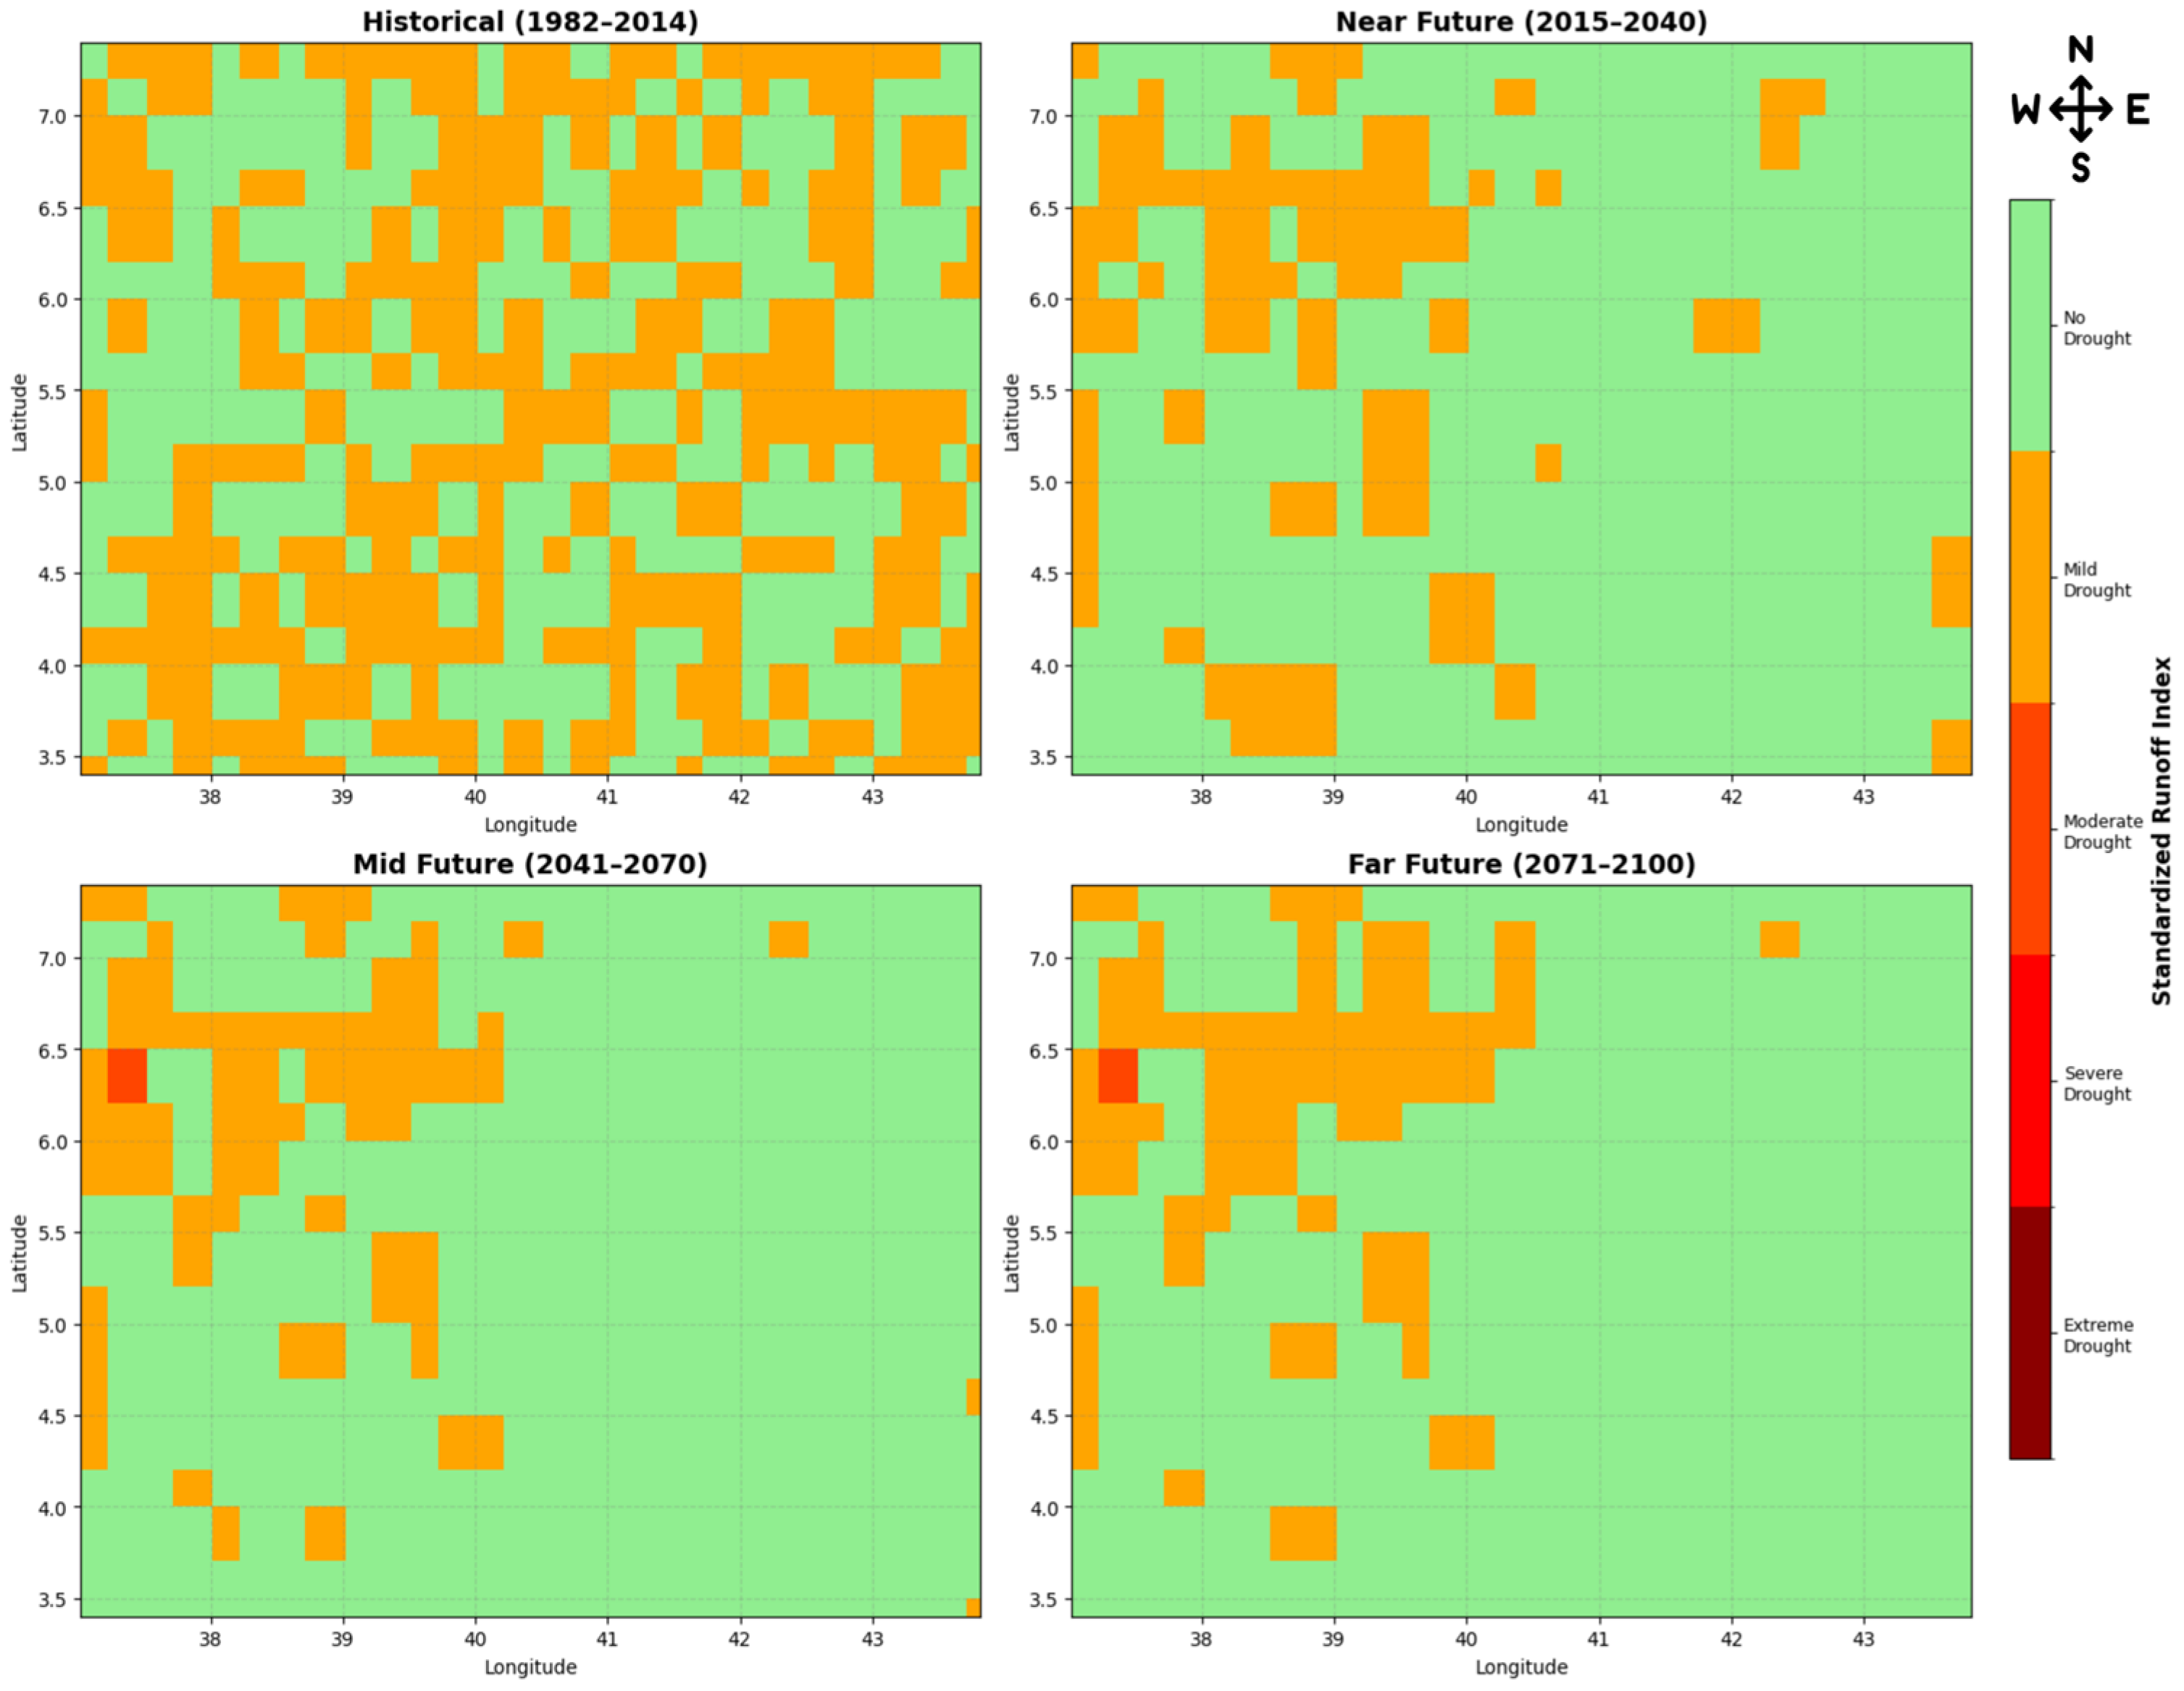
The spatial distribution of the SRI under the SSP5-8.5 scenario is shown in Figure 12 for the baseline and future periods. During the historical period, mild to moderate drought conditions were widespread across the study region, with scattered areas showing no drought. In the near future, drought occurrence decreased, and most grid cells showed no drought, although localized pockets of mild drought persisted mainly in the western and central areas. The mid-future period indicated fewer drought-affected cells compared to the historical period, with isolated patches of moderate drought observed in the northwest. By the far future, drought incidence remained generally low, with mild drought concentrated in the northern and central zones and most of the region showing no drought.

3.5. Comparative Assessment of Agricultural and Hydrological Droughts

The comparative assessment of agricultural and hydrological droughts showed clear differences in frequency, duration, severity, and intensity across the baseline and future scenarios (Figure 13). During the historical baseline, agricultural droughts occurred 34 times with a mean duration of 1.3 months and severity of 1.7, while hydrological droughts occurred 31 times with longer average duration (2.8 months) and higher severity (3.4).
Under SSP2-4.5, agricultural drought frequency decreased to zero in the near future but rose to 10–16 events in the mid- and far future, with durations of 1.0–1.2 months and severities between 1.0 and 1.4. Hydrological droughts under the same scenario ranged from 26 to 35 events, with durations of 2.1–2.7 months and severities of 2.4–3.0. Under SSP5-8.5, agricultural droughts increased sharply in the near future (33 events, severity 2.0), decreased in the mid-future (2 events, severity 1.1), and rose again in the far future (19 events, severity 1.3). In contrast, hydrological droughts remained consistently higher, with frequencies of 26–36 events across all periods, durations of 2.1–2.8 months, and severities of 2.4–3.4.
Across all scenarios, hydrological droughts were more persistent, with consistently longer durations and higher severities than agricultural droughts. Agricultural droughts, however, exhibited greater variability in frequency across time periods and scenarios.

4. Discussion

Our study quantified how climate change alters agricultural drought (SSMI) and hydrological drought (SRI) dynamics in the Ganale Dawa River Basin using bias-corrected CMIP6 projections and a Random Forest framework. Overall, agricultural droughts displayed high temporal variability and strong sensitivity to short-term climatic fluctuations. In contrast, hydrological droughts were more persistent and severe, with these patterns becoming more pronounced under the high-emission scenario (SSP5-8.5) in the far future.
Precipitation emerged as the dominant predictor of agricultural drought. In contrast, air temperature and evapotranspiration showed a stronger influence on hydrological drought. This indicates that soil moisture responds quickly to short-term rainfall events, leading to sudden shifts between non-drought and severe drought conditions. Meanwhile, catchment runoff and groundwater storage respond more slowly, integrating climatic effects over longer periods and causing prolonged water deficits when cumulative losses surpass recharge. Mechanistically, higher temperatures increase potential evapotranspiration, lowering baseflow and groundwater recharge even when short-term rainfall events occur; this process has been emphasized in recent machine-learning and hydrological studies across East Africa [24,26,53].
Under SSP2-4.5 the mid-future showed some transient improvements in agricultural drought indicators—likely reflecting moderate mitigation of warming and episodic rainfall recovery—whereas SSP5-8.5 produced marked increases in both drought frequency and intensity in the far future. This scenario dependence aligns with other Ethiopian and regional projections that find stronger drought intensification under high-emission pathways [48,54,55]. It also mirrors global findings that high-end warming amplifies evaporative demand and hence drought severity [14,56].
The Ganale Dawa Basin’s heterogeneous topography (highlands and lowlands) explains spatially divergent outcomes. Our basin-scale results (localized increases in agricultural drought variability vs. broader hydrological persistence) are consistent with studies that document elevation-dependent responses in Ethiopia: some mid-elevation areas may record increased precipitation or greening while lowlands dry [57,58,59]. This spatial heterogeneity cautions against basin-wide generalizations and supports targeted local adaptation measures rather than one-size-fits-all policies [12,60].
Our finding that agricultural droughts can act as an early indicator of stress while hydrological droughts reflect long-term water deficits agrees with integrated assessments in Ethiopia [52,55]. Similarly, the persistent hydrological deficits under high emission scenarios complement Wubneh et al. [54] identification of hotspots (e.g., Gumara and Ribb) and Seka et al. [48] evidence of declining total water storage in some East African basins. In contrast, studies that report increased future streamflow in some sub-watersheds (e.g., Gragn et al. [61]; Abdule et al. [62]; Mustefa Abdule et al. [63]) highlight how local rainfall increases can, in certain contexts, offset warming-driven losses—underscoring those results depend on the balance between projected precipitation change and temperature-driven potential evapotranspiration.
Differences among studies often reflect index choice and model setups. RDI (which incorporates temperature/PET) tends to show stronger warming-driven drought signals than precipitation-only indices such as SPI; this explains why RDI produced more severe outcomes in some catchments compared with SPI (as seen elsewhere in Ethiopia; Seka et al. [48]; Bayissa et al. [64]). Likewise, machine-learning methods (e.g., Random Forest, CatBoost) and remote sensing inputs can capture nonlinear relationships and local drivers that simpler empirical approaches miss [26,27]. However, ML models require careful calibration and local validation because algorithm choice and parameterization influence predictive reliability, particularly in heterogeneous terrains [24,27].
Reports from several studies underline the interaction between warming and seasonality of rainfall in determining the drought patterns. The increase of maximum and minimum temperatures intensifies evaporation and extends dry periods, worsening the insufficiency of the soil moisture even in the absence of a decrease in the mean precipitation [13,58,65]. Seasonal changes in the distribution of rainfall, including those in main-season precipitation or redistribution to short rains, change both the timing of runoff and the recharge process, leading to both increased interannual variability and increased low-flow intervals [12,59,66].
Diverse responses of agricultural and hydrological droughts necessitate two-fold, combined adaptation solutions. For agriculture, short-term adaptive measures—soil-water conservation, drought-tolerant crops, flexible planting calendars, and targeted early-warning systems—can reduce crop vulnerability to episodic droughts [27,55]. For basin-scale water security, investments in reservoir optimization, managed aquifer recharge, improved irrigation efficiency, and integrated basin planning are necessary to buffer chronic runoff deficits and ensure multi-sectoral water supply [48,53,60]. These recommendations are especially urgent under SSP5-8.5 where hydrological deficits are most severe.
We acknowledge key uncertainties. First, using ensemble means of the ten best-performing CMIP6 models reduces but does not eliminate structural model uncertainty; inter-model spread and internal variability can lead to locally different outcomes [24,48]. Second, SSMI and SRI capture biophysical drought dimensions but do not account for socio-economic vulnerability, water allocation policies, or land-use change—factors known to modulate impacts on livelihoods [9,27]. Third, excluding explicit teleconnection analyses (ENSO, IOD) limits our ability to attribute some interannual variability; previous work shows these drivers strongly modulate East African droughts [24,48]. Finally, machine learning-based projections can degrade with long lead times because of compounding uncertainties [27], so results should be viewed as ensemble-average tendencies rather than precise forecasts.
To strengthen future assessments, we recommend: (1) quantifying full inter-model spread and internal variability across more SSPs (including SSP1-2.6 and SSP3-7.0) to bound uncertainty [12,60]; (2) integrating groundwater observations (GRACE) and vegetation indices (NDVI, VHI) to link hydrological deficits to ecological and livelihood impacts [48,52]; (3) coupling physical process models with explainable machine learning frameworks to retain interpretability while improving local skill [26]; and (4) explicitly assessing teleconnection impacts (ENSO, IOD) to improve seasonal predictability [24,48].
In summary, our basin-scale analysis demonstrates that agricultural droughts in the Ganale Dawa Basin are sensitive, short-lived indicators of climatic variability, whereas hydrological droughts express longer-term, cumulative water stress—especially under high-emission trajectories (SSP5-8.5). These interconnected dynamics highlight the need for integrated monitoring and adaptive management strategies. Such approaches should connect early agricultural warning systems with long-term water resource planning to strengthen resilience across sectors and scales [27,53,55].

5. Conclusions

This study provides evidence-based insights that climate change will exacerbate drought conditions in the Ganale Dawa Basin, with agricultural droughts acting as sensitive, short-term indicators of stress and hydrological droughts representing a more persistent, cumulative threat to water security. These results highlight the urgent need for climate change mitigation to avoid the worst impacts under SSP5-8.5 and the necessity for integrated, dual-pathway adaptation planning that combines immediate agricultural responses with long-term water resource management to build resilience across the basin. To further strengthen preparedness, future research should focus on quantifying uncertainty using the full CMIP6 ensemble and more climate scenarios, integrating groundwater and vegetation data for a holistic water assessment, and combining process-based models with explainable AI to identify causal drought drivers.

Supplementary Materials

The following supporting information can be downloaded at: https://www.mdpi.com/article/10.3390/cli13110231/s1, Table S1: Lists of the 22 CMIP6 GCMs used in this study; Table S2: Detailed agricultural drought events by period for SSP2-4.5; Table S3: Detailed agricultural drought events by period for SSP5-8.5; Table S4: Detailed hydrological drought events by period for SSP2-4.5 and Table S5: Detailed hydrological drought events by period for SSP5-8.5.

Author Contributions

M.M.A. led the research design, gathered and analyzed the data, and drafted the manuscript. S.W.D., A.B., P.E.E. and Y.B. supported the development of the methodology, contributed to data analysis, and assisted in editing the manuscript. All authors have read and agreed to the published version of the manuscript.

Funding

This research was funded by NORAD through NORHED II program for MERIT project [grant number 60683, 2021].

Data Availability Statement

All the data used in this study are available via Zenodo at https://doi.org/10.5281/zenodo.17409434 [50]. The python code used to analyze the data is available via Zenodo at https://doi.org/10.5281/zenodo.17410178 [51].

Acknowledgments

The authors gratefully acknowledge Haramaya University, Makerere University, Norwegian University of Science and Technology and the MERIT project for their facility and financial support.

Conflicts of Interest

The authors declare no conflicts of interest.

Appendix A

Table A1. CMIP6 GCMs Model Performance Evaluation Metrics for Precipitation Projection.
No.Model NameBias (Mean)MAERMSECorrelation
1ACCESS-CM26.96065238.8657463.189390.567041
2ACCESS-ESM1-512.43462144.09539177.53480.056342
3CanESM51.76243737.3808861.179160.554218
4CMCC-CM2-SR54.77892537.9301360.705620.587652
5CMCC-ESM23.50303437.1129958.987530.609402
6CNRM-CM6-16.66056137.7705561.416670.598365
7CNRM-ESM2-113.14390340.50308107.47470.194299
8EC-Earth37.30851638.5179961.648380.588715
9EC-Earth3-Veg-LR8.61180941.9328369.91070.548529
10FGOALS-g37.39574931.835149.174640.694103
11GFDL-CM464.28242577.0667123.30050.628898
12GFDL-ESM47.10960735.7122856.552720.629033
13GISS-E2-1-G5.1270932.3105351.042950.670756
14HadGEM3-GC31-LL6.31309736.1787258.616080.623518
15INM-CM4-88.29483136.0158157.658710.620639
16INM-CM5-09.1948234.9675755.705580.646184
17KACE-1-0-G−6.74753235.3580858.275350.592231
18MIROC-ES2L5.64556934.7606954.56160.636779
19MPI-ESM1-2-HR5.68460539.0064762.390780.561792
20MPI-ESM1-2-LR8.54498739.6335372.19860.40411
21MRI-ESM2-09.47075640.0716464.743320.570024
22NorESM2-MM6.30419341.1126468.220920.529574
Table A2. CMIP6 GCMs Model Performance Evaluation Metrics for Mean Temperature Projection.
No.Model NameBias (Mean)MAERMSECorrelation
1ACCESS-CM2−2.2893282.4163532.6418310.930905
2ACCESS-ESM1-5−2.2346972.3671542.5909150.931507
3CanESM51.3976781.9337082.2876320.903075
4CMCC-CM2-SR5−2.3134242.4925362.7500740.921308
5CMCC-ESM2−2.3672832.4784122.7219610.928545
6CNRM-CM6-1−2.4253682.5220072.7547180.930787
7CNRM-ESM2-1−2.2215062.3255282.5215170.937738
8EC-Earth3−2.1750692.3570722.6354490.921956
9EC-Earth3-Veg-LR−2.35742.499822.7701190.92263
10FGOALS-g3−2.3975622.4862352.6935740.934719
11GFDL-CM4−2.4430922.5563292.7952240.927497
12GFDL-ESM4−2.4084462.5251562.7683320.927666
13GISS-E2-1-G−2.3235462.4263772.6356760.934761
14HadGEM3-GC31-LL−2.1775752.314132.538360.932567
15INM-CM4-8−2.33972.4246342.6021860.9395
16INM-CM5-0−2.4338672.5069372.6962710.938043
17KACE-1-0-G−2.2670252.3597432.5577470.937759
18MIROC-ES2L−2.4851612.5731022.7839080.932989
19MPI-ESM1-2-HR−2.302712.4430562.7004250.925888
20MPI-ESM1-2-LR−2.2824522.4207132.6576770.928723
21MRI-ESM2-0−2.5104342.5943342.814830.931516
22NorESM2-MM−2.4611882.5737032.8297930.925662
Table A3. Model performance metrics (RMSE, R2, and MAE) for predicting drought indices (SSMI and SRI).
ModelVariableRMSER2MAE
Random ForestSSMI0.01570.95130.0098
SRI0.02550.83360.0064
XGBoostSSMI0.03120.80780.0224
SRI0.03270.72670.01
LightGBMSSMI0.03320.78170.0241
SRI0.03560.67580.011
CatBoostSSMI0.03110.80960.0223
SRI0.03270.72540.0101
MLPSSMI0.04740.55680.0364
SRI0.05260.29270.0197
LSTMSSMI0.05740.75280.0384
SRI0.04760.7170.021
Note: Among the tested models, Random Forest outperformed others in both SSMI and SRI predictions, achieving the highest R2 (0.9513 and 0.8336) and the lowest RMSE.
Figure A1. Scatter plots of the actual values vs. predicted values of soil moisture for training and testing periods.
Climate 13 00231 g0a1
Figure A2. Scatter plots of the actual values vs. predicted values of runoff_sum for training and testing periods.
Climate 13 00231 g0a2
Figure A3. Projected mean annual standardized soil moisture index under SSP2-4.5 Scenarios (1982–2100).
Climate 13 00231 g0a3
Figure A4. Projected mean annual standardized soil moisture index under SSP5-8.5 Scenarios (1982–2100).
Climate 13 00231 g0a4
Figure A5. Projected mean annual standardized runoff index under SSP2-4.5 Scenarios (1982–2100).
Climate 13 00231 g0a5
Figure A6. Projected mean annual standardized runoff index under SSP5-8.5 Scenarios (1982–2100).
Climate 13 00231 g0a6

References

  1. Rahman, G.; Jung, M.-K.; Kim, T.-W.; Kwon, H.H. Drought impact, vulnerability, risk assessment, management and mitigation under climate change: A comprehensive review. KSCE J. Civ. Eng. 2025, 29, 100120. [Google Scholar] [CrossRef]
  2. IPCC. Summary for Policymakers. In Climate Change 2021: The Physical Science Basis; Contribution of Working Group I to the Sixth Assessment Report of the IPCC; Masson-Delmotte, V., Zhai, P., Pirani, A., Connors, S.L., Péan, C., Berger, S., Caud, N., Chen, Y., Goldfarb, L., Gomis, M.I., et al., Eds.; IPCC: Geneva, Switzerland, 2021. [Google Scholar] [CrossRef]
  3. Guha-Sapir, D.; Below, R.; Hoyois, P. EM-DAT: The Emergency Events Database. Université Catholique de Louvain (UCL), Centre for Research on the Epidemiology of Disasters (CRED). 2021. Available online: https://www.emdat.be/ (accessed on 12 December 2023).
  4. World Meteorological Organization (WMO). State of the Climate in Africa 2020; WMO-No. 1275; World Meteorological Organization (WMO): Geneva, Switzerland, 2021. Available online: https://library.wmo.int/index.php?lvl=notice_display&id=21930 (accessed on 12 December 2023).
  5. Lombe, P.; Carvalho, E.; Rosa-Santos, P. Drought dynamics in Sub-Saharan Africa: Impacts and adaptation strategies. Sustainability 2024, 16, 9902. [Google Scholar] [CrossRef]
  6. Gu, L.; Schumacher, D.L.; Fischer, E.M.; Slater, L.J.; Yin, J.; Sippel, S.; Chen, J.; Liu, P.; Knutti, R. Flash drought impacts on global ecosystems amplified by extreme heat. Nat. Geosci. 2025, 18, 709–715. [Google Scholar] [CrossRef]
  7. UN Water. The United Nations World Water Development Report 2021: Valuing Water. UNESCO. 2021. Available online: https://unesdoc.unesco.org/ark:/48223/pf0000375724 (accessed on 12 December 2023).
  8. Xu, F.; Qu, Y.; Bento, V.A.; Song, H.; Qiu, J.; Qi, J.; Wan, L.; Zhang, R.; Miao, L.; Zhang, X.; et al. Understanding climate change impacts on drought in China over the 21st century: A multi-model assessment from CMIP6. NPJ Clim. Atmos. Sci. 2024, 7, 32. [Google Scholar] [CrossRef]
  9. Fanta, S.S.; Yesuf, M.B.; Merkos, M.T.; Demissie, T.A. The spatio-temporal trend of climate and characterization of drought in Borana Zone, Ethiopia. Sci. Rep. 2025, 15, 4743. [Google Scholar] [CrossRef]
  10. Wang, L.; Wang, W.J.; Du, H.; Shen, X.; Wu, Z.; Ma, S.; Liu, Z.; Jiang, M. Was warming amplified under drought conditions across China in observations and future projections? Earths Future 2022, 10, e2021EF002614. [Google Scholar] [CrossRef]
  11. Gebrechorkos, S.H.; Taye, M.T.; Birhanu, B.; Solomon, D.; Demissie, T. Future changes in climate and hydroclimate extremes in East Africa. Earths Future 2023, 11, e2022EF003011. [Google Scholar] [CrossRef]
  12. Ayugi, B.; Dike, V.; Ngoma, H.; Babaousmail, H.; Mumo, R.; Ongoma, V. Future changes in precipitation extremes over East Africa based on CMIP6 models. Water 2021, 13, 2358. [Google Scholar] [CrossRef]
  13. Gebrechorkos, S.H.; Hülsmann, S.; Bernhofer, C. Analysis of climate variability and droughts in East Africa using high-resolution climate data products. Glob. Planet Change 2020, 186, 103130. [Google Scholar] [CrossRef]
  14. Jiang, J.; Zhou, T.; Qian, Y.; Li, C.; Song, F.; Li, H.; Chen, X.; Zhang, W.; Chen, Z. Precipitation regime changes in High Mountain Asia driven by cleaner air. Nature 2023, 623, 544–549. [Google Scholar] [CrossRef]
  15. Dinku, T.; Funk, C.; Peterson, P.; Maidment, R.; Tadesse, T.; Gadain, H.; Ceccato, P. Validation of the CHIRPS satellite rainfall estimates over eastern Africa. Q. J. R. Meteorol. Soc. 2018, 144, 292–312. [Google Scholar] [CrossRef]
  16. Eyring, V.; Bony, S.; Meehl, G.A.; Senior, C.A.; Stevens, B.; Stouffer, R.J.; Taylor, K.E. Overview of the coupled model intercomparison project phase 6 (CMIP6) experimental design and organization. Geosci. Model Dev. 2016, 9, 1937–1958. [Google Scholar] [CrossRef]
  17. Behzadi, F.; Javadi, S.; Yousefi, H.; Hashemy Shahdany, S.M.; Moridi, A.; Neshat, A.; Golmohammadi, G.; Maghsoudi, R. Projections of meteorological drought severity-duration variations based on CMIP6. Sci. Rep. 2024, 14, 5027. [Google Scholar] [CrossRef]
  18. Ukkola, A.M.; De Kauwe, M.G.; Roderick, M.L.; Abramowitz, G.; Pitman, A.J. Robust future changes in meteorological drought in CMIP6 projections despite uncertainty in precipitation. Geophys. Res. Lett. 2020, 47, e2020GL087820. [Google Scholar] [CrossRef]
  19. Su, B.; Huang, J.; Mondal, S.K.; Zhai, J.; Wang, Y.; Wen, S.; Gao, M.; Lv, Y.; Jiang, S.; Jiang, T.; et al. Insight from CMIP6 SSP-RCP scenarios for future drought characteristics in China. Atmos. Res. 2021, 250, 105375. [Google Scholar] [CrossRef]
  20. Almazroui, M.; Saeed, F.; Saeed, S.; Islam, M.N.; Ismail, M.; Klutse, N.A.B.; Siddiqui, M.H. Projected change in temperature and precipitation over Africa from CMIP6. Earth Syst. Environ. 2020, 4, 455–475. [Google Scholar] [CrossRef]
  21. Li, S.Y.; Miao, L.J.; Jiang, Z.H.; Wang, G.J.; Gnyawali, K.R.; Zhang, J.; Zhang, H.; Fang, K.; He, Y.; Li, C. Projected drought conditions in Northwest China with CMIP6 models under combined SSPs and RCPs for 2015–2099. Adv. Clim. Change Res. 2020, 11, 210–217. [Google Scholar] [CrossRef]
  22. Supharatid, S.; Nafung, J. Projected drought conditions by CMIP6 multi model ensemble over Southeast Asia. J. Water Clim. Change 2021, 12, 3330–3354. [Google Scholar] [CrossRef]
  23. Moges, D.M.; Kmoch, A.; Uuemaa, E. Application of satellite and reanalysis precipitation products for hydrological modeling in the data-scarce Porijõgi catchment, Estonia. J. Hydrol. Reg. Stud. 2022, 41, 101070. [Google Scholar] [CrossRef]
  24. Mengistu, A.G.; Tesfuhuney, W.A.; Woyessa, Y.E.; Ejigu, A.A.; Alemu, M.D. Contrasting hydro-climatic trends and drought dynamics in Ethiopia and South Africa under climate change. Clim. Dyn. 2025, 63, 105. [Google Scholar] [CrossRef]
  25. Prodhan, F.A.; Zhang, J.; Hasan, S.S.; Sharma, T.P.P.; Mohana, H.P. A review of machine learning methods for drought hazard monitoring and forecasting: Current research trends, challenges, and future research directions. Environ. Model. Softw. 2022, 149, 105327. [Google Scholar] [CrossRef]
  26. Melese, T.; Assefa, G.; Terefe, B.; Belay, T.; Bayable, G.; Senamew, A. Machine learning-based drought prediction using Palmer Drought Severity Index and TerraClimate data in Ethiopia. PLoS ONE 2025, 20, e0326174. [Google Scholar] [CrossRef]
  27. Bojer, A.K.; Biru, B.H.; Al-Quraishi, A.; Debelee, T.G.; Negera, W.G.; Woldesillasie, F.F.; Esubalew, S.Z. Machine learning and remote sensing-based time series analysis for drought risk prediction in Borena Zone, Southwest Ethiopia. J. Arid Environ. 2024, 222, 105160. [Google Scholar] [CrossRef]
  28. Farr, T.G.; Rosen, P.A.; Caro, E.; Crippen, R.; Duren, R.; Hensley, S.; Kobrick, M.; Paller, M.; Rodriguez, E.; Roth, L.; et al. The Shuttle Radar Topography Mission. Rev. Geophys. 2007, 45, RG2004. [Google Scholar] [CrossRef]
  29. Funk, C.; Peterson, P.; Landsfeld, M.; Pedreros, D.; Verdin, J.; Shukla, S.; Husak, G.; Rowland, J.; Harrison, L.; Hoell, A.; et al. The climate hazards infrared precipitation with stations—A new environmental record for monitoring extremes. Sci. Data 2015, 2, 150066. [Google Scholar] [CrossRef] [PubMed]
  30. Verdin, A.; Funk, C.; Peterson, P.; Landsfeld, M.; Tuholske, C.; Grace, K. Development and validation of the CHIRTS-daily quasi-global high-resolution daily temperature data set. Sci. Data 2020, 7, 303. [Google Scholar] [CrossRef] [PubMed]
  31. Abatzoglou, J.T.; Dobrowski, S.; Parks, S.A.; Hegewisch, K.C. TerraClimate, a high-resolution global dataset of monthly climate and climatic water balance from 1958–2015. Sci. Data 2018, 5, 170191. [Google Scholar] [CrossRef] [PubMed]
  32. Hengl, T. Soil Texture Classes (USDA System) for 6 Soil Depths (0, 10, 30, 60, 100 and 200 cm) at 250 m, version 0.2; Zenodo: Geneva, Switzerland, 2018. [Google Scholar]
  33. Zanaga, D.; Van De Kerchove, R.; Daems, D.; De Keersmaecker, W.; Brockmann, C.; Kirches, G.; Wevers, J.; Cartus, O.; Santoro, M.; Fritz, S.; et al. ESA WorldCover 10 m 2021, version 200; International Institute for Applied Systems Analysis (IIASA): Laxenburg, Austria, 2022. [Google Scholar]
  34. McNally, A.; Arsenault, K.; Kumar, S.; Shukla, S.; Peterson, P.; Wang, S.; Funk, C.; Peters-Lidard, C.D.; Verdin, J.P. A land data assimilation system for sub-Saharan Africa food and water security applications. Sci. Data 2017, 4, 170012. [Google Scholar] [CrossRef]
  35. Muñoz Sabater, J. ERA5-Land Hourly Data from 1981 to Present; Copernicus Climate Change Service (C3S): Bonn, Germany; CDS: Des Moines, IA, USA, 2019. [Google Scholar] [CrossRef]
  36. Ahmed, J.S.; Buizza, R.; Dell’acqua, M.; Demissie, T.; Pè, M.E. Evaluation of ERA5 and CHIRPS rainfall estimates against observations across Ethiopia. Meteorol. Atmos. Phys. 2024, 136, 17. [Google Scholar] [CrossRef]
  37. Berhanu, D.; Alamirew, T.; Taye, M.T.; Tibebe, D.; Gebrehiwot, S.; Zeleke, G. Evaluation of CMIP6 models in reproducing observed rainfall over Ethiopia. J. Water Clim. Change 2023, 14, 2583–2605. [Google Scholar] [CrossRef]
  38. Thrasher, B.; Wang, W.; Michaelis, A.; Melton, F.; Lee, T.; Nemani, R. NASA Global Daily Downscaled Projections, CMIP6. Sci. Data 2022, 9, 262. [Google Scholar] [CrossRef]
  39. Lei, X.; Xu, C.; Liu, F.; Song, L.; Cao, L.; Suo, N. Evaluation of CMIP6 Models and Multi-Model Ensemble for Extreme Precipitation Over Arid Central Asia. Remote Sens. 2023, 15, 2376. [Google Scholar] [CrossRef]
  40. Samuel, S.; Mengistu Tsidu, G.; Dosio, A.; Mphale, K. Assessment of historical and future mean and extreme precipitation over Sub-Saharan Africa using NE-GDDP-CMIP6: Part I—Evaluation of historical simulation. Int. J. Climatol. 2025, 45, e8672. [Google Scholar] [CrossRef]
  41. Abdullahi, M. CMIP6 Model Performance Evaluation Against CHIRPS and CHIRTS Data (1982–2014), version 1; Zenodo: Geneva, Switzerland, 2025. [Google Scholar] [CrossRef]
  42. Hao, Z.; Hao, F.; Singh, V.P.; Xia, Y.; Ouyang, W.; Shen, X. A theoretical drought classification method for the multivariate drought index based on distribution properties of standardized drought indices. Adv. Water Resour. 2016, 92, 240–247. [Google Scholar] [CrossRef]
  43. Hao, Z.; AghaKouchak, A. Multivariate Standardized Drought Index: A parametric multi-index model. Adv. Water Resour. 2013, 57, 12–18. [Google Scholar] [CrossRef]
  44. Yuan, M.; Gan, G.; Bu, J.; Su, Y.; Ma, H.; Liu, X.; Zhang, Y.; Gao, Y. A new multivariate composite drought index considering the lag time and the cumulative effects of drought. J. Hydrol. 2025, 642, 132757. [Google Scholar] [CrossRef]
  45. Adeyeri, O.E.; Zhou, W.; Wang, X.; Zhang, R.; Laux, P.; Ishola, K.A.; Usman, M. The trend and spatial spread of multisectoral climate extremes in CMIP6 models. Sci. Rep. 2022, 12, 21000. [Google Scholar] [CrossRef]
  46. Abdullahi, M. Python Scripts for Multicollinearity Assessment and VIF Calculation in Drought Modeling, version 1; Zenodo: Geneva, Switzerland, 2025. [Google Scholar] [CrossRef]
  47. Mohammed, S.; Arshad, S.; Alsilibe, F.; Moazzam, M.F.U.; Bashir, B.; Prodhan, F.A.; Alsalman, A.; Vad, A.; Ratonyi, T.; Harsányi, E. Utilizing machine learning and CMIP6 projections for short-term agricultural drought monitoring in central Europe (1900–2100). J. Hydrol. 2024, 633, 130968. [Google Scholar] [CrossRef]
  48. Seka, A.M.; Guo, H.; Zhang, J.; Han, J.; Bayable, E.; Ayele, G.T.; Workneh, H.T.; Bayouli, O.T.; Muhirwa, F.; Reda, K.W. Evaluating the future total water storage change and hydrological drought under climate change over lake basins, East Africa. J. Clean. Prod. 2024, 447, 141552. [Google Scholar] [CrossRef]
  49. Abdullahi, M. Workflows for Machine Learning Evaluation of Agricultural and Hydrological Drought Indicators (SSMI and SRI) in Ethiopia, version 1; Zenodo: Geneva, Switzerland, 2025. [Google Scholar] [CrossRef]
  50. Abdullahi, M. Random Forest Model for Agricultural and Hydrological Drought Analysis in Ethiopia (1982–2100), version 1; Zenodo: Geneva, Switzerland, 2025. [Google Scholar] [CrossRef]
  51. Gumus, V.; Avsaroglu, Y.; Simsek, O. Streamflow trends in the Tigris river basin using Mann−Kendall and innovative trend analysis methods. J. Earth Syst. Sci. 2022, 131, 34. [Google Scholar] [CrossRef]
  52. Tenagashaw, D.Y.; Andualem, T.G. Analysis and characterization of hydrological drought under future climate change using the SWAT model in Tana sub-basin, Ethiopia. Water Conserv. Sci. Eng. 2022, 7, 131–142. [Google Scholar] [CrossRef]
  53. Dogiso, D.; Muluneh, A.; Ketema, A. Spatiotemporal analysis of CMIP6-based climate extremes and their implications for sustainable watershed management in the Gidabo watershed, Ethiopia. Sci. Rep. 2025, 15, 28104. [Google Scholar] [CrossRef]
  54. Wubneh, M.A.; Alemu, M.G.; Fekadie, F.T.; Worku, T.A.; Demamu, M.T.; Aman, T.F. Meteorological and hydrological drought monitoring and trend analysis for selected gauged watersheds in the Lake Tana basin, Ethiopia: Under future climate change impact scenario. Sci. Afr. 2023, 20, e01738. [Google Scholar] [CrossRef]
  55. Amognehegn, A.E.; Nigussie, A.B.; Adamu, A.Y.; Mulu, G.F. Analysis of future meteorological, hydrological, and agricultural drought characterization under climate change in Kessie watershed, Ethiopia. Geocarto Int. 2023, 38, 2247377. [Google Scholar] [CrossRef]
  56. Pokhrel, Y.; Felfelani, F.; Satoh, Y.; Boulange, J.; Burek, P.; Gädeke, A.; Gerten, D.; Gosling, S.N.; Grillakis, M.; Gudmundsson, L.; et al. Global terrestrial water storage and drought severity under climate change. Nat. Clim. Change 2021, 11, 226–233. [Google Scholar] [CrossRef]
  57. Bulti, A.; Abegaz, F. Impacts of Climate Change on Temperature and Rainfall on Dawa Sub-watershed, Genale Dawa River Basin, Southern Ethiopia. Int. J. Atmos. Ocean Sci. 2024, 8, 1–23. [Google Scholar] [CrossRef]
  58. Tesfaye, Y.; Dechassa, N.; Alemayehu, Y.; Birhan, D.A. Spatiotemporal variability and trends in extreme rainfall and temperature indices in Southeastern Oromia, Ethiopia. Sci. Rep. 2025, 15, 29782. [Google Scholar] [CrossRef]
  59. Mekuria, E.T.; Demissie, T.A.; Feyessa, F.F. Investigation of the spatial and temporal long-term hydro-climatic trends in Upper Omo Gibe Basin, Ethiopia. Heliyon 2025, 11, e42265. [Google Scholar] [CrossRef]
  60. Belay, T.; Melese, T.; Terefe, B.; Wassie, S.B.; Nigussie, T.Z. Meteorological drought under historical and future climate scenarios in North Gojjam sub-basin, Abay River basin of Ethiopia. PLoS ONE 2025, 20, e0328105. [Google Scholar] [CrossRef] [PubMed]
  61. Gragn, T.; Kebede, A.; Berhanu, S. Evaluation of climate change impacts on the water resources of Awata River Watershed, Genale Dawa Basin: Southern Ethiopia. Acad. Res. J. Agric. Sci. Res. 2019, 7, 414–422. [Google Scholar]
  62. Abdule, A.M.; Muluneh, A.; Woldemichael, A. Modeling climate change projection and its impact on the streamflow in the Yadot watershed, Genale Dawa basin, Ethiopia. J. Water Clim. Change 2024, 15, 3487–3505. [Google Scholar] [CrossRef]
  63. Abdule, A.M.; Muluneh, A.; Woldemichael, A. Impact of climate and land use/cover changes on streamflow in Yadot Watershed, Genale Dawa Basin, Ethiopia. Air Soil Water Res. 2023, 16, 11786221231200106. [Google Scholar] [CrossRef]
  64. Bayissa, Y.; Maskey, S.; Tadesse, T.; Van Andel, S.J.; Moges, S.A.; Van Griensven, A.; Solomatine, D. Comparison of the performance of six drought indices in characterizing historical drought for the upper Blue Nile basin, Ethiopia. Geosciences 2018, 8, 81. [Google Scholar] [CrossRef]
  65. Bogale, G.A.; Kassa, A.K.; Maja, M.M. Changes in climate extreme indices and agricultural drought monitoring in the semi-arid areas of Borana zone, southern Ethiopia. Heliyon 2025, 11, e42041. [Google Scholar] [CrossRef]
  66. Samavati, A.; Babamiri, O.; Rezai, Y.; Heidarimozaffar, M. Investigating the effects of climate change on future hydrological drought in mountainous basins using SWAT model based on CMIP5 model. Stoch. Environ. Res. Risk Assess. 2023, 37, 849–875. [Google Scholar] [CrossRef]
Figure 1. Location of study areas, (a) Location of the Ganale Dawa River Basin in Ethiopia, and (b) Ganale Dawa River Basin.
Climate 13 00231 g001
Figure 2. Correlation matrix for drought predictor variables: mean_pr is mean precipitation, mean_tas is average air temperature, mean_tasmax is maximum temperature, mean_tasmin is minimum temperature, mean_rlds is longwave radiation, mean_sfcwind is wind speed, mean_rsds is downward shortwave and longwave radiation, mean_hu is humidity.
Climate 13 00231 g002
Figure 3. Temporal evolution of agricultural drought events (SSMI) based on historical (1982–2014) and SSPs (2015–2100).
Climate 13 00231 g003
Figure 4. Spatial patterns of the Standardized Soil Moisture Index (SSMI) in the Ganale Dawa River Basin, Ethiopia, for historical and future periods under SSP2−4.5 Scenario. Positive Sen’s slope values indicate increasing SSMI, corresponding to decreasing drought severity (wetter trends). Negative Sen’s slope values represent decreasing SSMI, indicating increasing drought severity (drier trends).
Climate 13 00231 g004
Figure 5. Spatial patterns of the Standardized Soil Moisture Index (SSMI) in the Ganale Dawa River Basin, Ethiopia, for historical and future periods under SSP5-8.5 Scenario. Positive Sen’s slope values indicate increasing SSMI, corresponding to decreasing drought severity (wetter trends). Negative Sen’s slope values represent decreasing SSMI, indicating increasing drought severity (drier trends).
Climate 13 00231 g005
Figure 6. Spatial distribution of the mean standardized soil moisture index (SSMI) under SSP2-4.5 scenario for the period 1982–2100. Drought categories were classified according to standardized index thresholds: >0 (no drought), 0 to −1 (mild drought), −1 to −1.5 (moderate drought), −1.5 to −2 (severe drought), and <−2 (extreme drought).
Climate 13 00231 g006
Figure 7. Spatial distribution of the mean standardized soil moisture index (SSMI) under SSP5-8.5 scenario for the period 1982–2100. Drought categories were classified according to standardized index thresholds: >0 (no drought), 0 to −1 (mild drought), −1 to −1.5 (moderate drought), −1.5 to −2 (severe drought), and <−2 (extreme drought).
Climate 13 00231 g007
Figure 8. Temporal evolution of hydrological drought events (SRI) based on historical (1901–2020) and SSPs (2021–2100).
Climate 13 00231 g008
Figure 9. Spatial patterns of the Standardized Runoff Index (SRI) in the Ganale Dawa River Basin, Ethiopia, for historical and future periods under SSP2−4.5 Scenario. Positive Sen’s slope values indicate increasing SRI, corresponding to decreasing drought severity (wetter trends). Negative Sen’s slope values represent decreasing SRI, indicating increasing drought severity (drier trends).
Climate 13 00231 g009
Figure 10. Spatial patterns of the Standardized Runoff Index (SRI) in the Ganale Dawa River Basin, Ethiopia, for historical and future periods under SSP5-8.5 Scenario. Positive Sen’s slope values indicate increasing SRI, corresponding to decreasing drought severity (wetter trends). Negative Sen’s slope values represent decreasing SSMI, indicating increasing drought severity (drier trends).
Climate 13 00231 g010
Figure 11. Spatial distribution of the mean standardized runoff index (SRI) under the SSP2-4.5 scenario for the period 1982–2100. Drought categories were classified according to standardized index thresholds: >0 (no drought), 0 to −1 (mild drought), −1 to −1.5 (moderate drought), −1.5 to −2 (severe drought), and <−2 (extreme drought).
Climate 13 00231 g011
Figure 12. Spatial distribution of mean standardized runoff index (SRI) under SSP5-8.5 scenario for the period 1982–2100. Drought categories were classified according to standardized index thresholds: >0 (no drought), 0 to −1 (mild drought), −1 to −1.5 (moderate drought), −1.5 to −2 (severe drought), and <−2 (extreme drought).
Climate 13 00231 g012
Figure 13. Agricultural and hydrological drought characteristics across historical and future scenarios (SSP2-4.5 and SSP5-8.5).
Climate 13 00231 g013
Table 1. Reanalysis, remote sensing and climate data products data used in this study.
DatasetSpatial ResolutionYearSource
FLDAS0.1° (10 × 10 km)1982–2014NASA’s GES DISC
ERA5-Land0.1° (10 × 10 km)1982–2014ECMWF (via CSR-University of Texas, Austin)
CHIRPS0.05° (5 × 5 km)1982–2014Climate Hazards Center
CHIRTS0.05° (5 × 5 km)1982–2014Climate Hazards Center
CMIP6 0.27° (30 × 30 km)1982–2100NASA NCCS-NEX-GDDP CMIP6
Table 2. Variance Inflation Factor (VIF) values for predictor variables.
VariableVIF
Intercept8500.63
Precipitation (mean_pr)2.12
Mean temperature (mean_tas) 1.58
Wind speed (mean_sfcWind)1.56
Downward shortwave radiation (mean_rsds)1.45
Relative humidity (mean_hurs)2.81
Table 3. Random Forest performance evaluation for training and testing datasets.
VariablePeriodRMSER2MAE
SSMITraining0.01000.9690.0074
SSMITesting0.01410.9500.0094
SRITraining0.02240.8750.0050
SRITesting0.02650.8140.0064
Table 4. Feature importance for agricultural and hydrological drought.
Predictor VariableImportance Score
Agricultural DroughtHydrological Drought
Precipitation (mm)0.6020.186
Relative humidity (%)0.1500.139
Air temperature (°C)0.0980.411
Surface wind speed (m/s)0.0810.148
Shortwave radiation (W/m2)0.070.115
Table 5. Mann–Kendall trend and Sen’s slope analysis of historical (His, 1982–2014) and projected near future (NF, 2015–2040), middle future (MF, 2041–2070), and far future (FF, 2071–2100) agricultural droughts (SSMI) under the SSP2-4.5 and SSP5-8.5 scenario.
ScenarioPeriodKendall_TauSen_Slopep_Value
HisBaseline0.03410.00240.7922
SSP245NF0.10770.00390.4536
SSP245MF0.25980.00760.0457
SSP245FF0.2315270.0060630.081072
SSP585NF0.1938460.0060880.171758
SSP585MF0.3241380.0147310.012499
SSP585FF0.2315270.0080720.081072
Note: SSP245 representing intermediate mitigation with moderate climate action, and SSP585 reflecting a high-emissions, business-as-usual pathway. Trend analysis uses Sen’s Slope (Tau), where positive values indicate increasing drought, negative values show decreasing trends, and near-zero values suggest stable conditions. A p > 0.05, showing no significant trends at the 95% confidence level in either scenario.
Table 6. Agricultural drought characteristic analysis across climate scenarios and periods.
ScenarioPeriodFrequencyDurationSeverityIntensity
HisBaseline341.32351.70931.2625
SSP245NF0000
SSP245MF1011.1171.117
SSP245FF161.18751.40521.2034
SSP585NF331.48482.00711.2799
SSP585MF211.06931.0693
SSP585FF191.10531.28411.1722
Table 7. Mann–Kendall trend and Sen’s slope analysis of historical (His, 1982–2014) and projected near future (NF, 2015–2040), middle future (MF, 2041–2070), and far future (FF, 2071–2100) hydrological droughts (SRI) under the SSP2-4.5 and SSP5-8.5 scenario.
ScenarioPeriodKendall_TauSen_Slopep_Value
HisBaseline−0.13258−0.005370.285018
SSP245NF−0.49538−0.01090.000421
SSP245MF−0.18621−0.002820.153498
SSP245FF0.1871920.005560.15947
SSP585NF−0.40308−0.006830.004165
SSP585MF−0.14943−0.00350.253526
SSP585FF0.1527090.0034960.252523
Note: SSP245 representing intermediate mitigation with moderate climate action, and SSP585 reflecting a high-emissions, business-as-usual pathway. Trend analysis uses Sen’s Slope (Tau), where positive values indicate increasing drought, negative values show decreasing trends, and near-zero values suggest stable conditions. A p > 0.05, indicating no statistically significant trends at the 95% confidence level for any metric in either scenario.
Table 8. Hydrological drought characteristic analysis across climate scenarios and periods.
ScenarioPeriodFrequencyDurationSeverityIntensity
HisBaseline312.83873.39241.1909
SSP245NF262.11542.43751.1551
SSP245MF352.54292.8781.1308
SSP245FF262.69233.02661.1239
SSP585NF312.83873.39241.1909
SSP585MF262.11542.42881.1478
SSP585FF362.55562.88921.1304
Disclaimer/Publisher’s Note: The statements, opinions and data contained in all publications are solely those of the individual author(s) and contributor(s) and not of MDPI and/or the editor(s). MDPI and/or the editor(s) disclaim responsibility for any injury to people or property resulting from any ideas, methods, instructions or products referred to in the content.